Embed Size (px)
Citation preview

UNITED STATES SECURITIES AND EXCHANGE COMMISSION
Washington, D.C. 20549
FORM 18-K For Foreign Governments and Political Subdivisions Thereof
ANNUAL REPORT
of
HYDRO-QUÉBEC QUÉBEC, CANADA
(Name of Registrant)
Date of end of last fiscal year: December 31, 2016
SECURITIES REGISTERED* (As of the close of the fiscal year)
Title of Issue
Amounts as to Which Registration is Effective
Names of Exchanges on Which Registered
N/A N/A N/A
Name and address of persons authorized to receive notices
and communications from the Securities and Exchange Commission:
JEAN-CLAUDE LAUZON Québec Government Office
One Rockefeller Plaza, Suite 2600 New York, NY 10020-2102
Copies to:
ROBERT E. BUCKHOLZ
Sullivan & Cromwell LLP 125 Broad Street
New York, NY 10004-2498
JEAN-HUGUES LAFLEUR Vice-President, Financing, Treasury and Pension Fund
Hydro-Québec 75 René-Lévesque Boulevard West
5th Floor Montréal, Québec, Canada H2Z 1A4
*The Registrant is filing this annual report on a voluntary basis.

ii
The information set forth below is to be furnished:
1. In respect of each issue of securities of the registrant registered, a brief statement as to:
(a) The general effect of any material modifications, not previously reported, of the rights of the holders of such securities.
Not applicable.
(b) The title and the material provisions of any law, decree or administrative action, not previously reported, by reason of which the security is not being serviced in accordance with the terms thereof.
Not applicable.
(c) The circumstances of any other failure, not previously reported, to pay principal, interest, or any sinking fund or amortization installment.
Not applicable.
2. A statement as of the close of the last fiscal year of the registrant giving the total outstanding of:
(a) Internal funded debt of the registrant. (Total to be stated in the currency of the registrant. If any internal funded debt is payable in foreign currency, it should not be included under this paragraph (a), but under paragraph (b) of this item.)
Reference is made to pages 63, 83 and 85 of Exhibit 99.1 hereto.
(b) External funded debt of the registrant. (Totals to be stated in the respective currencies in which payable. No statement need be furnished as to intergovernmental debt.)
Reference is made to pages 63, 84 and 85 of Exhibit 99.1 hereto.
3. A statement giving the title, date of issue, date of maturity, interest rate and amount outstanding, together with the currency or currencies in which payable, of each issue of funded debt of the registrant outstanding as of the close of the last fiscal year of the registrant.
Reference is made to pages 83 to 85 of Exhibit 99.1 hereto.
4. (a) As to each issue of securities of the registrant which is registered, there should be furnished a break-down of the total amount outstanding, as shown in Item 3, into the following:
(1) Total amount held by or for the account of the registrant.
Not applicable.*
(2) Total estimated amount held by nationals of the registrant (or if registrant is other than a national government by the nationals of its national government); this estimate need be furnished only if it is practicable to do so.
Not applicable.*
(3) Total amount otherwise outstanding.
Not applicable.*
(b) If a substantial amount is set forth in answer to paragraph (a)(1) above, describe briefly the method employed by the registrant to reacquire such securities.
Not applicable.
*No securities of the registrant are registered under the Securities Exchange Act of 1934, as amended.
iii
5. A statement as of the close of the last fiscal year of the registrant giving the estimated total of:
(a) Internal floating indebtedness of the registrant. (Total to be stated in the currency of the registrant.)
$7.4 million. The item “floating indebtedness” refers to indebtedness with an original maturity of less than one year.
(b) External floating indebtedness of the registrant. (Total to be stated in the respective currencies in which payable.)
None.
6. Statements of the receipts, classified by source, and of the expenditures, classified by purpose, of the registrant for each fiscal year of the registrant ended since the close of the latest fiscal year for which such information was previously reported. These statements should be so itemized as to be reasonably informative and should cover both ordinary and extraordinary receipts and expenditures; there should be indicated separately, if practicable, the amount of receipts pledged or otherwise specifically allocated to any issue registered, indicating the issue.
Reference is made to pages 42 to 82 of Exhibit 99.1 hereto.
7. (a) If any foreign exchange control, not previously reported, has been established by the registrant (or if the registrant is other than a national government, by its national government), briefly describe the effect of any such action, not previously reported.
None.
(b) If any foreign exchange control previously reported has been discontinued or materially modified, briefly describe the effect of any such action, not previously reported.
Not applicable.
iv
EXHIBIT
The following exhibits should be filed as part of the annual report:
(a) Copies of any amendments or modifications, other than such have been previously filed, to all exhibits previously filed other than annual budgets.
Not applicable.
(b) A copy of any law, decree, or administrative document outlined in answer to Item 1(b).
Not applicable.
(c) A copy of the latest annual budget of the registrant, if not previously filed, as presented to its legislative body.
Not applicable.
This annual report comprises:
(a) The cover page and pages numbered i to v consecutively.
(b) The following exhibits:
99.1 Description of Hydro-Québec, dated as of April 28, 2017, including audited consolidated financial statements of Hydro-Québec for the year ended December 31, 2016, as approved by the Board of Directors of Hydro-Québec on February 24, 2017.
23.1 Consent of KPMG LLP, Ernst & Young LLP and the Auditor General of Québec.
This annual report is filed subject to the Instructions for Form 18-K for Foreign Governments and Political Subdivisions Thereof.

v
SIGNATURE
Pursuant to the requirements of the Securities Exchange Act of 1934, the registrant has duly caused this annual report to be signed on its behalf by the undersigned, thereunto duly authorized, in Montréal, Canada, on the 28th day of April, 2017.
HYDRO-QUÉBEC (Name of Registrant)
By: /s/ Jean-Hugues Lafleur Jean-Hugues Lafleur Vice-President, Financing, Treasury and Pension Fund

vi
EXHIBIT INDEX
Exhibits Description 99.1 Description of Hydro-Québec, dated as of April 28, 2017, including audited consolidated financial
statements of Hydro-Québec for the year ended December 31, 2016, as approved by the Board of Directors of Hydro-Québec on February 24, 2017.
23.1 Consent of KPMG LLP, Ernst & Young LLP and the Auditor General of Québec.
EXHIBIT 99.1
This description of Hydro-Québec is dated as of April 28, 2017 and appears as Exhibit 99.1 to Hydro-Québec’s annual report on Form 18-K to the U.S. Securities and Exchange Commission for the fiscal year ended December 31, 2016.
This document may be delivered to you at any time but you should assume that the information herein is accurate only as of April 28, 2017. Hydro-Québec’s business, financial condition, results of operations and prospects may have changed since that date.
This document does not constitute an offer to sell or the solicitation of an offer to buy any securities of Hydro-Québec, unless it is included in a registration statement filed under the Securities Act of 1933, as amended.
- 2 -
TABLE OF CONTENTS
Page
Where You Can Find More Information 3
Forward-Looking Statements 3
Foreign Exchange 3
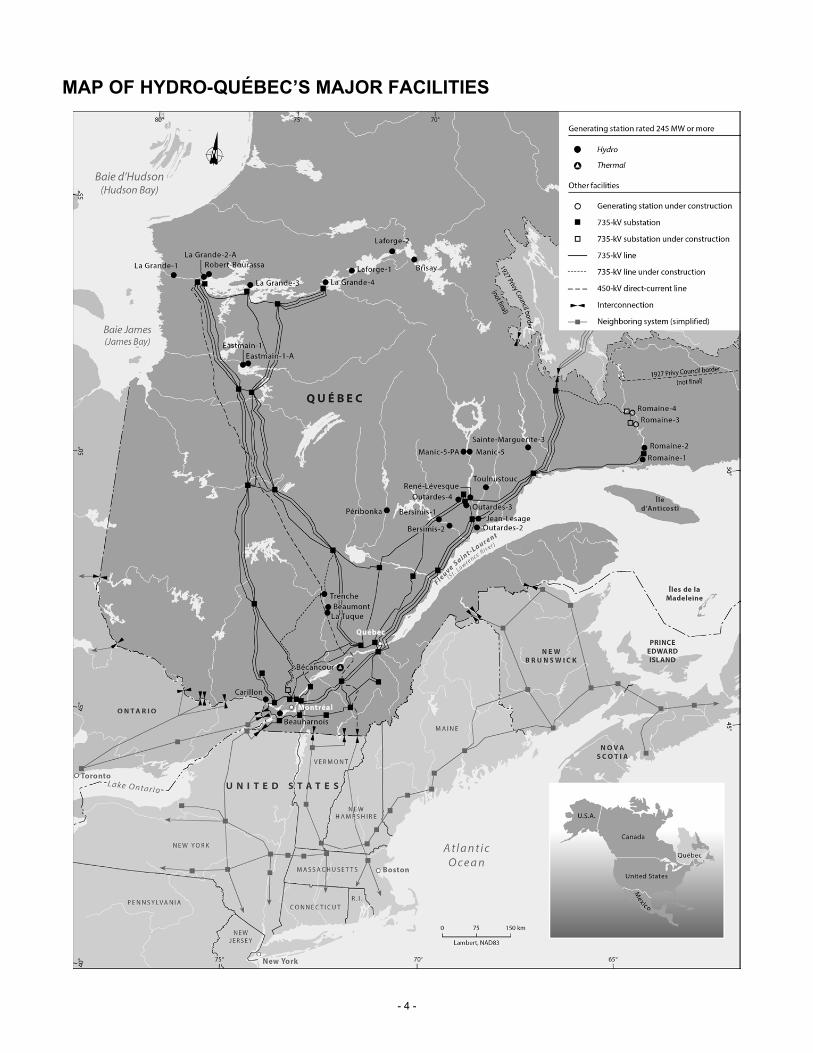
Map of Hydro-Québec’s Major Facilities 4
Five-Year Review 5
Hydro-Québec 8
General 8
Generation 10
Generation Operations 11
Wholesale and Energy Marketing Operations 12
Transmission 14
Transmission System 14
Distribution 15
Electricity Rates 16
Electricity Sales and Revenue 17
Construction 18
Corporate and Other Activities 18
Corporate Outlook 19
Development Strategy 19
Water Power Royalties 19
Capital Investment Program 20
Regulatory Framework 22
Litigation 24
Employees 25
Management’s Discussion and Analysis 26
Overview 26
Consolidated Results 27
Cash and Capital Management 28
Segmented Results 30
Integrated Business Risk Management 38
Independent Auditors’ Report 42
Consolidated Financial Statements 43
Supplementary Information 83

- 3 -
WHERE YOU CAN FIND MORE INFORMATION
This document appears as an exhibit to Hydro-Québec’s annual report filed with the U.S. Securities and Exchange Commission (the “SEC”) on Form 18-K for the fiscal year ended December 31, 2016. Additional information with respect to Hydro-Québec is available in the annual report or in other exhibits or amendments to the annual report.
You may read and copy any document we file with the SEC at the SEC’s public reference room in Washington, DC. Please call the SEC’s toll free number at 1-800-SEC-0330 for further information on the public reference room. These filings are also available from the Electronic Data Gathering, Analysis, and Retrieval system, which is commonly known by the acronym EDGAR, through the SEC’s website at http://www.sec.gov.
You may request a copy of these filings at no cost by calling Hydro-Québec at (514) 289-2518. This document is also available on our website at www.hydroquebec.com; however, any other information available on our website shall not be deemed to form a part of this document or the annual report to which it appears as an exhibit.
FORWARD-LOOKING STATEMENTS
Various statements made throughout this document are forward looking and contain information about financial results, economic conditions and trends, including, without limitation, the statements under the captions Corporate Outlook and Management’s Discussion and Analysis. The words “estimate”, “believe”, “expect”, “forecast”, “anticipate”, “intend” and “plan” and similar expressions identify forward-looking statements. You are cautioned that any such forward-looking statements are not guarantees of future performance. Forward-looking statements involve risks and uncertainties, and actual results may differ materially from those in the forward-looking statements as a result of various factors. Such factors may include, among others, business risks, such as variations in runoff that affect hydroelectric plant performance, and general levels of economic activity which affect demand for electricity, and risks related to economic parameters, such as changes in interest and exchange rates. You are cautioned not to place undue reliance on these forward-looking statements which speak only as of the date of this document. We undertake no obligation to publicly release the result of any revisions to these forward-looking statements which may be made to reflect events or circumstances after the date hereof or to reflect the occurrence of unanticipated events.
FOREIGN EXCHANGE
Canada maintains a floating exchange rate for the Canadian dollar in order to permit the rate to be determined by fundamental forces without intervention except as required to maintain orderly conditions. Annual average spot exchange rates for major foreign currencies in which the debt of Hydro-Québec is denominated, expressed in Canadian dollars, are shown below.
Foreign Currency 2012 2013 2014 2015 2016 2017a
United States Dollar $0.9996 $1.0299 $1.1045 $1.2788 $1.3256 $1.3229Euro 1.2850 1.3681 1.4671 1.4185 1.4663 1.4101Pound Sterling 1.5840 1.6113 1.8190 1.9542 1.7963 1.6398100 Japanese Yen 1.2540 1.0570 1.0460 1.0570 1.2210 1.1650
a) Monthly average through the end of March 2017.
Source: Bank of Canada.
In this document, unless otherwise specified or the context otherwise requires, all dollar amounts are expressed in Canadian dollars.
- 4 -
MAP OF HYDRO-QUÉBEC’S MAJOR FACILITIES

- 5 -
FIVE-YEAR REVIEW
CONSOLIDATED AND SELECTED FINANCIAL INFORMATION
Years ended December 31 2012 2013 2014 2015 2016
(in millions of dollars) OPERATIONS Revenue $ 12,134 $ 12,878 $ 13,652 $ 13,754 $ 13,339 Expenditure
Operations 2,375 2,460 2,366 2,527 2,438 Electricity and fuel purchases 1,183 1,568 1,968 1,938 1,866 Depreciation and amortization 2,405 2,483 2,593 2,713 2,597 Taxes 997 1,000 975 980 1,045
6,960 7,511 7,902 8,158 7,946 Operating income 5,174 5,367 5,750 5,596 5,393 Financial expenses 2,438 2,429 2,425 2,449 2,532 Income from continuing operations 2,736 2,938 3,325 3,147 2,861 Income (loss) from discontinued operationsa (1,876) 4 – – – Net income $ 860 $ 2,942 $ 3,325 $ 3,147 $ 2,861
DIVIDEND $ 645 $ 2,207 $ 2,535 $ 2,360 $ 2,146
BALANCE SHEET SUMMARY Total assets $ 70,508 $ 73,110 $ 73,108 $ 75,199 $ 75,167 Long-term debt, including current portion and perpetual debt $ 43,524 $ 44,477 $ 44,752 $ 45,983 $ 45,909 Equity $ 18,982 $ 19,394 $ 17,961 $ 19,475 $ 19,704
INVESTMENTS FOR CONTINUING OPERATIONS AFFECTING CASH Property, plant and equipment and intangible assets $ 3,932b $ 4,335b $ 3,815 $ 3,440 $ 3,460
FINANCIAL RATIOS Return on equity from continuing operationsc 14.6% 14.6% 16.1% 14.9% 13.1% Capitalizationd 30.6% 30.5% 28.9% 30.1% 30.5% Profit margin from continuing operationse 22.5% 22.8% 24.4% 22.9% 21.4% Interest coveragef 2.02 2.09 2.23 2.20 2.16 Self-financingg 55.4% 68.3% 56.4% 82.8% 58.8%
a) The discontinued operations are related to the 2012 decision to abandon the project to refurbish Gentilly-2 nuclear generating station and to terminate nuclear power operations.
b) Including the Energy Efficiency Plan. c) Income from continuing operations divided by average equity less average accumulated income (loss) from discontinued operations for the
current year and prior years and average accumulated other comprehensive income. For the period from 2012 to 2016, the denominator amounted to $18,729 million, $20,141 million, $20,602 million, $21,091 million and $21,842 million, respectively.
d) Equity divided by the sum of equity, long-term debt, current portion of long-term debt, perpetual debt, borrowings and derivative instrument liabilities, less derivative instrument assets and sinking fund.
e) Income from continuing operations divided by revenue. f) Sum of operating income and net investment income divided by interest on debt securities. g) Cash flows from operating activities less dividend paid, divided by the sum of cash flows from investing activities, excluding net disposal or
acquisition of short-term investments, and repayment of long-term debt.
Note: The data for 2014 and thereafter are presented according to U.S. generally accepted accounting principles (“U.S. GAAP”), while the data for prior years are presented according to Canadian generally accepted accounting principles (“Canadian GAAP”), as published in the annual report on Form 18-K for the fiscal year ended December 31, 2014. As two different financial reporting frameworks are used in the above table, the financial information may not be directly comparable.
- 6 -
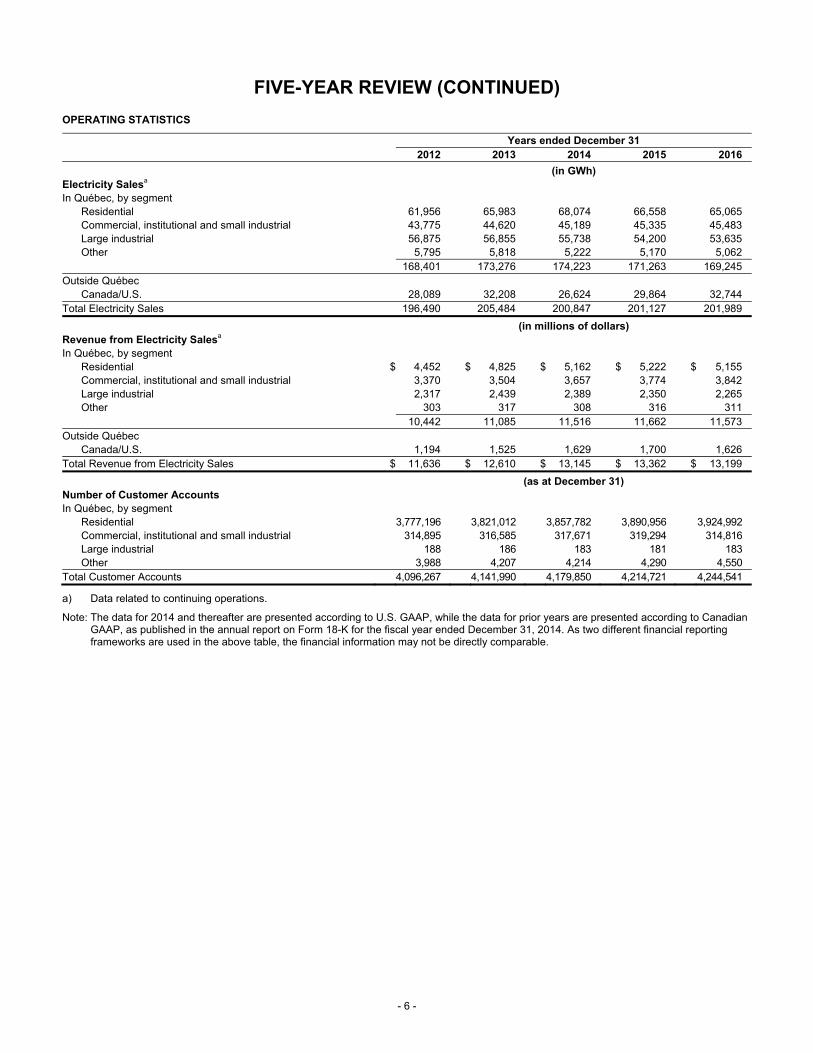
FIVE-YEAR REVIEW (CONTINUED)
OPERATING STATISTICS Years ended December 31
2012 2013 2014 2015 2016
(in GWh) Electricity Salesa In Québec, by segment
Residential 61,956 65,983 68,074 66,558 65,065 Commercial, institutional and small industrial 43,775 44,620 45,189 45,335 45,483 Large industrial 56,875 56,855 55,738 54,200 53,635 Other 5,795 5,818 5,222 5,170 5,062
168,401 173,276 174,223 171,263 169,245 Outside Québec
Canada/U.S. 28,089 32,208 26,624 29,864 32,744 Total Electricity Sales 196,490 205,484 200,847 201,127 201,989
(in millions of dollars) Revenue from Electricity Salesa In Québec, by segment
Residential $ 4,452 $ 4,825 $ 5,162 $ 5,222 $ 5,155 Commercial, institutional and small industrial 3,370 3,504 3,657 3,774 3,842 Large industrial 2,317 2,439 2,389 2,350 2,265 Other 303 317 308 316 311
10,442 11,085 11,516 11,662 11,573 Outside Québec
Canada/U.S. 1,194 1,525 1,629 1,700 1,626 Total Revenue from Electricity Sales $ 11,636 $ 12,610 $ 13,145 $ 13,362 $ 13,199
(as at December 31) Number of Customer Accounts In Québec, by segment
Residential 3,777,196 3,821,012 3,857,782 3,890,956 3,924,992 Commercial, institutional and small industrial 314,895 316,585 317,671 319,294 314,816 Large industrial 188 186 183 181 183 Other 3,988 4,207 4,214 4,290 4,550
Total Customer Accounts 4,096,267 4,141,990 4,179,850 4,214,721 4,244,541
a) Data related to continuing operations.
Note: The data for 2014 and thereafter are presented according to U.S. GAAP, while the data for prior years are presented according to Canadian GAAP, as published in the annual report on Form 18-K for the fiscal year ended December 31, 2014. As two different financial reporting frameworks are used in the above table, the financial information may not be directly comparable.
- 7 -
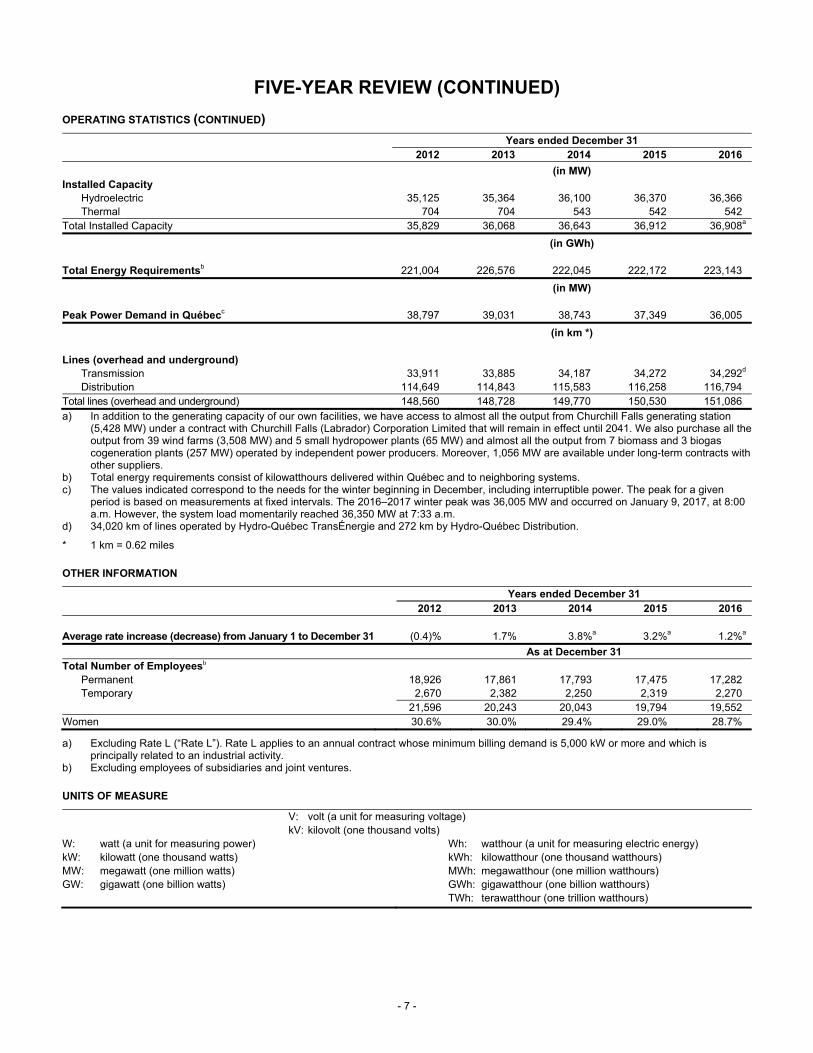
FIVE-YEAR REVIEW (CONTINUED)
OPERATING STATISTICS (CONTINUED)
Years ended December 31 2012 2013 2014 2015 2016
(in MW) Installed Capacity
Hydroelectric 35,125 35,364 36,100 36,370 36,366 Thermal 704 704 543 542 542
Total Installed Capacity 35,829 36,068 36,643 36,912 36,908a
(in GWh) Total Energy Requirementsb 221,004 226,576 222,045 222,172 223,143
(in MW) Peak Power Demand in Québecc 38,797 39,031 38,743 37,349 36,005
(in km *) Lines (overhead and underground)
Transmission 33,911 33,885 34,187 34,272 34,292d
Distribution 114,649 114,843 115,583 116,258 116,794 Total lines (overhead and underground) 148,560 148,728 149,770 150,530 151,086
a) In addition to the generating capacity of our own facilities, we have access to almost all the output from Churchill Falls generating station (5,428 MW) under a contract with Churchill Falls (Labrador) Corporation Limited that will remain in effect until 2041. We also purchase all the output from 39 wind farms (3,508 MW) and 5 small hydropower plants (65 MW) and almost all the output from 7 biomass and 3 biogas cogeneration plants (257 MW) operated by independent power producers. Moreover, 1,056 MW are available under long-term contracts with other suppliers.
b) Total energy requirements consist of kilowatthours delivered within Québec and to neighboring systems. c) The values indicated correspond to the needs for the winter beginning in December, including interruptible power. The peak for a given
period is based on measurements at fixed intervals. The 2016–2017 winter peak was 36,005 MW and occurred on January 9, 2017, at 8:00 a.m. However, the system load momentarily reached 36,350 MW at 7:33 a.m.
d) 34,020 km of lines operated by Hydro-Québec TransÉnergie and 272 km by Hydro-Québec Distribution.
* 1 km = 0.62 miles
OTHER INFORMATION
Years ended December 31 2012 2013 2014 2015 2016
Average rate increase (decrease) from January 1 to December 31 (0.4)% 1.7% 3.8%a 3.2%a 1.2%a
As at December 31 Total Number of Employeesb
Permanent 18,926 17,861 17,793 17,475 17,282 Temporary 2,670 2,382 2,250 2,319 2,270
21,596 20,243 20,043 19,794 19,552 Women 30.6% 30.0% 29.4% 29.0% 28.7%
a) Excluding Rate L (“Rate L”). Rate L applies to an annual contract whose minimum billing demand is 5,000 kW or more and which is principally related to an industrial activity.
b) Excluding employees of subsidiaries and joint ventures.
UNITS OF MEASURE
V: volt (a unit for measuring voltage) kV: kilovolt (one thousand volts)
W: watt (a unit for measuring power) Wh: watthour (a unit for measuring electric energy) kW: kilowatt (one thousand watts) kWh: kilowatthour (one thousand watthours) MW: megawatt (one million watts) MWh: megawatthour (one million watthours) GW: gigawatt (one billion watts) GWh: gigawatthour (one billion watthours) TWh: terawatthour (one trillion watthours)

- 8 -
HYDRO-QUÉBEC
GENERAL
We operate one of the major systems in Canada for the generation, transmission and distribution of electric power. We supply virtually all electric power distributed in Québec, the largest province in Canada in land area and the second largest in population.
Hydro-Québec was created in 1944 by the Hydro-Québec Act of the Parliament of Québec and is an agent of Québec. All capital stock of Hydro-Québec is held by the Minister of Finance on behalf of the Government of Québec (the “Government”).
Our head office is located at 75 René-Lévesque Boulevard West, Montréal, Québec, Canada.
We carry on our activities in the four reportable business segments defined below. The other business segments and activities are grouped together under Corporate and Other Activities for reporting purposes.
Generation: Hydro-Québec Production operates and develops our generating facilities in Québec. Hydro-Québec Production provides Hydro-Québec Distribution with a base volume of up to 165 TWh of heritage pool electricity annually (“Heritage Pool Electricity”). Beginning in 2014, the Heritage Pool Electricity is subject to a yearly indexation (see “Regulatory Framework – Energy Board Act”). The authorized average price was 2.84¢/kWh for 2015 and 2.88¢/kWh for 2016. In addition, Hydro-Québec Production can participate in Hydro-Québec Distribution’s calls for tenders in a context of free market competition. It also sells electricity in markets outside Québec and engages in energy-related arbitrage transactions;
Transmission: Hydro-Québec TransÉnergie operates and develops our power transmission system. It markets system capacity and manages power flows throughout Québec;
Distribution: Hydro-Québec Distribution operates and develops our distribution system and supplies electricity to the Québec market. It also carries out activities related to electricity sales in Québec as well as customer services and promotes energy efficiency;
Construction: Hydro-Québec Innovation, équipement et services partagés and our wholly-owned subsidiary, Société d’énergie de la Baie James (“SEBJ”), design, build and refurbish generating and transmission facilities, mainly for Hydro-Québec Production and Hydro-Québec TransÉnergie. Hydro-Québec Innovation, équipement et services partagés is responsible for projects throughout Québec, except in the territory governed by the James Bay and Northern Québec Agreement (the “JBNQA”). SEBJ builds generating facilities in the territory governed by the JBNQA (north of the 49th parallel) and may also carry out projects elsewhere in Québec or outside the province; and
Corporate and Other Activities: The corporate units support our divisions in the achievement of their business objectives. As at December 31, 2016, Corporate and Other Activities included corporate activities, as well as the Vice-présidence – Technologies de l’information et des communications (Information and Communication Technologies Vice Presidency), Vice-présidence – Développement des affaires, acquisitions et stratégies (Business Development, Acquisitions and Strategies Vice Presidency), Direction principale – Gestion des filiales (Subsidiary Management Unit), Direction principale – Institut de recherche d’Hydro-Québec (Hydro-Québec Research Institute Unit), Direction principale – Centre de services partagés (Shared Services Centre Unit) and Direction principale – Approvisionnement stratégique (Strategic Procurement Unit).
The mandate of the Vice-présidence – Développement des affaires, acquisitions et stratégies is to prospect for business opportunities and act on them so that we can not only increase our operating revenue and income from markets outside Québec, but also play a leading role in the global energy transition to a cleaner energy future, in accordance with the strategies laid out in the Strategic Plan 2016–2020. It also commercializes the innovations of the technology subsidiaries reporting to the subsidiary Hydro-Québec IndusTech, including TM4, Technologies Esstalion and MIR Innovation, in such a way as to maximize their contribution to our growth objectives.
The Direction principale – Institut de recherche d’Hydro-Québec, which is part of Hydro-Québec Innovation, équipement et services partagés, develops and adapts leading-edge technology solutions according to the company’s business requirements and objectives. It provides technical assistance to the divisions and carries out innovation projects to support their operations and ensure our long-term development. The Direction

- 9 -
principale – Centre de services partagés and Direction principale – Approvisionnement stratégique are also part of Hydro-Québec Innovation, équipement et services partagés. The Direction principale – Centre de services partagés offers services pertaining to real estate management and materials management, as well as transportation and other specialized services. The Direction principale – Approvisionnement stratégique provides procurement guidelines, products and services to the entire company.
As at December 31, 2016, corporate activities consisted of the Groupe – Direction financière et contrôle (Financial Management and Control Group), the Vice-présidence – Affaires corporatives et secrétariat général (Corporate Affairs and General Secretariat Vice Presidency), the Vice-présidence – Financement, trésorerie et caisse de retraite (Financing, Treasury and Pension Fund Vice Presidency) and the Vice-présidence – Ressources humaines (Human Resources Vice Presidency).
Following a restructuring that took effect in January 2017, we now have two new corporate units:
Vice-présidence – Communications et affaires gouvernementales (Communications and Governement Affairs Vice Presidency), tasked with continuing to implement our proactive communication strategy;
Vice-présidence – Transformation, santé et sécurité (Transformation, Health and Safety Vice Presidency), responsible for spearheading efforts to transform the corporate culture and improve performance, as well as overseeing occupational health and safety.
In addition, the activities handled by the Subsidiary Management Unit now fall under the responsibility of the Vice-présidence – Développement des affaires, acquisitions et stratégies, which was renamed Vice-présidence – Développement des affaires (Business Development Vice Presidency). For its part, the Vice-présidence – Affaires corporatives et secrétariat général continues to provide support to the Board of Directors and remains in charge of services related to sustainable development and legal affairs.

- 10 -
GENERATION
Hydro-Québec Production generates power to supply the Québec market and sells power on wholesale markets.
The following subsidiaries, affiliates and interests are also part of this segment:
Churchill Falls (Labrador) Corporation Limited (“CF(L)Co”) (34.2% interest; hydroelectric generation activities);
HQ Manicouagan inc. (wholly-owned; holds a 60% interest in Manicouagan Power Limited Partnership, which owns and operates a generating station (McCormick) located on the Rivière Manicouagan);
Marketing d’énergie HQ inc. (HQ Energy Marketing Inc.) (“HQEM”) (wholly-owned; conducts energy transactions in other Canadian provinces and holds shares in energy trading companies in Canada and the United States);
H.Q. Energy Services (U.S.) Inc. (“HQUS”) (wholly-owned subsidiary of HQEM; power marketer in the United States); and
Hydro Renewable Energy Inc. (“HRE”) (wholly-owned subsidiary of HQEM; participates in the development of new projects in the United States).

- 11 -
GENERATION OPERATIONS
Facilities
In Québec, our electric generation system comprises 86 generating stations currently in service, of which 62 are hydroelectric and 24 are thermal; with a total installed capacity of 36,908 MW as of December 31, 2016.
The following table lists the generating stations in service as of such date.
GENERATING STATIONS IN SERVICE IN QUÉBEC
Name of Facility Years Commissioneda Capacity (MW) Hydroelectricb Robert-Bourassa 1979-1981 5,616 La Grande-4 1984-1986 2,779 La Grande-3 1982-1984 2,417 La Grande-2-A 1991-1992 2,106 Beauharnois 1932-1961 1,876 Manic-5 1970-1971 1,596 La Grande-1 1994-1995 1,436 René-Lévesque (Manic-3) 1975-1976 1,326 Jean-Lesage (Manic-2) 1965-1967 1,229 Bersimis-1 1956-1959 1,178 Manic-5-PA 1989-1990 1,064 Outardes-3 1969 1,026 Sainte-Marguerite-3 2003-2004 882 Laforge-1 1993-1994 878 Bersimis-2 1959-1960 869 Outardes-4 1969 785 Eastmain-1-A 2011-2012 768 Carillon 1962-1964 753 Romaine-2 2014 640 Toulnustouc 2005 526 Outardes-2 1978 523 Eastmain-1 2006 480 Brisay 1993 469 Péribonka 2007-2008 385 Laforge-2 1996 319 Trenche 1950-1955 302 La Tuque 1940-1955 294 Beaumont 1958-1959 270 Romaine-1 2015 270 McCormick 1951-1965 235 Rocher-de-Grand-Mère 2004 230 Paugan 1928-1956 226 Rapide-Blanc 1934-1955 204 Shawinigan-2 1911-1929 200 Shawinigan-3 1948-1949 194 Manic-1 1966-1967 184 Rapides-des-Îles 1966-1973 176 Chelsea 1927-1939 152 Sarcelle 2013 150 La Gabelle 1924-1931 131 Première-Chute 1968-1975 131 Les Cèdres 1914-1924 113 Rapides-Farmer 1927-1947 104 Rapides-des-Quinze 1923-1955 103 Other (18 generating stations rated less than 100 MW) 1915-2009 771 Total 36,366
Thermal Bécancour (gas turbine) 1992-1993 411 Other (23 diesel plants on off-grid systems)c 1967-2015 131 Total 542
a) Indicates years when facilities began commercial operation. b) 61 facilities are operated by Hydro-Québec Production and one facility is operated by Hydro-Québec Distribution. c) Operated by Hydro-Québec Distribution.

- 12 -
Electricity Purchases
We purchase energy and capacity from the Churchill Falls generating station in Labrador through agreements with CF(L)Co. Under an initial power contract signed in 1969 with CF(L)Co, we agreed to purchase annually, through the year 2041, 4,083 MW of power (the “1969 Power Contract”). In June 1999, we signed another agreement with CF(L)Co to guarantee us the availability of 682 MW of additional power until 2041 for each November 1 to March 31 period. In 2016, the energy received totaled 29.0 TWh at a cost of $103 million as compared to 28.7 TWh in 2015.
We have a power agreement with Rio Tinto Alcan Inc., which was amended in 2006, for the purchase of 365 MW of peak power and 375 MW of additional peak power until December 31, 2045. Under this 2006 amendment, we also agreed to purchase from Rio Tinto Alcan Inc. an additional 150 MW of peak power until December 31, 2045.
In addition, we purchase energy and capacity under 65 long-term contracts with independent producers located in Québec. During 2016, 3.0 TWh were purchased under these contracts, at a total cost of $228 million. For 2017, we expect to purchase approximately 3.3 TWh. Hydro-Québec Distribution also has long-term contracts with independent producers (see “Distribution”).
We also purchase energy and capacity in connection with our energy marketing operations (see “Wholesale and Energy Marketing Operations”).
Peak
We use energy purchased from our neighboring systems, which experience different demand patterns, to meet a portion of our peak power needs in Québec (see “Wholesale and Energy Marketing Operations”). The following table summarizes our peak power demand in Québec and installed capacity as at December 31 for the years 2012 through 2016.
Peak Power Demanda Installed Capacity Total Average Loadc
(MW) 2012 38,797 35,829 25,160 2013 39,031 36,068 25,865 2014 38,743 36,643 25,348 2015 37,349 36,912 25,362 2016 36,005 36,908b 25,403
a) The values indicated correspond to the needs for the winter beginning in December, including interruptible power. The peak for a given period is based on measurements at fixed intervals. The 2016-2017 winter peak was 36,005 MW and occurred on January 9, 2017, at 8:00 a.m. However, the system load momentarily reached 36,350 MW at 7:33 a.m.
b) In addition to the generating capacity of our own facilities, we have access to almost all the output from Churchill Falls generating station (5,428 MW) under a contract with Churchill Falls (Labrador) Corporation Limited that will remain in effect until 2041. We also purchase all the output from 39 wind farms (3,508 MW) and 5 small hydropower plants (65 MW) and almost all the output from 7 biomass and 3 biogas cogeneration plants (257 MW) operated by independent power producers. Moreover, 1,056 MW are available under long-term contracts with other suppliers.
c) Total energy requirements (consisting of kilowatthours delivered within Québec and to neighboring systems), divided by the number of hours in the year.
WHOLESALE AND ENERGY MARKETING OPERATIONS
Québec Wholesale Market
The Québec wholesale electricity market has been open since May 1, 1997. This market is comprised of 11 distributors: Hydro-Québec Distribution, nine distributors operating municipal systems and one regional electricity cooperative. As a result of the opening of the wholesale market, the municipal systems can, subject to the Government’s authorization, purchase electricity from suppliers other than Hydro-Québec Distribution, and independent generators in Québec can sell their electricity on the wholesale market using Hydro-Québec TransÉnergie’s transmission facilities.
In addition to the Heritage Pool Electricity, Hydro-Québec Production provides other power supplies and products to Hydro-Québec Distribution, including a call for tenders issued in 2002 for the supply of 600 MW over a 20-year period starting in March 2007 and a 20-year capacity supply of 500 MW resulting from a call for tenders issued in 2015, which is expected to begin in December 2018.
- 13 -
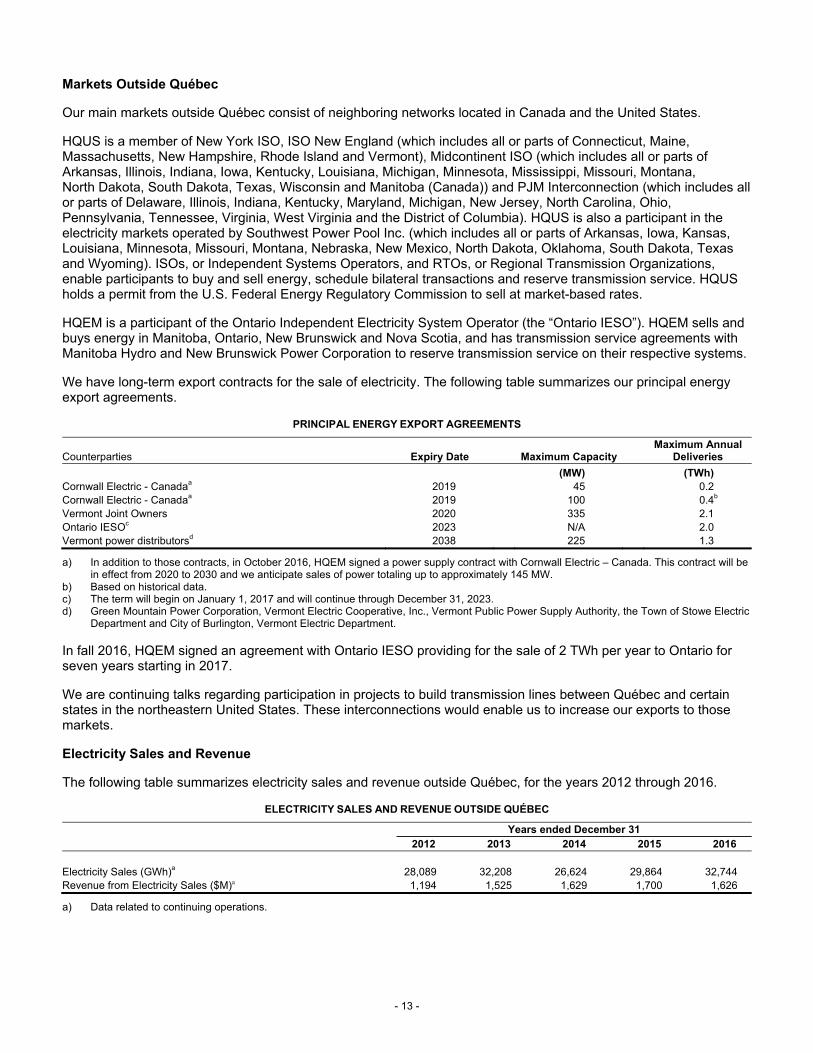
Markets Outside Québec
Our main markets outside Québec consist of neighboring networks located in Canada and the United States.
HQUS is a member of New York ISO, ISO New England (which includes all or parts of Connecticut, Maine, Massachusetts, New Hampshire, Rhode Island and Vermont), Midcontinent ISO (which includes all or parts of Arkansas, Illinois, Indiana, Iowa, Kentucky, Louisiana, Michigan, Minnesota, Mississippi, Missouri, Montana, North Dakota, South Dakota, Texas, Wisconsin and Manitoba (Canada)) and PJM Interconnection (which includes all or parts of Delaware, Illinois, Indiana, Kentucky, Maryland, Michigan, New Jersey, North Carolina, Ohio, Pennsylvania, Tennessee, Virginia, West Virginia and the District of Columbia). HQUS is also a participant in the electricity markets operated by Southwest Power Pool Inc. (which includes all or parts of Arkansas, Iowa, Kansas, Louisiana, Minnesota, Missouri, Montana, Nebraska, New Mexico, North Dakota, Oklahoma, South Dakota, Texas and Wyoming). ISOs, or Independent Systems Operators, and RTOs, or Regional Transmission Organizations, enable participants to buy and sell energy, schedule bilateral transactions and reserve transmission service. HQUS holds a permit from the U.S. Federal Energy Regulatory Commission to sell at market-based rates.
HQEM is a participant of the Ontario Independent Electricity System Operator (the “Ontario IESO”). HQEM sells and buys energy in Manitoba, Ontario, New Brunswick and Nova Scotia, and has transmission service agreements with Manitoba Hydro and New Brunswick Power Corporation to reserve transmission service on their respective systems.
We have long-term export contracts for the sale of electricity. The following table summarizes our principal energy export agreements.
PRINCIPAL ENERGY EXPORT AGREEMENTS
Counterparties Expiry Date Maximum Capacity Maximum Annual
Deliveries
(MW) (TWh) Cornwall Electric - Canadaa 2019 45 0.2 Cornwall Electric - Canadaa 2019 100 0.4b Vermont Joint Owners 2020 335 2.1 Ontario IESOc 2023 N/A 2.0 Vermont power distributorsd 2038 225 1.3
a) In addition to those contracts, in October 2016, HQEM signed a power supply contract with Cornwall Electric – Canada. This contract will be in effect from 2020 to 2030 and we anticipate sales of power totaling up to approximately 145 MW.
b) Based on historical data. c) The term will begin on January 1, 2017 and will continue through December 31, 2023. d) Green Mountain Power Corporation, Vermont Electric Cooperative, Inc., Vermont Public Power Supply Authority, the Town of Stowe Electric
Department and City of Burlington, Vermont Electric Department.
In fall 2016, HQEM signed an agreement with Ontario IESO providing for the sale of 2 TWh per year to Ontario for seven years starting in 2017.
We are continuing talks regarding participation in projects to build transmission lines between Québec and certain states in the northeastern United States. These interconnections would enable us to increase our exports to those markets.
Electricity Sales and Revenue
The following table summarizes electricity sales and revenue outside Québec, for the years 2012 through 2016.
ELECTRICITY SALES AND REVENUE OUTSIDE QUÉBEC
Years ended December 31 2012 2013 2014 2015 2016
Electricity Sales (GWh)a 28,089 32,208 26,624 29,864 32,744 Revenue from Electricity Sales ($M)a 1,194 1,525 1,629 1,700 1,626
a) Data related to continuing operations.
- 14 -
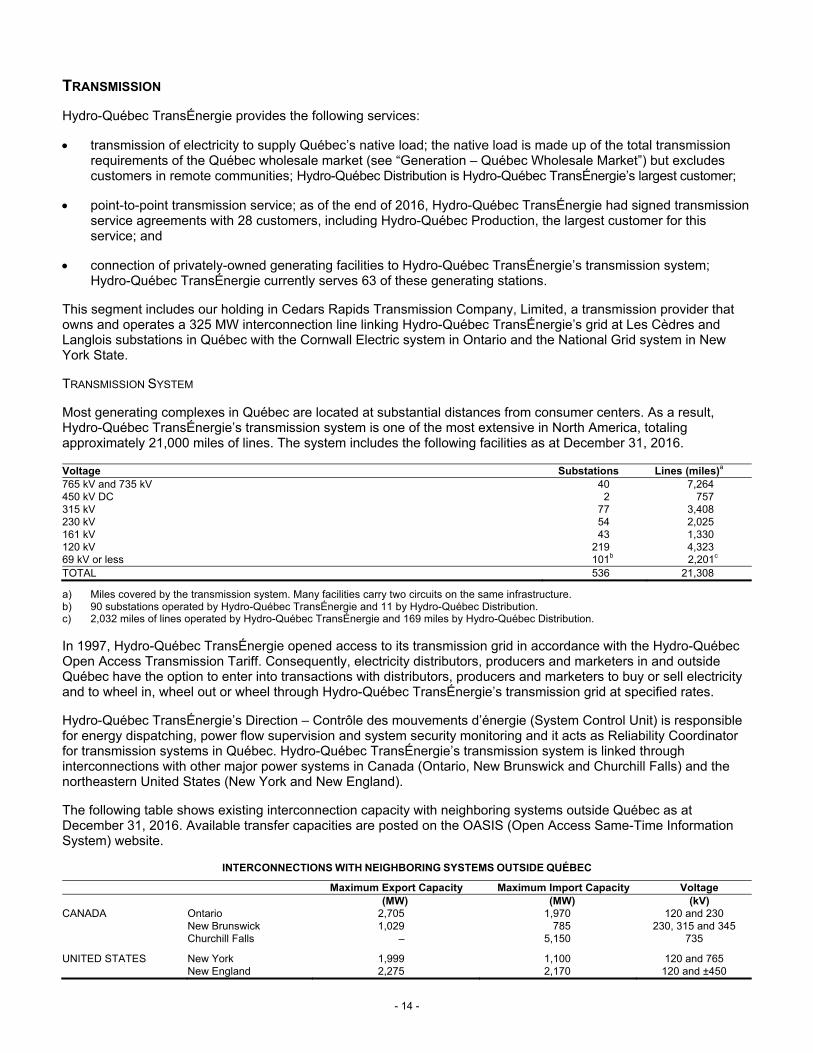
TRANSMISSION
Hydro-Québec TransÉnergie provides the following services:
transmission of electricity to supply Québec’s native load; the native load is made up of the total transmission requirements of the Québec wholesale market (see “Generation – Québec Wholesale Market”) but excludes customers in remote communities; Hydro-Québec Distribution is Hydro-Québec TransÉnergie’s largest customer;
point-to-point transmission service; as of the end of 2016, Hydro-Québec TransÉnergie had signed transmission service agreements with 28 customers, including Hydro-Québec Production, the largest customer for this service; and
connection of privately-owned generating facilities to Hydro-Québec TransÉnergie’s transmission system; Hydro-Québec TransÉnergie currently serves 63 of these generating stations.
This segment includes our holding in Cedars Rapids Transmission Company, Limited, a transmission provider that owns and operates a 325 MW interconnection line linking Hydro-Québec TransÉnergie’s grid at Les Cèdres and Langlois substations in Québec with the Cornwall Electric system in Ontario and the National Grid system in New York State.
TRANSMISSION SYSTEM
Most generating complexes in Québec are located at substantial distances from consumer centers. As a result, Hydro-Québec TransÉnergie’s transmission system is one of the most extensive in North America, totaling approximately 21,000 miles of lines. The system includes the following facilities as at December 31, 2016.
Voltage Substations Lines (miles)a 765 kV and 735 kV 40 7,264 450 kV DC 2 757 315 kV 77 3,408 230 kV 54 2,025 161 kV 43 1,330 120 kV 219 4,323 69 kV or less 101b 2,201c TOTAL 536 21,308
a) Miles covered by the transmission system. Many facilities carry two circuits on the same infrastructure. b) 90 substations operated by Hydro-Québec TransÉnergie and 11 by Hydro-Québec Distribution. c) 2,032 miles of lines operated by Hydro-Québec TransÉnergie and 169 miles by Hydro-Québec Distribution.
In 1997, Hydro-Québec TransÉnergie opened access to its transmission grid in accordance with the Hydro-Québec Open Access Transmission Tariff. Consequently, electricity distributors, producers and marketers in and outside Québec have the option to enter into transactions with distributors, producers and marketers to buy or sell electricity and to wheel in, wheel out or wheel through Hydro-Québec TransÉnergie’s transmission grid at specified rates.
Hydro-Québec TransÉnergie’s Direction – Contrôle des mouvements d’énergie (System Control Unit) is responsible for energy dispatching, power flow supervision and system security monitoring and it acts as Reliability Coordinator for transmission systems in Québec. Hydro-Québec TransÉnergie’s transmission system is linked through interconnections with other major power systems in Canada (Ontario, New Brunswick and Churchill Falls) and the northeastern United States (New York and New England).
The following table shows existing interconnection capacity with neighboring systems outside Québec as at December 31, 2016. Available transfer capacities are posted on the OASIS (Open Access Same-Time Information System) website.
INTERCONNECTIONS WITH NEIGHBORING SYSTEMS OUTSIDE QUÉBEC
Maximum Export Capacity Maximum Import Capacity Voltage (MW) (MW) (kV)
CANADA Ontario 2,705 1,970 120 and 230 New Brunswick 1,029 785 230, 315 and 345 Churchill Falls – 5,150 735
UNITED STATES New York 1,999 1,100 120 and 765 New England 2,275 2,170 120 and ±450

- 15 -
DISTRIBUTION
Hydro-Québec Distribution provides a secure, reliable supply of electricity and related services to the Québec market. To fulfill this responsibility, Hydro-Québec Distribution relies primarily on the Heritage Pool Electricity supplied by Hydro-Québec Production. Hydro-Québec Distribution also purchases additional electricity under market conditions by issuing calls for tenders from suppliers in the market (see “Regulatory Framework – Energy Board Act”).
Our distribution system is comprised of 72,572 miles of medium voltage lines (almost exclusively 25 kV), as well as 65,274 miles of low voltage lines. Approximately 10% of all such lines are underground.
Hydro-Québec Distribution sells to a wide range of customers, from large industrial users, which accounted for 31.7% of sales volume in 2016, to residential customers, which represented 38.4% of sales volume in the same period. Revenues are also derived from sales to commercial, institutional and small industrial customers as well as distributors operating municipal electric systems.
Hydro-Québec Distribution has developed some flexibility in the management of our system and currently has 1,144 MW of interruptible power, 149 MW of demand-side management and 570 MW of concurrent peak-saving capacity in our residential dual-energy market.
Hydro-Québec Distribution has entered into special agreements with nine industrial customers for whom electricity costs represent a substantial proportion of total production costs. Some of these agreements provide for the sale, on a long-term basis, of firm energy at prices that vary in accordance with a formula based on the market price of aluminum. We manage the exposure to fluctuations in aluminum prices resulting from these contracts by entering into financial transactions, such as futures or swaps (see “Note 15 to the 2016 Consolidated Financial Statements”). In 2016, deliveries under these agreements accounted for 48.7% of the total energy deliveries to large industrial users.
Hydro-Québec Distribution relies on various sources to supply the Québec market. Hydro-Québec Distribution relies primarily on the Heritage Pool Electricity of 165 TWh, which it purchases from Hydro Québec Production, and also issues short- and long-term calls for tenders. For requirements of less than three months, it may also buy electricity directly on the market, without tendering, under an authorization granted by the Régie de l’énergie (the “Energy Board”). For unforeseen needs that cannot be met otherwise, it relies on a framework agreement with Hydro-Québec Production, also approved by the Energy Board, that covers the period from January 1, 2014, to December 31, 2019.
Further to calls for tenders issued since 2002, Hydro-Québec Distribution signed five contracts with Hydro-Québec Production for the supply of 1,100 MW (two contracts totaling 600 MW over a 20-year period beginning in March 2007 and three contracts totaling 500 MW over a 20-year period beginning in December 2018) and 70 contracts with independent producers for the supply of more than 4,600 MW (including 3,711 MW of wind-generated electricity) for deliveries beginning between 2006 and 2019. Hydro-Québec Production also has long-term contracts with independent producers (see “Generation – Electricity Purchases”).
The following table summarizes these contracts as at December 31, 2016.
LONG-TERM CONTRACTS AWARDED
Type of power Number of Contracts
Capacity Starting Date Expiry Date
(MW) Hydroelectric 7 In service 664 2007-2015 2027-2035 7 Under development 558 2017-2018 2037-2038
Natural gas cogeneration 1 In service 507 2006 2026
Wind 34 In service 3,296 2006-2016 2026-2041 4 Under development 414 2017-2018 2037-2042
Forest biomass cogeneration 11 In service 219 2007-2015 2023-2040 7 Under development 106 2017-2019 2037-2044
Biomass cogeneration 3 In service 20 2012 2032-2037 1 Under development 5 2017 2042 75 5,789

- 16 -
Hydro-Québec Distribution manages its flexible and diversified energy portfolio to deal with fluctuations in demand. Every three years, Hydro-Québec Distribution prepares a supply plan covering the next 10 years. This supply plan presents forecasts of Hydro-Québec Distribution’s customers’ electricity requirements, taking into account energy efficiency measures, along with the various means that Hydro-Québec Distribution intends to use to ensure a secure supply of electricity for Québec. The Electricity Supply Plan 2017–2026 was filed with the Energy Board in November 2016 and a final decision should be issued later in 2017. The first progress report of the Electricity Supply Plan 2017–2026 is expected to be filed with the Energy Board by November 2017.
Hydro-Québec Distribution has taken various measures to ensure balance between supply and demand in Québec, including:
Further to a call for tenders issued in July 2015, a three-year contract for wind integration services beginning on September 1, 2016 was signed with Hydro-Québec Production in January 2016 and approved by the Energy Board in June 2016;
An agreement for the suspension of electricity production at TransCanada Energy’s Bécancour generating station was approved by the Energy Board in May 2014 (the accounting for this agreement is described in “Note 3 to the 2016 Consolidated Financial Statements” under “Regulatory Assets – Costs related to a suspension agreement”); and
Hydro-Québec Distribution made 0.1 TWh of short-term transactions in 2016.
Additional calls for tenders could be made in the coming years in order to maintain this balance (see “Regulatory Framework – Energy Board Act”).
ELECTRICITY RATES
Under the applicable provisions of the Energy Board Act, rates are fixed or modified by the Energy Board (see “Regulatory Framework – Energy Board Act”). Rates are fixed to allow recovery of authorized service costs, including estimated supply costs, and a reasonable rate of return on shareholder’s equity.
In March 2017, the Energy Board authorized an electricity rate increase of 0.7% applicable to all customers except for Rate L customers, for which the rate increase is 0.2%. The new rates are effective as of April 1, 2017.
The following table shows the rate change which took effect in each year and the average rate increase (decrease) for the year, from 2012 to 2017, as well as annual inflation rates:
2012 2013 2014 2015 2016 2017 Rate increase (decrease) as of April 1 (0.45)% 2.41% 4.27%a 2.86%a 0.7%a 0.7%a
Average rate increase (decrease) from January 1 to December 31 (0.4)% 1.7% 3.8%b 3.2%b 1.2%b 0.7%b
Inflation Ratec 1.5% 0.9% 2.0% 1.1% 1.4% 2.0%d
a) Excluding Rate L, for which the increase is 3.45% in 2014, 2.49% in 2015, 0% in 2016 and 0.2% in 2017. b) Excluding Rate L. c) Canadian Consumer Price Index for the calendar year. d) Estimate.
- 17 -
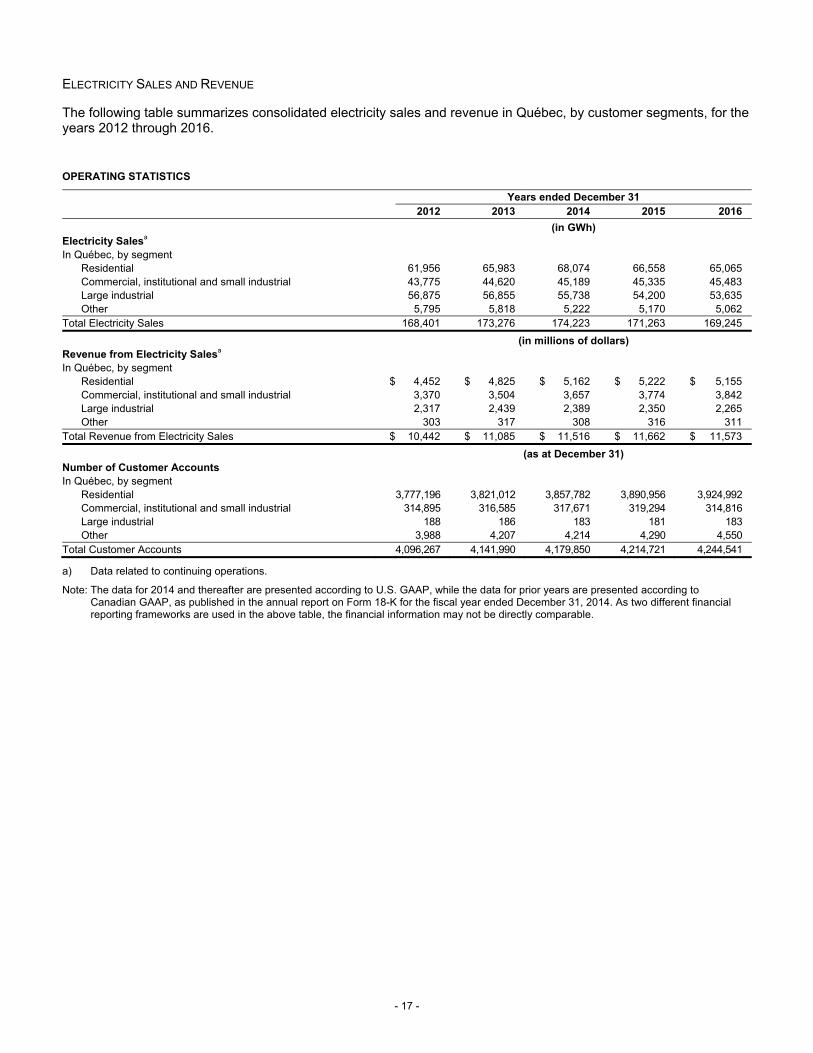
ELECTRICITY SALES AND REVENUE
The following table summarizes consolidated electricity sales and revenue in Québec, by customer segments, for the years 2012 through 2016.
OPERATING STATISTICS Years ended December 31
2012 2013 2014 2015 2016
(in GWh) Electricity Salesa In Québec, by segment
Residential 61,956 65,983 68,074 66,558 65,065 Commercial, institutional and small industrial 43,775 44,620 45,189 45,335 45,483 Large industrial 56,875 56,855 55,738 54,200 53,635 Other 5,795 5,818 5,222 5,170 5,062
Total Electricity Sales 168,401 173,276 174,223 171,263 169,245
(in millions of dollars) Revenue from Electricity Salesa In Québec, by segment
Residential $ 4,452 $ 4,825 $ 5,162 $ 5,222 $ 5,155 Commercial, institutional and small industrial 3,370 3,504 3,657 3,774 3,842 Large industrial 2,317 2,439 2,389 2,350 2,265 Other 303 317 308 316 311
Total Revenue from Electricity Sales $ 10,442 $ 11,085 $ 11,516 $ 11,662 $ 11,573
(as at December 31) Number of Customer Accounts In Québec, by segment
Residential 3,777,196 3,821,012 3,857,782 3,890,956 3,924,992 Commercial, institutional and small industrial 314,895 316,585 317,671 319,294 314,816 Large industrial 188 186 183 181 183 Other 3,988 4,207 4,214 4,290 4,550
Total Customer Accounts 4,096,267 4,141,990 4,179,850 4,214,721 4,244,541
a) Data related to continuing operations.
Note: The data for 2014 and thereafter are presented according to U.S. GAAP, while the data for prior years are presented according to Canadian GAAP, as published in the annual report on Form 18-K for the fiscal year ended December 31, 2014. As two different financial reporting frameworks are used in the above table, the financial information may not be directly comparable.

- 18 -
CONSTRUCTION
The Construction segment includes activities related to the projects carried out by Hydro-Québec Innovation, équipement et services partagés and SEBJ.
Hydro-Québec Innovation, équipement et services partagés is responsible for construction and refurbishment projects throughout Québec, except in the territory governed by the JBNQA. SEBJ builds generating facilities in the territory governed by the JBNQA (north of the 49th parallel) and may also carry out certain projects elsewhere in Québec and outside the province.
As engineering, construction and environmental specialists, Hydro-Québec Innovation, équipement et services partagés and SEBJ offer Hydro-Québec Production and Hydro-Québec TransÉnergie a variety of services needed for draft-design studies, impact assessments and other undertakings in the context of energy-related projects. These services include technical and scientific surveys, planning, cost estimates, design, architecture, geomatics and quality control.
CORPORATE AND OTHER ACTIVITIES
Corporate activities include the Financial Management and Control Group, the Corporate Affairs and General Secretariat Vice Presidency, the Financing, Treasury and Pension Fund Vice Presidency and the Human Resources Vice Presidency. Other activities include Information and Communication Technologies Vice Presidency, Business Development, Acquisitions and Strategies Vice Presidency, Subsidiary Management Unit, Hydro-Québec Research Institute Unit, Shared Services Centre Unit and Strategic Procurement Unit.
The following are included under Corporate and Other Activities:
Hydro-Québec CapiTech inc. (“Hydro-Québec CapiTech”) (wholly-owned; a venture capital company investing in businesses that provide energy-related high-technology products and services);
Hydro-Québec IndusTech inc. (“Hydro-Québec IndusTech”) (wholly-owned; the corporation’s mission is to partner with the private sector in industrializing and marketing technologies resulting from our research activities); and
Institut de recherche d’Hydro-Québec (“IREQ”) (our energy-technology research and development division).
Following a restructuring that took effect in January 2017, we now have two new corporate units:
Communications and Governement Affairs Vice Presidency, tasked with continuing to implement our proactive communication strategy; and
Transformation, Health and Safety Vice Presidency, responsible for efforts to transform the corporate culture and improve performance, as well as overseeing occupational health and safety.
In addition, the activities handled by the Subsidiary Management Unit now fall under the responsibility of the Business Development, Acquisitions and Strategies Vice Presidency, which was renamed Business Development Vice Presidency. For its part, the Corporate Affairs and General Secretariat Vice Presidency continues to provide support to the Board of Directors and remains in charge of services related to sustainable development and legal affairs.

- 19 -
CORPORATE OUTLOOK
DEVELOPMENT STRATEGY
We plan to invest approximately $4 billion in 2017, most of which would be allocated to the operations of Hydro-Québec TransÉnergie ($2.2 billion) and Hydro-Québec Production ($1.1 billion). Almost 60% of our investments are expected to be earmarked for facility maintenance and improvements. The remainder is expected to go toward growth and development activities.
Hydro-Québec Production intends to continue its work on the Romaine complex jobsites in the course of developing Québec’s hydroelectric potential. Two of the four generating stations in this major project, Romaine-2 and Romaine-1, were commissioned in 2014 and 2015, respectively. The division plans to bring Romaine-3 (395 MW) generating station onstream in 2017 and Romaine-4 (245 MW) in 2020. At the same time, it expects to continue investing to ensure the long-term operability of its facilities and optimize their output. For instance, refurbishment is under way at Robert-Bourassa, Beauharnois and Carillon generating stations.
Hydro-Québec TransÉnergie intends to devote a large part of its investments to erecting transmission lines, in particular the line connecting Chamouchouane substation to Judith-Jasmin substation as part of the 735-kV Chamouchouane–Bout-de-l’Île project and the 120-kV Grand-Brûlé–Saint-Sauveur supply line. In addition, it expects to continue connecting wind farms built in response to Hydro-Québec Distribution’s calls for tenders, working on Judith-Jasmin substation and connecting the Romaine complex as part of the project to expand the transmission system in the Minganie region. The division also plans to continue investing in upgrading and modernizing its facilities to ensure the reliability and long-term operability of its transmission assets and enhance service quality. An example of the latter is the ongoing work to replace 280 PK type circuit breakers.
Hydro-Québec Distribution intends to continue to deliver reliable power and high-quality services to Québec customers. It plans to make further investments to handle the growth of the Québec customer base and to maintain and improve the quality of its facilities. Its growth projects include connecting Judith-Jasmin substation to the distribution system.
In June 2016, we presented our five-year Strategic Plan (the “Strategic Plan”) for the 2016-2020 period. This Strategic Plan was reviewed by a parliamentary commission in September 2016.
The Strategic Plan places customers at the heart of Hydro-Québec’s priorities and sets new growth avenues for the company through the acquisition of assets or stakes outside Québec. It focuses on four major objectives:
Lay the groundwork to double our revenue over the next 15 years so as to increase profits;
Be a benchmark in customer service;
Contribute to Québec’s economic development and energy transition; and
Keep rate increases lower than or equal to inflation.
More specifically, we plan to:
Achieve an overall public satisfaction rating above 90%;
Install 2,500 charging stations for electric vehicles by 2020;
Contribute to the Northern Plan with investments of nearly $4.3 billion, in part by adding 1,140 MW of capacity to our facilities;
Generate annual revenue of $27 billion by 2030; and
Reach net income of $3.2 billion in 2020 and $5.2 billion in 2030.
WATER-POWER ROYALTIES
As stipulated in the Watercourses Act (Québec), Hydro-Québec Production pays the same statutory royalties as those paid by private producers of hydro-electricity in Québec. These water-power royalties, earmarked for the
- 20 -
Government’s Generations Fund, consist of a statutory royalty for the electricity delivered during the year and a contractual royalty payable pursuant to the contract awarded for the operation of a generation station.
For 2017, these royalties, indexed annually to the Consumer Price Index, consist of:
a statutory royalty of $3.20 ($3.16, $3.12 and $3.07, for 2016, 2015 and 2014, respectively) per thousand kilowatt-hours of electricity produced; and
a contractual royalty of $0.75 ($0.74, $0.73 and $0.72, for 2016, 2015 and 2014, respectively) per thousand kilowatt-hours of electricity produced.
These royalties totaled $667 million in 2016, $654 million in 2015 and $651 million in 2014.
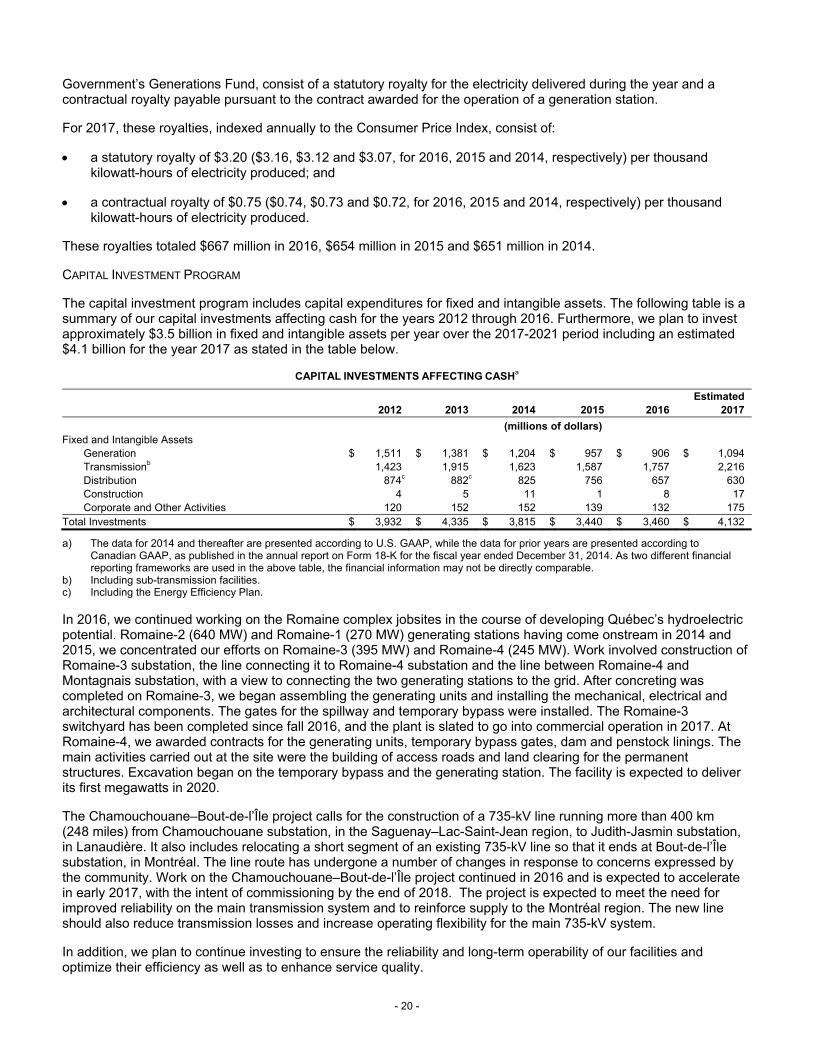
CAPITAL INVESTMENT PROGRAM
The capital investment program includes capital expenditures for fixed and intangible assets. The following table is a summary of our capital investments affecting cash for the years 2012 through 2016. Furthermore, we plan to invest approximately $3.5 billion in fixed and intangible assets per year over the 2017-2021 period including an estimated $4.1 billion for the year 2017 as stated in the table below.
CAPITAL INVESTMENTS AFFECTING CASHa
Estimated 2012 2013 2014 2015 2016 2017
(millions of dollars) Fixed and Intangible Assets
Generation $ 1,511 $ 1,381 $ 1,204 $ 957 $ 906 $ 1,094 Transmissionb 1,423 1,915 1,623 1,587 1,757 2,216 Distribution 874c 882c 825 756 657 630 Construction 4 5 11 1 8 17 Corporate and Other Activities 120 152 152 139 132 175
Total Investments $ 3,932 $ 4,335 $ 3,815 $ 3,440 $ 3,460 $ 4,132
a) The data for 2014 and thereafter are presented according to U.S. GAAP, while the data for prior years are presented according to Canadian GAAP, as published in the annual report on Form 18-K for the fiscal year ended December 31, 2014. As two different financial reporting frameworks are used in the above table, the financial information may not be directly comparable.
b) Including sub-transmission facilities. c) Including the Energy Efficiency Plan.
In 2016, we continued working on the Romaine complex jobsites in the course of developing Québec’s hydroelectric potential. Romaine-2 (640 MW) and Romaine-1 (270 MW) generating stations having come onstream in 2014 and 2015, we concentrated our efforts on Romaine-3 (395 MW) and Romaine-4 (245 MW). Work involved construction of Romaine-3 substation, the line connecting it to Romaine-4 substation and the line between Romaine-4 and Montagnais substation, with a view to connecting the two generating stations to the grid. After concreting was completed on Romaine-3, we began assembling the generating units and installing the mechanical, electrical and architectural components. The gates for the spillway and temporary bypass were installed. The Romaine-3 switchyard has been completed since fall 2016, and the plant is slated to go into commercial operation in 2017. At Romaine-4, we awarded contracts for the generating units, temporary bypass gates, dam and penstock linings. The main activities carried out at the site were the building of access roads and land clearing for the permanent structures. Excavation began on the temporary bypass and the generating station. The facility is expected to deliver its first megawatts in 2020.
The Chamouchouane–Bout-de-l’Île project calls for the construction of a 735-kV line running more than 400 km (248 miles) from Chamouchouane substation, in the Saguenay–Lac-Saint-Jean region, to Judith-Jasmin substation, in Lanaudière. It also includes relocating a short segment of an existing 735-kV line so that it ends at Bout-de-l’Île substation, in Montréal. The line route has undergone a number of changes in response to concerns expressed by the community. Work on the Chamouchouane–Bout-de-l’Île project continued in 2016 and is expected to accelerate in early 2017, with the intent of commissioning by the end of 2018. The project is expected to meet the need for improved reliability on the main transmission system and to reinforce supply to the Montréal region. The new line should also reduce transmission losses and increase operating flexibility for the main 735-kV system.
In addition, we plan to continue investing to ensure the reliability and long-term operability of our facilities and optimize their efficiency as well as to enhance service quality.

- 21 -
Allocation of Capital Expenditures for the Generation, Transmission and Distribution Business Segments
The following tables summarize the allocation of estimated capital expenditures for 2017 among our three major business segments:
GENERATION BUSINESS SEGMENT
Available
Power Planned Date of Operation
Estimated Capital Expenditures 2017
(MW) (millions of dollars) ASSET SUSTAINMENT AND OPTIMIZATION
Refurbishment and refitting of generating stations – Continuous program $ 470 HYDROELECTRIC DEVELOPMENT PROJECTS
Romaine complex 1,550 2014–2020 598 Other generation projects – – 26
624 Total $ 1,094
TRANSMISSION BUSINESS SEGMENTa
Planned Date of Operation
Estimated Capital Expenditures 2017
(millions of dollars) ASSET SUSTAINMENT AND OPTIMIZATION
Reliability and long-term operability Continuous program $ 1,467 SYSTEM GROWTH PROJECTS
Chamouchouane-Bout-de-l’Île 735-kV line 2018 236 Wind power integration – 4th call for tenders (450 MW) 2016–2019 143 Expansion of transmission system in Minganie 2014–2020 63 Other 307
749 Total $ 2,216
a) Including sub-transmission facilities.
DISTRIBUTION BUSINESS SEGMENTa
Estimated Capital Expenditures
2017
(millions of dollars) ASSET SUSTAINMENT AND OPTIMIZATION
Reliability and long-term operability $ 308 DEVELOPMENT PROJECTS 322 Total $ 630
a) Including investments in distribution facilities and investments in generation and transmission facilities of our off-grid systems.
Cash Requirements
The total estimated cash requirements for 2017 are approximately $7.5 billion, broken down as follows: approximately $4.1 billion for capital investments, approximately $1.3 billion for long-term debt repayment and approximately $2.1 billion for the payment of the dividend declared for 2016. Our self-financing ratio (defined as cash flows from operating activities less dividend paid, divided by the sum of cash flows from investing activities, excluding net disposal or acquisition of short-term investments, and repayment of long-term debt) is expected to be 61.1% in 2017, compared to 58.8% in 2016.

- 22 -
REGULATORY FRAMEWORK
Hydro-Québec Act
Under the provisions of the Hydro-Québec Act, we are mandated to supply power and to pursue endeavors in energy-related research and promotion, energy conversion and conservation, and any field connected with or related to power or energy.
Under the Hydro-Québec Act, the Government is entitled to declare a dividend from Hydro-Québec when certain financial criteria are met (see “Note 16 to the 2016 Consolidated Financial Statements”). Our dividend policy is to distribute 75% of our net income.
Energy Board Act
The Act respecting the Régie de l’énergie (the “Energy Board Act”), enacted in 1996, grants the Energy Board exclusive authority to fix or modify our rates and conditions for the transmission and distribution of electric power in Québec. Hydro-Québec TransÉnergie and Hydro-Québec Distribution’s activities in Québec are therefore regulated. Under this legislation, rates are set by reasoned decision of three commissioners after public hearings. Moreover, the Energy Board Act stipulates that rates are determined on a basis that allows for recovery of the cost of service including a reasonable return on the rate base.
The Energy Board consists of seven full-time members appointed by the Government and, in the exercise of its functions, is charged with reconciling the public interest, consumer protection and the fair treatment of the electric power carrier and of distributors.
Under the Energy Board Act, we have been granted exclusive rights for the distribution of electric power throughout Québec, excluding the territories served by distributors operating a municipal or private electric system as of May 13, 1997.
The Energy Board has the authority to:
fix, or modify, after holding public hearings, our rates and conditions for the transmission and distribution of electric power;
approve our electric power supply plan;
designate a reliability coordinator for Québec and adopt the reliability standards submitted by the designated reliability coordinator;
authorize our transmission and distribution investment projects;
approve our distribution commercial programs; and
rule upon complaints from customers concerning rates or services.
The Energy Board Act was amended in 2010 to allow a gradual increase of the cost of the Heritage Pool Electricity starting in 2014. The Energy Board Act was subsequently amended by replacing the gradual increases of the average cost of the Heritage Pool Electricity with the indexation of the average cost of the Heritage Pool Electricity.
In accordance with its authority relating to rate determination, the Energy Board has initiated a process to establish performance-based regulation mechanisms for Hydro-Québec Distribution and Hydro-Québec TransÉnergie starting in 2018.
Effective 2017, surplus earnings realized from carrying on transmission and distribution activities in Québec will be subject to an earnings sharing mechanism. Earnings in excess of the authorized rate of return will be shared with customers in the following proportions:
50/50 sharing for the first 100 basis points above the authorized rate of return; and
75% customers and 25% Hydro-Québec, beyond 100 basis points.
Any shortfall will be absorbed by us.

- 23 -
Generation
The Energy Board’s jurisdiction does not extend to generation.
Transmission
Transmission rates and service conditions are subject to approval by the Energy Board.
In March 2017, further to the decision on merits issued by the Energy Board, the following transmission rates, to be effective January 1, 2017, were filed: $76.13/kW/year for firm long-term point-to-point transmission service and an amount payable for the native load transmission service of $2,859.1 million per year. The filed revenue for rate setting purposes totaled $3,248.2 million for short- and long-term point-to-point transmission services and native load. The final decision is pending.
The Direction – Contrôle des mouvements d’énergie (System Control Unit) of Hydro-Québec TransÉnergie is Reliability Coordinator for transmission systems in Québec as designated by the Energy Board.
Distribution
Electricity required to meet Québec’s needs in excess of the Heritage Pool Electricity must be purchased through a competitive bidding process. Purchase contracts for electricity in excess of the Heritage Pool Electricity are subject to the approval of the Energy Board.
In March 2017, the Energy Board authorized an electricity rate increase, beginning April 1, 2017, of 0.7% applicable to all customers except for Rate L customers, for which the rate increase is 0.2%.
National Energy Board Act
Our exports of electric power are subject to the National Energy Board Act which provides that a permit or license must be obtained from the National Energy Board of Canada (the “National Board”) for such exports. We hold the following permits for short-term exports (contracts of five years or less):
one permit expiring on December 31, 2020 authorizing us to export annually up to 30 TWh of combined firm and interruptible energy to the United States;
one permit granted to our subsidiary, HQEM, expiring on April 7, 2019. This permit authorizes HQEM, as a power marketer, to export annually up to 30 TWh of firm and interruptible energy and up to 6,000 MW of power from interconnections located in other provinces.
Each of these permits allows us to take advantage of the spot market in the United States; however‚ long-term export contracts (more than five years) require prior issuance of specific permits or licenses by the National Board.
The National Board also regulates international power lines and we operate our interconnections with the United States in accordance with the terms and conditions of Certificates of Public Convenience and Necessity issued by the National Board.
Environmental Regulation
Our activities are subject to federal and provincial environmental laws and regulations, and, to some extent, municipal by-laws.
Before beginning new construction, our projects are subject to environmental impact assessment studies as well as information and consultation processes. The studies are submitted for review and approval to government departments and agencies responsible for issuing governmental authorizations. In some instances, the approval process includes public hearings by an independent body.
Environmental protection is a central concern of Hydro-Québec. Most activities that have an impact on the environment are governed by ISO 14001 – certified environmental management systems. ISO 14001 is the environmental management standard of the International Organization for Standardization. In addition, we annually review our management of environmental issues and publish a Sustainability Report.

- 24 -
The Government adopted the Sustainable Development Act (the “Sustainable Act”) in April 2006 and the Government Sustainable Development Strategy covering the period 2015-2020 (the “Government Strategy”) in 2015. As a Government-owned corporation, we are subject to the Sustainable Act and the Government Strategy and we published our own Sustainable Development Action Plan, covering the period 2015-2020 in July 2015.
LITIGATION
Innus of Uashat mak Mani-Utenam
On December 30, 2003, representatives of the Innus of Uashat mak Mani-Utenam (the “Uashaunnuat”) instituted an action against the Attorney-General of Canada, the Attorney-General of Québec and us (Superior Court, no 200-17-004196-036) seeking judicial recognition of their aboriginal rights and of their unextinguished Indian title over certain areas of land in Québec. Plaintiffs, who claim not to be parties to the JBNQA, allege that the Agreement and certain federal and provincial laws are illegal, inoperative, unconstitutional and not binding upon the plaintiffs. The plaintiffs seek various orders, including rendering of accounts and revenue sharing for the unlawful use and management of the lands, notably in respect of hydroelectric facilities on these lands, and awarding damages from Canada, Québec and us, jointly and severally, in an amount of up to $1.5 billion (subject to further increase by the plaintiffs).
On May 7, 2010, the Uashaunnuat filed a motion before the Superior Court of Québec seeking an interlocutory injunction against the Attorney-General of Canada, the Attorney-General of Québec and us (Superior Court, no 500-17-050868-093) regarding, amongst other issues, our proposed construction of transmission lines to connect the Romaine River hydroelectric complex to our grid which, according to the Uashaunnuat, is being undertaken in violation of their ancestral rights on their alleged ancestral territory. In addition, the Uashaunnuat are raising various procedural claims relating to the environmental review conducted with respect to this project.
In April 2014, the parties agreed to suspend these legal proceedings (Superior Court, no 200-17-004196-036 and Superior Court, no 500-17-050868-093) given the ongoing settlement discussions. Regarding the action no 500-17-050868-093, the majority of Innu plaintiffs voluntarily withdrew their motion on March 27, 2015. On February 23, 2016, the Superior Court dismissed the motion with respect to the remaining applicants. An appeal of the decision was filed by the remaining applicants on March 24, 2016. However, this appeal was irregularly filed and in view of the time-limits, the legal proceedings related to the 2010 motion seeking an interlocutory injunction and various other claims related to the environmental review may now be considered settled.
Innus of Pessamit
In November 2006, the Innus of Pessamit re-activated an action which was filed in 1998 against the Attorney-General of Canada, the Attorney-General of Québec and us (Superior Court, no 500-05-039472-988) seeking judicial recognition of their aboriginal rights and title over certain areas of land in Québec where our Manicouagan-Outardes hydroelectric facilities are located. By amendment, this community attempted to increase its initial claim of $500 million to $10.8 billion and to add annual compensation payments of $657 million from us. The request for amendment was rejected by Québec’s Superior Court and Court of Appeal in 2011. The case concerning the initial amount of $500 million remains outstanding. With the Attorney-General of Québec, we are challenging the legitimacy of this claim. At the request of the Innus of Pessamit, this file was suspended until January 2017. The Innus of Pessamit are currently in the process of substituting their attorney on file. On February 20, 2017, the Innus of Pessamit have obtained an additional period (until September 30, 2017) to review the file. During this period, no action will be taken by the parties.
CF(L)Co
On February 23, 2010, CF(L)Co instituted proceedings against us (Superior Court, no 500-17-056518-106) seeking the modification, as of November 30, 2009, of the pricing terms under the 1969 Power Contract (see “Generation Operations – Electricity Purchases”) by increasing the pricing terms payable by us to CF(L)Co. Alternatively, CF(L)Co is seeking the cancellation of the 1969 Power Contract with effect six months from the date of judgment. The 1969 Power Contract was already contested on two prior occasions before the courts and the Supreme Court of Canada dismissed those proceedings. The hearing took place in the fall of 2013. In July 2014, the Superior Court of Québec rendered its decision dismissing CF(L)Co’s request and confirming Hydro-Québec’s rights under the 1969 Power Contract. CF(L)Co filed an appeal before the Québec Court of Appeal (no 500-09-024690-141), and in August 2016, that court rendered its decision dismissing CF(L)Co’s request and confirming Hydro-Québec’s rights under the 1969 Power Contract. On September 30, 2016, CF(L)Co applied for leave to appeal to the Supreme Court
- 25 -
of Canada from the judgment of the Québec Court of Appeal. On April 20, 2017, the Supreme Court of Canada granted leave to appeal.
In July 2013, we instituted proceedings against CF(L)Co before the Superior Court of Québec to determine the interpretation of two essential rights, which are provided in the 1969 Power Contract (Superior Court, no 500-17-078217-133). In August 2016, the Superior Court of Québec rendered its decision, confirming Hydro-Québec’s rights (this decision was rectified on November 8, 2016 but did not change its conclusions). On September 7, 2016, CF(L)Co filed an appeal before the Québec Court of Appeal (no 500-09-026327-163), which remains pending.
EMPLOYEES
We had 19,552 employees as at December 31, 2016 composed of 17,282 permanent employees and 2,270 temporary employees. These numbers do not include employees of our subsidiaries and joint ventures. Unionized employees represent 84% of our work force.
Eight collective agreements govern the working conditions of our unionized employees and they all extend to 2018 or 2019.
- 26 -
MANAGEMENT’S DISCUSSION AND ANALYSIS
This Management’s Discussion and Analysis should be read in conjunction with our consolidated financial statements and the notes thereto. The financial information and tabular amounts presented herein are expressed in Canadian dollars, unless otherwise indicated. The consolidated financial statements take into account the decisions handed down by the Energy Board with respect to the transmission and distribution of electricity.
This analysis contains statements based on estimates and assumptions concerning future results and the course of events. Given the risks and uncertainties inherent in any forward-looking statements, our actual future results could differ from those anticipated. Finally, the information contained herein takes into account any significant event that occurred on or before the date of publication of this Annual Report.
OVERVIEW
Our net income remained high in 2016, at $2,861 million, even as temperatures returned to near normal on the Québec market after two years marked by very cold winters. We were able to capitalize on our commercial and operational expertise to export a record volume of electricity, which mitigated the impact of lower prices on energy markets. As a result, we expect to pay a dividend of $2,146 million to our shareholder, the Québec government.
Exports
Net electricity exports rose by 3.3 TWh compared to 2015, reaching a historic high of 32.6 TWh and contributing $803 million to net income. This is a 1.8-TWh increase over the previous record, set in 2013, made possible by the smooth operation of generating and transmission facilities, in particular, as well as high runoff and favorable weather conditions. These factors, combined with the skillful development and deployment of the sales strategy, enabled us to take advantage of business opportunities on external markets. The record volume of exports was achieved despite the unavailability of a major power transmission link between Québec and New England in April and May 2016 due to scheduled maintenance.
Finally, because of the high runoff in 2016, we ended the year with record reservoir storage of 138.2 TWh.
Investments
Our investment program totaled $3,460 million in 2016, mainly because of the continuation of major projects in the generation and transmission segments.
The largest project under way was still the construction and connection of the Romaine hydroelectric complex in the Côte-Nord region. This complex, consisting of four reservoir generating stations, is expected to have a total installed capacity of 1,550 MW, of which 910 MW is already in operation. A new milestone was reached in September with the completion of the dam at Romaine-3 (395 MW), slated for commissioning in 2017. Romaine-1 generating station (270 MW) came onstream at the end of 2015, allowing us to tap this new source of power during peak consumption periods in winter 2015–2016.
Work also went forward on the 735-kV Chamouchouane–Bout-de-l’Île project, which has two main components: first, construction of 735/120/25-kV Judith-Jasmin substation in Lanaudière; and, second, deployment of a 735-kV line extending more than 400 km between Chamouchouane substation, in the Saguenay–Lac-Saint-Jean region, and Judith-Jasmin substation, as well as the relocation of a short segment of an existing 735-kV line to Bout-de-l’Île substation, in Montréal. After clearing began in fall 2015, the project continued in 2016 with the launch of construction at Judith-Jasmin substation, among other things. Work is expected to be stepped up in 2017 in view of a 2018 start-up.
Contribution to Public Finances
For a fourth consecutive year, our contribution to the revenue of our sole shareholder, the Québec government, has exceeded the $4-billion mark. This amount includes our net income of $2,861 million, $667 million in water-power royalties, $284 million in public utilities tax and $218 million in guarantee fees related to debt securities.
- 27 -
CONSOLIDATED RESULTS
Net income
In 2016, we posted net income of $2,861 million, compared to $3,147 million in 2015. Hydro-Québec Production’s net electricity exports decreased by $77 million because of lower prices on energy markets, the impact of which was offset by a volume increase of 3.3 TWh, bringing net exports to a historic high of 32.6 TWh. On the Québec market, the return to near-normal temperatures in 2016 led to a $63-million decrease in supplies provided by Hydro-Québec Production to Hydro-Québec Distribution. Finally, financial expenses increased by $83 million, essentially on account of the foreign currency effect on working capital denominated in U.S. dollars.
Revenue
Revenue totaled $13,339 million, compared to $13,754 million in 2015. Revenue from electricity sales decreased by $163 million to $13,199 million. Sales in Québec generated $11,573 million, or $89 million less than the $11,662 million recorded in 2015. On markets outside Québec, revenue from electricity sales was $1,626 million, a decrease of $74 million. Other revenue amounted to $140 million, compared to $392 million in 2015.
The $89-million decrease in electricity sales in Québec resulted mainly from temperature variances, which led to a 2.9-TWh ($241-million) drop in volume. In 2015, first-quarter temperatures were, on average, 5°C lower than normal, resulting in additional sales of 4.3 TWh or $338 million; conversely, fourth-quarter temperatures were exceptionally mild, resulting in a 1.7-TWh or $130-million decrease in sales. In 2016, however, temperatures were closer to normal. This factor therefore had a $17-million negative impact in 2016, compared to a $224-million positive impact in 2015. The negative impact of temperature variances was mitigated by the April 1, 2015 and 2016 rate adjustments, which led to a $141-million increase in revenue. These rate adjustments, made to permit cost of service recovery, were approved by the Energy Board.
Revenue from electricity sales on markets outside Québec amounted to $1,626 million, compared to $1,700 million in 2015. This $74-million decrease was primarily due to lower prices on energy markets. The volume increase, combined with the positive impact of our risk management strategy, limited the impact of the decrease in prices.
Other revenue decreased by $252 million to $140 million in 2016, mainly because of the change in the net amounts that we are entitled to receive from customers or are required to pay to them, principally in connection with revenue variances related to climate conditions and variances in supply costs for electricity in excess of the heritage pool.
Expenditure
Total expenditure was $7,946 million in 2016, compared to $8,158 million in 2015.
Operating expenses amounted to $2,438 million, an $89-million decrease from the $2,527 million recorded in 2015. Strict management and tight control of expenses made it possible to absorb the increase in costs related to inflation, salary indexing and growth in operating assets. It should also be noted that our workforce numbered 19,552 at year end, the lowest in the past 40 years.
Electricity and fuel purchases totaled $1,866 million, a $72-million decrease compared to $1,938 million in 2015. This change is essentially due to a $60-million reduction in Hydro-Québec Distribution’s electricity purchases from third parties. On the one hand, short-term market purchases decreased by $93 million given that, in 2015, the division had to purchase large quantities of energy on the markets to meet ad hoc requirements resulting from the very cold winter temperatures. On the other hand, wind power purchases increased by $34 million, partly due to the commissioning of new wind farms and wind project phases.
Depreciation and amortization expense amounted to $2,597 million, a $116-million decrease compared to 2015. The amortization expense related to regulatory assets and liabilities declined by $177 million, mainly because of deferred charges related to the changeover to U.S. generally accepted accounting principles, which were recognized in 2015 and amortized in 2016 under the terms approved by the Energy Board. Furthermore, the depreciation of property, plant and equipment increased by $49 million, partly because of the commissioning of the two units at Romaine-1 generating station at the end of 2015.
Taxes were $1,045 million, compared to $980 million in 2015. The increase is due to three main factors: the recognition of a $15-million contribution payable to the Québec government under the Act to establish the Northern Plan Fund; a $13-million increase in water-power royalties on account of higher output and the indexing of the

- 28 -
applicable rate; and a $16-million rise in the public utilities tax resulting from an increase in the tax base, itself due to growth in the net value of taxable assets.
Financial expenses totaled $2,532 million in 2016, compared to $2,449 million the previous year. This increase is essentially due to the foreign currency effect on working capital denominated in U.S. dollars. The marked depreciation of the Canadian dollar in 2015 had resulted in the recognition of a significant exchange gain.
2016 2015
OPERATIONS AND DIVIDEND ($M)
Revenue 13,339 13,754
Operating income 5,393 5,596
Net income 2,861 3,147
Dividend 2,146 2,360
BALANCE SHEETS ($M)
Total assets 75,167 75,199
Property, plant and equipment 62,691 61,558
Long-term debt, including current portion and perpetual debt 45,909 45,983
Equity 19,704 19,475
FINANCIAL RATIOS
Return on equity from continuing operations (%)a 13.1 14.9
Capitalization (%)b 30.5 30.1
Profit margin (%)c 21.4 22.9
Interest coveraged 2.16 2.20
Self-financing (%)e 58.8 82.8
a) Income from continuing operations divided by average equity less average accumulated loss from discontinued operations for prior years and average accumulated other comprehensive income. For 2016 and 2015, the denominator amounted to $21,842 million and $21,091 million, respectively. We did not record any amount with respect to discontinued operations in 2016 or 2015, such that net income corresponds to income from continuing operations.
b) Equity divided by the sum of equity, long-term debt, current portion of long-term debt, perpetual debt, borrowings and derivative instrument liabilities, less derivative instrument assets and sinking fund.
c) Net income divided by revenue. d) Sum of operating income and net investment income divided by interest on debt securities. e) Cash flows from operating activities less dividend paid, divided by the sum of cash flows from investing activities, excluding net disposal or
acquisition of short-term investments, and repayment of long-term debt.
CASH AND CAPITAL MANAGEMENT
Operating activities
Cash flows from operating activities totaled $5.5 billion in 2016, compared to $6.2 billion in 2015. These funds were used to pay the dividend for 2015 and to finance a large portion of the investment program, among other things.
Investing activities
In 2016, we invested $3.5 billion in property, plant and equipment and intangible assets, compared to $3.4 billion in 2015. Of the total, $1.5 billion was invested in development projects and $2.0 billion in maintaining or improving the quality of assets.
Hydro-Québec Production’s investments totaled $906 million. A large portion of this amount, $562 million, was devoted to development activities, mainly ongoing construction of the Romaine hydroelectric complex. The amounts allocated to ongoing asset maintenance and improvement totaled $344 million. Work included refurbishment at Robert-Bourassa, Beauharnois and Rapides-des-Quinze generating stations.
Capital spending at Hydro-Québec TransÉnergie totaled $1,757 million. Of this amount, $618 million was used to connect new hydroelectric and wind power facilities to the grid and increase transmission capacity. Construction projects included Romaine-3 substation, the line connecting it to Romaine-4 substation and the line extending from Romaine-4 substation to Montagnais substation. The division also continued work on the 735-kV Chamouchouane–Bout-de-l’Île project. Another $1,139 million was allocated to enhancing transmission asset reliability and sustainment, which mainly involved replacing equipment and modernizing facilities. In particular, the division allocated $114 million to the replacement of PK type circuit breakers.
Hydro-Québec Distribution invested $657 million, mainly to handle its growing customer base, ensure the long-term operability of the distribution system and enhance service quality.

- 29 -
Hydro-Québec Innovation, équipement et services partagés and Société d’énergie de la Baie James carry out engineering, construction and refurbishment projects for Hydro-Québec Production and Hydro-Québec TransÉnergie.
Financing activities
In 2016, our financing activities raised $2.0 billion on the Canadian capital market.
In May, we issued $1.0 billion in fixed-rate medium-term notes, at a cost of 1.1%. In August, we issued variable-rate notes for a total amount of $1.0 billion. These two series of notes will mature in 2019.
The proceeds were used to support part of the investment program and to refinance maturing debt.
SOURCES OF FINANCING
a) Of this amount, available balances of US$200 million and $232 million in Canadian or U.S. dollars are covered by operating credit line agreements with financial institutions.
b) Guaranteed by the Québec government. c) Includes a US$750-million swing loan. d) Corresponds to net proceeds from the issuance of medium-term notes.
Type of financing
Amount authorized by the Board of Directors
Market
Outstanding as at December 31, 2016
Operating credit lines C$ or US$1,000 milliona C$3.1 millionCredit facilityb US$2,000 millionc –Commercial paperb US$3,500 million or equivalent in C$ United States or Canada C$7.4 millionMedium-term notesb US$3,000 million or equivalent in other currencies
C$20,000 million or equivalent in US$ United States Canada
US$340 milliond
C$14,204 milliond

- 30 -
Dividend and capitalization
The dividend payable to the Québec government for 2016 is $2,146 million. Once this dividend is accounted for, the capitalization rate was 30.5% as at December 31, 2016.
SEGMENTED RESULTS
Operating Segments
As in 2015, we had four operating segments in 2016, namely Generation, Transmission, Distribution and Construction, as well as activities grouped under Corporate and Other Activities.
Generation: Hydro-Québec Production operates and develops our generating facilities. It generates electricity for the Québec market and exports power to wholesale markets in northeastern North America.
Transmission: Hydro-Québec TransÉnergie operates and develops our power transmission system. It markets system capacity and manages power flows throughout Québec.
Distribution: Hydro-Québec Distribution operates and develops our distribution system and supplies electricity to the Québec market. It also carries on activities related to electricity sales in Québec, provides customer services and promotes energy efficiency.
Construction: Hydro-Québec Innovation, équipement et services partagés and Société d’énergie de la Baie James (SEBJ) design, build and refurbish generating and transmission facilities, mainly for Hydro-Québec Production and Hydro-Québec TransÉnergie.
The following tables present information on segment results and assets:
2016
Segmented financial information ($M) Generation Transmission Distribution Construction
Corporate and Other Activities Hydro-Québec
Revenuea 6,482 3,215 11,514 2,225 1,746 13,339 Net income 1,870 561 342 1 87 2,861 Total assets 32,773 21,476 13,546 59 7,501 75,167
2015
Segmented financial information ($M) Generation Transmission Distribution Construction
Corporate and Other Activities Hydro-Québec
Revenuea 6,624 3,308 11,834 2,098 1,714 13,754 Net income 2,130 559 364 – 94 3,147 Total assets 33,108 20,944 13,425 58 7,829 75,199
a) Segment data include revenue from both external and intersegment customers as presented in Note 20 to the consolidated financial statements, whereas our revenue figure reflects the intersegment eliminations and adjustments presented in that same note.
Note: Some of the prior year’s data have been reclassified to conform to the presentation adopted in the current year.
Generation
Under the Act respecting the Régie de l’énergie, Hydro-Québec Production is required to provide Hydro-Québec Distribution with a base volume of up to 165 TWh of heritage pool electricity annually. It may also compete for contracts under Hydro-Québec Distribution’s open tendering process and sells electricity on wholesale markets as well.
The division operates 62 generating stations. Its capital projects serve a twofold objective: to ensure the long-term operability of existing facilities and to continue development of Québec’s hydroelectric potential.
Operating Results
Hydro-Québec Production posted net income of $1,870 million in 2016, compared to $2,130 million in 2015. Net electricity sales to Hydro-Québec Distribution totaled $4,820 million, a $63-million decrease primarily due to a reduction in peak supplies, which were greater in 2015 on account of the harsh winter. Net electricity exports totaled $1,568 million, or $77 million less than the $1,645 million recorded a year earlier, mainly because of lower prices on

- 31 -
energy markets, the impact of which was mitigated by growth in export volume. Taxes and financial expenses increased by $56 million and $76 million, respectively.
Electricity sales in Québec
Sales to Hydro-Québec Distribution
The total volume of electricity sales to Hydro-Québec Distribution was 159.1 TWh in 2016, compared to 160.8 TWh in 2015. Revenue from these sales decreased by $63 million from the $4,883 million posted in 2015, mainly as a result of temperatures, which deviated significantly from normal seasonal values in 2015. More specifically, the harsh winter conditions in the first quarter of 2015 led to an increase in peak supplies that was only partly offset by the lower sales resulting from the mild temperatures recorded in the fourth quarter. Since 2016 temperatures were, on average, closer to normal, the volume of electricity sales to Hydro-Québec Distribution decreased by 1.7 TWh compared to 2015.
Electricity sales outside Québec
Electricity sales outside Québec amounted to $1,626 million, compared to $1,700 million the previous year.
Net electricity exports, which factor in short-term electricity purchases, totaled $1,568 million for 32.6 TWh, a $77-million decrease compared to $1,645 million for 29.3 TWh in 2015. Export volume reached a record high in 2016, despite the unavailability of a major power transmission link between Québec and New England in April and May 2016 due to scheduled maintenance. The 3.3-TWh volume increase, combined with the positive impact of our risk management strategy, limited the impact of the lower prices on energy markets.
As at December 31, 2016, reservoir storage stood at a historic level, namely 138.2 TWh, compared to 126.9 TWh a year earlier. This increase was mainly attributable to natural water inflows that were 13.6 TWh higher than normal in 2016. The energy reserve fully meets the criteria set for management of risks related to the security of the energy supply.
Depreciation and amortization
Depreciation and amortization expense totaled $775 million in 2016, compared to $766 million in 2015. This increase partly results from the commissioning of the two units at Romaine-1 generating station at the end of 2015.
Taxes
Taxes were $848 million in 2016, compared to $792 million in 2015. Among other things, the increase is due to a $15-million contribution payable to the Québec government under the Act to establish the Northern Plan Fund and a $13-million increase in water-power royalties on account of higher output and the indexing of the applicable rate.
Financial expenses
Financial expenses totaled $1,205 million in 2016, compared to $1,129 million in 2015. This increase is essentially due to the foreign currency effect on working capital denominated in U.S. dollars. The marked depreciation of the Canadian dollar in 2015 had resulted in the recognition of a significant exchange gain.
Investing Activities
Investments in property, plant and equipment and intangible assets totaled $906 million in 2016. Of this amount, $562 million went toward development activities, mainly the continued construction of the Romaine hydroelectric complex.
Hydro-Québec Production also invested $344 million in asset sustainment and optimization. Work included refurbishment at Robert-Bourassa, Beauharnois and Rapides-des-Quinze generating stations.
Transmission
Hydro-Québec TransÉnergie operates and develops our power transmission system, one of the most extensive in North America. It markets system capacity and manages power flows throughout Québec, offering non-discriminatory access to its system to all market players in compliance with applicable regulatory requirements.

- 32 -
The division’s operations are regulated by the Energy Board.
Rate Cases
For 2016, the revenue authorized by the Energy Board for transmission rate-setting purposes totaled $3,113 million, namely $2,744 million for native-load transmission and $369 million for short- and long-term point-to-point transmission services. These amounts represent decreases of $58 million and $9 million, respectively, compared to 2015.
For 2017, Hydro-Québec TransÉnergie filed an application with the Energy Board requesting revenue of $3,306 million, namely $2,910 million for native-load transmission and $396 million for short- and long-term point-to-point transmission services. The Energy Board’s final ruling on this application is pending (see Energy Board decision in “Regulatory Framework – Transmission”).
Operating Results
Hydro-Québec TransÉnergie’s net income was $561 million in 2016, comparable to the $559 million recorded in 2015. The decrease in revenue from native-load transmission service was offset by a reduction in the amortization expense related to regulatory assets and liabilities, determined in accordance with the terms approved by the Energy Board.
Investing Activities
In 2016, Hydro-Québec TransÉnergie invested $1,757 million in property, plant and equipment and intangible assets, namely $618 million for growth projects and $1,139 million for asset sustainment and reliability projects. The purpose of growth projects is to connect new hydroelectric facilities and wind farms to the grid or to increase transmission capacity in response to higher load demand or new customer requests. Asset sustainment and reliability projects involve keeping facilities in good operating condition, maintaining and improving service quality and complying with the legal and regulatory requirements for operating a power transmission system.
Growth projects under way in 2016 included continued work to connect the Romaine complex as part of the expansion of the transmission system in the Minganie region. In concrete terms, Hydro-Québec TransÉnergie invested $189 million to build Romaine-3 substation, the line connecting it to Romaine-4 substation and the line extending from Romaine-4 substation to Montagnais substation. The division also continued to integrate the output from wind farms built in response to the calls for tenders issued by Hydro-Québec Distribution, as well as from the Mesgi’g Ugju’s’n wind farm, for a total investment of $141 million. In addition, it allocated $177 million to the construction of a line and the relocation of a short segment of an existing line as part of the 735-kV Chamouchouane–Bout-de-l’Île project, an amount that also includes the transmission asset sustainment and system reliability component of the project.
In the asset sustainment and reliability category, Hydro-Québec TransÉnergie invested $114 million in the replacement of PK circuit breakers. At the end of this project, in 2017, it will have replaced 280 breakers at 34 transmission substations. The division also allocated $66 million (including the project’s growth component) to rebuilding De Lorimier substation and the related tap lines.
Distribution
Hydro-Québec Distribution provides electricity to the Québec market and delivers reliable power and quality services to its customers with a view to efficiency and sustainable development. In this context, it also promotes energy efficiency among its customers.
The division’s activities are regulated by the Energy Board, which has exclusive jurisdiction to set electricity rates. These rates are established to permit service cost recovery and a reasonable return on the rate base.
Rate Cases
In March 2016, the Energy Board authorized an average increase of 0.7% in all our electricity rates except the large-power industrial rate (Rate L), which remained unchanged. In accordance with the Act respecting the Régie de l’énergie, the indexing of the price of heritage pool electricity does not apply to Rate L customers. The new rates went into effect on April 1, 2016.

- 33 -
In July, Hydro-Québec Distribution filed an application with the Energy Board for a 1.6% rate adjustment for all customers except those at Rate L, for which the requested adjustment was 1.1%. The new rates would take effect on April 1, 2017. The main reasons for the 1.6% adjustment are the investments needed for transmission asset sustainment, higher electricity supply costs and lower-than-anticipated growth in demand for electricity. Other factors, such as a return to near-normal temperatures in winter 2015–2016 and the decrease in the cost of basic service, partly due to productivity gains, limited the increase requested.
The cumulative average rate adjustment index for 1998 to 2016 is 129.9, while the Consumer Price Index for the same period is 140.5.
The Energy Board’s ruling on this application was issued in March 2017 (see Energy Board decision in “Regulatory Framework – Distribution”).
Supplying the Québec Market
Hydro-Québec Distribution depends on various sources to supply the Québec market, mainly the heritage pool of 165 TWh, which it purchases from Hydro-Québec Production. It also issues short- and long-term calls for tenders. For requirements of less than three months, it may also buy electricity directly on the market, without tendering, under an authorization granted by the Energy Board. For unforeseen needs that could not be met otherwise, the division relied on a framework agreement with Hydro-Québec Production that covered the period from January 1, 2014, to December 31, 2016, and was approved by the Energy Board in December 2013. In September 2016, the Energy Board approved the renewal of this agreement for the period from January 1, 2017, to December 31, 2019.
In November 2016, Hydro-Québec Distribution filed its Electricity Supply Plan 2017–2026 with the Energy Board. The plan anticipates average yearly growth of 0.4% in energy needs and 0.6% in capacity needs over the next 10 years.
Finally, Hydro-Québec Distribution is continuing its efforts to promote energy efficiency. Among other things, it is developing an integrated offer based on an educational approach that encourages customers to make lasting changes in their habits. In addition, the division constantly adjusts its programs according to market needs and our requirements, and ensures that its initiatives are in line with those of its various partners.
Operating Results
Hydro-Québec Distribution recorded net income of $342 million in 2016, compared to $364 million in 2015, a decrease of $22 million. Revenue from electricity sales decreased by $89 million, mainly because of a volume reduction that was essentially due to temperature variances, and the impact of which was mitigated by the April 1, 2015 and 2016 rate adjustments. In addition, the change in the net amounts that we are entitled to receive from customers or are required to pay to them, particularly in connection with variances in supply costs for electricity in excess of the heritage pool and revenue variances related to climate conditions, had a negative impact of $215 million on other revenue. Electricity purchases, the related transmission costs and fuel purchases decreased by $198 million. This is because supplies purchased from Hydro-Québec Production and from third parties decreased by $63 million and $60 million, respectively, while transmission costs incurred with Hydro-Québec TransÉnergie declined by $48 million. Depreciation and amortization expense decreased by $27 million.

- 34 -
ELECTRICITY SALES IN QUÉBEC BY SEGMENT
Sales volume Sales revenue 2016 2016-2015 change 2016 2016-2015 change Market segment TWh TWh % $M $M % Residential 65.1 (1.5) (2.3) 5,155 (67) (1.3)Commercial, institutional and small industrial 45.5 0.2 0.4 3,842 68 1.8 Large industrial 53.6 (0.6) (1.1) 2,265 (85) (3.6)Other 5.1 (0.1) (1.9) 311 (5) (1.6)Total 169.3 (2.0) (1.2) 11,573 (89) (0.8)
FACTORS IN THE 2016–2015 CHANGE IN SALES BY SEGMENT
Volume effects Price effects Total Baseload demand Temperatures February 29 Total Rate adjustments Other Total Market segment TWh $M TWh $M TWh $M $M $M $M $M $M Residential 0.6 50 (2.4) (206) 0.3 22 (134) 74 (7) 67 (67)Commercial, institutional and
small industrial 0.4 40 (0.4) (31) 0.2 12 21 49 (2) 47 68 Large industrial (0.7) (50) – – 0.1 6 (44) 13 (54) (41) (85)Other – (3) (0.1) (4) – 1 (6) 5 (4) 1 (5)Total 0.3 37 (2.9) (241) 0.6 41 (163) 141 (67) 74 (89)
Electricity sales in Québec
Revenue from electricity sales totaled $11,573 million, an $89-million decrease from 2015 that was essentially due to temperatures, the impact of which was mitigated by the April 1, 2015 and 2016 rate adjustments.
Sales volume totaled 169.3 TWh, compared to 171.3 TWh in 2015, a decrease of 2.0 TWh. In 2015, first-quarter temperatures were, on average, 5°C lower than normal, resulting in additional sales of 4.3 TWh; conversely, fourth-quarter temperatures were exceptionally mild, resulting in a 1.7-TWh decrease in sales. In 2016, however, temperatures were closer to normal. This factor therefore had a $17-million negative impact in 2016, compared to a $224-million positive impact in 2015. The negative impact of temperatures was mitigated by additional sales of 0.6 TWh on February 29, since 2016 was a leap year.
Other revenue
The change in the net amounts that we are entitled to receive from customers or are required to pay to them, recognized as other revenue, was $215 million in 2016. This negative change mainly results from variances in supply costs for electricity in excess of the heritage pool and revenue variances related to climate conditions.
Variances in supply costs for electricity in excess of the heritage pool led to the recognition of $29 million payable to customers in 2016, compared to $120 million receivable from them in 2015. This $149-million difference is due to the fact that supply costs incurred in winter 2016 were lower than the previous year on account of milder temperatures.
The near-normal temperatures in 2016 also had an impact on revenue variances related to climate conditions, which correspond to differences between Hydro-Québec Distribution’s actual transmission and distribution revenue and the revenue forecasts established on the basis of climate normals for rate filing purposes. These variances led to the recognition of $11 million receivable from customers in 2016, compared to an amount payable of $115 million in 2015.
In addition, the amortization of variances from previous years had a negative impact of $223 million in 2016, compared to $26 million in 2015. The $197-million difference is mainly attributable to the amortization of variances in supply costs for electricity in excess of the heritage pool, given the very cold temperatures in the winters of 2013–2014 and 2014–2015. This expenditure was factored into the rate adjustment that took effect on April 1, 2016, as approved by the Energy Board.
Electricity purchases, transmission costs and fuel purchases
Electricity purchases, the related transmission costs and fuel purchases decreased by $198 million compared to 2015. Supplies from Hydro-Québec Production were $63 million lower, mainly due to temperatures, while third-party supplies decreased by $60 million, primarily on account of a $93-million reduction in short-term market purchases. In 2015, the division had to purchase large quantities of energy on the markets to meet ad hoc requirements resulting from the very cold winter temperatures. The reduction in short-term purchases was mitigated, however, by a
- 35 -
$34-million increase in wind power purchases, partly due to the commissioning of eight new wind farms or wind project phases at the end of 2015 and during 2016. Finally, transmission costs incurred with Hydro-Québec TransÉnergie decreased by $48 million.
Depreciation and amortization
Depreciation and amortization expense amounted to $779 million, a $27-million decrease from $806 million the previous year, essentially because of a reduction in the amounts recognized for asset retirement given that, in 2015, the massive rollout of next-generation meters had resulted in a large number of assets being retired.
Investing Activities
In 2016, Hydro-Québec Distribution’s investments in property, plant and equipment and intangible assets totaled $657 million.
Of this amount, $305 million was allocated to the growth of the Québec customer base, including $171 million for new customer connections. The division also invested $291 million in asset sustainment, of which $62 million went toward completing the rollout of the advanced metering infrastructure.
Construction
The Construction segment includes activities related to the projects carried out by Hydro-Québec Innovation, équipement et services partagés1 and by Société d’énergie de la Baie James (SEBJ).
Hydro-Québec Innovation, équipement et services partagés is responsible for construction and refurbishment projects throughout Québec, except in the territory governed by the James Bay and Northern Québec Agreement (JBNQA). SEBJ builds generating facilities in the territory governed by the JBNQA (north of the 49th parallel) and may also carry out certain projects elsewhere in Québec and outside the province.
As engineering, construction and environmental specialists, Hydro-Québec Innovation, équipement et services partagés and SEBJ offer Hydro-Québec Production and Hydro-Québec TransÉnergie a variety of services needed for draft-design studies, impact assessments and other undertakings in the context of energy-related projects. These services include technical and scientific surveys, planning, cost estimates, design, architecture, geomatics and quality control.
Volume of Activity
Hydro-Québec Innovation, équipement et services partagés and SEBJ carried out activities amounting to a total of $2,225 million in 2016, compared to $2,098 million the previous year. The high volume is attributable to several large-scale projects. Work done for Hydro-Québec Production totaled $746 million, compared to $798 million in 2015, while work done for Hydro-Québec TransÉnergie totaled $1,419 million, compared to $1,254 million.
Main projects
In the area of power generation, Hydro-Québec Innovation, équipement et services partagés continued construction of the Romaine hydroelectric complex and refurbishment of the structures at Beauharnois, Les Cèdres and La Gabelle generating stations. In addition, the division finished overhauling generating units at Robert-Bourassa, Rapides-des-Quinze, Rapide-2 and Rapide-7. For Hydro-Québec TransÉnergie, ongoing mandates included the connection of the Romaine complex and construction of several substations. The 735-kV Chamouchouane–Bout-de-l’Île project, launched in 2015, moved ahead as well. Work in progress also included reconstruction of De Lorimier substation and deployment of related lines, as well as various projects stemming from continued investment in asset reliability and sustainment, particularly the replacement of PK circuit breakers. Finally, the division worked on upgrading various facilities in the main transmission system while pursuing other projects to increase transmission system capacity.
1. The operations of the Direction principale – Institut de recherche d’Hydro-Québec, Direction principale – Centre
de services partagés and Direction principale – Approvisionnement stratégique are included under Corporate and Other Activities.

- 36 -
Corporate and Other Activities
As at December 31, 2016, the Corporate and Other Activities heading included all corporate activities, as well as the Vice-présidence – Technologies de l’information et des communications, Vice-présidence – Développement des affaires, acquisitions et stratégies, Direction principale – Gestion des filiales, Direction principale – Institut de recherche d’Hydro-Québec, Direction principale – Centre de services partagés and Direction principale – Approvisionnement stratégique.
Results
Corporate and Other Activities recorded net income of $87 million in 2016, comparable to the 2015 figure.
Corporate activities
As at December 31, 2016, corporate activities consisted of the Groupe – Direction financière et contrôle, Vice-présidence – Affaires corporatives et secrétariat général, Vice-présidence – Financement, trésorerie et caisse de retraite and Vice-présidence – Ressources humaines.
The Groupe – Direction financière et contrôle is responsible for overseeing financial, regulatory and management accounting frameworks as well as integrated business risk management. It also has the task of producing and analyzing our consolidated financial statements. Its other duties include financial planning, taxation, control and disbursements related to employees, retirees and suppliers.
The Vice-présidence – Affaires corporatives et secrétariat général develops strategies and provides support and advisory services in the areas of communications and public affairs, as well as relations with governments, communities and partner organizations. It is also responsible for services and expertise related to legal affairs, ethics and sustainable development. The Secrétariat général provides administrative support to the Board of Directors and Board committees as well as to our subsidiaries. The Secretary General also assists the Chairman of the Board in performing his duties and the President and Chief Executive Officer in carrying out Hydro-Québec’s mandate.
The Vice-présidence – Financement, trésorerie et caisse de retraite is in charge of meeting our financing requirements, managing our treasury and maintaining relations with our bondholders and rating agencies. It also acts as trustee of our pension fund. In 2016, the pension fund’s rate of return was 5.9% in a low-interest-rate environment. Over the past 10 years, it has posted an average annual return of 6.9%, placing it in the first decile of Canadian pension funds of comparable size. As at December 31, 2015, the date of the most recent actuarial valuation, the pension plan showed a funding surplus of $5.1 billion, which means that the assets held on that date were sufficient to cover future pension costs as well as the stabilization provision established under the requirements of the Act to amend the Supplemental Pension Plans Act mainly with respect to the funding of defined benefit pension plans. The pension plan’s funding ratio was 129.5% at that time.
The Vice-présidence – Ressources humaines develops strategies, guidelines, frameworks, corporate programs and objectives in matters pertaining to human resources management, labor relations, compensation and employee benefits, organizational performance, health and safety, as well as training and skills development. Moreover, it is responsible for all measures to ensure the safety of personnel and third parties as well as the security of our assets, facilities, and information and communication technologies.
Vice-présidence – Technologies de l’information et des communications
The mandate of the Vice-présidence – Technologies de l’information et des communications is to design, build, deploy, operate and maintain our information and telecommunications networks, systems, applications and infrastructure. With this in mind, it continues to implement an integrated vision with respect to governance, architecture, development, operations and cybersecurity. It offers the divisions and corporate units technology solutions designed to support the operation of the power system and to increase their productivity and efficiency, thereby contributing to our overall performance.
In 2016, this unit posted revenue of $666 million, compared to $627 million in 2015.
Investing activities
In 2016, the investments made by the Vice-présidence – Technologies de l’information et des communications totaled $103 million and were allocated to maintaining asset quality.

- 37 -
Vice-Présidence – Développement des affaires, acquisitions et stratégies
The mandate of the Vice-présidence – Développement des affaires, acquisitions et stratégies is to prospect for business opportunities and act on them so that we can not only increase our operating revenue and income from markets outside Québec, but also play a leading role in the global energy transition, in accordance with the strategies laid out in the Strategic Plan 2016–2020. In concrete terms, the unit is constantly on the lookout for potential international investments in the form of assets, stakes or long-term partnerships that will leverage our expertise in power generation and transmission. In addition, it is actively involved in marketing our technological innovations and developing our export markets by highlighting the benefits of Québec hydropower.
Direction principale – Gestion des filiales
The Direction principale – Gestion des filiales coordinates the activities and development of the technology subsidiaries reporting to the first-tier subsidiary Hydro-Québec IndusTech, including TM4, Technologies Esstalion and MIR Innovation, in such a way as to maximize their contribution to our growth objectives. It also commercializes our innovations in collaboration with the Vice-présidence – Développement des affaires, acquisitions et stratégies. In addition, it supports innovation related to transportation electrification and guides the deployment and expansion of the Electric Circuit in Québec and Ontario.
Direction principale – Institut de recherche d’Hydro-Québec
The Direction principale – Institut de recherche d’Hydro-Québec, which is part of Hydro-Québec Innovation, équipement et services partagés, develops and adapts leading-edge technology solutions according to our business requirements and objectives. It provides technical assistance to the divisions and carries out innovation projects to support their operations and ensure our long-term development.
Direction principale – Centre de services partagés and Direction principale – Approvisionnement stratégique
The Direction principale – Centre de services partagés and Direction principale – Approvisionnement stratégique are also part of Hydro-Québec Innovation, équipement et services partagés. The Direction principale – Centre de services partagés offers services pertaining to real estate management and materials management, as well as transportation and other specialized services, in order to contribute to our performance. The Direction principale – Approvisionnement stratégique provides us with procurement guidelines, products and services, in line with best practices.
The revenue of these two units totaled $485 million in 2016, compared to $490 million in 2015.
Subsequent organizational adjustments
Following a restructuring that took effect in January 2017, we now have two new top-level corporate units:
Vice-présidence – Communications et affaires gouvernementales, tasked with continuing to implement our proactive communication strategy;
Vice-présidence – Transformation, santé et sécurité, responsible for spearheading efforts to transform the corporate culture and improve performance, as well as overseeing occupational health and safety.
In addition, the activities handled by the Subsidiary Management Unit now fall under the responsibility of the Vice-présidence – Développement des affaires, acquisitions et stratégies, which was renamed Vice-présidence – Développement des affaires. For its part, the Vice-présidence – Affaires corporatives et secrétariat général continues to provide support to the Board of Directors and remains in charge of services related to sustainable development and legal affairs.
- 38 -
INTEGRATED BUSINESS RISK MANAGEMENT
We apply an integrated business risk management process as part of our ongoing activities. This process is supported by various control, communication and assessment mechanisms that enable us to monitor risk developments on a dynamic basis.
Our divisions and corporate units are central to the process. As part of their ongoing activities, they manage the risks to which they are exposed and reassess them on a regular basis, daily in some cases. In concrete terms, each division and corporate unit must identify and assess its main risks and then develop and apply mitigation measures to ensure that residual risks are at a level acceptable to us. The divisions and corporate units report monthly on their risk management activities and follow-up to the Management Committee, which then acts as a risk management committee to provide overall monitoring of business risks. This approach makes it possible to create a consolidated portfolio of residual business risks during the annual planning process. The consolidated portfolio is presented to the Board of Directors with the Business Plan, which includes a sensitivity analysis indicating the impact of certain risks on projected net income.
Financial Risks
In the course of our operations, we carry out transactions that expose us to certain financial risks, such as market, liquidity and credit risk. Systematic follow-up and the adoption of strategies that include the use of derivative instruments considerably reduce exposure to such risks and their impact on results.
To manage market and credit risk, a team of specialists that is independent of the units carrying out the transactions constantly monitors a number of indicators related to financial and energy transactions, recommends strategies and applies controls aimed at reducing risk.
Market risk
Our results are subject to three main types of market risk: currency risk, interest rate risk and risk associated with energy and aluminum prices. Fluctuations in the Canadian dollar’s exchange rate relative to the U.S. dollar affect revenue from sales denominated in U.S. dollars as well as the cost of U.S. dollar–denominated debt. Interest rate fluctuations affect financial expenses and pension costs. Finally, energy price fluctuations affect revenue from wholesale markets, while aluminum price fluctuations have an impact on revenue from special contracts with certain large industrial customers in Québec.
The three types of market risk are subject to active integrated management based mainly on the use of derivative financial instruments. The purpose of such management is to limit the impact of market risk on our results, according to strategies and criteria established based on our risk tolerance. In addition, market risk over the medium and long term is mitigated by the offsetting effect between the impact of a general increase or decrease in interest rates on financial expenses, on the one hand, and the impact of such an increase or decrease on pension costs, on the other.
Our pension costs are also subject to the risk of fluctuation in the fair value of investments held in the pension fund portfolio. To manage this risk, we rely on asset diversification and on investment management strategies that include the use of derivatives.
Liquidity risk
Liquidity risk is the risk that an entity will encounter difficulty in meeting obligations associated with its financial liabilities. This type of risk may translate into difficulties accessing sources of financing for its investment program.
Our liquidity risk is mitigated by several factors, including substantial cash flows generated by operating activities, access to a preauthorized standby credit facility and a diversified portfolio of highly liquid financial instruments.
Credit risk
Credit risk is the risk that a counterparty may not meet its contractual obligations. We are exposed to credit risk related to receivables through ongoing electricity sales in Québec. These sales are billed at rates that provide for cost recovery according to conditions approved by the Energy Board. We are also exposed to credit risk related to the cash equivalents, short-term investments and derivative instruments traded with financial institutions and other issuers and, to a lesser extent, with North American energy companies under Hydro-Québec Distribution supply contracts and Hydro-Québec Production energy transactions on markets outside Québec.
- 39 -
Exposure to credit risk is mitigated by the implementation of limits and frameworks for risk concentration and level of exposure by counterparty. To ensure compliance with such limits and frameworks, we take a proactive approach based on various controls and monitoring reports. These enable us to react quickly to any event that could have an impact on the financial position of our counterparties. In addition, we generally do business with counterparties that have a high credit rating. We also enter into credit agreements to keep the market value of the main portfolios of derivative instruments below a predetermined threshold.
Operational Risks
Generation
One of the principal uncertainties that we face relates to natural water inflows. Hydro-Québec Production must ensure that it is able to meet its commitments to supply an annual base volume of up to 165 TWh of heritage pool electricity to Hydro-Québec Distribution and fulfill its contractual obligations. In concrete terms, this means being able to cover a natural inflow deficit of 64 TWh over two consecutive years, and 98 TWh over four consecutive years. To manage this risk, the division applies a variety of mitigation measures and closely monitors them. It therefore manages its reservoir storage on a multiyear basis and maintains an adequate margin between its generating capacity and its commitments. This allows the division to compensate for variations in runoff, replenish its reserves or take advantage of business opportunities. We regularly report to the Energy Board on the generating capacity and energy reserve of Hydro-Québec Production.
In addition to runoff uncertainties, Hydro-Québec Production’s export activities on wholesale markets are subject to market risk and the risk of unavailability of generating and transmission equipment. Market risk results from fluctuations in electricity and fuel prices on markets outside Québec, and is mitigated by ongoing monitoring of trends in wholesale markets and the use of hedging derivative instruments. The risk of unavailability of generating and transmission equipment is mitigated through maintenance and upgrade programs.
Hydro-Québec Production is also exposed to the risk of temperature variations and changes in Québec market demand compared to forecasts. These factors have an impact on the division’s electricity sales to Hydro-Québec Distribution and may affect the volume available for its export sales.
The risks related to Hydro-Québec Production’s export activities are quantified in an integrated fashion by a team of specialists that is independent of the unit carrying out the transactions. This team sees to the application of controls, presents daily reports to Senior Management and ensures compliance with the limits approved by Management and the Board of Directors.
Transmission
Several factors, such as extreme weather and equipment failure, may cause service interruptions or result in the unavailability of part of the transmission system. The multifaceted strategy adopted by Hydro-Québec TransÉnergie to prevent these problems includes implementing the standards of the North American Electric Reliability Corporation (NERC) and the Northeast Power Coordinating Council, as well as measures to maintain and improve its transmission facilities and optimize their useful life. It is worth noting that Hydro-Québec TransÉnergie’s Direction – Contrôle des mouvements d’énergie (system control unit) is Reliability Coordinator for transmission systems in Québec, a role it was assigned by the Energy Board in 2007.
Hydro-Québec TransÉnergie must provide adequate transmission capacity to supply Hydro-Québec Distribution and other customers while also ensuring transmission system security and reliability. To do so, the division relies, among other things, on a transmission asset management model and on a process for optimal management of annual peak load.
Distribution
The continuity of power distribution is the main risk to which Hydro-Québec Distribution is exposed. To maintain power quality, the division makes ongoing investments in its system to modernize and automate it and enhance its security. It also relies on vegetation control, the implementation of an asset maintenance program and a strategy for asset renewal, as well as compliance with applicable standards for overhead and underground systems. To reduce the length of service interruptions, the vast majority of which are caused by adverse weather conditions, the division has adopted new technologies for rapid detection of outages, faster service restoration and remote management of certain incidents.

- 40 -
Hydro-Québec Distribution must also deal with fluctuations in demand (under normal climate conditions) due to the economic and energy situation, which have an impact on results. When demand is lower than the forecasts presented in the rate filing, the division cannot recover from customers all the costs related to power distribution and power transmission through the Hydro-Québec TransÉnergie system. To counter the impact of this risk, the division constantly fine-tunes its method of forecasting demand for electricity.
Construction
One of the principal risks that Hydro-Québec Innovation, équipement et services partagés must constantly deal with is pressure on project costs, due to such factors as the rising cost of labor in the construction industry, higher prices for certain materials or products and events that affect project schedules. There is also a risk related to the quality and delivery time for components.
Regarding lead times, the division makes respecting schedules a top priority despite the constraints inherent in large-scale capital projects. This is particularly important in the current context of the construction industry in Québec, where new legislative and regulatory measures may have an impact on workflows and on our ability to do business with certain suppliers. An active monitoring process and contingency measures have been put in place to mitigate the most probable impacts of this situation.
To meet its commitments and continue to apply high quality and safety standards, Hydro-Québec Innovation, équipement et services partagés has implemented a number of measures that reduce its risk exposure. Specifically, the division closely monitors project schedules, costs and the main deliverables, an approach that enables it to ensure that projects are progressing as planned or to take any necessary corrective action. It maintains ongoing relations with the relevant organizations and government departments to stay abreast of future amendments to laws and regulations that could affect construction costs and lead times, among other things. It also monitors key price and activity indicators in the construction industry. In addition, it develops procurement strategies that promote competition, sustainable supplies and maintaining expertise in its markets, and it adjusts its project completion strategies according to economic conditions, in consultation with its customers.
Finally, two new trade agreements—the Trade and Cooperation Agreement Between Ontario and Québec, whose Public Procurement chapter took effect on September 1, 2016, and the Canada-European Union Comprehensive Economic and Trade Agreement, which will take effect in September 2017—will affect our procurement processes, particularly regarding security, confidentiality of information and the way requirements are defined.
Corporate and Other Activities
Safety and security
The safety of individuals (employees, suppliers and the public) and the security of our assets, including information and communication technologies (ICT), are key concerns for us. That is why we have set up a multidisciplinary team of experts who continuously monitor our facilities, anticipate and analyze threats, maintain a close watch on related risks, regularly assess the mitigation measures in place and deploy new strategies based on changes in the social and business environment as well as emerging trends in security. Our security model is based on anticipation, detection, dissuasion, intervention and restoration. It is also rooted in an integrated security culture that relies on cooperation and awareness on the part of our managers, employees and internal and external partners. The NERC audit performed in October 2016 confirmed that our practices fully meet the regulatory requirements of the North American electricity sector.
Protection of information, ICT and intellectual property is a major issue. In 2016, we set up a centre for continuous monitoring of malicious behavior directed at the power system as well as corporate systems and information.
In December 2016, following the fourth accidental death in seven years at the Romaine jobsite, the Board of Directors created a special committee to assess safety measures at our jobsites and ensure that the highest safety standards are maintained. The special Board committee hired ERM, a world leader in workplace health and safety and management of related risks, to evaluate our practices in this area.
Finally, we have a corporate emergency response plan to ensure the continuity of our operations and our mission in case of an exceptional event. The corporate plan integrates the business units’ emergency response plans and activities with the aim of strengthening and improving coordination of the efforts of all internal and external responders, including public authorities.
- 41 -
Business development and investment outside Québec
In keeping with the strategies set out in the Strategic Plan 2016–2020, we have undertaken to expand our operations on markets outside Québec with a view to enhancing our profitability. The growth avenues we are exploring involve developing our export markets, commercializing our technological innovations and building partnerships, making acquisitions or acquiring interests outside the province. To successfully implement our international expansion projects, we have adopted a business opportunity analysis process that will enable us to identify the related risks and manage them proactively.
Environment
Environmental protection and conservation are also among our main priorities. The majority of activities that have a significant impact on the environment are governed by an ISO 14001–certified environmental management system. In addition, every year, we review our management of environmental issues and provide an overview of the situation in this regard in our Sustainability Report.

- 42 -
INDEPENDENT AUDITORS’ REPORT
To the Minister of Finance of Québec:
REPORT ON CONSOLIDATED FINANCIAL STATEMENTS
We have audited the accompanying consolidated financial statements of Hydro-Québec, which comprise the consolidated balance sheets as at December 31, 2016 and 2015, the consolidated statements of operations, comprehensive income, changes in equity and cash flows for each of the years in the three-year period ended December 31, 2016, and notes, comprising a summary of significant accounting policies and other explanatory information.
Management’s responsibility for the consolidated financial statements
Management is responsible for the preparation and fair presentation of these consolidated financial statements in accordance with United States generally accepted accounting principles, and for such internal control as Management determines is necessary to enable the preparation of consolidated financial statements that are free from material misstatement, whether due to fraud or error.
Auditors’ responsibility
Our responsibility is to express an opinion on these consolidated financial statements based on our audits. We conducted our audits in accordance with Canadian generally accepted auditing standards. Those standards require that we comply with ethical requirements and plan and perform the audit to obtain reasonable assurance about whether the consolidated financial statements are free from material misstatement.
An audit involves performing procedures to obtain audit evidence about the amounts and disclosures in the consolidated financial statements. The procedures selected depend on the auditor’s judgment, including the assessment of the risks of material misstatement of the consolidated financial statements, whether due to fraud or error. In making those risk assessments, the auditor considers internal control relevant to the entity’s preparation and fair presentation of the consolidated financial statements in order to design audit procedures that are appropriate in the circumstances, but not for the purpose of expressing an opinion on the effectiveness of the entity’s internal control. An audit also includes evaluating the appropriateness of accounting policies used and the reasonableness of accounting estimates made by Management, as well as evaluating the overall presentation of the consolidated financial statements.
We believe that the audit evidence we have obtained in our audits is sufficient and appropriate to provide a basis for our audit opinion.
Opinion
In our opinion, the consolidated financial statements present fairly, in all material respects, the consolidated financial position of Hydro-Québec as at December 31, 2016 and 2015, and its consolidated results of operations and its consolidated cash flows for each of the years in the three-year period ended December 31, 2016, in accordance with United States generally accepted accounting principles.
REPORT ON OTHER LEGAL AND REGULATORY REQUIREMENTS
As required by the Auditor General Act (CQLR, c. V-5.01), we report that, in our opinion, for the year ended December 31, 2016, these principles have been applied on a basis consistent with the previous year.
/s/ KPMG LLP1 /s/ Ernst & Young LLP2 /s/ Guylaine Leclerc, FCPA auditor, FCA
Auditor General of Québec
Montréal, Québec February 24, 2017
1. CPA auditor, CA, public accountancy permit No. A120220 2. CPA auditor, CA, public accountancy permit No. A109499
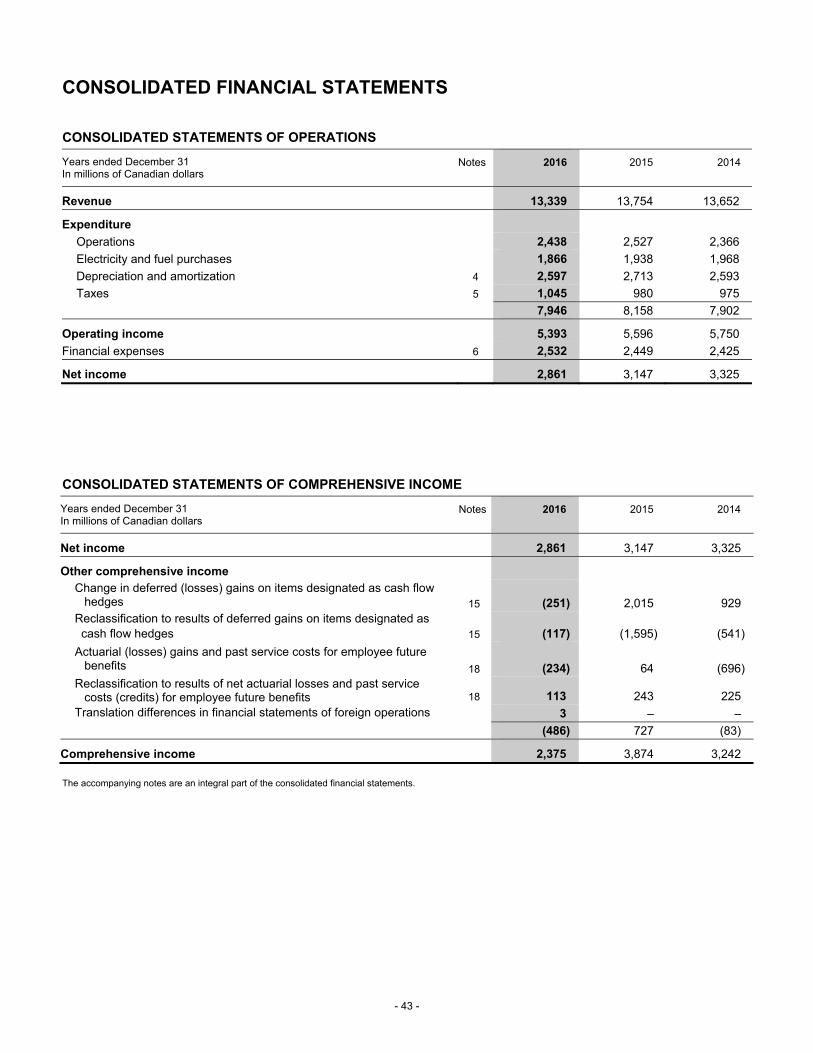
- 43 -
CONSOLIDATED FINANCIAL STATEMENTS
CONSOLIDATED STATEMENTS OF OPERATIONS
Years ended December 31 In millions of Canadian dollars
Notes 2016 2015 2014
Revenue 13,339 13,754 13,652
Expenditure
Operations 2,438 2,527 2,366
Electricity and fuel purchases 1,866 1,938 1,968
Depreciation and amortization 4 2,597 2,713 2,593
Taxes 5 1,045 980 975
7,946 8,158 7,902
Operating income 5,393 5,596 5,750
Financial expenses 6 2,532 2,449 2,425
Net income 2,861 3,147 3,325
CONSOLIDATED STATEMENTS OF COMPREHENSIVE INCOME
Years ended December 31 In millions of Canadian dollars
Notes 2016 2015 2014
Net income 2,861 3,147 3,325
Other comprehensive income Change in deferred (losses) gains on items designated as cash flow
hedges 15 (251) 2,015 929 Reclassification to results of deferred gains on items designated as cash flow hedges 15 (117) (1,595) (541)
Actuarial (losses) gains and past service costs for employee future benefits 18 (234) 64 (696)
Reclassification to results of net actuarial losses and past service costs (credits) for employee future benefits 18 113 243 225
Translation differences in financial statements of foreign operations 3 – –
(486) 727 (83)
Comprehensive income 2,375 3,874 3,242
The accompanying notes are an integral part of the consolidated financial statements.

- 44 -
CONSOLIDATED BALANCE SHEETS
As at December 31 In millions of Canadian dollars
Notes 2016 2015
ASSETS
Current assets
Cash and cash equivalents 1,243 2,648
Short-term investments 2,184 1,895
Accounts receivable and other receivables 15 2,049 2,242
Derivative instruments 15 100 274
Regulatory assets 3 123 122
Materials, fuel and supplies 219 212
5,918 7,393
Property, plant and equipment 7 62,691 61,558
Intangible assets 8 938 1,014
Investments 9 884 859
Derivative instruments 15 284 128
Regulatory assets 3 4,237 3,939
Other assets 10 215 308
75,167 75,199
LIABILITIES
Current liabilities
Borrowings 7 9
Accounts payable and accrued liabilities 2,199 2,278
Dividend payable 16 2,146 2,360
Accrued interest 894 913
Asset retirement obligations 11 86 85
Derivative instruments 15 152 299
Regulatory liabilities 3 – 49 Current portion of long-term debt 12 1,398 2,059
6,882 8,052
Long-term debt 12 44,218 43,613
Asset retirement obligations 11 774 780
Derivative instruments 15 13 5
Regulatory liabilities 3 381 392
Other liabilities 13 2,902 2,571
Perpetual debt 14 293 311
55,463 55,724
EQUITY 16
Share capital 4,374 4,374
Retained earnings 17,261 16,546
Accumulated other comprehensive income (1,931) (1,445)
19,704 19,475
75,167 75,199
Commitments and contingencies 19
The accompanying notes are an integral part of the consolidated financial statements.
On behalf of the Board of Directors,
/s/ Michelle Cormier /s/ Michael D. Penner
Chair of the Audit Committee Chairman of the Board

- 45 -
CONSOLIDATED STATEMENTS OF CHANGES IN EQUITY
Years ended December 31 In millions of Canadian dollars Note Share capital
Retained earnings
Accumulated other
comprehensive income Total equity
Balance as at January 1, 2016 4,374 16,546 (1,445) 19,475
Net income – 2,861 – 2,861
Other comprehensive income 16 – – (486) (486)
Dividend 16 – (2,146) – (2,146)
Balance as at December 31, 2016 4,374 17,261 (1,931) 19,704
Balance as at January 1, 2015 4,374 15,759 (2,172) 17,961
Net income – 3,147 – 3,147
Other comprehensive income 16 – – 727 727
Dividend 16 – (2,360) – (2,360)
Balance as at December 31, 2015 4,374 16,546 (1,445) 19,475
Balance as at January 1, 2014 4,374 14,969 (2,089) 17,254
Net income – 3,325 – 3,325
Other comprehensive income 16 – – (83) (83)
Dividend 16 – (2,535) – (2,535)
Balance as at December 31, 2014 4,374 15,759 (2,172) 17,961
The accompanying notes are an integral part of the consolidated financial statements.

- 46 -
CONSOLIDATED STATEMENTS OF CASH FLOWS
Years ended December 31 In millions of Canadian dollars
Notes 2016 2015 2014
Operating activities Net income 2,861 3,147 3,325
Adjustments to determine net cash flows from operating activities
Depreciation and amortization 4 2,597 2,713 2,593
Amortization of premiums, discounts and issue expenses related to debt securities 173 159 147
(Deficit) excess of net cost recognized with respect to amounts paid for employee future benefits (146) 161 27
Other 299 209 (184)
Regulatory assets and liabilities (301) (56) (103)
Change in non-cash working capital items 17 21 (98) 68
5,504 6,235 5,873
Investing activities
Additions to property, plant and equipment (3,363) (3,340) (3,675)
Additions to intangible assets (97) (100) (140)
Net (acquisition) disposal of short-term investments (272) (218) 43
Other 39 14 17
(3,693) (3,644) (3,755)
Financing activities
Issuance of long-term debt 2,011 13 1,511
Repayment of long-term debt (1,927) (1,044) (2,702)
Cash receipts arising from credit risk management 15 10,312 8,220 3,521
Cash payments arising from credit risk management 15 (11,093) (6,397) (2,596)
Net change in borrowings (6) (19) (11)
Dividend paid (2,360) (2,535) (2,207)
Other (137) 486 198
(3,200) (1,276) (2,286)
Foreign currency effect on cash and cash equivalents (16) 62 6
Net change in cash and cash equivalents (1,405) 1,377 (162)
Cash and cash equivalents, beginning of year 2,648 1,271 1,433
Cash and cash equivalents, end of year 1,243 2,648 1,271
Supplementary cash flow information 17
The accompanying notes are an integral part of the consolidated financial statements.
- 47 -
NOTES TO CONSOLIDATED FINANCIAL STATEMENTS
Years ended December 31, 2016, 2015 and 2014
Amounts in tables are in millions of Canadian dollars, unless otherwise indicated.
Under the provisions of the Hydro-Québec Act, Hydro-Québec is mandated to supply power and to pursue endeavors in energy-related research and promotion, energy conversion and conservation, and any field connected with or related to power or energy. Hydro-Québec is required, in particular, to supply a base volume of up to 165 TWh a year of heritage pool electricity for the Québec market, as set out in the Act Respecting the Régie de l’énergie. As a government corporation, Hydro-Québec is exempt from paying income taxes in Canada.
Note 1 Significant Accounting Policies
Hydro-Québec’s consolidated financial statements have been prepared in accordance with United States generally accepted accounting principles (U.S. GAAP).
Management is of the opinion that these consolidated financial statements present fairly, in all material respects, the consolidated financial position of Hydro-Québec.
Management has reviewed events occurring until February 24, 2017, the date of approval of these consolidated financial statements by the Board of Directors, to determine whether circumstances warranted the recording or presentation of events after the balance sheet date.
REGULATION
The Act Respecting the Régie de l’énergie grants the Régie de l’énergie (the Régie) exclusive authority to determine or modify the rates and conditions under which electricity is transmitted and distributed by Hydro-Québec. Hydro-Québec’s electricity transmission and distribution activities in Québec are therefore regulated. Under this legislation, rates are set by reasoned decision of three commissioners after public hearings. Moreover, the Act stipulates that rates are determined on a basis that allows for recovery of the cost of service plus a reasonable return on the rate base.
Under U.S. GAAP, it is acknowledged that rate regulation may affect the timing of the recognition of certain transactions in the consolidated results, giving rise to the recognition of regulatory assets and liabilities, which Hydro-Québec considers it is likely to recover or settle subsequently through the rate-setting process.
When the Transmission Provider or the Distributor has adequate assurance that certain costs incurred may likely be recovered in future rates, such costs are deferred and recognized as assets. When it is probable that the Transmission Provider or the Distributor will be required to reimburse customers, or when costs have been recovered but will be incurred in the future, a liability is recognized. The balances of these assets and liabilities are amortized over the recovery periods approved by the Régie.
SCOPE OF CONSOLIDATION
The consolidated financial statements include the accounts of Hydro-Québec and its subsidiaries as well as those of variable interest entities where Hydro-Québec is the primary beneficiary. All intercompany balances and transactions were eliminated at the time of consolidation.
Investments in joint ventures are accounted for on an equity basis. These investments are initially recognized at cost, and their carrying amount is increased or decreased by an amount equal to Hydro-Québec’s share of the changes in the joint ventures’ net assets after the date of acquisition. Hydro-Québec’s share of the joint ventures’ results is recognized in results. Dividends received from the joint ventures are applied against the carrying amount of the investments.

- 48 -
Note 1 Significant Accounting Policies (continued)
USE OF ESTIMATES
The preparation of financial statements in accordance with U.S. GAAP requires that Management make estimates and assumptions that affect the amounts recognized as assets and liabilities, the disclosures regarding contingent assets and liabilities at the date of the consolidated financial statements and the amounts recognized as revenue and expenditure for the years at issue. The estimates relate, among other things, to revenue, which includes estimated amounts for electricity delivered but not billed; the carrying amount of regulatory assets and liabilities; fair value measurements of financial instruments; the useful life of property, plant and equipment and intangible assets for calculating the depreciation and amortization expense, as well as cash flows, the expected timing of payments, and the discount rates used to determine asset retirement obligations and employee future benefit liabilities. These rates are based on economic and actuarial assumptions. Actual results could differ from those estimates and such differences could be significant.
For 2016, Hydro-Québec changed some accounting estimates for calculating the recognized net cost of employee future benefits. The changes are described in Note 18, Employee Future Benefits.
REVENUE
Hydro-Québec supplies the Québec market with electricity and also sells power on wholesale markets in Canada and the United States. In addition, it is active in arbitrage transactions. Revenue from electricity sales and arbitrage transactions is recognized on delivery. Arbitrage transactions are recognized net of related electricity purchases.
Revenue also includes certain amounts that Hydro-Québec is entitled to receive from customers or is required to pay to them in the future. These amounts relate, among other things, to the supply of electricity in excess of the heritage pool and to climate conditions. These items give rise to financial assets and liabilities that are reported in Accounts receivable and other receivables and Other assets or in Accounts payable and accrued liabilities and Other liabilities, based on their maturities.
Other revenue is recognized on delivery of the goods or services.
FOREIGN CURRENCY TRANSLATION
Monetary assets and liabilities denominated in foreign currencies are translated into Canadian dollars at the exchange rate in effect at the balance sheet date, and non-monetary items are translated at the historical exchange rate. Revenue and expenditure arising from foreign currency transactions are translated into Canadian dollars at the exchange rate in effect at the transaction date. The exchange gains or losses resulting from the translation of monetary items are included in results.
The financial statements of foreign operations whose functional currency is not the Canadian dollar are translated according to the current rate method. Under this method, assets and liabilities are translated into Canadian dollars at the exchange rate in effect at the balance sheet date, and revenue and expenditure are translated at the average exchange rate in effect during the period. The exchange gains or losses resulting from the translation of the financial statements of these foreign operations are presented in Accumulated other comprehensive income under Equity on the balance sheet.
FINANCIAL INSTRUMENTS
Cash and cash equivalents
Cash and cash equivalents include investments with a maturity of three months or less from the date of acquisition.
Short-term investments
Short-term investments, classified as available-for-sale debt securities, consist of money market instruments with a maturity of more than three months from the date of acquisition and are recognized at fair value. Changes in fair value are recorded in Other comprehensive income until they are realized, at which time they are reclassified to results. Interest on these investments, calculated using the effective interest method, is recognized in results.
Receivables – Accounts receivable
Accounts receivable are recognized at the amount invoiced, net of the allowance for doubtful accounts. This allowance is based on the status of customer files and the recovery experience for each age group of accounts. Receivables are written off during the period in which the accounts are deemed uncollectible.

- 49 -
Note 1 Significant Accounting Policies (continued)
Other receivables and financial liabilities
Other receivables presented under Accounts receivable and other receivables, receivables presented under Other assets and the government reimbursement for the 1998 ice storm, also presented in Other assets, less any impairment losses, as well as financial liabilities presented under Accounts payable and accrued liabilities and Other liabilities, borrowings, the dividend payable, accrued interest, long-term debt and perpetual debt, are measured at amortized cost using the effective interest method. Amortized cost includes issue expenses as well as premiums and discounts, if applicable. Interest is recognized in results.
Derivative instruments
Derivative instruments are recognized at fair value at the balance sheet date. Changes in fair value are recognized in results for the period in which they occur, except in the case of derivative instruments designated as hedges in a cash flow hedging relationship. The net balances of derivative instruments that are transacted with the same counterparty, that are the subject of an enforceable master netting arrangement, net of cash received or paid under collateral exchange agreements, and that meet the conditions for set-off are presented on the balance sheet.
As part of its integrated business risk management, Hydro-Québec uses derivative instruments to manage its market risk, consisting of currency risk, interest rate risk and risk resulting from fluctuating energy and aluminum prices. It applies cash flow or fair value hedge accounting to eligible hedging relationships that it designates as hedges, and formally documents these relationships. Among other things, this process involves associating derivative instruments with specific assets or liabilities on the balance sheet, or with probable anticipated transactions. Hydro-Québec ensures that hedging relationships are highly effective in hedging the designated risk exposure initially and then monthly thereafter. In addition, for hedges of anticipated transactions, it assesses the probability of the occurrence of those transactions designated as hedged items at least on a quarterly basis.
In the case of a cash flow hedge, the effective portion of changes in the fair value of an instrument designated as a hedge is recognized under Other comprehensive income, while the ineffective portion is immediately recognized in results, under the line item affected by the hedged item. Amounts included in Accumulated other comprehensive income are reclassified to results, also under the line item affected by the hedged item, during the periods in which the hedged item affects results. If a derivative instrument no longer satisfies hedging conditions, if it has expired or is sold, terminated or exercised, or if Hydro-Québec cancels its designation as a hedging item, hedge accounting ceases to be applied on a prospective basis. Gains and losses previously accumulated in Other comprehensive income continue to be carried forward to be reclassified to results during the same periods as the hedged item. If the hedged item ceases to exist or if it becomes likely that the hedged anticipated transactions will not occur, the gains or losses carried forward are immediately reclassified to results.
In the case of a fair value hedge, changes in the fair value of the derivative instrument, including those related to the ineffective portion of the hedge, are recognized in results under the line item affected by the hedged item. Offsetting changes in the fair value of the hedged item attributable to the hedged risk are recognized as adjustments to this item’s carrying amount and are offset against results.
Cash flows attributable to derivative instruments designated as hedges are presented in the statement of cash flows based on the same classification as the hedged item.
Hydro-Québec assesses its contracts to determine if they meet the definition of a derivative or if they include an embedded derivative, which must be separated from its host contract. If such is the case, the contract or the embedded derivative is recognized at fair value on the balance sheet.
All futures or forward contracts on non-financial items that can be settled on a net basis and whose price is closely tied to the non-financial item bought or sold are recorded at the date of settlement if there is a probability of receipt or delivery in accordance with expected requirements.
FAIR VALUE
Fair value is the price that would be received to sell an asset or paid to transfer a liability in an orderly transaction between market participants at the measurement date.
In accordance with the applicable standards, Hydro-Québec classifies the fair value measurements of assets and liabilities according to a three-level hierarchy, based on the type of inputs used in making these measurements:
▪ Level 1: Quoted prices (unadjusted) on active markets for identical assets or liabilities that the entity can access at the measurement date;
▪ Level 2: Inputs other than quoted prices included within Level 1 that are observable either directly or indirectly; and
▪ Level 3: Unobservable inputs.
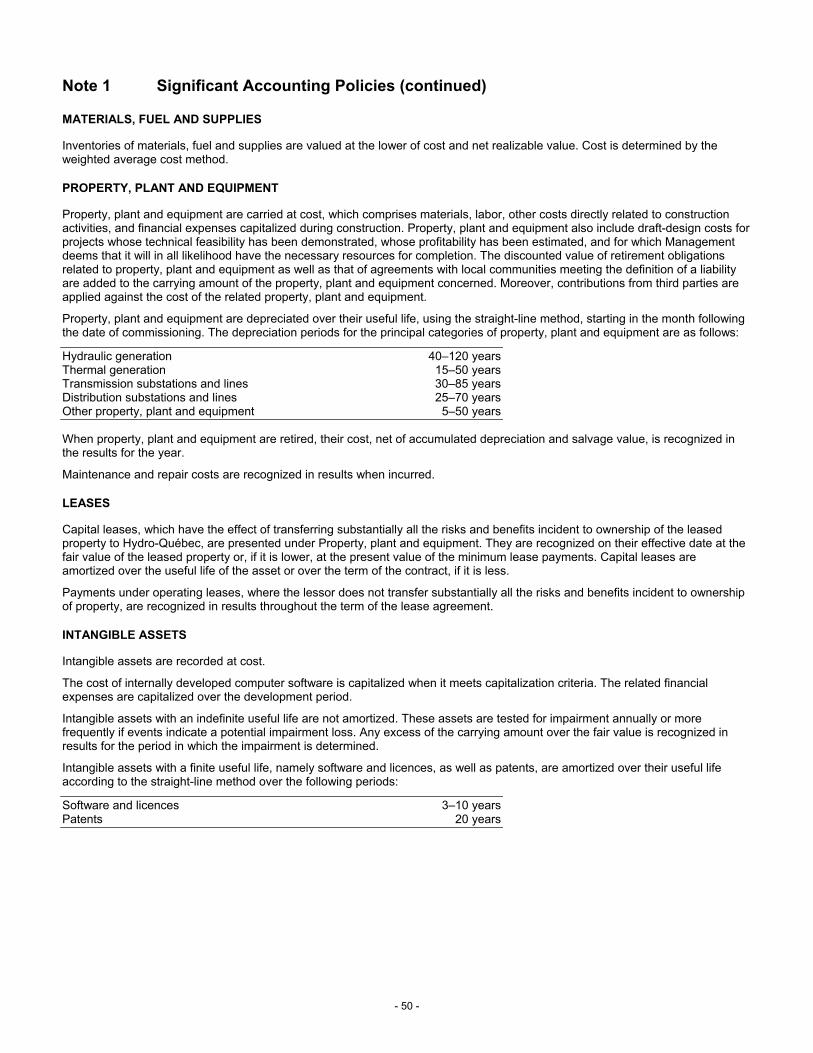
- 50 -
Note 1 Significant Accounting Policies (continued)
MATERIALS, FUEL AND SUPPLIES
Inventories of materials, fuel and supplies are valued at the lower of cost and net realizable value. Cost is determined by the weighted average cost method.
PROPERTY, PLANT AND EQUIPMENT
Property, plant and equipment are carried at cost, which comprises materials, labor, other costs directly related to construction activities, and financial expenses capitalized during construction. Property, plant and equipment also include draft-design costs for projects whose technical feasibility has been demonstrated, whose profitability has been estimated, and for which Management deems that it will in all likelihood have the necessary resources for completion. The discounted value of retirement obligations related to property, plant and equipment as well as that of agreements with local communities meeting the definition of a liability are added to the carrying amount of the property, plant and equipment concerned. Moreover, contributions from third parties are applied against the cost of the related property, plant and equipment.
Property, plant and equipment are depreciated over their useful life, using the straight-line method, starting in the month following the date of commissioning. The depreciation periods for the principal categories of property, plant and equipment are as follows:
Hydraulic generation 40–120 years Thermal generation 15–50 years Transmission substations and lines 30–85 years Distribution substations and lines 25–70 years Other property, plant and equipment 5–50 years
When property, plant and equipment are retired, their cost, net of accumulated depreciation and salvage value, is recognized in the results for the year.
Maintenance and repair costs are recognized in results when incurred.
LEASES
Capital leases, which have the effect of transferring substantially all the risks and benefits incident to ownership of the leased property to Hydro-Québec, are presented under Property, plant and equipment. They are recognized on their effective date at the fair value of the leased property or, if it is lower, at the present value of the minimum lease payments. Capital leases are amortized over the useful life of the asset or over the term of the contract, if it is less.
Payments under operating leases, where the lessor does not transfer substantially all the risks and benefits incident to ownership of property, are recognized in results throughout the term of the lease agreement.
INTANGIBLE ASSETS
Intangible assets are recorded at cost.
The cost of internally developed computer software is capitalized when it meets capitalization criteria. The related financial expenses are capitalized over the development period.
Intangible assets with an indefinite useful life are not amortized. These assets are tested for impairment annually or more frequently if events indicate a potential impairment loss. Any excess of the carrying amount over the fair value is recognized in results for the period in which the impairment is determined.
Intangible assets with a finite useful life, namely software and licences, as well as patents, are amortized over their useful life according to the straight-line method over the following periods:
Software and licences 3–10 years Patents 20 years

- 51 -
Note 1 Significant Accounting Policies (continued)
CAPITALIZED FINANCIAL EXPENSES
Financial expenses capitalized to property, plant and equipment under construction and to internally developed computer software related to non-regulated activities are determined on the basis of the cost of debt and recognized as a deduction from financial expenses in the consolidated results. Financial expenses capitalized to property, plant and equipment under construction that are related to rate-regulated transmission or distribution activities also take into account the return on equity of the activities concerned. The portion that corresponds to return on equity is included in Revenue in the consolidated results.
IMPAIRMENT OF LONG-LIVED ASSETS
Hydro-Québec reviews the carrying amount of its property, plant and equipment and its amortizable intangible assets whenever events or changes in circumstances indicate that the expected undiscounted net cash flows could be lower than the carrying amount of the property and assets. An impairment loss corresponding to the amount by which the carrying amount exceeds fair value is recognized, if applicable.
EMPLOYEE FUTURE BENEFITS
Pension plan and other post-retirement benefits
Hydro-Québec offers all its employees a contributory defined-benefit pension plan based on final pay (the Pension Plan), as well as other post-retirement benefits. It accounts for its obligations under the Pension Plan and these other benefits after deducting the fair value of their respective assets.
Benefit costs and obligations under the Pension Plan and other post-retirement benefits provided in exchange for current service are calculated according to the projected benefit method prorated on years of service. They are determined using a discount rate and are based on Management’s best estimates, in particular concerning the expected return on plan assets, salary escalation, the increase in health care costs, and employees’ retirement ages. Plan assets are measured at fair value at the balance sheet date.
In order to establish the benefit costs and its obligations under the Pension Plan and other post-retirement benefits, Hydro-Québec has adopted the following policies:
▪ Discount rates used are based on the interest rate curve on the measurement date, namely December 31, of high-quality Canadian corporate bonds and take into account the amount and different payment maturity dates of the projected benefit obligations for each plan.
▪ Actuarial gains and losses are recognized in Other comprehensive income for the period in which they occur. Thereafter, amortization of actuarial gains or losses is recognized in Operating expenses if the unamortized net actuarial gain or loss at the beginning of the year exceeds 10% of the value of the projected benefit obligations or 10% of the market-related value of the plan assets, whichever is greater. The amortization corresponds to the excess divided by active employees’ average remaining years of service.
▪ Past service costs (credits) arising from amendments to the Pension Plan and other post-retirement benefits are initially recognized in Other comprehensive income, and thereafter are amortized in Operating expenses using the straight-line method over periods not exceeding active employees’ average remaining years of service.
▪ The expected return on Pension Plan assets is based on a market-related value determined by using a five-year moving average value for equity securities and by measuring other asset classes at fair value.
The unamortized balances of net actuarial losses and of past service costs (credits) recognized in Accumulated other comprehensive income for employee future benefits to be recovered in future rates are recognized as a regulatory asset.

- 52 -
Note 1 Significant Accounting Policies (continued)
Post-employment benefits
Hydro-Québec offers all its employees post-employment benefits, including a long-term disability salary insurance plan that provides for the payment of long-term defined benefits.
The post-employment benefit cost and obligation are recognized at the time of the event giving rise to the obligation to pay benefits. The cost of these benefits, including all related actuarial gains and losses, is recognized in results for the period.
ASSET RETIREMENT OBLIGATIONS
Hydro-Québec accounts for asset retirement obligations in the period in which the legal obligations with respect thereto arise, provided that a reasonable estimate of their fair value can be made. The corresponding costs of asset retirement are added to the carrying amount of the related long-lived asset and are amortized over its useful life. In subsequent years, any change due to the passage of time is recognized in operating expenses for the current year (accretion expense) and the corresponding amount is added to the carrying amount of the liability. Changes resulting from revisions to the timing or the amount of the undiscounted cash flows are recognized as an increase or decrease in the carrying amount of the liability arising from asset retirement obligations, and the corresponding amount is added to the carrying amount of the related asset or deducted up to a maximum of its carrying amount, with any excess then being recognized in results. When the asset reaches the end of its useful life, any change is immediately recognized in results. The actual costs incurred to settle asset retirement obligations are applied against liabilities. During the final settlement of such an obligation, the difference between the balance of the obligation and the actual cost incurred is recognized as a gain or a loss in results.
The cash flows required to settle asset retirement obligations are estimated on the basis of studies that use various assumptions concerning the methods and timing to be adopted for the retirement. Hydro-Québec periodically reviews the measurement of these obligations in light of the underlying assumptions and estimates, potential technological advances, and changes in applicable standards, laws and regulations.
AGREEMENTS WITH LOCAL COMMUNITIES
Hydro-Québec has entered into various agreements with the local communities concerned by certain capital projects. The amounts under these agreements are recognized in Long-term debt if they fall within the definition of a liability, and the offsetting item is recognized in Property, plant and equipment. The recognized amounts are determined by discounting the future cash flows related to these agreements. The discount rate used is the interest rate on Hydro-Québec bonds at the date of initial recognition. Subsequently, in the case of agreements with indexed cash flows, the cash flows are subject to an annual re-estimate that can result in a change in the discount rate.
RELATED PARTY TRANSACTIONS
In the normal course of business, Hydro-Québec sells electricity and enters into other business transactions with its sole shareholder, the Québec government, and its agencies, as well as with other government corporations. These transactions are measured at the exchange amount.
In addition, as a government corporation, Hydro-Québec provides the Québec government with financial data prepared in accordance with International Financial Reporting Standards so that it can prepare its consolidated financial statements.
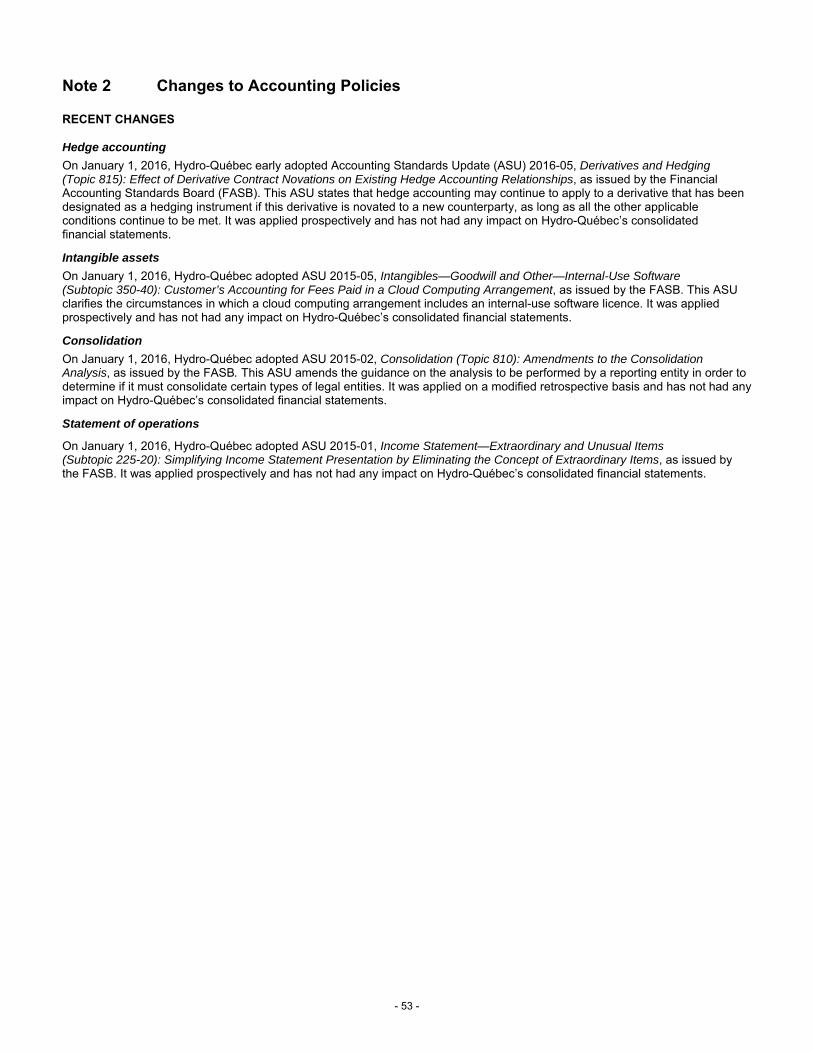
- 53 -
Note 2 Changes to Accounting Policies
RECENT CHANGES
Hedge accounting
On January 1, 2016, Hydro-Québec early adopted Accounting Standards Update (ASU) 2016-05, Derivatives and Hedging (Topic 815): Effect of Derivative Contract Novations on Existing Hedge Accounting Relationships, as issued by the Financial Accounting Standards Board (FASB). This ASU states that hedge accounting may continue to apply to a derivative that has been designated as a hedging instrument if this derivative is novated to a new counterparty, as long as all the other applicable conditions continue to be met. It was applied prospectively and has not had any impact on Hydro-Québec’s consolidated financial statements.
Intangible assets
On January 1, 2016, Hydro-Québec adopted ASU 2015-05, Intangibles—Goodwill and Other—Internal-Use Software (Subtopic 350-40): Customer’s Accounting for Fees Paid in a Cloud Computing Arrangement, as issued by the FASB. This ASU clarifies the circumstances in which a cloud computing arrangement includes an internal-use software licence. It was applied prospectively and has not had any impact on Hydro-Québec’s consolidated financial statements.
Consolidation
On January 1, 2016, Hydro-Québec adopted ASU 2015-02, Consolidation (Topic 810): Amendments to the Consolidation Analysis, as issued by the FASB. This ASU amends the guidance on the analysis to be performed by a reporting entity in order to determine if it must consolidate certain types of legal entities. It was applied on a modified retrospective basis and has not had any impact on Hydro-Québec’s consolidated financial statements.
Statement of operations
On January 1, 2016, Hydro-Québec adopted ASU 2015-01, Income Statement—Extraordinary and Unusual Items (Subtopic 225-20): Simplifying Income Statement Presentation by Eliminating the Concept of Extraordinary Items, as issued by the FASB. It was applied prospectively and has not had any impact on Hydro-Québec’s consolidated financial statements.

- 54 -
Note 2 Changes to Accounting Policies (continued)
STANDARDS ISSUED BUT NOT YET EFFECTIVE
Statement of cash flows
In August 2016, the FASB issued ASU 2016-15, Statement of Cash Flows (Topic 230): Classification of Certain Cash Receipts and Cash Payments. This ASU clarifies how certain items are presented and classified in the statement of cash flows. It will apply on a full retrospective basis to interim and annual financial statements for annual periods beginning on or after January 1, 2018, and should not have any significant impact on Hydro-Québec’s consolidated financial statements.
Investments
In March 2016, the FASB issued ASU 2016-07, Investments—Equity Method and Joint Ventures (Topic 323): Simplifying the Transition to the Equity Method of Accounting. This ASU simplifies the application of the equity method of accounting in the case where a reporting entity increases its level of investment in another entity or its degree of influence over such an entity. The ASU applies prospectively to transactions as of January 1, 2017. Hydro-Québec is currently examining the impact of this ASU on its consolidated financial statements.
Leases
In February 2016, the FASB issued ASU 2016-02, Leases (Topic 842). This ASU provides guidance on lease definition, recognition and presentation and requires the recognition of assets and liabilities by lessees for all operating and finance leases with a term of more than 12 months. It will apply on a modified retrospective basis to interim and annual financial statements for annual periods beginning on or after January 1, 2019. Hydro-Québec is currently examining the impact of this ASU on its consolidated financial statements.
Financial instruments
In January 2016, the FASB issued ASU 2016-01, Financial Instruments—Overall (Subtopic 825-10): Recognition and Measurement of Financial Assets and Financial Liabilities. This ASU provides guidance on the recognition and measurement of financial assets and financial liabilities. It will be applied on a modified retrospective basis to interim and annual financial statements for annual periods beginning on or after January 1, 2018, and should not have any significant impact on Hydro-Québec’s consolidated financial statements.
In June 2016, the FASB issued ASU 2016-13, Financial Instruments—Credit Losses (Topic 326): Measurement of Credit Losses on Financial Instruments. This ASU provides new guidance on the impairment of financial assets that are not accounted for at fair value through net income. It will be applied on a modified retrospective basis to the consolidated financial statements for annual periods beginning on or after January 1, 2020. Hydro-Québec is currently examining the impact of this ASU on its consolidated financial statements, but does not intend early adoption.
Revenue
In May 2014, the FASB issued ASU 2014-09, Revenue from Contracts with Customers (Topic 606). This ASU provides guidance on the recognition of revenue at the time that goods or services are transferred to a client, for an amount that reflects the payment which the entity expects to receive in exchange for the goods or services.
In August 2015, the FASB issued ASU 2015-14, Revenue from Contracts with Customers (Topic 606): Deferral of the Effective Date, which defers the effective date of this guidance by one year.
In March 2016, the FASB issued ASU 2016-08, Revenue from Contracts with Customers (Topic 606): Principal versus Agent Considerations (Reporting Revenue Gross versus Net). This ASU clarifies the guidance used to determine if an entity is acting on its own behalf or as an intermediary.
In April 2016, the FASB issued ASU 2016-10, Revenue from Contracts with Customers (Topic 606): Identifying Performance Obligations and Licensing. This ASU clarifies guidance on identifying performance obligations and the licensing of intellectual property rights.
In May 2016, the FASB issued ASU 2016-12, Revenue from Contracts with Customers (Topic 606): Narrow-Scope Improvements and Practical Expedients. This ASU clarifies the guidance on assessing collectibility, on noncash considerations and on completed contracts on the date of initial application.
These ASUs will apply on a full or modified retrospective basis to consolidated financial statements for annual periods beginning on or after January 1, 2018. Hydro-Québec is currently examining their impact on its consolidated financial statements, but does not intend early adoption.

- 55 -
Note 3 Regulation
RATES
Transmission
Hydro-Québec’s power transmission rates for 2016, 2015 and 2014 were determined in Régie decisions D-2016-046, D-2015-031 and D-2014-049, effective January 1, 2016, January 1, 2015, and January 1, 2014 respectively. The authorized return on the rate base was set at 6.85% in 2016, 6.97% in 2015 and 7.05% in 2014, assuming a capitalization with 30% equity.
Distribution
Hydro-Québec’s electricity rates for the rate years beginning on April 1, 2016, April 1, 2015, and April 1, 2014, respectively, were determined in decisions D-2016-047, D-2015-033 and D-2014-052, in which the Régie authorized increases of 0.70%, 2.86% and 4.27% for all rates except Rate L, which remained unchanged in 2016, but for which increases of 2.49% and 3.45% were authorized in 2015 and 2014. The authorized return on the rate base was set at 6.95% in 2016, 7.08% in 2015 and 7.14% in 2014, assuming a capitalization with 35% equity.
Changeover to U.S. GAAP
In decisions D-2015-189 and D-2016-003, the Régie authorized changes, effective July 10, 2015, to certain accounting policies applied by the Transmission Provider and the Distributor for rate-setting purposes, given the application of U.S. GAAP to Hydro-Québec’s rate-regulated power transmission and distribution activities as of that date. The changes related to the recognition of certain development expenses and some costs associated with the Energy Efficiency Plan (EEP) as regulatory assets. They also concerned the recognition of employee future benefits and asset retirement obligations, as well as the depreciation of property, plant and equipment related to rate-regulated activities.
The following information describes the impact on the consolidated financial statements of the accounting policies and practices adopted by Hydro-Québec in accordance with the Régie’s decisions with respect to its rate-regulated activities.
REGULATORY ASSETS
Costs related to the EEP
Eligible EEP costs incurred are recognized in a separate account and amortized over a 10-year period using the straight-line method. Amortization begins the year after the one in which the costs are recognized. The costs recognized in this account bear interest at the rate of return authorized by the Régie on the rate base until such time as they are included in the rate base and amortization begins. This accounting practice was authorized by the Régie in decision D-2015-189, which relates to Hydro-Québec’s power distribution activities.
Costs related to the de-icing system at Lévis substation
Certain costs related to the Lévis substation de-icing system, designed in the wake of the 1998 ice storm to secure the transmission lines supplying the greater Québec area, were recognized in a separate account. These costs have been depreciated using the straight-line method starting from the date of commissioning of the de-icing system, over a period corresponding to the average remaining useful life of the assets enhanced by the system. The costs bore interest at the rate of return authorized by the Régie on the rate base until such time as they were included in the rate base and amortization began. This accounting practice was authorized by the Régie in decision D-2004-175, which relates to Hydro-Québec’s power transmission activities.
Costs related to a suspension agreement
The Régie authorized an agreement regarding the temporary suspension of deliveries from a generating station in May 2014. The offsetting entry for the financial liability recorded with regard to this agreement was recognized in a separate non-interest-bearing account, and the adjustments related to subsequent changes in this liability are recognized in the same account. The costs related to the suspension agreement are recovered in the rates on an annual basis, according to the amounts billed. This accounting practice was authorized by the Régie in decision D-2014-086, which relates to Hydro-Québec’s power distribution activities. In decision D-2016-105 of July 5, 2016, the Régie revoked decisions D-2015-179 and D-2016-069, in which it had approved an agreement regarding use of the generating station during peak demand periods.

- 56 -
Note 3 Regulation (continued)
Costs related to the project involving the replacement of PK type circuit breakers
The eligible expenses incurred as of April 11, 2016, as part of the project involving the replacement of PK type circuit breakers are recognized in a separate account, for which the disposition method has not yet been established. These expenses bear interest at the rates prescribed by the Régie. This accounting practice was authorized by the Régie in decisions D-2016-077 and D-2016-174, which relate to Hydro-Québec’s power transmission activities.
Development costs
Eligible development costs are recognized in a separate non-interest-bearing account and are amortized over a five-year period using the straight-line method. Amortization begins the year after the one in which the costs are recognized. This accounting practice was authorized by the Régie in decision D-2015-189, which relates to Hydro-Québec’s power transmission and distribution activities.
Employee future benefits
The unamortized balances of net actuarial losses and of past service costs (credits) recognized in Accumulated other comprehensive income for employee future benefits to be recovered in future rates are recognized in a separate, non-interest-bearing account. This regulatory asset, which concerns Hydro-Québec’s power transmission and distribution activities, is amortized when the unamortized balances are reclassified as a cost component of employee future benefits. The Régie’s specific approval was not required because recovery of the cost of employee future benefits in the rates had already been approved.
REGULATORY ASSETS
Expected years of
amortization 2016 2015
Costs related to the EEP 2017–2026 684 800
Costs related to the de-icing system at Lévis substation 2017–2047 5 6
Costs related to a suspension agreement 2017–2020 482 356
Costs related to the project involving the replacement of PK type circuit breakers To be determined 51 –
Development costs 2017–2021 16 17
Employee future benefits As of 2017 3,122 2,877
Other – – 5
4,360 4,061
Short-term regulatory assets 123 122
Long-term regulatory assets 4,237 3,939
REGULATORY LIABILITIES
Deferred expense accounts related to the changeover to U.S. GAAP
The impacts of changes in accounting policies as a result of the changeover to U.S. GAAP, other than those concerning pension cost, were recognized in separate accounts in 2015 and amortized in 2016. The amounts recognized in these accounts bore interest at the rates prescribed by the Régie. The changes concerned the recognition of employee future benefits other than the Pension Plan and the recognition of asset retirement obligations, as well as the review of useful lives for depreciation purposes of property, plant and equipment related to rate-regulated activities. They had been authorized by the Régie in decisions D-2015-189, D-2016-003, D-2016-029 and D-2016-033, which relate to Hydro-Québec’s power transmission and distribution activities.
Depreciation of property, plant and equipment
Prior to July 10, 2015, the useful life of property, plant and equipment was limited to 50 years for rate-setting purposes. Since then, this limit no longer applies, provided that the weighted average useful life of all property, plant and equipment of the Transmission Provider, on the one hand, and of the Distributor, on the other hand, does not exceed 50 years. The differences in the depreciation expense resulting from the application of useful lives limited to 50 years for rate-setting purposes until July 9, 2015, were recognized in a separate, non-interest-bearing account and are amortized at the same rate as the property, plant and equipment concerned.

- 57 -
Note 3 Regulation (continued)
Past service costs under the Pension Plan
The unamortized balance of past service costs under the Pension Plan that has already been recovered in the rates and will be reflected in the results of future years has been recognized in a separate, non-interest-bearing account. This regulatory liability is amortized when the past service costs recognized in Accumulated other comprehensive income are reclassified as a cost component of employee future benefits.
REGULATORY LIABILITIES
Expected years of
amortization 2016 2015
Deferred expense accounts related to the changeover to U.S. GAAP – – 49
Depreciation of property, plant and equipment 2017–2115 361 366
Past service costs under the Pension Plan 2017–2022 20 26
381 441
Short-term regulatory liabilities – 49
Long-term regulatory liabilities 381 392
Risks and uncertainties
The risks and uncertainties related to the above regulatory assets and liabilities are subject to periodic monitoring and assessment. Once Hydro-Québec considers that it is no longer likely that the net carrying amount of a regulatory asset or liability will be taken into account in setting future rates, this amount is recognized in results for the period in which the conclusion is reached.
OTHER REGULATORY PRACTICES
Under Régie decisions D-2002-95 and D-2003-93, the compensation granted by the Québec government for the 1998 ice storm was applied against the cost of newly constructed property, plant and equipment. It is amortized over the remaining useful life of the retired assets, with the exception of the portion equivalent to the unamortized cost of these assets, which is amortized over a 10-year period. The straight-line method of depreciation is used in both cases.
In decisions D-2002-95 and D-2004-47, the Régie prescribed capitalizing financial expenses to property, plant and equipment under construction related to rate-regulated activities, according to the authorized rates of return on the rate bases. Set using methods approved by the Régie, these rates take into account a component associated with the cost of the debt and a component associated with the return on equity. The component associated with return on equity totaled $49 million in 2016 and 2015.
Under Régie decisions D-2002-95 and D-2003-93, the cost of dismantling retired and replaced assets for which no asset retirement obligation was recognized is added, net of the salvage value, to the cost of the newly constructed assets. Under Régie decision D-2011-039, which relates to Hydro-Québec’s power transmission activities, the costs of restoring sites associated with replaced assets are also added to the cost of newly constructed assets.
Under Régie decisions D-2006-76 and D-2006-76R, contributions received for relocation or modification projects relating to certain transmission grid assets are recognized in a separate account and applied against property, plant and equipment. These contributions are amortized over the average useful life of assets for each project, using the straight-line method.
Finally, the legal and regulatory context in which Hydro-Québec operates gives it the right to receive from its customers or the obligation to pay to them, as the case may be, the amounts corresponding to any variance between the actual amount of certain specific items and the amount provided in rate filings for these items. They therefore give rise to financial assets or liabilities that are recovered or settled over a period of one to five years. These assets bear interest at the rates prescribed by the Régie until such time as amortization begins.

- 58 -
Note 3 Regulation (continued)
The following table presents the net balance of financial assets and liabilities:
FINANCIAL ASSETS AND LIABILITIES
Note 2016 2015
Variances in supply costs for electricity in excess of the heritage pool (20) 368
Revenue variances related to climate conditions 176 32
Variances in pension cost (45) (8)
Variances in the expense related to the activities of the Bureau de l’efficacité et de l’innovation énergétiques 19 8
Other 32 17
162 417
Presented as follows:
Accounts receivable and other receivables 29 215
Other assets 10 133 226
Other liabilities – (24)
Regulatory assets and liabilities and financial assets and liabilities are not included in the rate base, except for costs related to the EEP, costs related to the de-icing system at Lévis substation, and development costs.

- 59 -
Note 4 Depreciation and Amortization
2016 2015 2014
Property, plant and equipment 2,209 2,160 2,099
Intangible assetsa 178 164 150
Regulatory assets and liabilities 120 297 248
Retirement of capital assets 90 92 96
2,597 2,713 2,593
a) For the period from 2017 to 2021, amortization of intangible assets that have already been recognized should be as follows: $171 million in 2017, $100 million in 2018, $70 million in 2019, $42 million in 2020 and $22 million in 2021.
Note 5 Taxes
2016 2015 2014
Water-power royaltiesa 673 660 656
Public utilities taxb 284 268 252
Municipal, school and other taxesc 88 52 67
1,045 980 975
a) Water-power royalties payable to the Québec government totaled $667 million in 2016 ($654 million in 2015 and $651 million in 2014), including a balance due of $68 million as at December 31, 2016 (balance due of $3 million as at December 31, 2015, and balance receivable of $3 million as at December 31, 2014).
b) The public utilities tax is payable to the Québec government.
c) Including two amounts payable to the Québec government in 2016, namely $36 million under the Act Respecting Energy Efficiency and Innovation ($32 million in 2015 and $21 million in 2014), of which no balance was outstanding as at December 31, 2016 ($7 million as at December 31, 2015, and nil as at December 31, 2014), and $15 million under the Act to establish the Northern Plan Fund (nil in 2015 and 2014), which was outstanding as at December 31, 2016.
Note 6 Financial Expenses
2016 2015 2014
Interest on debt securities 2,510 2,552 2,594
Net exchange loss (gain) 32 (69) (25)
Guarantee fees related to debt securitiesa 218 205 205
2,760 2,688 2,774
Less
Capitalized financial expenses 194 211 318
Net investment income 34 28 31
228 239 349
2,532 2,449 2,425
a) Guarantee fees related to debt securities are paid to the Québec government.

- 60 -
Note 7 Property, Plant and Equipment
2016
In service
Accumulated depreciation
Under construction
Net carrying amount
Generation
Hydraulic 45,744 17,438 2,271 30,577
Thermal 393 377 – 16
Other 792 470 8 330
46,929 18,285 2,279 30,923
Transmission
Substations and lines 30,052 11,637 1,749 20,164
Other 2,562 1,500 95 1,157
32,614 13,137 1,844 21,321
Distribution
Substations and lines 14,224 6,499 359 8,084
Other 3,432 1,768 101 1,765
17,656 8,267 460 9,849
Construction 42 23 1 20
Corporate and Other Activities 1,307 817 88 578
98,548a 40,529a 4,672 62,691
2015
In service
Accumulated depreciation
Under construction
Net carrying amount
Generation
Hydraulic 45,462 16,772 1,752 30,442
Thermal 405 384 – 21
Other 776 463 21 334
46,643 17,619 1,773 30,797
Transmission
Substations and lines 29,210 11,116 1,321 19,415
Other 2,454 1,417 114 1,151
31,664 12,533 1,435 20,566
Distribution
Substations and lines 13,830 6,221 360 7,969
Other 3,335 1,683 101 1,753
17,165 7,904 461 9,722
Construction 39 21 – 18
Corporate and Other Activities 1,148 777 84 455
96,659a 38,854a 3,753 61,558
a) As at December 31, 2016, the cost and accumulated depreciation of property, plant and equipment in service under capital leases amounted to $885 million and $163 million, respectively ($699 million and $127 million as at December 31, 2015).

- 61 -
Note 8 Intangible Assets
2016 2015
Cost Accumulatedamortization
Net carrying amount Cost
Accumulatedamortization
Net carrying amount
Subject to amortization
Software and licences 1,897 1,421 476 1,849 1,277 572
Patents 26 17 9 25 14 11 1,923 1,438 485 1,874 1,291 583
Not subject to amortization
Servitudes 442 426
Rights 11 5 453 431
938 1,014
Additions corresponding to internally developed software totaled $81 million in 2016 ($91 million in 2015 and $113 million in 2014).
Note 9 Investments
2016 2015
At equity
Churchill Falls (Labrador) Corporation Limited (34.2%) 249 231
Société en commandite Hydroélectrique Manicouagan (60.0%)a 613 621
862 852
Other 22 7
884 859
a) This investment includes the unamortized excess of the purchase price over the underlying net carrying amount of the assets of Société en commandite Hydroélectrique Manicouagan as at the acquisition date, which is composed of unamortizable intangible assets of $282 million and amortizable assets of $262 million (respectively, $282 million and $273 million in 2015).
In 2016, electricity purchases from Churchill Falls (Labrador) Corporation Limited [CF(L)Co] and Société en commandite Hydroélectrique Manicouagan totaled $103 million and $81 million, respectively ($110 million and $81 million in 2015, and $102 million and $78 million in 2014).
Note 10 Other Assets
2016 2015
Government reimbursement for the 1998 ice storma 66 66
Receivablesb 133 226
Other 16 16
215 308
a) In accordance with the terms and conditions in effect since January 1, 2013, the Québec government will pay the full amount of the reimbursement no later than October 15, 2019. In the meantime, it pays annual interest calculated at the Bankers’ Acceptance Rate for a 12-month term.
b) These receivables are related to variances between the actual amount of certain specific items and the amount provided in rate filings for these items.
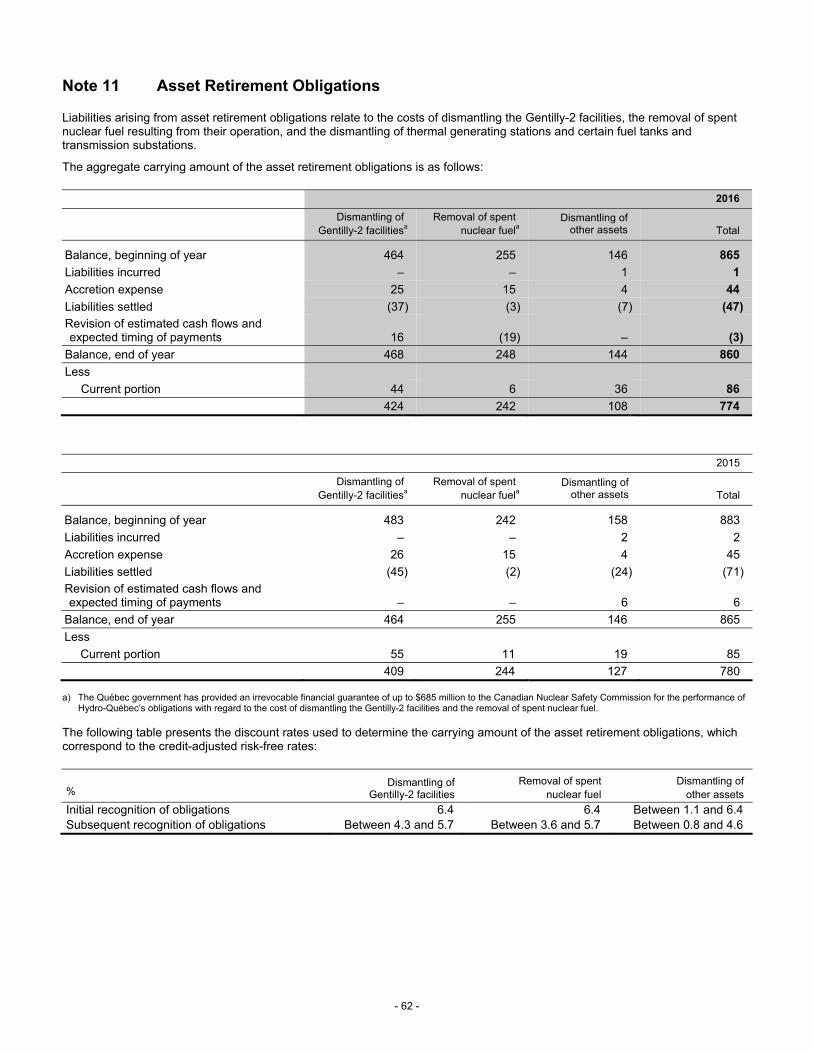
- 62 -
Note 11 Asset Retirement Obligations
Liabilities arising from asset retirement obligations relate to the costs of dismantling the Gentilly-2 facilities, the removal of spent nuclear fuel resulting from their operation, and the dismantling of thermal generating stations and certain fuel tanks and transmission substations.
The aggregate carrying amount of the asset retirement obligations is as follows:
2016
Dismantling of
Gentilly-2 facilitiesa Removal of spent
nuclear fuela Dismantling of
other assets
Total
Balance, beginning of year 464 255 146 865
Liabilities incurred – – 1 1
Accretion expense 25 15 4 44
Liabilities settled (37) (3) (7) (47)
Revision of estimated cash flows and expected timing of payments 16 (19) – (3)
Balance, end of year 468 248 144 860
Less
Current portion 44 6 36 86
424 242 108 774
2015
Dismantling of
Gentilly-2 facilitiesa Removal of spent
nuclear fuela Dismantling of
other assets
Total
Balance, beginning of year 483 242 158 883
Liabilities incurred – – 2 2
Accretion expense 26 15 4 45
Liabilities settled (45) (2) (24) (71)
Revision of estimated cash flows and expected timing of payments – – 6 6
Balance, end of year 464 255 146 865
Less
Current portion 55 11 19 85
409 244 127 780
a) The Québec government has provided an irrevocable financial guarantee of up to $685 million to the Canadian Nuclear Safety Commission for the performance of Hydro-Québec’s obligations with regard to the cost of dismantling the Gentilly-2 facilities and the removal of spent nuclear fuel.
The following table presents the discount rates used to determine the carrying amount of the asset retirement obligations, which correspond to the credit-adjusted risk-free rates:
%
Dismantling of Gentilly-2 facilities
Removal of spent nuclear fuel
Dismantling of other assets
Initial recognition of obligations Subsequent recognition of obligations
6.4 Between 4.3 and 5.7
6.4 Between 3.6 and 5.7
Between 1.1 and 6.4 Between 0.8 and 4.6

- 63 -
Note 11 Asset Retirement Obligations (continued)
HYDRO-QUÉBEC TRUST FOR MANAGEMENT OF NUCLEAR FUEL WASTE
Under the Nuclear Fuel Waste Act (NFWA), which came into force in 2002, the owners of nuclear fuel waste in Canada were required to set up a management organization, the Nuclear Waste Management Organization, and each of them was required to establish a trust fund to finance the cost of long-term management of its nuclear fuel waste.
In April 2009, the Government of Canada approved a formula for financing the costs of the approach adopted for long-term nuclear fuel waste management. The amounts deposited in the trust funds can only be used to finance the implementation of this approach.
Hydro-Québec has made all the payments required under the NFWA. As at December 31, 2016, the investments held in the Hydro-Québec trust fund were composed of debt securities issued by Hydro-Québec, the fair value of which totaled $161 million ($153 million as at December 31, 2015).
The Hydro-Québec Trust for Management of Nuclear Fuel Waste is considered a variable interest entity of which Hydro-Québec is the primary beneficiary.
Note 12 Long-Term Debt
Long-term debt is mainly composed of bonds, medium-term notes and other debts, including liabilities under agreements entered into with local communities. The following table presents a breakdown of the debt, including the current portion, at amortized cost, by currency at the time of issue and at the time of repayment. Forward contracts and currency swaps traded for purposes of managing currency risk related to long-term debt were taken into account in determining the percentages of debt by currency at the time of repayment.
2016 2015
At time of issue
At time of repayment
At time of issue
At time of repayment
In
Canadian dollars
and other currencies
At closing exchange
rates as at the
balance sheet date
%
%
In
Canadian dollars
and other currencies
At closing exchange
rates as at the
balance sheet date
%
%
Canadian dollarsa, b 36,232 36,232 80 100 33,953 33,953 75 100
U.S. dollars 6,701 9,000 20 – 8,098 11,212 25 –
Other currencies
Euros – – – – 60 91 – –
Yen 1,000 12 – – 1,000 12 – –
45,244 100 100 45,268 100 100
Plus
Adjustment for fair value hedged risk 372 404
45,616 45,672
Less
Current portion 1,398 2,059
44,218 43,613
a) Including non-interest-bearing debts other than bonds and medium-term notes whose discounted value was $1,466 million as at December 31, 2016 ($1,345 million as at December 31, 2015).
b) Certain debts carry sinking fund requirements. An amount of $729 million ($701 million as at December 31, 2015) is presented under Short-term investments for this purpose.
The table below presents the amortized cost, at the balance sheet date, of the tranches of long-term debt maturing over the next five years:
2017 1,398 2018 1,167 2019 3,144 2020 2,471 2021 2,381
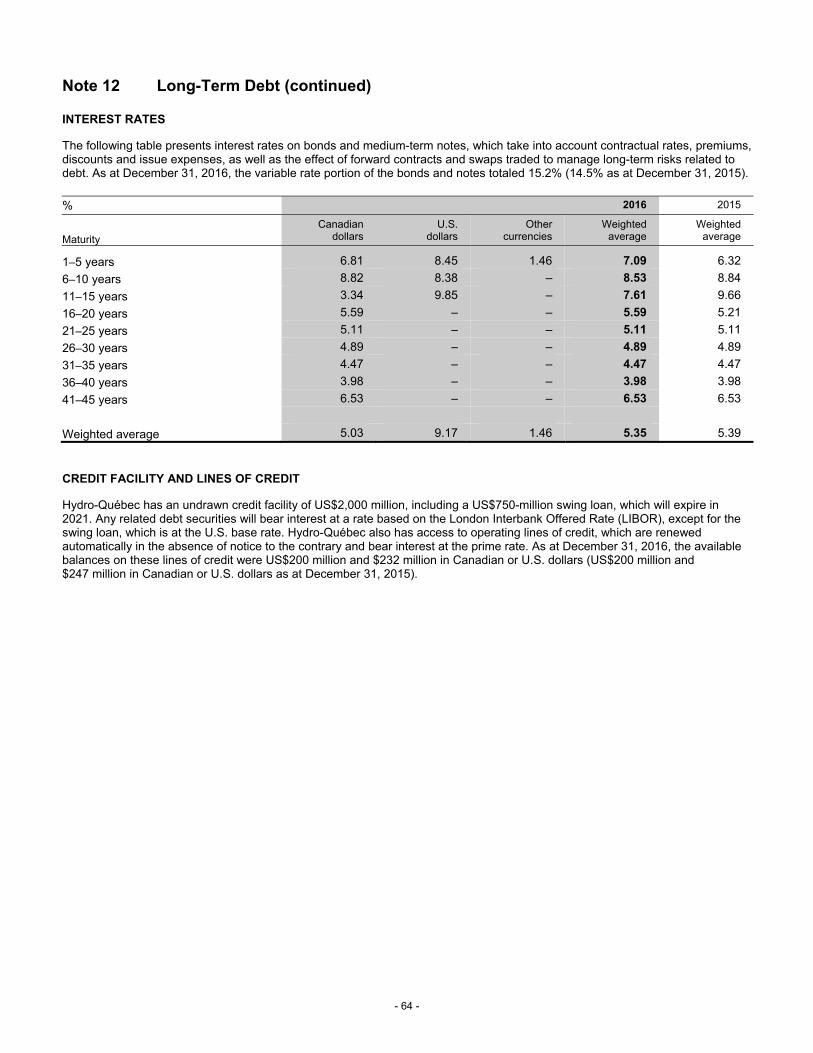
- 64 -
Note 12 Long-Term Debt (continued)
INTEREST RATES
The following table presents interest rates on bonds and medium-term notes, which take into account contractual rates, premiums, discounts and issue expenses, as well as the effect of forward contracts and swaps traded to manage long-term risks related to debt. As at December 31, 2016, the variable rate portion of the bonds and notes totaled 15.2% (14.5% as at December 31, 2015).
% 2016 2015
Maturity
Canadian dollars
U.S. dollars
Other currencies
Weighted average
Weighted average
1–5 years 6.81 8.45 1.46 7.09 6.32
6–10 years 8.82 8.38 – 8.53 8.84
11–15 years 3.34 9.85 – 7.61 9.66
16–20 years 5.59 – – 5.59 5.21
21–25 years 5.11 – – 5.11 5.11
26–30 years 4.89 – – 4.89 4.89
31–35 years 4.47 – – 4.47 4.47
36–40 years 3.98 – – 3.98 3.98
41–45 years 6.53 – – 6.53 6.53
Weighted average 5.03 9.17 1.46 5.35 5.39
CREDIT FACILITY AND LINES OF CREDIT
Hydro-Québec has an undrawn credit facility of US$2,000 million, including a US$750-million swing loan, which will expire in 2021. Any related debt securities will bear interest at a rate based on the London Interbank Offered Rate (LIBOR), except for the swing loan, which is at the U.S. base rate. Hydro-Québec also has access to operating lines of credit, which are renewed automatically in the absence of notice to the contrary and bear interest at the prime rate. As at December 31, 2016, the available balances on these lines of credit were US$200 million and $232 million in Canadian or U.S. dollars (US$200 million and $247 million in Canadian or U.S. dollars as at December 31, 2015).

- 65 -
Note 13 Other Liabilities
Note 2016 2015
Employee future benefit liabilities 18 2,395 2,174
Accounts payable 507 397
2,902 2,571
Accounts payable include a $359-million financial liability ($239 million as at December 31, 2015) related to an agreement regarding the temporary suspension of deliveries from a generating station, which was approved by the Régie in May 2014. The current portion, presented under Accounts payable and accrued liabilities, totaled $123 million as at December 31, 2016 ($117 million as at December 31, 2015). This financial liability, including the current portion, represents a discounted amount of $482 million ($356 million as at December 31, 2015) and contained an outstanding amount, payable in U.S. dollars, of $32 million (US$24 million) as at December 31, 2016 ($22 million, or US$16 million, as at December 31, 2015). As at December 31, 2016, the effective rate of this liability was 1.22% (1.56% as at December 31, 2015).
Note 14 Perpetual Debt
Perpetual notes in the amount of $293 million (US$218 million) as at December 31, 2016, and of $311 million (US$225 million) as at December 31, 2015, bear interest at LIBOR, plus 0.0625%, as calculated semiannually. As at December 31, 2016 and 2015, the rates applicable to the perpetual notes were 1.3% and 0.6%, respectively.
The perpetual notes are redeemable at Hydro-Québec’s option. In 2016, portions totaling $10 million (US$7 million) were repurchased on the secondary market and then canceled ($6 million, or US$5 million, in 2015). Forward contracts are used to mitigate the currency risk associated with the perpetual debt.

- 66 -
Note 15 Financial Instruments
In the course of its operations, Hydro-Québec carries out transactions that expose it to certain financial risks, such as market, liquidity and credit risk. Exposure to such risks and the impact on results are reduced through careful monitoring and implementation of strategies that include the use of derivative instruments.
MARKET RISK
Market risk is the risk that the fair value or future cash flows of a financial instrument will fluctuate as a result of changes in market prices. Hydro-Québec is exposed to three main types of market risk: currency risk, interest rate risk and risk associated with energy and aluminum prices. Active integrated management of these three types of risk aims to limit exposure to each risk and reduce their overall impact on results.
MANAGEMENT OF LONG-TERM RISK
Management of risk associated with debt
Currency risk and interest rate risk – Hydro-Québec uses forward contracts and currency swaps to manage the currency risk associated with long-term debt and perpetual debt, as well as forward contracts and interest rate swaps to modify long-term exposure to interest rate risk. When designated as hedging items, these derivative instruments are recognized as cash flow hedges or fair value hedges, depending on the risk hedged. The impact on results of foreign currency hedging transactions and those associated with debt interest rates is recognized in Financial expenses.
The following table presents the notional amounts, expressed in Canadian dollars and foreign currencies, of forward contracts and swaps used to manage long-term risk:
2016a 2015a
Forward contracts
U.S. dollars 1,223 2,230
Swaps
Canadian dollars (7,969) (9,400)
U.S. dollars 5,730 6,042
Other currencies
Euros – 61
Yen 1,000 1,000
a) Figures in parentheses represent amounts to be paid.
MANAGEMENT OF SHORT-TERM RISK
Currency risk – Hydro-Québec uses forward contracts to manage its foreign currency risk exposure over the short term. When designated as hedging items, these derivative instruments are recognized as cash flow hedges. The impact of currency risk hedging transactions on results is recognized in the line item affected by the hedged item, namely Revenue, Electricity and fuel purchases, or Financial expenses. The notional amount of open positions in currency sales contracts as at December 31, 2016, was US$1,175 million (US$1,129 million as at December 31, 2015).
Interest rate risk – Hydro-Québec uses forward rate agreements and interest rate swaps to manage short-term interest rate risk. When designated as hedging items, these derivative instruments are recognized as cash flow hedges. The impact on results of transactions to hedge short-term interest rate risk is recognized in the line item affected by the hedged item, namely Financial expenses.

- 67 -
Note 15 Financial Instruments (continued)
Price risk – Hydro-Québec uses mainly commodity futures and swaps to manage risk resulting from fluctuations in energy and aluminum prices. When designated as hedging items, these derivative instruments are recognized as cash flow hedges. The impact on results of transactions to hedge the risk related to energy and aluminum prices is recognized in the line item affected by the hedged item, namely Revenue or Electricity and fuel purchases. In this context, Hydro-Québec has traded electricity futures and swaps for which open positions as at December 31, 2016, totaled 19.9 TWh (20.0 TWh as at December 31, 2015), natural gas futures for which open positions as at December 31, 2016, totaled 0.5 million MMBtu (no open position as at December 31, 2015), petroleum product swaps for which open positions as at December 31, 2016, totaled 2.6 million litres (8.5 million litres as at December 31, 2015), as well as aluminum swaps for which open positions as at December 31, 2016, totaled 254,050 tonnes (no open position as at December 31, 2015).
LIQUIDITY RISK
Liquidity risk is the risk that an entity will encounter difficulty in meeting obligations associated with its financial liabilities.
Hydro-Québec’s exposure to this risk is reduced by: significant cash flows from operating activities; a diversified portfolio of highly liquid or readily convertible instruments traded with high-quality counterparties; preauthorized sources of financing; the ability to access capital markets; the diversification of financing sources; and management of the volume of floating-rate debt and debt repayable in foreign currency.
Moreover, as at December 31, 2016, $43,491 million in long-term debt, perpetual debt and borrowings, net of the sinking fund, was guaranteed by the Québec government ($43,672 million as at December 31, 2015).
CREDIT RISK
Credit risk is the risk that one party to a financial asset will fail to meet its obligations.
Hydro-Québec is exposed to credit risk related to cash and cash equivalents, short-term investments and derivative instruments traded with financial institutions. It is also exposed to credit risk related to accounts receivable and other receivables, which arises primarily from its day-to-day electricity sales in and outside Québec. Credit risk is limited to the carrying amount of the related assets presented on the balance sheet, which approximates fair value.
Cash and cash equivalents, short-term investments and derivative instruments
In order to reduce its credit risk exposure, Hydro-Québec deals with a number of issuers and financial institutions with high credit ratings, most of which are Canadian. In addition, it applies policies to limit risk concentration as well as various monitoring programs and sets credit limits for each counterparty. Through prior agreements, it can also limit the market value of the main derivative instrument portfolios. Any variation in market value beyond the agreed-upon limit results in a cash receipt or payment. As at December 31, 2016, substantially all counterparties dealing with Hydro-Québec had a credit rating of A or higher, and none of them had defaulted on their obligations to Hydro-Québec.
Accounts receivable and other receivables
Exposure to credit risk from electricity sales is limited due to Hydro-Québec’s large and diverse customer base. Management believes that Hydro-Québec is not exposed to a significant credit risk, particularly because sales in Québec are billed at rates that allow for recovery of costs based on the terms and conditions set by the Régie. Moreover, Hydro-Québec holds as collateral customer deposits totaling $119 million ($115 million as at December 31, 2015), of which $32 million ($30 million as at December 31, 2015) is recognized in Accounts payable and accrued liabilities and $87 million ($85 million as at December 31, 2015) in Other liabilities.
The value of accounts receivable and other receivables, net of the related allowance for doubtful accounts, is presented in the following table:
2016 2015
Accounts receivablea 1,684 1,626
Other receivablesb 365 616
2,049c 2,242c
a) Including unbilled electricity deliveries, which totaled $1,206 million as at December 31, 2016 ($1,093 million as at December 31, 2015).
b) Including a $104-million financial guarantee ($189 million in 2015) covering certain derivative instruments held at year end.
c) Including US$159 million (US$229 million in 2015) translated at the exchange rate in effect at the balance sheet date.
The allowance for doubtful accounts receivable amounted to $250 million as at December 31, 2016 ($273 million as at December 31, 2015).

- 68 -
Note 15 Financial Instruments (continued)
FAIR VALUE
FAIR VALUE OF DERIVATIVE INSTRUMENTS
The following tables present the fair value of derivative instruments by type and depending on whether they are designated as fair value hedges or cash flow hedges, or not designated as hedges:
2016
Derivatives designated as
fair value hedges
Derivatives designated as
cash flow hedges
Derivatives not
designated as hedgesa
Gross amounts of derivatives recognizedb
Assets
Contracts – Currency risk – 1,217 94 1,311 Contracts – Currency risk and interest rate risk 1 – – 1 Contracts – Interest rate risk 540 – – 540 Contracts – Price risk – 54 57 111
541 1,271 151 1,963
Liabilities
Contracts – Currency risk – (152) (1,028) (1,180) Contracts – Currency risk and interest rate risk – – – – Contracts – Interest rate risk – (2) (3) (5) Contracts – Price risk – (48) (16) (64)
– (202) (1,047) (1,249)
Total 541 1,069 (896) 714
2015
Derivatives designated as
fair value hedges
Derivatives designated as
cash flow hedges
Derivatives not
designated as hedgesa
Gross amounts of derivatives recognizedb
Assets
Contracts – Currency risk – 1,682 157 1,839 Contracts – Currency risk and interest rate risk 1 – – 1 Contracts – Interest rate risk 573 – – 573 Contracts – Price risk – 219 84 303
574 1,901 241 2,716
Liabilities Contracts – Currency risk – (139) (2,398) (2,537) Contracts – Currency risk and interest rate risk – – – – Contracts – Interest rate risk – (7) (6) (13) Contracts – Price risk – (24) (44) (68)
– (170) (2,448) (2,618)
Total 574 1,731 (2,207) 98
a) These derivative instruments are mainly traded as part of Hydro-Québec’s risk management. As at December 31, 2016, $(1,023) million was in consideration of amounts received or disbursed [$(2,331) million as at December 31, 2015] with respect to agreements to limit the market value of the main portfolios of derivative instruments. These agreements arise from frameworks applied by Hydro-Québec to reduce its credit risk exposure and limit risk concentration.
b) Fair value measurements of derivative instruments are Level 2 measurements. These measurements are obtained by discounting future cash flows, which are estimated on the basis of the spot rates, forward rates or forward prices (foreign exchange rates, interest rates, and energy or aluminum prices) in effect on the balance sheet date and take into account the credit risk assessment. The valuation techniques make use of observable market data.

- 69 -
Note 15 Financial Instruments (continued)
The impact of offsetting derivative instruments is presented in the table below:
2016 2015
Gross
amounts of derivatives recognized
Gross amounts
offseta
Cash (received)
paid as collateralb
Net amounts presented on
the balance sheet
Gross amounts of derivatives recognized
Gross amounts
offseta
Cash (received)
paid as collateralb
Net amounts presented on
the balance sheet
Assets
Current 223 (110) (13) 100 452 (178) – 274
Long-term 1,740 (974) (482) 284 2,264 (2,136) – 128 1,963 (1,084) (495) 384 2,716 (2,314) – 402
Liabilities
Current (1,091) 939 – (152) (2,550) 2,251 – (299)
Long-term (158) 145 – (13) (68) 63 – (5) (1,249) 1,084 – (165) (2,618) 2,314 – (304)
Total 714 – (495) 219 98 – – 98
a) The gross amounts of derivatives offset are related to contracts traded according to International Swaps and Derivatives Association (ISDA) guidelines and constituting enforceable master netting arrangements. Such master netting arrangements apply to all derivative instrument contracts traded over the counter.
b) Cash amounts offset are amounts received or paid under collateral exchange agreements signed in compliance with ISDA guidelines.
Moreover, although certain derivatives cannot be offset for lack of enforceable master netting arrangements, margin calls may result in amounts received from or paid to clearing agents, based on the fair value of the instruments concerned. As at December 31, 2016, $27 million receivable from clearing agents in consideration of net cash payments was included in Accounts receivable and other receivables, under Current assets on the balance sheet (nil as at December 31, 2015). In addition, $16 million payable to clearing agents in consideration of net cash receipts was included in Accounts payable and accrued liabilities, under Current liabilities on the balance sheet ($316 million as at December 31, 2015).
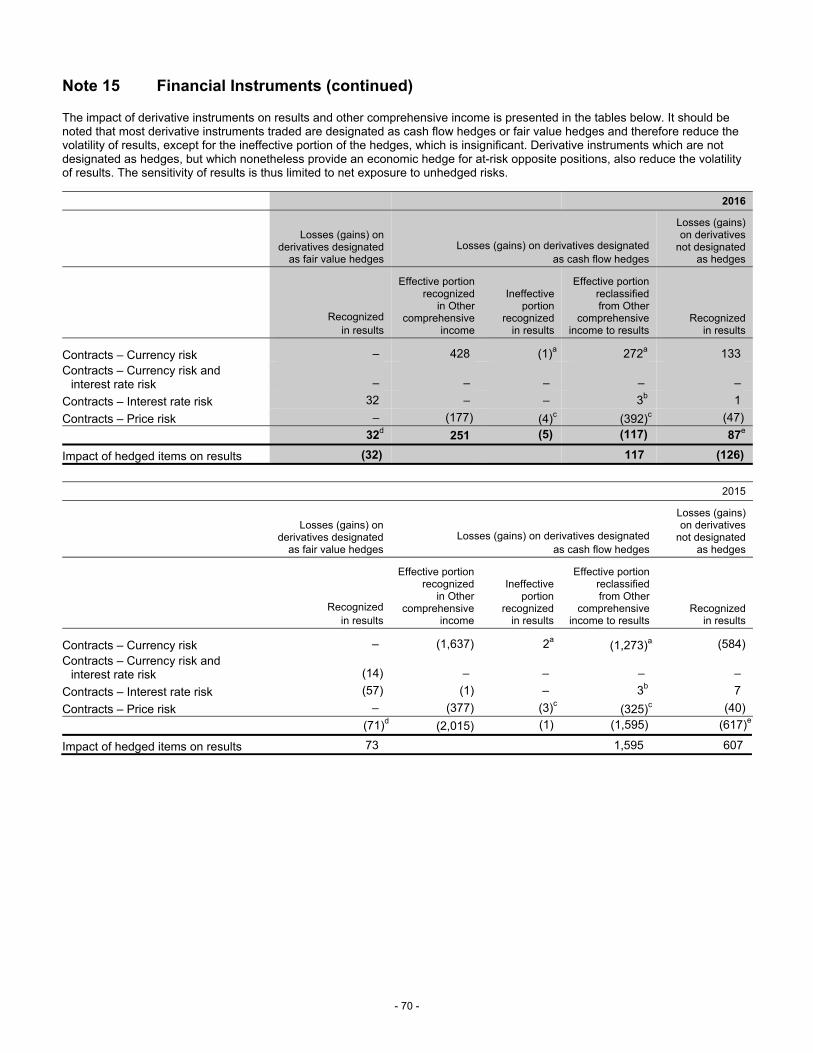
- 70 -
Note 15 Financial Instruments (continued)
The impact of derivative instruments on results and other comprehensive income is presented in the tables below. It should be noted that most derivative instruments traded are designated as cash flow hedges or fair value hedges and therefore reduce the volatility of results, except for the ineffective portion of the hedges, which is insignificant. Derivative instruments which are not designated as hedges, but which nonetheless provide an economic hedge for at-risk opposite positions, also reduce the volatility of results. The sensitivity of results is thus limited to net exposure to unhedged risks.
2016
Losses (gains) on derivatives designated
as fair value hedges Losses (gains) on derivatives designated
as cash flow hedges
Losses (gains) on derivatives
not designated as hedges
Recognized
in results
Effective portion recognized
in Other comprehensive
income
Ineffective portion
recognized in results
Effective portion reclassified from Other
comprehensive income to results
Recognized in results
Contracts – Currency risk – 428 (1)a 272a 133
Contracts – Currency risk and interest rate risk – – – – –
Contracts – Interest rate risk 32 – – 3b 1
Contracts – Price risk – (177) (4)c (392)c (47) 32d 251 (5) (117) 87e
Impact of hedged items on results (32) 117 (126)
2015
Losses (gains) on derivatives designated
as fair value hedges Losses (gains) on derivatives designated
as cash flow hedges
Losses (gains) on derivatives
not designated as hedges
Recognized
in results
Effective portion recognized
in Other comprehensive
income
Ineffective portion
recognized in results
Effective portion reclassified from Other
comprehensive income to results
Recognized in results
Contracts – Currency risk – (1,637) 2a (1,273)a (584)
Contracts – Currency risk and interest rate risk (14) – – – –
Contracts – Interest rate risk (57) (1) – 3b 7
Contracts – Price risk – (377) (3)c(325)c (40)
(71)d (2,015) (1) (1,595) (617)e
Impact of hedged items on results 73 1,595 607

- 71 -
Note 15 Financial Instruments (continued)
2014
Losses (gains) on derivatives designated
as fair value hedges Losses (gains) on derivatives designated
as cash flow hedges
Losses (gains) on derivatives
not designated as hedges
Recognized
in results
Effective portion recognized
in Other comprehensive
income
Ineffective portion
recognized in results
Effective portion reclassified from Other
comprehensive income to results
Recognized in results
Contracts – Currency risk – (745) 3a (728)a (215)
Contracts – Currency risk and interest rate risk (1) – – – –
Contracts – Interest rate risk (254) 1 – 12b –
Contracts – Price risk – (185) (4)c 175c (12) (255)d (929) (1) (541) (227)e
Impact of hedged items on results 241 – 541 242
a) In 2016, $13 million was recognized in Revenue [$106 million in 2015 and $(136) million in 2014], and $258 million in Financial expenses [$(1,377) million in 2015 and $(589) million in 2014].
b) In 2016 and 2015, $3 million was recognized in Financial expenses ($12 million in 2014).
c) In 2016, $(396) million was recognized in Revenue [$(328) million in 2015 and $166 million in 2014]; no amount was recognized in Electricity and fuel purchases (nil in 2015 and $5 million in 2014)
d) This amount, including any ineffective portion, which was nil in 2016 [$2 million in 2015 and $(14) million in 2014], was recognized in Financial expenses.
e) These instruments are essentially related to integrated risk management transactions. The impact of these instruments on results is recognized in the line item affected by the managed risk. Therefore, in 2016, $(49) million was recognized in Revenue [$4 million in 2015 and $(8) million in 2014], $(16) million in Electricity and fuel purchases [$(20) million in 2015 and $(3) million in 2014] and $152 million in Financial expenses [$(601) million in 2015 and $(216) million in 2014].
In 2016, Hydro-Québec did not reclassify any amounts from Accumulated other comprehensive income to results after having discontinued cash flow hedges (net gain of $3 million in 2015 and net loss of $11 million in 2014).
As at December 31, 2016, the net amount of gains presented in Accumulated other comprehensive income that would be reclassified to results in the next 12 months was estimated at $17 million ($103 million as at December 31, 2015 and $115 million as at December 31, 2014).
As at December 31, 2016, the maximum period during which Hydro-Québec hedged its exposure to the variability of cash flows related to anticipated transactions was two years (three years in 2015 and 2014).
FAIR VALUE OF OTHER FINANCIAL INSTRUMENTS
Fair value measurements for other financial instruments are Level 2 measurements. Fair value is obtained by discounting future cash flows, based on rates observed on the balance sheet date for similar instruments traded on capital markets.
The fair value of cash equivalents, receivables – accounts receivable, other receivables and financial liabilities approximates their carrying amount because of the short-term nature of these financial instruments, except in the case of the items presented in the table below:
2016 2015
Carrying amount Fair value Carrying amount Fair value
Long-term debta 45,616 60,931 45,672 62,106
Perpetual debt 293 217 311 237
a) Including the current portion.

- 72 -
Note 16 Equity
SHARE CAPITAL
The authorized share capital consists of 50,000,000 shares with a par value of $100 each, of which 43,741,090 shares were issued and paid up as at December 31, 2016 and 2015.
RETAINED E ARNINGS
Under the Hydro-Québec Act, the dividends to be paid by Hydro-Québec are declared once a year by the Québec government, which also determines the terms and conditions of payment. For a given year, the dividend cannot exceed the distributable surplus, equal to 75% of net income. This calculation is based on the consolidated financial statements. However, in respect of a given year, no dividend may be declared in an amount that would have the effect of reducing the capitalization rate to less than 25% at the end of the year. All or a portion of the distributable surplus that has not been subject to a dividend declaration may no longer be distributed to the shareholder as a dividend.
For 2016, the dividend is $2,146 million ($2,360 million for 2015 and $2,535 million for 2014).
ACCUMULATED OTHER COMPREHENSIVE INCOME
2016
Cash flow
hedges
Employee future
benefits Translation differences
Accumulated other
comprehensive income
Balance, beginning of year 233 (1,678) – (1,445)
Other comprehensive income before reclassifications (251) (234) 3 (482) Amounts reclassified to results (117) 113 – (4)
Other comprehensive income (368) (121)a 3 (486)
Balance, end of year (135) (1,799) 3 (1,931)
2015
Cash flow
hedges
Employee future
benefits Translation differences
Accumulated other
comprehensive income
Balance, beginning of year (187) (1,985) – (2,172)
Other comprehensive income before reclassifications 2,015 64 – 2,079 Amounts reclassified to results (1,595) 243 – (1,352)
Other comprehensive income 420 307a – 727
Balance, end of year 233 (1,678) – (1,445)
2014
Cash flow
hedges
Employee future
benefits Translation differences
Accumulated other
comprehensive income
Balance, beginning of year (575) (1,514) – (2,089)
Other comprehensive income before reclassifications 929 (696) – 233 Amounts reclassified to results (541) 225 – (316)
Other comprehensive income 388 (471)a – (83)
Balance, end of year (187) (1,985) – (2,172)
a) Other comprehensive income includes the change in the employee future benefit regulatory asset, which totaled $245 million in 2016 [$(385) million in 2015 and $1,312 million in 2014].
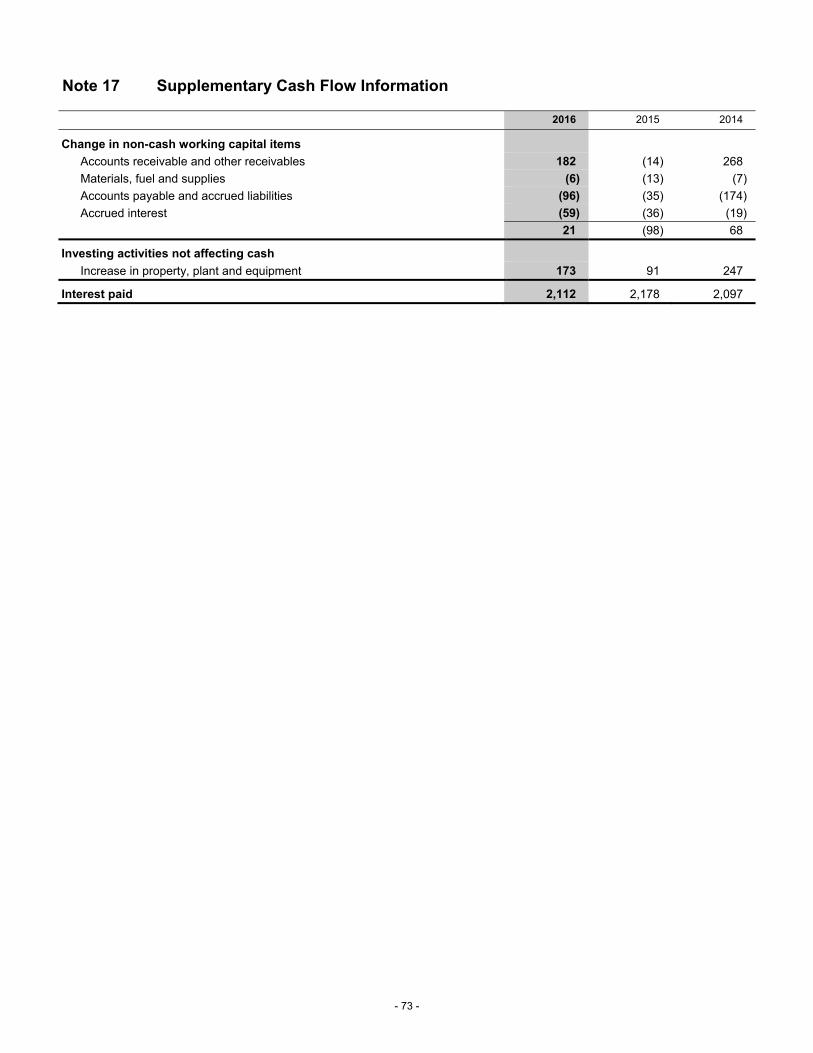
- 73 -
Note 17 Supplementary Cash Flow Information
2016 2015 2014
Change in non-cash working capital items
Accounts receivable and other receivables 182 (14) 268
Materials, fuel and supplies (6) (13) (7)
Accounts payable and accrued liabilities (96) (35) (174)
Accrued interest (59) (36) (19)
21 (98) 68
Investing activities not affecting cash
Increase in property, plant and equipment 173 91 247
Interest paid 2,112 2,178 2,097

- 74 -
Note 18 Employee Future Benefits
The Pension Plan is a fully funded contributory plan that ensures pension benefits based on the number of years of service and an average of the best five years of earnings. These benefits are indexed annually based on a rate which is the greater of the inflation rate, up to a maximum of 2%, and the inflation rate less 3%.
Hydro-Québec also offers other post-retirement and post-employment benefits. Post-retirement benefits are provided by group life, medical and hospitalization insurance plans, which are contributory plans with contributions adjusted annually. Post-employment benefits are under non-contributory salary insurance plans, which pay short- and long-term disability benefits. Most of these plans are not funded, with the exception of the long-term disability salary insurance plan, which is fully funded, and the supplementary group life insurance plan, which is partially funded.
All Hydro-Québec’s plans are defined benefit plans. The projected benefit obligations of these plans, valued by independent actuaries, and their assets, at fair value, are valued as at December 31 of each year. The most recent actuarial valuation of the Pension Plan for funding purposes was as at December 31, 2015, at which date the plan was funded at 129.5%. The next valuation must be as at December 31, 2016.
CHANGES IN PROJECTED BENEFIT OBLIGATIONS AND IN PLAN ASSETS, AT FAIR VALUE
Pension Plan Other plans
2016 2015 2016 2015
Projected benefit obligations
Balance, beginning of year 23,126 22,275 1,420 1,339
Current service cost 424 441 45 44
Employee contributions 163 148 – –
Benefit payments and refunds (970) (927) (67) (71)
Interest on obligations 766 880 48 53
Actuarial loss 494 309 25 43
Plan amendments – – – 12
Balance, end of year 24,003 23,126 1,471 1,420
Plan assets, at fair value
Balance, beginning of year 22,243 20,778 72 76
Actual return on plan assetsa 1,195 2,019 5 2
Employee contributions 163 148 – –
Contributions by Hydro-Québec 304 225 18 13
Benefit payments and refunds (970) (927) (12) (19)
Balance, end of year 22,935 22,243 83 72
Funded status – Plan deficits 1,068 883 1,388 1,348
Presented as:
Accounts payable and accrued liabilities – – 61 57
Other liabilities 1,068 883 1,327 1,291
a) Administrative and management expenses billed to the Pension Plan by Hydro-Québec amounted to $15 million in 2016 ($16 million in 2015).
As at December 31, 2016, accumulated benefit obligations under the Pension Plan totaled $22,531 million ($21,681 million as at December 31, 2015). Unlike projected benefit obligations, accumulated benefit obligations do not take into account the salary escalation rate assumption.

- 75 -
Note 18 Employee Future Benefits (continued)
PENSION PLAN ASSETS
Investments and their associated risks are managed in accordance with the Hydro-Québec Pension Fund Investment Management Policy (the Investment Policy), which is approved every year by the Board of Directors. These risks include market risk, credit risk and liquidity risk. The Investment Policy provides for diversification of benchmark portfolio securities in order to maximize the expected return within an acceptable risk interval that takes into account the volatility of the Pension Plan’s surplus or deficit. Additional frameworks define the approval process for each type of transaction and establish rules governing the active management of the different portfolios as well as credit risk management. Compliance with the Investment Policy and the additional frameworks is monitored on a regular basis. The Investment Policy allows the use of derivative instruments such as forward contracts, options and swaps.
The target allocation of Pension Plan investments, as established by the Investment Policy in effect as at December 31, 2016, was as follows:
% Target allocation
Fixed-income securities 38
Equities 47
Alternative investmentsa 15
100
a) Alternative investments include real estate investments, private equity investments and commercial mortgages.
The fair value of Pension Plan investments as at December 31, according to the fair value hierarchy and based on the type of securities, was as follows:
2016 2015
Level 1 Level 2 Level 3 Total Level 1 Level 2 Level 3 Total
Short-term investmentsa – 234 – 234 – 213 – 213
Bondsa, b 1,038 7,671 – 8,709 593 6,908 – 7,501
Listed shares 9,129 – – 9,129 9,695 – – 9,695
Real estate investmentsc 183 – 2,703 2,886 349 – 2,474 2,823
Commercial mortgagesa – 72 – 72 – 76 – 76
Private equity investmentsd – – 360 360 – – 234 234
Hedge fundse 445 976 – 1,421 361 1,155 – 1,516
Derivativesf (12) (17) – (29) (11) 24 – 13
10,783 8,936 3,063 22,782 10,987 8,376 2,708 22,071
Otherg 182 206
22,964h 22,277h
a) The fair value of Level 2 short-term investments, bonds and commercial mortgages is essentially measured by discounting net future cash flows, based on the current market rate of return.
b) Pension Plan assets include securities issued by Hydro-Québec, as well as by the Québec government and some of its agencies, for a total of $1,142 million ($1,137 million in 2015).
c) The fair value of Level 3 real estate investments is measured by independent appraisers. The main method used to determine the fair value of these investments is discounting future cash flows. This method is based on observable and unobservable inputs, in particular the discount rate and future cash flows.
d) The fair value of private equity investments is measured by various techniques including future cash flow discounting or using data such as earnings multiples or the price of recent comparable transactions.
e) Hedge funds are measured at the values provided by the fund managers, which are determined on the basis of the fair value of the underlying investments or of the net asset value.
f) Level 2 derivatives are measured using the market closing prices of the underlying products or by discounting net future cash flows.
g) “Other” includes cash, as well as interest and dividends receivable.
h) The fair value of investments does not take into account the net amount of payables and receivables, which is a payable of $29 million ($34 million in 2015).

- 76 -
Note 18 Employee Future Benefits (continued)
A reconciliation of the opening and closing balances of Level 3 investments is presented in the table below:
2016 2015
Real estate
investments Private equity
investments Total Real estate
investments Private equity
investments Total
Balance, beginning of year 2,474 234 2,708 2,121 87 2,208
Unrealized net gains 15 11 26 68 50 118
Realized net gains 6 3 9 28 2 30
Acquisitions and disposals 208 112 320 257 95 352
Balance, end of year 2,703 360 3,063 2,474 234 2,708
In 2016 and 2015, there was no reclassification between Level 3 and Levels 1 and 2.
OTHER PLAN ASSETS
Other plan assets as at December 31, 2016, were composed of bonds issued by Hydro-Québec for a total of $70 million ($67 million as at December 31, 2015), as well as cash amounting to $13 million ($5 million as at December 31, 2015). Bonds are classified at Level 2 in the fair value hierarchy.
PLAN COSTS
NET COST COMPONENTS RECOGNIZED FOR THE YEAR
Pension Plan Other plans
2016 2015 2014 2016 2015 2014
Current service cost 424 441 345 45 44 42
Interest on obligations 766 880 879 48 53 53
Expected return on plan assets (1,337) (1,302) (1,189) (3) (3) (3)
Amortization of net actuarial loss 247 291 181 26 25 11 Amortization of past service costs (credits)
16 29 37 (5) (1) (5) Actuarial loss (gain) on long-term disability
salary insurance plan – – – 9 (4) 2
Net cost recognized for the year 116 339 253 120 114 100
Since January 1, 2016, Hydro-Québec has been using a more precise method to estimate the current service cost and interest on its employee future benefit plan obligations. These costs were previously estimated by applying an average weighted discount rate based on the interest rate curve used to measure employee future benefit obligations at the beginning of the year. Under the new method, separate discount rates based on the interest rate curve are used to reflect the various payment maturity dates of the projected benefits.
In addition, the assumption regarding the expected long-term rate of return on Pension Plan assets was revised downward for 2016.
These changes in accounting estimates have been applied prospectively. For 2016, they resulted in a decrease of $92 million in the recognized net cost of employee future benefits.

- 77 -
Note 18 Employee Future Benefits (continued)
COMPONENTS OF OTHER COMPREHENSIVE INCOME FOR THE YEAR
Pension Plan Other plans
2016 2015 2014 2016 2015 2014
Actuarial loss (gain) 636 (408) 1,829 14 48 182
Past service costs (credits) – – – – 12 (4)
Amortization of net actuarial loss (247) (291) (181) (26) (25) (11)
Amortization of past service (costs) credits (16) (29) (37) 5 1 5 Total decrease (increase) in Other
comprehensive income 373 (728) 1,611 (7) 36 172 Less
Increase (decrease) in the employee future benefit regulatory asset 249 (397) 1,189 (4) 12 123
Net decrease (increase) in Other comprehensive income 124 (331) 422 (3) 24 49
COMPONENTS OF ACCUMULATED OTHER COMPREHENSIVE INCOME
Pension Plan Other plans
2016 2015 2014 2016 2015 2014
Unamortized net actuarial loss 4,499 4,110 4,809 409 421 398
Unamortized past service costs (credits) 43 59 88 (30) (35) (48)
Aggregate of amounts recognized in Accumulated other comprehensive income 4,542 4,169 4,897 379 386 350
Less Employee future benefit regulatory asset 2,879 2,630 3,027 243 247 235
Net amount recognized in Accumulated other comprehensive income 1,663 1,539 1,870 136 139 115
For 2017, the amortization of the net actuarial loss and the past service costs (credits) in the net cost recognized for the year should amount to $222 million and $11 million, respectively, for the Pension Plan, and to $26 million and $(5) million, respectively, for the other plans.

- 78 -
Note 18 Employee Future Benefits (continued)
SIGNIFICANT ACTUARIAL ASSUMPTIONS
The following actuarial assumptions, used to determine the projected benefit obligations and net cost recognized for the plans, result from a weighted average:
Pension Plan Other plans
2016 2015 2014 2016 2015 2014
Projected benefit obligations
Rate at end of year (%)
Discount rate – Projected benefits 3.83 3.89 3.98 3.84 3.89 3.98
Salary escalation ratea 3.14 3.21 3.23 – – –
Net cost recognized
Rate at end of prior year (%)
Discount rate – Current service cost 4.00 3.98 4.77 4.00 3.98 4.77
Discount rate – Interest on obligations 3.34 3.98 4.77 3.41 3.98 4.77
Expected long-term rate of return on plan assetsb 6.50 6.75 6.75 3.95 3.33 3.73
Salary escalation ratea 3.21 3.23 3.31 – – – Active employees’ average remaining years of
service 13 13 12 12 12 12
a) This rate takes salary increases into account as well as promotion opportunities while in service.
b) The expected long-term rate of return on the Pension Plan assets is the average of the expected long-term return on the various asset classes, weighted according to their respective target weightings, plus a rebalancing, diversification and active management premium, net of expected management and administrative fees.
As at December 31, 2016, health care costs were based on an annual growth rate of 4.00% for 2017. According to the assumption used, this rate will increase on a linear basis to reach 6.50% in 2021 and subsequently decrease to a final rate of 4.50% in 2036. A change of 1% in this annual growth rate would have had the following impact in 2016 and 2015:
1% increase 1% decrease
2016 2015 2016 2015
Impact on current service cost and interest cost on projected benefit obligations for the year 9 9 (8) (7)
Impact on projected benefit obligations at end of year 99 110 (78) (85)
BENEFITS TO BE PAID IN NEXT 10 YEARS
Pension Plan Other plans 2017 1,000 68 2018 1,045 70 2019 1,092 72 2020 1,140 74 2021 1,188 76 2022–2026 6,660 420
In 2017, Hydro-Québec expects to make contributions of $280 million and $18 million, respectively, to the Pension Plan and other plans.

- 79 -
Note 19 Commitments and Contingencies
COMMITMENTS
Electricity purchases
On May 12, 1969, Hydro-Québec signed a contract with CF(L)Co whereby Hydro-Québec undertook to purchase substantially all the output from Churchill Falls generating station, which has a rated capacity of 5,428 MW. In 2016, this contract was automatically renewed for a further 25 years in accordance with the contract provisions. On June 18, 1999, Hydro-Québec and CF(L)Co entered into a contract to guarantee the availability of 682 MW of additional power until 2041 for the November 1 to March 31 winter period.
As at December 31, 2016, Hydro-Québec was also committed under contracts to purchase electricity from other power producers. Based on the renewal clauses, the terms of these contracts extend through 2052. Hydro-Québec had also undertaken to purchase power transmission rights.
On the basis of all these commitments, Hydro-Québec expects to make the following payments over the coming years:
2017 1,717 2018 1,906 2019 1,956 2020 1,965 2021 2,094 2022 and thereafter 30,214
Investments
As part of its development projects and activities aimed at maintaining or improving the quality of its assets, Hydro-Québec plans to invest approximately $3.5 billion in property, plant and equipment and intangible assets per year in Québec over the 2017–2021 period.
CONTINGENCIES
Guarantees
In accordance with the terms and conditions of certain debt securities issued outside Canada, Hydro-Québec has undertaken to increase the amount of interest paid to non-residents in the event of changes to Canadian tax legislation governing the taxation of non-residents’ income. Hydro-Québec cannot estimate the maximum amount it might have to pay under such circumstances. Should an amount become payable, Hydro-Québec has the option of redeeming most of the securities in question. As at December 31, 2016, the amortized cost of the long-term debts concerned was $4,389 million.
Litigation
In the normal course of its development and operating activities, Hydro-Québec is sometimes party to claims and legal proceedings. Management is of the opinion that an adequate provision has been made for these legal actions. Consequently, it does not foresee any significant adverse effect of such contingent liabilities on Hydro-Québec’s consolidated operating results or financial position.
Among other ongoing actions, some Aboriginal communities have instituted proceedings against the governments of Canada and Québec, as well as against Hydro-Québec, based on demands concerning their ancestral rights. In particular, the Innus of Uashat mak Mani-Utenam are demanding $1.5 billion in damages resulting from various operations carried out on land they claim as their own. Hydro-Québec is challenging the legitimacy of these claims.
In June 2009, the Innus of Uashat mak Mani-Utenam filed for an injunction with the Superior Court of Québec to suspend work at the Romaine complex jobsite, and in May 2010, an application was added for an interlocutory injunction to suspend work on the related tie lines. In March 2015, a proposed out-of-court settlement for the injunction proceedings was accepted by a vast majority of the applicants. In November 2015, the Attorney General of Québec filed a motion to have the courts declare as inadmissible the injunctions being brought by dissident claimants. The Superior Court granted this motion in its ruling of February 23, 2016. The dissident claimants appealed the decision, but their appeal was improperly initiated. Given that they did not correct the error within the stipulated six months, the ruling of February 2016 is considered final.
As well, in November 2006, the Innus of Pessamit reactivated a case instituted in 1998 aimed at obtaining, among other things, the recognition of ancestral rights related to Québec lands on which certain hydroelectric generating facilities belonging to the Manic–Outardes complex are located. The Innus of Pessamit are claiming $500 million. Hydro-Québec is challenging the legitimacy of this claim. In July 2015, the Superior Court granted a motion in which the Innus of Pessamit requested that proceedings be suspended until the end of January 2017 so that they could pursue discussions with the Québec government.

- 80 -
Note 20 Segmented Information
Hydro-Québec carries on its activities in the four reportable business segments defined below. The non-reportable business segments and other activities are grouped together under Corporate and Other Activities for reporting purposes.
Generation: Hydro-Québec Production operates and develops Hydro-Québec’s generating facilities. It provides Hydro-Québec Distribution with an annual base volume of up to 165 TWh of heritage pool electricity, and can participate in that division’s calls for tenders in a context of free market competition. In addition, it sells electricity and engages in arbitrage transactions on external markets.
Transmission: Hydro-Québec TransÉnergie operates and develops Hydro-Québec’s power transmission system. It markets system capacity and manages power flows throughout Québec.
Distribution: Hydro-Québec Distribution operates and develops Hydro-Québec’s distribution system and ensures the supply of electricity to the Québec market. It also engages in activities related to selling electricity in Québec, delivering customer services and promoting energy efficiency.
Construction: Hydro-Québec Innovation, équipement et services partagés and Société d’énergie de la Baie James (SEBJ) design, build and refurbish generating and transmission facilities, mainly for Hydro-Québec Production and Hydro-Québec TransÉnergie. Hydro-Québec Innovation, équipement et services partagés is responsible for projects throughout Québec, except in the territory governed by the James Bay and Northern Québec Agreement (JBNQA). SEBJ builds generating facilities in the territory governed by the JBNQA (north of the 49th parallel) and may also carry out certain projects elsewhere in Québec or outside the province.
Corporate and Other Activities: The corporate units help the divisions achieve their business objectives. They include the Groupe – Direction financière et contrôle, Vice-présidence – Affaires corporatives et secrétariat général, Vice-présidence – Financement, trésorerie et caisse de retraite, Vice-présidence – Ressources humaines, Vice-présidence – Technologies de l’information et des communications, Vice-présidence – Développement des affaires, acquisitions et stratégies, Direction principale – Gestion des filiales as well as three units that report to Hydro-Québec Innovation, équipement et services partagés, namely the Direction principale – Centre de services partagés, Direction principale – Approvisionnement stratégique and Direction principale – Institut de recherche d’Hydro-Québec.
The amounts presented for each segment are based on the financial information used to prepare the consolidated financial statements. The accounting policies used to calculate these amounts are as described in Note 1, Significant Accounting Policies, and Note 3, Regulation.
Intersegment transactions related to electricity sales are recorded based on the supply and transmission rates provided for by the Act Respecting the Régie de l’énergie. The Act sets a supply rate for an annual base volume of up to 165 TWh of heritage pool electricity for the Québec market.
Intersegment products and services are measured at full cost, which includes all costs directly associated with product or service delivery.
Most of Hydro-Québec’s revenue is from Québec, and substantially all its property, plant and equipment are related to its Québec operations. In 2016, revenue from outside Québec amounted to $1,771 million, with $1,456 million originating from the United States ($1,825 million and $1,458 million, respectively, in 2015 and $1,736 million and $1,389 million, respectively, in 2014).

- 81 -
Note 20 Segmented Information (continued)
The following tables present information related to results, assets and investing activities by segment:
2016
Generation Transmission Distribution Construction
Corporate and Other Activities
Intersegment eliminations
and adjustments Total
Revenue
External customers 1,766 75 11,434 3 61 – 13,339 Intersegment
customers 4,716 3,140 80 2,222 1,685 (11,843) – Depreciation and
amortization 775 917 779 4 122 – 2,597
Financial expenses 1,205 839 460 – 33 (5) 2,532
Net income 1,870 561 342 1 87 – 2,861
Total assets 32,773 21,476 13,546 59 7,501 (188) 75,167
Investments in property, plant and equipment and intangible assets affecting cash 906 1,757 657 8 132 – 3,460
2015
Generation Transmission Distribution Construction
Corporate and Other Activities
Intersegment eliminations
and adjustments Total
Revenue
External customers 1,833 120 11,752 – 49 – 13,754 Intersegment
customers 4,791 3,188 82 2,098 1,665 (11,824) – Depreciation and
amortization 766 1,033 806 4 104 – 2,713
Financial expenses 1,129 827 471 – 29 (7) 2,449
Net income 2,130 559 364 – 94 – 3,147
Total assets 33,108 20,944 13,425 58 7,829 (165) 75,199
Investments in property, plant and equipment and intangible assets affecting cash 957 1,587 756 1 139 – 3,440

- 82 -
Note 20 Segmented Information (continued)
2014
Generation Transmission Distribution Construction
Corporate and Other Activities
Intersegment eliminations
and adjustments Total
Revenue
External customers 1,758 130 11,695 – 69 – 13,652 Intersegment
customers 5,008 3,122 82 2,281 1,664 (12,157) – Depreciation and
amortization 716 1,032 746 3 96 – 2,593
Financial expenses 1,138 794 463 – 35 (5) 2,425
Net income 2,301 560 343 – 121 – 3,325
Investments in property, plant and equipment and intangible assets affecting cash 1,204 1,623 825 11 152 – 3,815
Note 21 Comparative Information
Some of the prior year’s data have been reclassified to conform to the presentation adopted in the current year.

- 83 -
SUPPLEMENTARY INFORMATION (UNAUDITED)
Long-term debt is shown at amortized cost (see “Note 1 to the 2016 Consolidated Financial Statements” under “Financial Instruments – Other receivables and financial liabilities”).
The following table sets forth the non-consolidated and outstanding long-term debt by issue of Hydro-Québec, as of December 31, 2016, expressed in Canadian dollars and in currency units:
LONG-TERM DEBT BY ISSUE
Series Maturity
Date Issue Datea Interest Rate %
Amortized Cost in Canadian
Dollars
Nominal Amount in Canadian
Dollars CUSIP Number
or ISIN Code Referencesb
Payable in Canadian Dollars
HG 2019-11-22 1989-11-22 10.000 $ 100,019,459 $ 100,000,000 448814 DE 0 II 2020-01-10 1993-07-27 10.250 154,966,610 150,000,000 448814 EF 6 HL 2020-08-15 1990-08-15 11.000 1,097,470,439 1,110,000,000 448814 DG 5 HM 2020-08-15 1990-08-15 — 1,187,706,574 1,729,000,000 448814 DK 6 HX 2021-10-15 1991-10-15 10.500 1,095,591,817 1,100,000,000 448814 DW 0 IC 2022-07-15 1992-07-15 9.625 1,939,541,871 1,950,000,000 448814 DZ 3 IH 2031-02-26 1993-07-27 11.000 220,498,384 190,000,000 448814 EG 4 JG 2031-08-15 1999-01-26 6.000 826,675,608 825,675,000 448814 GY 3 JM 2045-02-15 2006-10-17 5.000 5,083,836,751 5,000,000,000 CA448814 HZ 92 JN 2050-02-15 2009-01-15 5.000 7,861,641,525 7,000,000,000 CA448814 JA 24 JQ 2055-02-15 2014-11-04 4.000 536,423,250 500,000,000 CA448814 8V 86
Medium-term notes issued under Canadian MTN program
0056 2017-03-02 2009-03-02 4.205 26,257,587 26,186,000 CA44889Z EC 64 0059 2017-04-15 2009-10-14 — 51,779,104 52,220,000 CA44889Z EF 95 0049 2018-08-15 2003-09-04 5.500 149,877,463 150,000,000 CA44889Z DU 71 0064 2018-09-03 2013-09-03 Floating 999,665,572 1,000,000,000 CA44889Z EL 63 0067 2019-03-01 2016-03-01 1.020 16,959,034 16,959,034 CA44889Z EP 77 0057 2019-03-02 2009-03-02 4.678 14,600,000 14,600,000 CA44889Z ED 48 0068 2019-05-25 2016-05-25 1.000 996,034,620 1,000,000,000 CA44889Z EQ 50 0066 2019-12-01 2014-08-28 Floating 1,998,465,302 2,000,000,000 CA44889Z EN 20 0003 2021-08-15 1996-09-27 — 32,828,935 40,000,000 — 1 0060 2022-04-15 2009-10-14 — 51,526,671 65,160,000 CA44889Z EG 78 0065 2024-03-07 2014-03-07 3.308 12,000,000 12,000,000 CA44889Z EM 47 0005 2024-11-07 1996-11-07 7.500 25,000,000 25,000,000 CA44889Z DZ 68 0061 2027-04-15 2009-10-14 — 38,213,517 65,450,000 CA44889Z EH 51 0017 2029-01-16 1999-02-02 6.500 78,746,288 75,000,000 CA44889Z CK 09 0038 2031-08-15 2001-01-17 6.000 4,122,376 4,325,000 CA44889Z DG 87 0009 2035-01-16 1998-02-03 6.500 708,226,682 686,500,000 CA44889Z BF 23 0011 2035-01-16 1998-02-18 Various 36,935,137 50,000,000 CA44889Z BH 88 2 0016 2035-01-16 1998-07-27 3.529 120,412,176 170,000,000 CA44889Z CJ 36 3 0019 2035-02-15 1999-04-30 6.500 4,058,727,674 3,794,000,000 CA44889Z CM 64 0012 2035-07-16 1998-06-05 Various 91,335,131 150,000,000 CA44889Z BJ 45 4 0014 2035-07-16 1998-07-15 — 32,865,263 73,500,000 — 5 0020 2040-02-15 1999-05-14 6.000 4,222,335,362 3,770,500,000 CA44889Z CN 48 0032 2050-02-15 2000-08-01 6.000 47,571,087 50,000,000 CA44889Z DA 18 0033 2060-02-15 2000-11-02 Various 538,315,518 200,000,000 CA44889Z DB 90 6 0037 2060-02-15 2001-01-12 Various 85,985,786 10,000,000 CA44889Z DF 05 7 0039 2060-02-15 2001-01-19 Various 324,718,189 121,000,000 CA44889Z DH 60 8 0040 2060-02-15 2001-01-24 Various 39,866,507 30,000,000 CA44889Z DJ 27 9 Present value of lease obligations for regional offices and
service facilities
122,142,129
Others 1,343,430,543 Debt classified by currency of issue 36,373,315,941 Debt classified by currency of repaymentd 45,385,107,991

- 84 -
Series Maturity
Date Issue Datea Interest Rate %
Amortized Cost in Canadian
Dollarsc
Nominal Amount in Currency
Units CUSIP Number or ISIN Code Referencesb
Payable in U.S. Dollars
JP 2017-06-19 2012-06-19 1.375 $ 1,342,490,190 US$ 1,000,000,000 US4488148U08 HS 2021-02-01 1991-02-12 9.400 1,201,984,632 900,000,000 448814 DM 2 HY 2022-01-15 1992-01-30 8.400 1,335,199,377 1,000,000,000 448814 DX 8 IO 2024-07-07 1994-07-07 8.050 1,339,117,730 999,950,000 448814 EJ 8 GF 2026-03-01 1986-03-13 8.875 333,425,876 250,000,000 448814 CP 6 10 GH 2026-04-15 1986-04-30 8.250 332,841,706 250,000,000 448814 CS 0 10 GQ 2027-01-15 1987-01-29 8.250 333,088,025 250,000,000 448814 CT 8 HE 2029-06-15 1989-06-22 8.625 333,912,878 250,000,000 448814 DB 6 HH 2029-12-01 1989-12-07 8.500 666,490,557 500,000,000 448814 DC 4 HK 2030-04-15 1990-04-18 9.375 667,040,124 500,000,000 448814 DF 7 HQ 2030-11-15 1990-11-20 9.500 664,683,053 500,000,000 448814 DL 4
Medium-term notes issued under U.S. MTN program
B-7 2020-12-11 1990-12-10 9.400 13,402,509 10,000,000 44881H AF 1 B-48 2021-12-20 1991-12-19 8.680 66,995,531 50,000,000 44881H BX 1 B-49 2022-02-15 1992-02-24 9.800 70,158,826 50,000,000 44881H BY 9 B-64 2022-05-10 1992-04-30 9.750 27,925,872 20,000,000 44881H CL 6 B-124 2024-11-18 1994-11-18 8.910 34,239,235 25,000,000 44881H ET 7 B-125 2025-03-28 1995-03-28 8.400 75,224,421 55,000,000 44881H EU 4 B-127 2026-01-03 1996-01-03 6.270 66,963,350 50,000,000 44881H EW 0 B-63 2027-04-30 1992-04-30 9.500 28,060,267 20,000,000 44881H CK 8 B-130 2028-07-13 1998-07-13 6.625 67,047,882 50,000,000 44881H EZ 3 Debt classified by currency of issue 9,000,292,041 Debt classified by currency of repaymentd
–
Payable in Japanese Yen
Medium-term notes issued under Euro MTN program
34 2017-03-17 1997-03-17 4.850 $ 11,500,009 ¥ 1,000,000,000 XS0074480319 Debt classified by currency of issue 11,500,009 Debt classified by currency of repaymentd – Total Long-term Debt $ 45,385,107,991
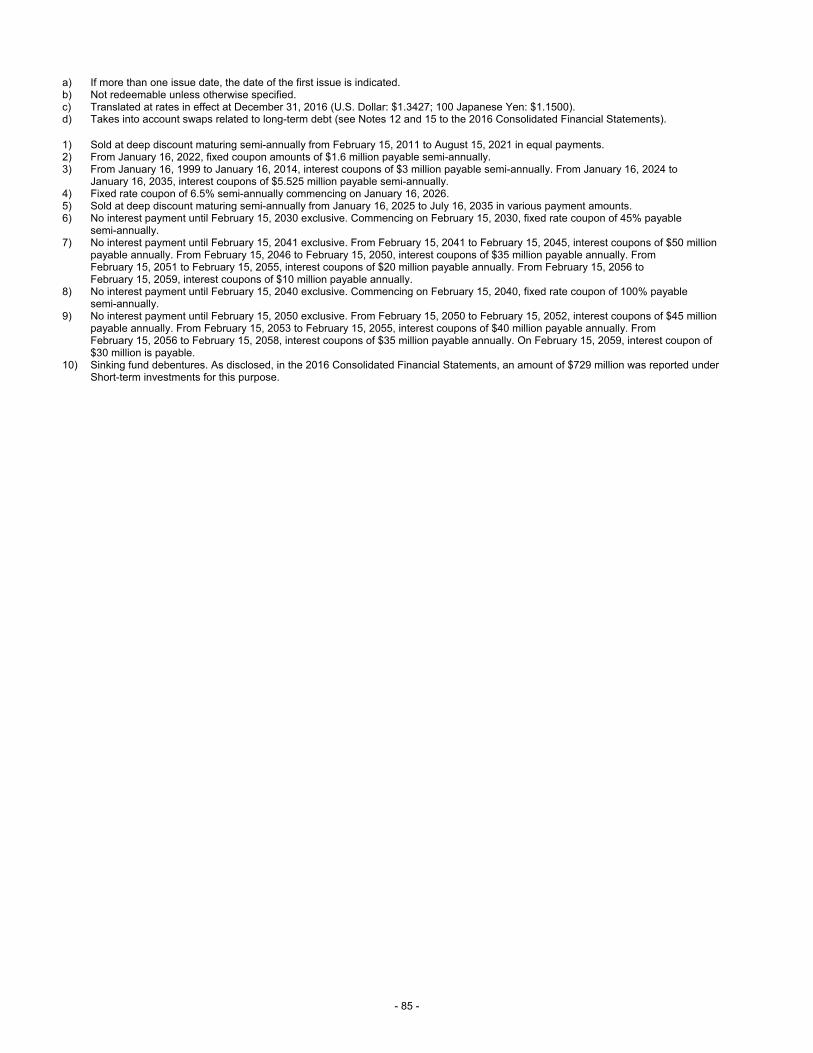
- 85 -
a) If more than one issue date, the date of the first issue is indicated. b) Not redeemable unless otherwise specified. c) Translated at rates in effect at December 31, 2016 (U.S. Dollar: $1.3427; 100 Japanese Yen: $1.1500). d) Takes into account swaps related to long-term debt (see Notes 12 and 15 to the 2016 Consolidated Financial Statements).
1) Sold at deep discount maturing semi-annually from February 15, 2011 to August 15, 2021 in equal payments. 2) From January 16, 2022, fixed coupon amounts of $1.6 million payable semi-annually. 3) From January 16, 1999 to January 16, 2014, interest coupons of $3 million payable semi-annually. From January 16, 2024 to
January 16, 2035, interest coupons of $5.525 million payable semi-annually. 4) Fixed rate coupon of 6.5% semi-annually commencing on January 16, 2026. 5) Sold at deep discount maturing semi-annually from January 16, 2025 to July 16, 2035 in various payment amounts. 6) No interest payment until February 15, 2030 exclusive. Commencing on February 15, 2030, fixed rate coupon of 45% payable
semi-annually. 7) No interest payment until February 15, 2041 exclusive. From February 15, 2041 to February 15, 2045, interest coupons of $50 million
payable annually. From February 15, 2046 to February 15, 2050, interest coupons of $35 million payable annually. From February 15, 2051 to February 15, 2055, interest coupons of $20 million payable annually. From February 15, 2056 to February 15, 2059, interest coupons of $10 million payable annually.
8) No interest payment until February 15, 2040 exclusive. Commencing on February 15, 2040, fixed rate coupon of 100% payable semi-annually.
9) No interest payment until February 15, 2050 exclusive. From February 15, 2050 to February 15, 2052, interest coupons of $45 million payable annually. From February 15, 2053 to February 15, 2055, interest coupons of $40 million payable annually. From February 15, 2056 to February 15, 2058, interest coupons of $35 million payable annually. On February 15, 2059, interest coupon of $30 million is payable.
10) Sinking fund debentures. As disclosed, in the 2016 Consolidated Financial Statements, an amount of $729 million was reported under Short-term investments for this purpose.

- 86 -
EXHIBIT 23.1
INDEPENDENT AUDITORS’ CONSENT
The Board of Directors Hydro-Québec
We consent to the incorporation by reference in Hydro-Québec’s Registration Statement No. 333-178704 of our report to the Minister of Finance of Québec dated February 24, 2017, on the consolidated financial statements of Hydro-Québec, which comprise the consolidated balance sheets as at December 31, 2016 and 2015, and the consolidated statements of operations, comprehensive income, changes in equity and cash flows for each of the years in the three-year period ended December 31, 2016, and notes, comprising a summary of significant accounting policies and other explanatory information, which report appears in the Annual Report on Form 18-K of Hydro-Québec for the year ended December 31, 2016.
/s/ KPMG LLP1 /s/ Ernst & Young LLP2 /s/ Guylaine Leclerc, FCPA auditor, FCA Auditor General of Québec
Montréal, Québec April 28, 2017
1. CPA auditor, CA, public accountancy permit No. A120220
2. CPA auditor, CA, public accountancy permit No. A109499