Embed Size (px)
Citation preview

“FOOTLOOSE” MULTINATIONALS?
Holger Görg and Eric Strobl*
University of Nottingham and University College Dublin
Abstract
This paper examines whether multinational companies are more footloose than theirdomestic counterparts in the host country, using data for the Irish manufacturing sector.First, we investigate whether plant survival rates differ between multinationals andindigenous plants. Second, we analyse whether employment is more unstable inmultinationals. As regards to the first aspect we find that multinationals are more likelyto exit the market than indigenous plants when controlling for other plant and industryspecific characteristics. In terms of employment persistence we find that new jobsgenerated in MNCs appear to be more persistent than jobs generated in indigenousplants. In contrast, they are not any more or less likely to reverse employmentreductions, all other things being equal.
Keywords: multinational companies, employment stability, survival, job persistence
JEL classification: F23, J63
January 2002
* We are grateful to Katharine Wakelin for helpful comments on an earlier draft. All remaining errorsare, of course, our own. Financial support through the European Commission Fifth FrameworkProgramme (Grant No. HPSE-CT-1999-00017) and the Leverhulme Trust (Grant No. F114/BF) isgratefully acknowledged.

1
“FOOTLOOSE” MULTINATIONALS?
1 Introduction
It is frequently argued that multinational companies (MNCs) are inherently footloose,
i.e., they can react almost instantaneously to adverse changes in the host country and
shift their production facilities or parts thereof to another country if the present
environment changes to their disadvantage (see Caves, 1996). This assumption of
multinationals being footloose is based on the nature of multinationals, as only
production processes that are easily transferable between countries can profitably be
located abroad. This makes it easier for MNCs to shift production from one host
country to another than it is for the average indigenous firm in the host country to
relocate production.
Flamm (1984) provides evidence for the footloose nature of US foreign direct
investment in the semiconductor industry. His theoretical and empirical analysis shows
that adjustments by US multinationals to changes in the host country environment, in
terms of, for example, production costs or risks are “extremely rapid” (p. 232). In
discussing multinationals in the UK, Hood and Young (1997) argue that multinational
companies may be more footloose than UK-owned firms due to having only shallow
roots with the host country economy. Cowling and Sugden (1999) also point to
potential problems for host country development due to the footloose nature of
multinationals’ investment. Such multinationals may introduce an unstable element in
the host economy by transferring production and/or production facilities out of the host
country easily.
In this paper we analyse empirical evidence to investigate whether multinational
companies located in the Republic of Ireland also show signs of being highly

2
“footloose”. Ireland is a particularly interesting case study given that its manufacturing
industry is heavily dependent on foreign MNCs. The importance of MNCs for the Irish
economy is now reflected in the fact that, in the manufacturing sector, foreign plants
accounted for 47 per cent of employment, 77 per cent of net output produced and 83 per
cent of total exports in Ireland in 1995 (Central Statistics Office, 1997).1 Also, the
official statistics show that about half of employment in foreign-owned plants is in US
multinationals.
Our paper is somewhat related to an early study by McAleese and Counahan (1979).
They analysed whether foreign multinationals in Ireland reduced employment during
the recession in the early 1970s to a larger extent than indigenous plants, i.e., whether
multinationals were faster to adjust employment levels following an adverse shock than
were Irish-owned plants. Their evidence showed that employment adjustment in MNCs
during the recession did not appear to have been different from that of indigenous
plants, while employment recovery after the recession was actually greater in MNCs
than in Irish-owned plants. Our paper investigates this issue further by taking two
different angles. Firstly we analyse, using a Cox proportional hazard model, whether
survival rates for foreign and Irish-owned plants are different, i.e., whether foreign
plants are more likely to exit than are domestic plants once controlling for other plant
and industry specific factors. Secondly, using a similar hazard model framework we
examine whether jobs generated or destroyed in MNCs are more persistent than jobs
generated or destroyed in Irish-owned plants.
The paper is structured as follows. Section 2 describes the data used for the empirical
analysis. Section 3 presents empirical results of the analysis of plant survival,
1 The effects of the large multinational presence on the Irish economy and, in particular, on thedevelopment of domestic plants have been analysed by Görg and Strobl (2002a,b) and Barry and Bradley

3
estimating survival functions as well as a Cox proportional hazard model. Section 4
presents the empirical results of our analysis of differences in the persistence of
employment changes between foreign and indigenous plants. Our main results are
summarised, and conclusions presented, in Section 5.
2 Description of the Data
In the empirical analysis we use data from the Employment Survey which is carried out
annually by Forfás, the policy and advisory board for industrial development in Ireland.
The survey has been undertaken since 1973 and data are available to us for the period
1973 to 1996. The main advantages of the survey are that it covers virtually all known
active manufacturing companies, and that the response rate is generally over 99 per
cent, thus providing a sample of over 15,000 plants. The unit of observation is the
individual plant, for which nationality of ownership,2 sector of location,3 start-up year
and the number of permanent full-time employment, amongst other things is reported.
This allows us to calculate annual net changes in employment levels at the level of the
plant.
Given the nature of the survey we can interpret a plant’s dropping out of the data as an
exit. Each plant is identified by a unique plant number which is only changed if there is
an actual change of ownership. This implies that we are not able to distinguish births
and deaths from take-overs. While this may create some problems in terms of
misrepresenting the importance of plant births and deaths, we suspect that, as a whole,
take-overs would result in only negligible measurement errors in our calculations. This
is because most foreign direct investment in Ireland has been in the form of greenfield
(1997).2 A plant is classified as being foreign-owned if 50 percent or more of its shares are held by foreignowners.

4
investment, i.e., the setting up of entirely new plants, rather than take-overs of existing
domestic plants (see Barry and Bradley, 1997).4
Table 1 provides summary measures of the foreign and indigenous sub-sectors of Irish
manufacturing for the years 1973, 1984 and 1996. One should note that the foreign
multinational sector has steadily increased its share of manufacturing employment from
roughly 33 to 45 per cent. The number of foreign multinationals is substantially smaller
than that of indigenous plants resulting in a considerably larger average size for foreign
plants. Additionally, while there was a notable average age difference at the start of our
sample period between indigenous and foreign plants, this has now largely disappeared.
[Table 1]
3 Plant Survival
If multinationals are footloose they can be expected to be more likely to exit the host
country following a negative shock than are domestic plants. We therefore examine the
probabilities of plant survival, distinguishing foreign and Irish-owned plants in this
section. As a first step in examining and comparing plant survival across the two
nationality groups we calculate Kaplan-Meier (K-M) survival functions, given by:
( )$( ) [ ]S t n d nj j jj t tj
= −≤
∏ (1)
where nt is the population alive and dt is the number of failures respectively at time t.
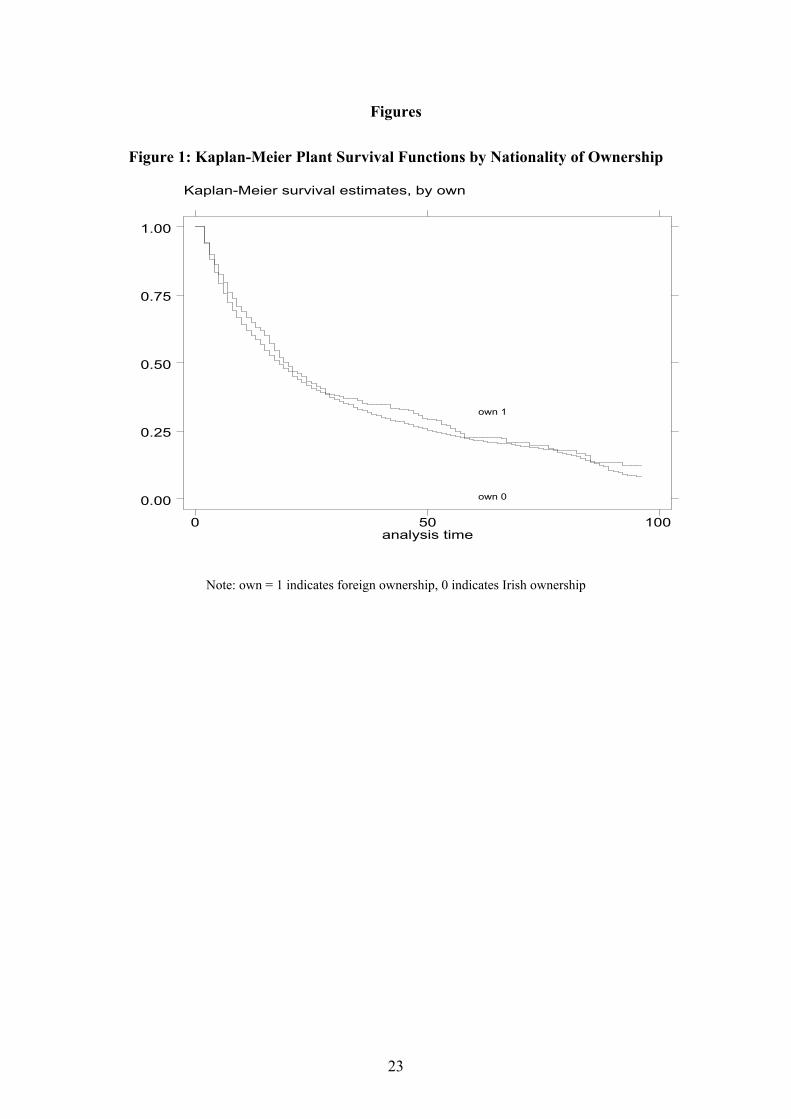
These are graphed in Figure 1, comparing foreign and indigenous plants. A glance at
the functions may suggest that these do not appear to be substantially different, with
3 For the purpose of this paper we classify plants into the standard 68 sub-sectors of Irish manufacturingused by the Central Statistics Office over the period.4 We are also not able to identify takeovers by other domestic plants. However, consultation with theIrish Development Authority (IDA) leads us to believe that this was not a frequent occurrence in Irish

5
that of foreign plants lying marginally above that of their indigenous counterparts.
However, a log rank test for the equality of survival functions can decisively reject the
hypothesis that the two survival functions are equal (the chi-squared test statistic is
8.89, significant at the 1 percent level). Based on this graph we may, therefore,
conclude that foreign plants have higher survival rates than domestic plants, which is
just the opposite of what we would have expected to find if multinationals were more
footloose than their domestic counterparts. We thus find that, in a comparison of all
domestic and foreign plants, multinationals do not appear to be more footloose than
domestic plants.
[Figure 1 here]
Such an aggregated graph does not, of course, allow us to take into consideration other
factors affecting plant survival that may be unequally distributed across foreign and
indigenous plants. Therefore, in order to properly disentangle the role of other plant
and industry specific factors from nationality on the survivability of plants we turn to a
semi-parametric modelling of plants’ hazard rates. Following the related empirical
literature (for example, Audretsch and Mahmood, 1995, Mata and Portugal, 1994) we
utilise a Cox proportional hazard model (Cox, 1972) for the empirical analysis of this
issue.
The Cox proportional hazard model specifies the hazard function h(t), which is the rate
at which plants exit at time t given that they have survived in t-1, to be
h t h t e OWN X X OWN( ) ( ) ( * )= + +0
α β γ (2)
manufacturing, especially since the IDA provided generous grants for indigenous start-ups but not fortakeovers.

6
where h0 is the baseline hazard function (the parametric form of which is not specified)
when all of the covariates are set to zero. X is a vector of covariates assumed to capture
the effect of plant and industry characteristics on survival by including a number of
variables generally used in the literature and as available from our data set. In order to
examine whether foreign plants’ survival differs from domestic plants’ we include a
dummy OWN which takes the value of one if the plant is foreign-owned and zero
otherwise. If foreign firms are more footloose than domestic firms we would not only
expect this dummy to indicate that foreign firms have a higher hazard of exiting than
domestic firms but we may also expect that foreign firms are likely to react differently
to changes in the other factors affecting plant survival. In order to capture this latter
aspect of being footloose we include interaction terms of the ownership dummy with all
covariates in X. This vector includes the following variables:5
SIZE is the plant’s size in terms of employment at time t. This variable is included as it
can now be considered to be a stylised fact that small plants generally have lower
probabilities of survival than large plants (see, for example, Audretsch and Mahmood,
1995; Dunne and Hughes, 1994). Also, Mata et al. (1995) find that current plant size is
a better predictor of failure than initial size and we, therefore, include size at time t in
our regression.
The minimum efficient scale of the industry, MES, is measured as the log of median
employment size in sector j as in Sutton (1991).6 Our a priori expectation as to the sign
of the coefficient is ambiguous. On the one hand, one may expect plants entering
industries with large minimum efficient scale to have lower probabilities of survival
5 Equation (2) also includes time dummies to control for year specific macroeconomic effects.6 In an alternative specification we defined MES as (the log of) average plant size in the industry. Theseresults, which are not reported here but can be obtained from the authors upon request, yield similarresults to the results obtained using average plant size. We are not able to calculate any additionalalternative measures of MES due to lack of appropriate data.

7
than plants entering other industries, as small entrants may find it difficult to attain the
efficient level of production unless they experience sufficient growth in their infancy
(Audretsch, 1991). On the other hand, as Audretsch (1991) points out, industries with
high MES are usually also industries showing high price cost margins, which should
increase survival.
HERF denotes the Herfindahl index of sector j, which is found to be a significant
explanatory variable in the study of plant survival in Portugal undertaken by Mata and
Portugal (1994). Again, the expectation of the effect of market concentration on
survival is not clear-cut. Higher market concentration may lead to higher price-cost-
margins in the industry which, ceteris paribus, should increase a plants’ probability of
survival. However, plants in highly concentrated markets may be subject to fierce
aggressive behaviour by rivals which may reduce chances of survival.
SGROWTH is the net sectoral growth rate measured in terms of employment growth.
Audretsch (1991) argues that industry growth may elevate the price above the long-run
average cost, i.e., increase plants’ price-cost-margin which would, all other things
equal, affect survival rates positively. The sectoral growth rate also allows us to control
for other sector specific cyclical effects which may impact on plant survival.
Our results for estimating various specifications of equation (2) on our data set are
given in Table 2. The log likelihood and Wald tests do not indicate that our estimations
suffer from mis-specification. All estimations are stratified by sector, which allows for
equal coefficients across strata (sectors) but baseline hazards unique to each stratum
(sector).7 One should note that since the coefficients are those of a hazard model, a
positive coefficient indicates that the respective covariate decreases the probability of
7 In effect, this is comparable to the inclusion of sectoral dummies in a standard OLS regression.

8
survival (increases the hazard of exiting) while a negative coefficient indicates a
positive effect on survival, all other things being equal.
[Table 2 here]
Column (1) presents the results of estimating equation (2) including only the vector of
covariates X as an initial check to see how plant and industry characteristics affect plant
survival in our sample. Plant size turns out to affect survival positively, i.e., small
plants face a higher hazard of exit than do large plants. As pointed out above, this is a
fairly standard finding in studies of firm survival. Our results also suggest that, the
higher the level of concentration in the industry, the less likely a plant is to survive.
This may indicate that plants in highly concentrated markets may be subject to fierce
aggressive behaviour by rivals which reduces chances of survival. The coefficient of
MES, another variable picking up industry characteristics, is statistically insignificant in
the estimation, although, perhaps, the concentration variable may be capturing the effect
of minimum efficient scale. As outlined above, one would expect that concentrated
industries sustain higher price-cost margins, however, highly concentrated industries are
also likely to be those with a high minimum efficient scale. Not surprisingly, we find
that benevolent economic sectoral conditions, as measured by the sectoral growth rate,
decrease the hazard of plant exits. In other words, fast growing markets appear to
increase plant survival. This finding is in line with Mata and Portugal (1994) who also
find that, for Portuguese firms, fast growing markets make survival easier for new
entrants.
Given that the main focus of this paper is on differences across nationality of ownership
we re-estimated equation (2) including OWN and terms interacting OWN with all other
covariates. The dummy on its own measures whether foreign plants have different

9
survival rates than indigenous plants after controlling for other explanatory factors,
while the interaction terms allows for a different impact of the covariates on plant
survival for foreign plants. It is first important to note that a likelihood ratio test of the
equivalence of the unrestricted (namely, that which allows for different intercept and
slope coefficients across ownership type) versus the restricted model provides support
for the unrestricted version. Based on the test statistic (75.4) we can reject the
equivalence of the two models at the 1 per cent level. Thus, it is important to allow for
different coefficients for foreign and indigenous plants when estimating plant survival.
Turning to the detailed results provided in the second column of Table 2, one should
note that the coefficient on the ownership dummy is statistically significant and
positive, suggesting that foreign plants have a lower rate of survival than domestic
plants. In order to be able to interpret the magnitude of this coefficient we can calculate
the hazard ratio by calculating the exponentiated coefficient. For the case of a dummy
variable covariate, equation (2) shows that calculating the exponential of the coefficient
α generates the increase in the hazard ratio for the case when OWN equals 1, holding
everything else constant. Thus calculating the hazard ratio for the coefficient on OWN
yields 1.36, indicating that the hazard of exiting is approximately 1.4 times higher for
foreign than for domestic plants. Hence, while the Kaplan-Meier survival functions
above suggested that foreign plants have higher survival rates our regression results
indicate that, once we control for other factors, foreign plants have a higher chance of
exiting than their indigenous counterparts. In the context of our discussion in this paper
this indicates that foreign plants are more footloose than indigenous plants. This may
be due to the fact that, all other things being equal, a foreign multinational company
may find it easier to transfer production facilities from one country to another than a
comparable indigenous plant.

10
From the interaction terms we also find that two of the covariates, namely SIZE and
SGROWTH have different effects on the survival of foreign and domestic plants. The
statistically significant negative coefficient on SIZE*OWN indicates that the size effect
(i.e., the increase in survival probability as the plant becomes larger) is less for foreign
plants than for their domestic counterparts. Again, this provides evidence that it is
easier for foreign plants to move their production facility abroad, irrespective of the size
of the plant. On the other hand, the positive effect of a growing sector on plant survival
is even stronger for foreign plants than for domestic ones. This implies that foreign
plants in a declining industry are more likely to exit than domestic plants in the same
industry. We may also interpret this as a sign that foreign firms are more footloose, as
they appear more likely to leave if sectoral conditions change adversely.
4 Employment Persistence
Having established that multinationals are more likely to exit than domestic plants,
ceteris paribus, we examine whether there are differences between foreign and
indigenous plants in the persistence of employment generated or destroyed as a second
step in assessing whether MNCs are more footloose than their domestic counterparts.
Given that MNCs are more likely to exit than domestic plants one might also expect
that employment adjustments in multinationals are less persistent.
However, in forming priors as to whether multinationals are more likely to adjust
employment temporarily one could also appeal to human capital theory (as outlined by,
for example, Parsons, 1986), which stresses that plants and workers may find it
advantageous to invest in the development of plant specific human capital. This is
because higher skilled labour provides returns to both the worker (in terms of higher
wages) and the plant (in terms of higher productivity). Consequently the rate of

11
separation between employer and employee should be lower for high skilled workers
than for low skilled workers, i.e., jobs are more persistent in the case of the former.
This, in turn, has implications for employment persistence in multinational companies
since MNCs, due to their plant-specific assets (Caves, 1996) can be expected to use a
higher level of technology than indigenous plants. Since the use of a higher technology
necessitates the presence of more skilled labour, multinationals will find it profitable to
make an organisational capital investment in order to provide training for workers to
develop their human capital and use it efficiently in the plant. This human capital
investment will increase workers‘ productivity. Hence, there will be lower separation
rates, and higher costs of labour adjustment, for multinationals than for indigenous
plants (which use lower levels of technology). This implies higher persistence of jobs
in multinationals.
To investigate the issue of employment stability empirically we make use of the fact
that our dataset allows us to identify net changes in the level of employment in a plant
between two years. We can, thus, identify positive and negative net employment
changes at the plant level and track whether these adjustments persist over time. In
evaluating these we are faced with a number of obstacles, however. Firstly, our data set
only allows us to identify the level of employment, but not the underlying job types.
Thus even though, for example, an increase in employment of 10 may still persist at
some future point, we are unable to identify whether the actual structure of employment
has changed, i.e., whether these 10 jobs that persist until t+s are the same as those
created at time t. For the purposes here we assume that jobs are homogenous within
plants so that changes in the level are equivalent to changes in jobs.
Secondly, in order to evaluate persistence in employment changes analogously to our
study of plant survival in the previous section, i.e., in terms of using a hazard model, we

12
need to identify a reversal of an employment adjustment as either occurring or not
occurring. A plant, however, may only partially reverse its original employment
decision. We thus first treat even a partial reversal as the outcome “reversal of the
original decision”. In order to check whether this biases our results we subsequently
consider only a complete reversal of the original change as a reversal. This provides a
more stringent definition of reversal, namely that only if all employment gained (lost) is
subsequently re-lost (re-gained), is the original adjustment reversed. For example, if a
plant increases employment from 10 to 20 at time t, then if at time t+1 employment is
any less than 20 our approach is to consider the original decision reversed under the
first more flexible definition. In contrast, we only consider the original decision
reversed if employment at time t+1 falls below 10 under the more stringent definition.
Finally, given that our plant survival analysis in the previous section already deals with
plant entry and subsequent exit, we only consider employment adjustments and their
(potential) reversal in continuing plants.8
We first calculated simple K-M functions of the persistence of employment creation and
destruction in foreign and domestic plants using equation (1) for the case where a partial
re-gain (re-loss) is considered a “reversal”, i.e., the more flexible definition of reversal.
These functions are depicted in Figures 2 and 3, respectively. As can be seen,
employment creation persistence is clearly higher for foreign plants one year after the
adjustment. The difference increases until about five years after the event and then
remains fairly stable although overall the survival rates are decreasing at a decreasing
rate. The difference in these survivor functions is also supported by a log rank test of
8 This means that we do not take account of jobs created due to plant birth and death and also that non-reversed employment adjustments are considered truncated from the sample once a plant exits. Aspointed out by Davis and Haltiwanger (1992) for the US, and supported by Strobl (1996) for Ireland,plant exit only comprises a small proportion of total employment loss in any period. Rather, most of theemployment adjustment observed at the micro-level is due to continuing plants continuously readjusting

13
equivalence.9 In contrast, the difference between the survivor function of employment
losses is much smaller, with that of foreign plants being marginally higher. As matter
of fact, a log rank test of equivalence does not allow one to conclude that these are
significantly different.10
[Figures 2 and 3]
In Figures 4 and 5 we also graphed the K-M survival function for the case of the more stringent
definition of employment change reversal. As would be expected given the more
stringent condition for reversal, here the survival rates are higher for both employment
creation and destruction. For employment creation the difference in the series is not as
pronounced as in the earlier graph, and only really become apparent after five years and
seems to be slowly increasing thereafter. Nevertheless, a log rank test indicates that as
with our more relaxed definition, the survivor functions for foreign and domestic plants
are not identical.11 For the case of employment destruction, we now find that the
survival rate of employment losses are higher for domestic plants, suggesting that
foreign plants are more likely to recover from negative shocks to employment. This is
supported by a log rank test of equivalence which rejects the hypothesis that the two
functions are identical.12
[Figures 4 and 5]
Thus, without controlling for other factors, these graphs suggest that jobs created in
foreign firms appear more likely to persist that those created in domestic plants,
irrespective of whether we consider total or only partial reversals of job creations. On
the other hand, when to consider a reduction in employment as being reversed may be
their employment level to aggregate, sectoral and idiosyncratic temporary and permanent shocks.9 The chi-squared statistic is 129.7, significant at the one per cent level.10 The chi-squared statistic is 2.5.11 The chi-squared statistic is 18.2, significant at the one per cent level.

14
important in terms of considering whether foreign plants are more or less likely to
recover lost jobs. While there does not appear to be a perceptible difference in the
persistence of jobs lost in domestic or foreign plants under the flexible definition (i.e.
considering partial reversal) foreign plants seem more likely to recover all or more jobs
lost in a previous period. This may suggest that when one considers re-gaining lost
employment, foreign plants are more likely to re-gain all jobs lost previously.
As with plant survival, there are, of course, likely to be other factors affecting the
persistence of employment changes and it is important to control for these as these may
be correlated with the type of ownership of the plant. We thus, analogously to the
investigation of differences in plant survival, estimated a Cox proportional hazard
model as in equation (2). In estimating equation (2) for employment creation and
employment destruction persistence we similarly used the same explanatory variables,
except that we also included plant age and RATE, a variable defined as the (absolute
value) of the employment change relative to level of employment at the time of the
adjustment. This latter variable is intended to control for the importance of the
employment change undertaken relative to the size of the plant and hence can serve as
an indicator of the size of the shock which induced the change and the adjustment costs
involved. Plant size and age as well as the sectoral variables described above are
included in the estimation since Davis et al. (1996) show that job persistence may differ
between firms with different sizes and ages, and between sectors. We, therefore, chose
to control for these factors in our analysis also.
Table 3 presents the results of estimating the Cox proportional hazard model for
employment creation persistence. In line with the analysis of plant survival we first
estimated the model without allowing for ownership differences. These results are
12 The chi-squared statistic is 10.7, significant at the one per cent level.

15
given in the columns (i) and (ii) of the table for partial and complete reversals
respectively. One should note that the results are very similar, in terms of magnitude
and statistical significance, in both estimations. Job gains in larger plants are more
likely to persist than in smaller ones. In contrast, the relationship between persistence
and age is negative, with older plants being more likely to increase employment only
temporarily. The significance on RATE shows that it is important to control for the
relative importance of the change, and suggests that the larger the adjustment the more
likely it is permanent. We also find that plants that are in more concentrated sectors are
more likely to undertake temporary employment increases, i.e., are more likely to
reverse newly created jobs. Finally, the significant coefficient on SGROWTH shows
that benevolent sectoral conditions act to make job gains more permanent.
Including the ownership dummy and interacting it with the covariates, as shown in the
third and fourth columns of Table 3, does not change any of the aforementioned
conclusions. The less restricted models (including OWN and interaction terms) are
supported by likelihood ratio tests of equivalence of the restricted and unrestricted
models which allow us to reject the equivalence of the two models (with test statistics
of 121.1 and 109.8 respectively). The results of the unrestricted models show, in line
with the K-M survivor functions, that foreign plants are less likely than domestic ones
to reverse increases in employment, as indicated by the statistically significant and
negative ownership dummy. These coefficients are similar for both the cases of partial
and complete reversals of jobs created. Calculating hazard ratios from these
coefficients yields 0.91 and 0.88 respectively indicating that the hazard of reversing the
employment decision is about 10 percent lower for foreign than for comparable
domestic plants.
For both definitions of reversals we also find that the interaction terms indicate that

16
while plant size in general acts to make job gains more permanent, this effect is less so
for foreign plants. There is, therefore, less difference between large and small foreign
plants in terms of employment creation persistence. Also, the finding that plants in
highly concentrated sectors are more likely to reverse employment creation decisions is
stronger for foreign firms, as indicated by the sign and statistical significance of the
coefficient on the interaction term of HERF*OWN.
The impact of the other interaction terms are, however, different for the two definitions
of employment decision reversal. Considering partial reversals, we find that larger
employment adjustments, as measured by RATE, are more likely to lead to persistence
of employment creation in foreign plants than in domestic ones. Also, the benevolent
effect of locating in a growing sector on persistence has a larger effect on foreign plants.
These two factors do, however, not appear to be important when considering complete
reversals only. In that case, rather, we find that under the more stringent definition the
age effect is more pronounced for foreign plants, i.e., old foreign plants are more likely
to reverse completely their employment decisions than their old domestic counterparts.
Thus, foreign plants are likely to react differently to changes in some of the
determinants of reversing employment decisions than are domestic plants.
[Table 3]
We turn to analysing the persistence of negative employment changes next. The results
of the hazard model for employment destruction persistence are reported in Table 4. As
in the previous table we distinguish estimations based on the less stringent (i.e., partial)
and more stringent (i.e., complete) definition of the employment decision. Results for
the restricted hazard model for both definitions are given in the first and second
columns of Table 4, respectively. Accordingly, larger and younger plants, and plants

17
with low employment adjustments are more likely to re-gain lost jobs (although the last
results only holds when considering complete reversals). In terms of the sectoral
variables we find that in more concentrated industries employment losses are more
likely to be persistent and that, as would be expected, employment destruction reversal
is positively related to sectoral conditions.
Columns (iii) and (iv) of Table 4 depict the results of the unrestricted model, including
OWN and interaction terms, of employment destruction persistence for the two
definitions of reversal. The likelihood ratio tests support in both cases the preference of
the unrestricted model. In these estimations we find no statistically significant
difference in job destruction persistence for foreign plants irrespective of the definition
of the incidence of employment reversal. Thus, in contrast to the K-M survival
functions, once we control for other plant and industry specific effects we find no
difference in the employment destruction persistence between foreign and domestic
plants.
Even though foreign plants are no more likely to recover or maintain a reduction in
employment than domestic plants per se, various other factors are more pronounced for
foreign plants. Specifically, we find in both cases that there is a different age effect for
foreign and for domestic plants with the effect being more pronounced for the former.
That is, the positive relationship between plant age and probability of persistence is
stronger for foreign plants. For the case of complete reversals we find additionally that
the size effect, i.e., that larger plants are more likely to recover lost jobs, is less so for
multinational companies. Also, an industry’s concentration is less likely to make
employment losses persistent for foreign plants.

18
5 Discussion and Conclusions
This paper investigates the claim that affiliates of multinational companies are more
footloose than domestic plants in the host country. We look at two different facets of
this issue by examining plant survival as well as the persistence of employment changes
(positive or negative) at the level of the plant over time. We address both questions
using the framework of a Cox proportional hazard model.
Estimating the determinants of plant survival we find that plants belonging to
multinational companies located in Ireland have lower survival rates than indigenous
plants, all other things being equal. Also, we find that foreign plants react differently to
changes in some of the factors determining survival, such as plant size or sectoral
conditions. Taken together we interpret these findings as evidence that MNCs are more
footloose than domestic plants, ceteris paribus.
It is a different question, however, as to whether this higher probability of exiting the
host country also means that employment in multinationals is more unstable than
employment in indigenous plants. Focusing only on continuing plants we analyse the
factors determining whether employment changes at the plant level persist over time.
Estimating a hazard model for the persistence of new jobs created in foreign and
domestic plants we find that jobs created in the former are, ceteris paribus, more likely
to persist than those created in the latter. Furthermore, we find no evidence that jobs
destroyed in foreign plants are more or less likely to be recovered than those destroyed
in domestic plants. These results do not lend support to the claim that employment in
multinational companies is more unstable than in indigenous plants due to the footloose
nature of multinationals. We do, however, find evidence that some of the determinants
of employment persistence differ between foreign and domestic plants, i.e., foreign

19
plants react differently to changes in some of the factors impacting on employment
persistence.
As a tentative conclusion, our results may suggest that employment decisions in
multinationals are made with a longer time horizon in mind than in domestic plants.
Multinationals seem to be more likely to create new jobs only if they expect those jobs
to last in the long run while domestic plants base job creation decisions more on a short
term basis. This process possibly reflects the fact that multinationals in general are at a
disadvantage compared to domestic plants when setting up abroad (Hymer, 1976).13 On
the one hand, these disadvantages may imply that foreign multinationals are more likely
to leave the host country if they are unable to overcome these difficulties. On the other
hand, however, the existence of such obstacles also suggests that affiliates of
multinationals have stronger incentives to plan carefully their investment decisions and
expansion strategies, over a long term horizon. Also, it may indicate that multinationals
have superior management expertise, allowing them to predict market fluctuations and
plan responses well in advance. This seems to be borne out by our findings regarding
the persistence of positive employment changes.
13 Zaheer (1995) provides empirical evidence that affiliates of MNCs indeed face such difficulties.

20
Tables
Table 1: Descriptive Statistics
ownership 1973 1984 1996
Indigenous Employment 151741 126687 120728
Plants 4039 6448 5830
Age 21 17 19
Size 38 20 21
Foreign Employment 73827 80550 97559
plants 619 861 837
age 16 15 20
size 119 94 117
Table 2: Determinants of Plant Survival
(i) (ii)SIZE -0.007*** -0.009***
(0.000) (0.001)MES 0.006 0.020
(0.010) (0.013)HERF 0.001*** 0.001***
(0.000) (0.000)SGROWTH -1.144*** -0.940***
(0.172) (0.181)OWN --- 0.231***
(0.059)SIZE*OWN --- 0.003***
(0.001)MES*OWN --- -0.025
(0.017)HERF*OWN --- 0.000
(0.001)SGROWTH*OWN --- -1.703***
(0.444)Observations 144015 144015LR test (RES vs UNRES) 75.4***Log Likelihood -73242.97 -73182.42Wald Test 1419.22*** 1540.31***
Notes: standard errors in parentheses*, **, *** denotes statistical significance at 10, 5, 1 percent level respectively

21
Table 3: Determinants of Employment Creation Persistence
(i) (ii) (iii) (iv)Partial Rev. Compl. Rev. Partial Rev. Compl. Rev.
SIZE -0.002*** -0.003*** -0.004*** -0.004***(0.000) (0.000) (0.000) (0.000)
AGE 0.008*** 0.008*** 0.009*** 0.008***(0.000) (0.000) (0.000) (0.000)
RATE -0.575*** -3.236*** -0.525*** -3.271***(0.056) (0.072) (0.063) (0.080)
MES -0.000 -0.003 0.005 0.003(0.005) (0.005) (0.007) (0.006)
HERF 0.686* 0.589* 0.681* 0.544(0.353) (0.351) (0.358) (0.357)
SGROWTH -1.696*** -2.157*** -1.564*** -2.109***(0.146) (0.148) (0.159) (0.161)
OWN --- --- -0.095* -0.132**(0.055) (0.056)
SIZE*OWN --- --- 0.002*** 0.002***(0.000) (0.000)
AGE*OWN --- --- 0.002 0.003**(0.001) (0.001)
RATE*OWN --- --- -0.530*** -0.200(0.145) (0.190)
MES*OWN --- --- -0.007 -0.008(0.007) (0.006)
HERF*OWN --- --- 0.693* 0.658*(0.365) (0.348)
SGROWTH*OWN --- --- -0.602* -0.166(0.308) (0.302)
Observations 144015 218311 144015 218311LR test (RES vs UNRES) 121.1*** 109.8***Log Likelihood -73242.97 -74137.73 -73182.42 -74082.82Wald Test 1419.22*** 4197.55*** 1540.31*** 4307.36
Notes: standard errors in parentheses*, **, *** denotes statistical significance at 10, 5, 1 percent level respectively

22
Table 4: Determinants of Employment Destruction Persistence
(i) (ii) (iii) (iv)Partial Rev. Compl. Rev. Partial Rev. Compl. Rev.
SIZE 0.0004*** 0.001*** 0.001*** 0.001***(0.000) (0.000) (0.000) (0.000)
AGE -0.006*** -0.009*** -0.006*** -0.009***(0.001) (0.001) (0.001) (0.001)
RATE 0.003 -0.488*** 0.003 -0.471***(0.003) (0.032) (0.003) (0.033)
MES 0.004 0.005 0.007 0.007(0.006) (0.006) (0.006) (0.007)
HERF -0.622 -0.888* -0.765* -1.134**(0.442) (0.464) (0.453) (0.481)
SGROWTH 1.626*** 1.925*** 1.696*** 1.991***(0.180) (0.186) (0.197) (0.204)
OWN --- --- -0.003 0.110(0.062) (0.067)
SIZE*OWN --- --- -0.000 -0.001***(0.000) (0.000)
AGE*OWN --- --- -0.004** -0.006***(0.002) (0.002)
RATE*OWN --- --- 0.002 -0.133(0.049) (0.112)
MES*OWN --- --- -0.005 -0.004(0.007) (0.008)
HERF*OWN --- --- 0.662 0.865*(0.437) (0.446)
SGROWTH*OWN --- --- -0.373 -0.322(0.376) (0.375)
Observations 109330 170775 109330 170775LR test (RES vs UNRES) 15.5*** 43.2***Log Likelihood -44365.44 -44054.00 -44357.67 -44032.39Wald Test 530.29*** 1119.90*** 545.83*** 1163.13***
Notes: standard errors in parentheses*, **, *** denotes statistical significance at 10, 5, 1 percent level respectively
23
Figures
Figure 1: Kaplan-Meier Plant Survival Functions by Nationality of Ownership
Kaplan-Meier survival estimates, by own
analysis time0 50 100
0.00
0.25
0.50
0.75
1.00
own 0
own 1
Note: own = 1 indicates foreign ownership, 0 indicates Irish ownership

24
Figure 2: Kaplan-Meier survival functions of Employment Creation Persistence
By Nationality of Ownership (Partial Reversal)
Kaplan-Meier survival estimates, by own
analysis time0 10 20
0.00
0.25
0.50
0.75
1.00
own 0
own 1
Note: own = 1 indicates foreign ownership, 0 indicates Irish ownership

25
Figure 3: Kaplan-Meier survival functions of Employment Destruction Persistence
By Nationality of Ownership (Partial Reversal)
Kaplan-Meier survival estimates, by own
analysis time0 10 20
0.00
0.25
0.50
0.75
1.00
own 0
own 1
Note: own = 1 indicates foreign ownership, 0 indicates Irish ownership

26
Figure 4: Kaplan-Meier survival functions of Employment Creation Persistence
By Nationality of Ownership (Complete Reversal)
Kaplan-Meier survival estimates, by own
analysis time0 10 20
0.00
0.25
0.50
0.75
1.00
own 0
own 1
Note: own = 1 indicates foreign ownership, 0 indicates Irish ownership

27
Figure 5: Kaplan-Meier survival functions of Employment Destruction Persistence
By Nationality of Ownership (Complete Reversal)
Kaplan-Meier survival estimates, by own
analysis time0 10 20
0.00
0.25
0.50
0.75
1.00
own 0
own 1
Note: own = 1 indicates foreign ownership, 0 indicates Irish ownership

28
References
Audretsch, David B. (1991): “New-Firm Survival and the Technological Regime”.Review of Economics and Statistics, Vol. 60, pp. 441-450.
Audretsch, David B. and Mahmood, Talat (1995): "New-Firm Survival: New Resultsusing a Hazard Function". Review of Economics and Statistics, Vol. 77, pp. 97-103.
Barry, Frank and Bradley, John (1997): "FDI and Trade: The Irish Host-CountryExperience". Economic Journal, Vol. 107, pp. 1798-1811.
Caves, Richard E. (1996): Multinational Enterprise and Economic Analysis. SecondEdition. Cambridge: Cambridge University Press.
Central Statistics Office (1997): Census of Industrial Production 1995. Dublin:Stationary Office.
Cowling, Keith and Sugden, Roger (1999): “The Wealth of Localities, Regions andNations: Developing Multinational Economies”. New Political Economy. Vol. 4, pp.361-378.
Cox, David R. (1972): "Regression Models and Life Tables". Journal of the RoyalStatistical Society, Series B. Vol. 34. pp. 187-220.
Davis, Steven J. and Haltiwanger, John (1992): "Gross Job Creation, Gross JobDestruction and Job Reallocation". Quarterly Journal of Economics. Vol. 107. pp. 819-864.
Davis, Steven J.; Haltiwanger, John C. and Schuh, Scott (1996): Job Creation andDestruction. Cambridge, MA: MIT Press.
Dunne, Paul and Hughes, Alan (1994): “Age, Size, Growth and Survival: UKCompanies in the 1980s”. Journal of Industrial Economics. Vol. 42. pp. 115-140.
Flamm, Kenneth (1984): “The Volatility of Offshore Investment”. Journal ofDevelopment Economics, Vol. 16, pp. 231-248.
Görg, Holger and Strobl, Eric (2002a): “Multinational Companies and IndigenousDevelopment: An Empirical Analysis”, European Economic Review, forthcoming.
Görg, Holger and Strobl, Eric (2002b): “Multinational Companies and Entrant Start-upSize: Evidence from Quantile Regressions”, Review of Industrial Organization, Vol 20,pp. 15-31.
Hood, Neil and Young, Stephen (1997): “The United Kingdom”. In Dunning, John H.(ed.): Governments, Globalization and International Business. Oxford: OxfordUniversity Press.
Hymer, Stephen H. (1976): The International Operations of National Firms: A Study ofDirect Foreign Investment. Cambridge, MA: MIT Press.
Mata, José and Portugal, Pedro (1994): “Life Duration of New Firms”. Journal ofIndustrial Economics, Vol. 42, pp. 227-245.
Mata, José, Portugal, Pedro and Guimaraes, Paulo (1995): “The Survival of New Plants:Start-up Conditions and Post-entry Evolution”. International Journal of IndustrialOrganization, Vol. 13, pp. 459-482.

29
McAleese, Dermot and Counahan, Michael (1979): “’Stickers’ or ‘Snatchers’?Employment in Multinational Corporations during the Recession”. Oxford Bulletin ofEconomics and Statistics, Vol. 41, pp. 345-358.
Parsons, Donald O. (1986):”The Employment Relationship: Job Attachment, WorkEffort, and the Nature of Contracts”. In Ashenfelter, Orley C. and Layard, Richard(eds.): Handbook of Labor Economics. Vol. 2. New York: North Holland. pp. 789-848.
Stobl, Eric A. (1996): “Essays on Labour Market Dynamics in Ireland”, unpublishedPhD thesis, Trinity College, Dublin.
Sutton, John (1991): Sunk Costs and Market Structure. Cambridge, MA.: MIT Press.
Zaheer, Srilata (1995): “Overcoming the Liability of Foreignness”. Academy ofManagement Journal, Vol. 38, pp. 341-363.