Embed Size (px)
Citation preview

A Football Business Report
on
Blackburn Rovers Football Club
2004-2013
LUBS 2250 – The Football Business
By
Student Number: 200610820
Word Count: 3,000
Grade Achieved: 74/90 (1st)

`
200610820
1
TABLE OF CONTENTS
ACW TASK 1 2
KEY FINDINGS 2 EVIDENCE 3 TECHNICAL DETAILS 5
ACW TASK 2 6
KEY FINDINGS 6 EVIDENCE 6 TECHNICAL DETAILS 9
ACW TASK 3 10
KEY FINDINGS 10 EVIDENCE 10 TECHNICAL DETAILS 13
ACW TASK 4 14
KEY FINDINGS 14 EVIDENCE 14 TECHNICAL DETAILS 16

`
200610820
2
ACW TASK 1
Analyse the relationship between gate attendances, revenues and league performance for
your selected club over the last 10 years for which financial data is available. Determine
whether or not changes in league performance have had a significant influence on your
club’s gate attendances and revenues.
KEY FINDINGS
Blackburn’s average gate attendances over the past 10 years point to a positive
correlation between league performance and attendance with the highest average
attendance being in the 2009/10 season where they finished 10th in the Premier League,
their third highest position in the last 10 years.
The main anomaly over the past 10 years was in the 2005/06 season where their average
gate attendance was down at 21,015, the second lowest over the past 10 years. This was
despite a strong performance in the league where they finished 6 th, their highest position
over the last 10 years.
Blackburn’s stadium utilization rate has been fairly low over the last 10 seasons when
compared with the average in the Premier League. For example in the 2004/05 season,
Blackburn’s stadium utilization rate was only 72%, compared with the Premier League
average of 94.2% (Deloitte & Touche Annual Review of Football Finance, June 2005).
The 2007/08 season seems to be a turning point for Blackburn Rovers as their strong
performance in the league (finished 7th) was mirrored by a large increase in total revenue
from £43.3 million in 2006/07 to £56.4 million, an increase of 30.3%.
Blackburn’s relegation to the Championship at the end of 2012/13 season saw a drop in
total revenue from £54.2m the season before to £26.9m. Their average gate attendance
also dropped down to 14,997, a decrease of 33.5%.

`
200610820
3
EVIDENCE
From the evidence it is clear that there is a positive link between league performance and
average gate attendances. Over the past 10 years there has been a positive co-movement
between the two factors on 6 occasions. The main anomaly in this analysis is the 2005/06
season where Blackburn’s league position rose from 15th the year before to 6th, however,
average gate attendances fell from 22,315 to 21,015. A possible explanation for this is the sale of
both Andy Cole and Dwight Yorke who had fallen out of favour with the manager at the time,
Graeme Souness. Blackburn’s poor performances the previous season also may have led to the
uncertainty of the outcome of Blackburn’s matches decreasing as fans felt that there team was
likely to lose most games on previous form. This uncertainty of outcome has been seen as a key
aspect determining attendance demand (Gerrard, 2000). In Blackburn’s company accounts report
for the year ending June 2006, the Chairman of the Board admitted “falling attendances remain a
big issue for Rovers”. He stated that this was down to a number of factors including price, kick-off
times, predictable results and television coverage but concluded by saying that the Board were
agreed that prices for matchday tickets at Ewood Park need to be lowered, despite being one of
the lowest in the league already. This reflects the competition for fans that Blackburn faces from
other local clubs such as Burnley, Blackpool and Bolton.
2004 2005 2006 2007 2008 2009 2010 2011 2012 2013
Average Gate
Attendance 24,376 22,315 21,015 21,275 23,944 23,479 25,428 25,000 22,551 14,997
League Position 15 15 6 10 7 15 10 15 19 37
0
2
4
6
8
10
12
14
16
18
2015,000
17,000
19,000
21,000
23,000
25,000
2004 2005 2006 2007 2008 2009 2010 2011 2012 2013
Leag
ue P
osit
ion
Ave
rag
e G
ate
Year
Blackburn Rovers Average Gate v League Performance
2003/04 - 2012/13
Average Gate Attendance
League Position

`
200610820
4
It is no surprise that Total Revenue follows a very similar line to that of average gate attendance
as in Blackburn’s case, matchday income has accounted for on average 14.2% of total revenue.
However, as can be seen in the table on the next page, Blackburn have become less reliant on
matchday income over the years; it’s percentage share of total revenue has fallen from 20.8% in
2007 down to 10.0% in 2012. The main reason for this is that media income has grown in
Season Average
League Gate
League
Position
Change in
Gate (HIGHER /LOWER)
Change in League
Position (HIGHER/SAME/LOWER)
Co-
Movement? (YES/NO)
2003/04 24,376 15 - - -
2004/05 22,315 15 LOWER SAME NO
2005/06 21,015 6 LOWER HIGHER NO
2006/07 21,275 10 HIGHER LOWER NO
2007/08 23,944 7 HIGHER HIGHER YES
2008/09 23,479 15 LOWER LOWER YES
2009/10 25,428 10
HIGHER HIGHER YES
2010/11 25,000 15 LOWER LOWER YES
2011/12 22,551 19 LOWER LOWER YES
2012/13 14,997 37 LOWER LOWER YES
0
2
4
6
8
10
12
14
16
18
2020.0
25.0
30.0
35.0
40.0
45.0
50.0
55.0
60.0
2004 2005 2006 2007 2008 2009 2010 2011 2012 2013L
eag
ue P
osit
ion
Tota
l R
eve
nu
e £
m
Year
Blackburn Rovers Total Revenue v League Position
2003/04 - 2012/13
Total Revenue League Position

`
200610820
5
significance over the past 10 years. During the 2003/04 season media income accounted for
£21.8m out of total revenue of £40.8m (53.3%) compared with the 2011/12 season (their last in
the Premier League) where media income was £41.1m out of £54.1m (75%). A key driver of this
increase in media revenue has been the lucrative television agreements, especially for the
Premier League where each new deal has historically risen in value by over 50% on the previous
deal.
TECHNICAL DETAILS
Task Summary: - There is evidence to suggest that as league performance increases, gate
attendances increase, however, Blackburn still has an extremely low stadium utilisation rate for
the Premier League. They have also become increasingly reliant to media revenue, which means
staying in the Premier League was a must for Blackburn, their relegation has led to financial
disaster.
Definitions:
Stadium Utilisation – percentage of stadium that is full.
Sources Used:
Blackburn Company Accounts 2004-2013. Available from ICC Financial Database
Workshop 1 and 2
http://www.european-football-statistics.co.uk/attn.htm
http://www.soccerbase.com
Reading 4 – Gate Attendance Demand for Football. Bill Gerrard (2000)
Average Gate
Previous Season
Average Gate
Current Season Difference % Change
Promotion Effect
2001/02 20,740 25,976 5,236 25.25%
Relegation Effect
2012/13 22,551 14,997 -7,554 -33.50%
2004 2005 2006 2007 2008 2009 2010 2011 2012 2013
Matchday Income (£m) 6.8 7.4 7.1 9.0 6.1 6.8 6.2 5.5 5.4 4.3
Revenue (£m) 40.8 41.3 43.4 43.3 56.4 50.9 57.8 57.6 54.2 26.9
MI as % of Revenue 16.6 17.9 16.4 20.8 10.8 13.4 10.7 9.5 10.0 16.0

`
200610820
6
ACW TASK 2
Analyse the relationship between sporting performance and player costs of your selected
club over the last 10 years for which financial data is available. Determine whether or not
your club has operated efficiently in achieving its sporting performance.
KEY FINDINGS
Blackburn’s wage costs have consistently risen over the past 10 years from £27.5m back
in 2004 to £50m in 2012.
During the last 4 years of Blackburn’s run in the Premier League, 2008/09 – 2011/2012,
they have had a consistently high percentage of their total revenue spent on wages,
ranging from 82% in 2009/10 season to 92.2% in their last season in the Premier League.
Drawing comparison with Blackburn’s performances against a club of a similar stature
such as Wigan only reinforces how inefficient they have been over their time in the
Premier League. During the 2011/12 season Wigan had the lowest total revenue in the
League of £53m but their wages expressed as a percentage of revenue was only 72%,
significantly better than Blackburn’s 92.2%. Despite these figures Wigan managed a very
creditable 15th in the League and survived for another season where as Blackburn were
relegated in 19th, 12 points behind Wigan.
EVIDENCE
The trends of the above graph showing Blackburn’s Total Wage expenditure against their league
position paints a basic picture of sporting inefficiency over the last 10 years as a steadily rising
wage bill does not seem to have reflected in better performance results ultimately culminating in
0
5
10
15
20
25
3020.0
25.0
30.0
35.0
40.0
45.0
50.0
55.0
2004 2005 2006 2007 2008 2009 2010 2011 2012 2013
Leag
ue P
osit
ion
Wag
es (
£m
)
Year
Wages vs League Performance - Sporting Performance
Blackburn Rovers 2003/04 - 2012/13
Wage Costs League Position
`
200610820
7
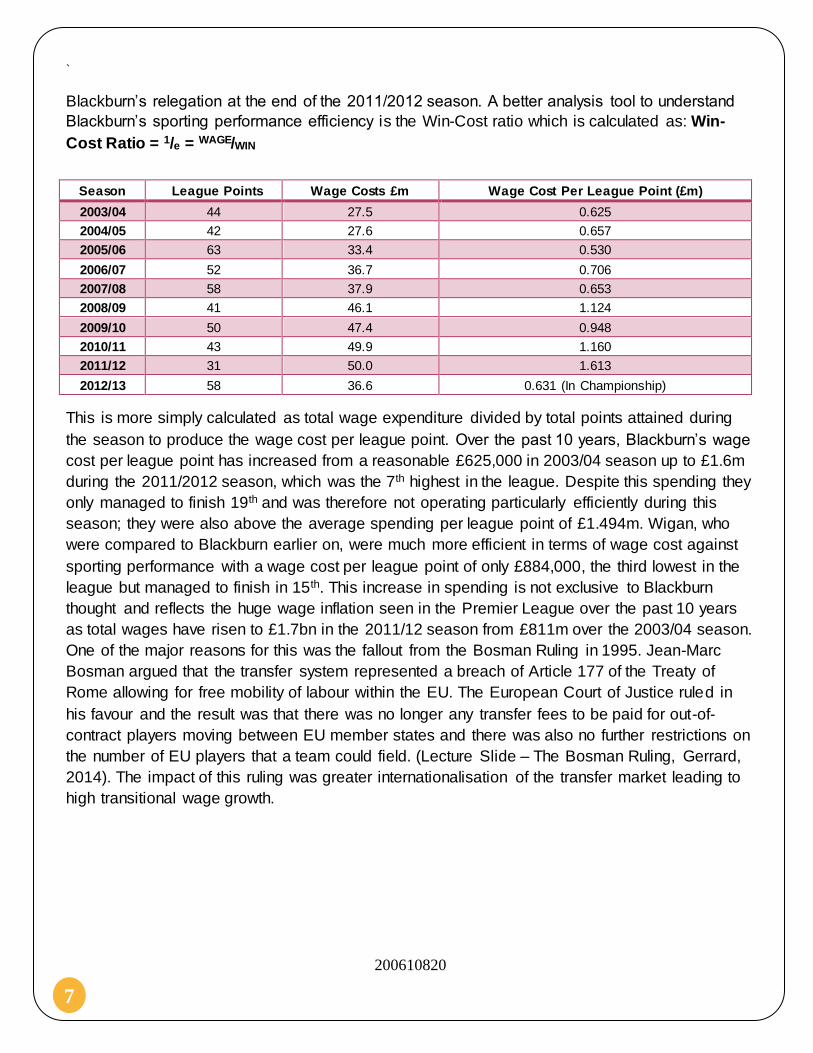
Blackburn’s relegation at the end of the 2011/2012 season. A better analysis tool to understand
Blackburn’s sporting performance efficiency is the Win-Cost ratio which is calculated as: Win-
Cost Ratio = 1/e = WAGE/WIN
This is more simply calculated as total wage expenditure divided by total points attained during
the season to produce the wage cost per league point. Over the past 10 years, Blackburn’s wage
cost per league point has increased from a reasonable £625,000 in 2003/04 season up to £1.6m
during the 2011/2012 season, which was the 7th highest in the league. Despite this spending they
only managed to finish 19th and was therefore not operating particularly efficiently during this
season; they were also above the average spending per league point of £1.494m. Wigan, who
were compared to Blackburn earlier on, were much more efficient in terms of wage cost against
sporting performance with a wage cost per league point of only £884,000, the third lowest in the
league but managed to finish in 15th. This increase in spending is not exclusive to Blackburn
thought and reflects the huge wage inflation seen in the Premier League over the past 10 years
as total wages have risen to £1.7bn in the 2011/12 season from £811m over the 2003/04 season.
One of the major reasons for this was the fallout from the Bosman Ruling in 1995. Jean-Marc
Bosman argued that the transfer system represented a breach of Article 177 of the Treaty of
Rome allowing for free mobility of labour within the EU. The European Court of Justice ruled in
his favour and the result was that there was no longer any transfer fees to be paid for out-of-
contract players moving between EU member states and there was also no further restrictions on
the number of EU players that a team could field. (Lecture Slide – The Bosman Ruling, Gerrard,
2014). The impact of this ruling was greater internationalisation of the transfer market leading to
high transitional wage growth.
Season League Points Wage Costs £m Wage Cost Per League Point (£m)
2003/04 44 27.5 0.625
2004/05 42 27.6 0.657
2005/06 63 33.4 0.530
2006/07 52 36.7 0.706
2007/08 58 37.9 0.653
2008/09 41 46.1 1.124
2009/10 50 47.4 0.948
2010/11 43 49.9 1.160
2011/12 31 50.0 1.613
2012/13 58 36.6 0.631 (In Championship)

`
200610820
8
Another tool of analysis for looking at player costs is the % of Turnover that was being directly
spent on wages. Looking over the last 10 years, Blackburn spent a higher percentage of their
revenue on wages than the average for the Premier League in every single season; in 2013 they
were in the Championship and Deloitte has not yet released figures for the season. Their was a
large jump in the 2006/07 season from 77% the previous season to 84.8% and this can be largely
attributed to the signing of Benny McCarthy at the start of the season who became Blackburn’s
joint highest earner on £35,000 a week. During their last season in the Premier League,
Blackburn spent a huge proportion of their revenue on wages, 92.2%, which was the highest in
Season 2004 2005 2006 2007 2008 2009 2010 2011 2012 2013
League Position 15 15 6 10 7 15 10 15 19 37
Total Revenue (£m) 40.8 41.3 43.4 43.3 56.4 50.9 57.8 57.6 54.2 26.9
Wages (£m) 27.5 27.6 33.4 36.7 37.9 46.1 47.4 49.9 50.0 36.6
Wages/League Position
Correlation - NO YES NO YES NO YES NO NO -
Wages as % of
Turnover 67.4% 66.8% 77.0% 84.8% 67.2% 90.1% 82.0% 86.6% 92.2% 136.1%
League Average 61% 59% 62% 63% 62% 67% 68% 70% 70% N/A
0
0.5
1
1.5
2
2.5
3
FA Premier League Wage Cost per League Point 2011/12
Wage Cost per League Point

`
200610820
9
the league. A study of Blackburn’s wage spending over the past 10 years reflects what has
seemed to be a policy of trying to buy their way out of trouble in the Premier League. They have
largely relied on big signings for a club of their size, such as Andy Cole for £10m in 2001, Craig
Bellamy for £6.6m in 2005 and Barry Ferguson for £8.5m in 2004. These players, coming from
clubs such as Manchester United, Newcastle and Rangers demand big wages, which has put
huge pressure on Blackburn’s wage bill. This ultimately did not pay off for Blackburn; as their
wage bill spiraled upwards to 92.2% in 2011/2012, performance in the league did not reflect this
spending and their lowly 19th place finish at the end of the season left them facing relegation,
leading to a huge drop in revenue and ultimately the club making a significant loss the next year,
having to spend 136.1% of their revenue on wages.
There is some evidence to suggest that an increase in wage spending can lead to an increase in
performance; Blackburn’s total wage bill increased by 21% in 2005/06 from the season before
and this lead to Blackburn finishing 9 places higher in the league at 6 th. However this is largely an
irregular occurrence in Blackburn’s history and is immediately countered by figures from the
2008/09 season where wage spending increased from £37.9m to £46.1m but Blackburn
struggled in the league and only finished 15th, 5 places lower than the previous season.
TECHNICAL DETAILS
Task Summary – Blackburn’s extremely high wage bill has left them in a dire position after
relegation into the Championship. It is clear that Blackburn are not always particularly efficient in
converting high wage spending into sporting performance. What is impressive however, is how
Blackburn have survived so long operating a very risky financial portfolio. Their trip to the
Championship will be extremely difficult but they may be helped by the increase in parachute
payments for teams relegated to the Championship to £48m.
Definitions:
Parachute Payments – Payments distributed to teams relegated to soften financial blow of
missing out on Premier League media and sponsorship revenue.
Sources Used:
Blackburn Company Accounts 2004-2013. Available from ICC Financial Database
Class 2 Solutions
Lecture Slides – Bosman http://www.guardian.co.uk/football/2013/apr/18/premier- league-finances-club-by-club

`
200610820
10
ACW TASK 3
Analyse the financial performance of your club over the last five years for which financial
data is available. Determine whether or not your club has performed well financially
KEY FINDINGS
Over the past 10 years Blackburn’s total revenue has been consistently low for a Premier
League club, hovering around the £50m mark.
Their operating costs have exceeded their total revenue for each of the last 10 years and
this has left them in a precarious position.
Blackburn have operated a largely successful trading policy where they top up their low
revenue’s by buying and selling players as needed to fulfill this deficit.
This transfer policy has allowed to Blackburn to operate with an extremely high
Wages/Revenue ratio, the highest in the league on a number of occasions. This is
ultimately what has left them in financial ruin as their successful model was reliant on
remaining in the Premier League to benefit from the sizeable media revenue that the
Premier League brings.
EVIDENCE
BLACKBURN 2013 2012 2011 2010 2009
Revenue £26,900,000 £54,200,000 £57,600,000 £57,800,000 £50,900,000
Staff Costs £36,600,000 £50,000,000 £49,900,000 £47,400,000 £46,100,000
Other Operating Costs £14,600,000 £13,800,000 £11,900,000 £12,100,000 £11,300,000
PBIT -£36,036,146 £4,462,692 -£17,980,620 -£1,298,905 £4,423,370
Operating Profit/Loss -£33,992,972 -£18,446,281 -£12,083,821 -£12,052,356 -£14,536,425
PBITDA -£24,850,095 £14,662,479 -£8,668,750 £10,442,309 £13,886,146
Depreciation -£1,483,562 -£1,386,612 -£1,468,872 -£1,440,613 -£1,414,950
Amortisation -£9,702,489 -£8,813,175 -£7,842,998 -£10,300,601 -£8,047,826
Player Trading -£11,745,663 £14,095,798 -£13,739,797 £452,850 £10,911,969

`
200610820
11
As is pretty evident from the above figures, Blackburn suffered a disastrous year during the
2012/2013 season after their relegation to the Championship. Blackburn had been operating on a
tight rope with a consistently high wage/revenue ratio throughout their stay in the Premier
League. Their strategy was to reinvest any profits made back into the team, either as capital
expenditure or through wages as they believed in order to be competitive they needed to pay
high salaries to attract the players they required. This left Blackburn high and dry when they
began their campaign in the Championship as revenue plummeted from £54.2m to £26.9m,
mostly down to a reduction in media revenue from £41.1m to £17.9m.
Prior to Blackburn’s relegation, their total revenue had remained fairly constant at around £50-
£57m which is very low for a club that was performing reasonably well in the league, finishing in
the top 10 on 4 occasions since 2006. Blackburn have essentially become a trading club,
balancing sales and purchases and where necessary, selling players to fund higher wage bills for
current players. An example of this was in the 2009/10 season where Blackburn were faced with
reducing wages by 10% or finding £4m from player sales. They opted for the latter, not wanting to
cut wages, and sold Stephen Warnock to Aston Villa for £7m replacing him with Pascal
Chimbonda from Tottenham for £3m. This is the way Blackburn have survived over the past 10
years, buying and selling players to balance their books and allow them to keep their wage
packet high. Crucial to this strategy however was the revenue they gained from TV deals in the
Premier League and this is why they have been so badly affected in their first season in the
Championship with Profit before Interest and Tax amounting to -£36,036,146.
Comparatively with Wigan, Blackburn’s performance does not look impressive and we can see
the vast difference in their returns on assets, capital employed and equity in 2012. What is also
extremely noticeable is the price Blackburn paid for relegation; in 2013 they had an ROA of
-59.57% compared with Premier League Wigan’s 4.76%.
BLACKBURN 2013 2012 2011 2010 2009
Rates of Return
ROA -59.57% 7.12% -31.10% -1.93% 6.05%
ROCE -132.65% 9.31% -39.76% -2.67% 8.85%
ROE -238.40% 18.60% -98.64% -6.87% 12.12%
WIGAN 2013 2012 2011 2010 2009
Rates of Return
ROA 4.76% 17.94% -23.19% -13.01% -11.61%
ROCE 10.29% 37.21% -9.45% -5.42% -7.89%
ROE 6.81% 33% -1.98% -6.89% -10.81%

`
200610820
12
Analysing Blackburn’s rates of returns, their financial performance does not seem to have much
stability over the past 5 years. They were operating reasonably steadily through the 2008 and
2009 seasons making PAT of around £3m but in 2011 Blackburn couldn’t balance their operating
losses against sales of players as they made a loss through player transfers of £13m. This
pushed profit after tax down to -£18,615,134, which had a substantial impact on the clubs rates of
return. A promising financial performance in 2012 was again mainly down to the transfer policy of
Blackburn, with Phil Jones and Chris Samba leaving the club, netting Blackburn over £25m for
the pair. This is reflected in the Player Trading/Revenue ratio in the table below, which rose from
-23.85% in 2011 to 26.01%. Unfortunately, Blackburn could not convert this great financial
performance into league performance as they slipped to 19 th by the end of the season with a
Wage/League Points ratio of £1,612,903, their highest of the last 10 years.
Blackburn’s operating margin has been poor throughout the last 10 years, as their operating
costs have always exceeded their total revenue. Once again it is important to state that the only
way they survive operating like this is because of their fluid transfer policy, constantly shipping
players in and out and looking for a profit on them and this explains the vast difference between
their profit margin and their operating margins. The below graph illustrates the vast difference
between their total revenue and operating profit/loss.
2013 2012 2011 2010 2009
Profit Margin -133.96% 8.23% -31.22% -2.25% 8.69%
Operating Margin -126.37% -34.03% -20.98% -20.85% -28.56%
Player Trading/Revenue -43.66% 26.01% -23.85% 0.78% 21.44%
Wage/Revenue Ratio 136.06% 92.25% 86.63% 82.01% 90.57%
Wage/League Points Ratio £631,034 £1,612,903 £1,160,465 £948,000 £1,124,390
-150.00%
-100.00%
-50.00%
0.00%
50.00%
100.00%
-£40,000,000
-£20,000,000
£0
£20,000,000
£40,000,000
£60,000,000
£80,000,000
2009 2010 2011 2012 2013
Blackburn Rovers Operating Profit/Revenue
Revenue Operating Profit/Loss Operating Margin

`
200610820
13
TECHNICAL DETAILS
Task Summary – Blackburn’s financial performance has been extremely inconsistent over the
past 5 years and their overall performance tends to rely mainly on the success or otherwise of
their transfers. They are set to face a difficult struggle to stay afloat after making huge losses in
their first season in the Championship and having to face possible sanctions from the Financial
Fair Play rules.
Definitions:
ROA – Return on Assets
ROCE – Return on Capital Employed
ROE – Return on equity
Sources Used:
Blackburn Company Accounts 2004 – 2013. Available from ICC Financial Database
Lecture Slides

`
200610820
14
ACW TASK 4
Analyse the cash flows for your club over the last five years for which financial data is
available. Determine how your club has financed its investment expenditures.
KEY FINDINGS
Blackburn’s net cash flows have been negative in 4 out of the last 5 years with 2011/2012
being the only exception
Blackburn have continued to take out large loans from the bank in order to finance their
high operating costs and keep wages high.
Blackburn’s net debt has risen from £20m back in 2009 to £54m in 2013.
Blackburn cannot to afford to continue running the club as it is currently running as they
will face hefty punishments under the new Financial Fair Play rules which allow only an
£8m loss in a year for teams in the Championship.
EVIDENCE
Blackburn Rovers 2013 2012 2011 2010 2009
Capital Expenditure and Financial Investment
Payments to acquire intangible
fixed assets -£9,843,694 -£12,269,523 -£10,845958 -£19,297,057 -£2,310,425
Payments to acquire tangible fixed
assets -£1,201,594 -£132,101 -£565,847 -£1,573,029 -£688,906
Receipts from sales of intangible
fixed assets £5,507,934 £24,092,197 £675,002 £21,486,076 £7,069,743
Receipts from sales of tangible
fixed assets £1,147 £2,279 £2,000 £243 £4,320
Net cash inflow/outflow -£5,536,207 £11,692,852 -£10,734,803 £616,233 £4,074,732
Financing
Repayment of Bank Loan 0 0 -£2,625,000 -£875,000 -£875,000
New Loans £20,200,000 £19,150,000 £15,185,848 0 0
Repayment of Loans -£121,452 -£3,196,452 -£5,027,137 -£1,000,000 0
New hire purchase borrowing 0 0 £130,861 £65,356 0
Repayment of hire purchase
borrowing -£23,095 -£53,282 -£59,206 -£29,836 -£1,007

`
200610820
15
Movement in loan from parent
company 0 0 0 0 £3,000,000
Net cash inflow/outflow £20,055,453 £15,900,266 £7,605,366 -£1,839,480 £2,123,993
Returns on investment and servicing of finance
Interest received £694 £8,067 £7,511 £64,361 £21,439
Bank and other interest paid -£462,244 -£211,026 -£639,543 -£661,002 -£860,261
Hire purchase interest paid -£2,522 -£2,522 -£2,522 0 -£230
Net cash inflow/outflow -£464,072 -£205,481 -£634,514 -£596,641 -£839,052
Blackburn’s net cash flow has largely been negative over the past 5 years with the 2011/2012
season being the only positive figure as they recorded an inflow of £17,730,209. This is attributed
to a strong performance in their capital expenditure as the selling of Phil Jones to Manchester
United for £16.5m and Christopher Samba to Anzhi for £11m contributed towards a high receipt
from the sales of intangible fixed assets of £24,092,197. Blackburn have consistently made cash
losses from their operating activities and thus their net cash flows performance has largely come
down to two things, their fluent transfer policy and taking out new loans. From 2011 - 2013,
Blackburn have taken out new loans to the value of £15m, £19m and £20m respectively to help
cover their operating activities deficit and allow them to maintain high wages for their players.
This is inspite of Barclays demands back in 2011 that Venky’s shrink the debt they owe as
agreed when they took control at Ewood Park. This has left the club in £54m worth of debt at the
end of the 2012/13 season and with Financial Fair Play punishments looming thanks to their total
loss for the 2012/13 season amounting to £36m - £24m more than is permitted under the new
regulations – the outlook is bleak for Blackburn Football Club.
Cash Flow Statement 2013 2012 2011 2010 2009
Operating activities -£24,028,650 -£9,657,428 -£3,940,444 -£672,502 -£6,665,966
Investment returns & servicing
finance -£464,072 -£205,481 -£634,514 -£596,641 -£839,052
Taxation £31,978 0 0 0 0
Capital expenditure & financial
investment -£5,536,207 £11,692,852
-
£10,734,803 £616,233 £4,074,732
Financing activites £20,055,453 £15,900,266 £7,605,366 -£1,839,480 £2,123,993
Net Cash Flow -£9,941,498 £17,730,209 -£7,704,395 -£2,492,390 -£1,306,293
Net Debt £54,478,274 £24,481,323 £26,311,266 £21,001,505 £20,348,595

`
200610820
16
TECHNICAL DETAILS
Task Summary – Blackburn’s cash flows have been consistently negative as they take out more
and more loans to cover their high operating costs. They now face an uphill task to begin to pay
off their debts whilst surviving on lower revenue from the Championship.
Definitions:
Financial Fair Play – Restrictions put in place by UEFA to prevent clubs going bankrupt
and increase competition in European Football.
Sources Used:
Blackburn Company Accounts 2004 – 2013. Available from ICC Financial Database
Lecture Slides – Bill Gerrard
http://www.guardian.co.uk/football/david-conn- inside-sport-blog/2012/may/08/blackburn-rovers-nightmare-scenario
Class 4 Solutions