Embed Size (px)
Citation preview
FOOD WASTE COLLECTION AND COMPOSTING FEASIBILITY STUDY
FOR ALLEGHENY COUNTY
Report Prepared For
PA Department of Environmental Protection November 5, 2006
By the Food Waste Composting Coalition
and Administered by the PA Resources Council
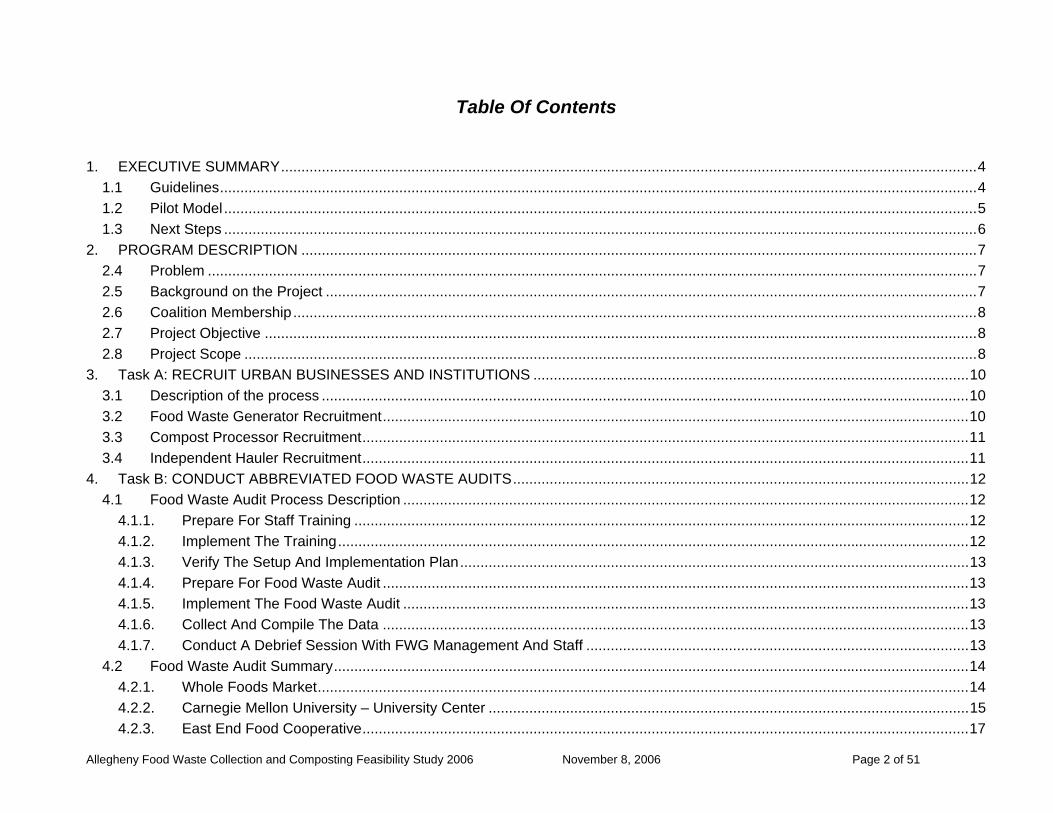
Table Of Contents
Allegheny Food Waste Collection and Composting Feasibility Study 2006 November 8, 2006 Page 2 of 51
1. EXECUTIVE SUMMARY...........................................................................................................................................................................4
1.1 Guidelines..........................................................................................................................................................................................4 1.2 Pilot Model .........................................................................................................................................................................................5 1.3 Next Steps .........................................................................................................................................................................................6
2. PROGRAM DESCRIPTION ......................................................................................................................................................................7 2.4 Problem .............................................................................................................................................................................................7 2.5 Background on the Project ................................................................................................................................................................7 2.6 Coalition Membership........................................................................................................................................................................8 2.7 Project Objective ...............................................................................................................................................................................8 2.8 Project Scope ....................................................................................................................................................................................8
3. Task A: RECRUIT URBAN BUSINESSES AND INSTITUTIONS ...........................................................................................................10 3.1 Description of the process ...............................................................................................................................................................10 3.2 Food Waste Generator Recruitment................................................................................................................................................10 3.3 Compost Processor Recruitment.....................................................................................................................................................11 3.4 Independent Hauler Recruitment.....................................................................................................................................................11
4. Task B: CONDUCT ABBREVIATED FOOD WASTE AUDITS................................................................................................................12 4.1 Food Waste Audit Process Description ...........................................................................................................................................12
4.1.1. Prepare For Staff Training .......................................................................................................................................................12 4.1.2. Implement The Training...........................................................................................................................................................12 4.1.3. Verify The Setup And Implementation Plan.............................................................................................................................13 4.1.4. Prepare For Food Waste Audit ................................................................................................................................................13 4.1.5. Implement The Food Waste Audit ...........................................................................................................................................13 4.1.6. Collect And Compile The Data ................................................................................................................................................13 4.1.7. Conduct A Debrief Session With FWG Management And Staff ..............................................................................................13
4.2 Food Waste Audit Summary............................................................................................................................................................14 4.2.1. Whole Foods Market................................................................................................................................................................14 4.2.2. Carnegie Mellon University – University Center ......................................................................................................................15 4.2.3. East End Food Cooperative.....................................................................................................................................................17
Table Of Contents
Allegheny Food Waste Collection and Composting Feasibility Study 2006 November 8, 2006 Page 3 of 51
4.2.4. Jewish Association On Aging ..................................................................................................................................................18 4.2.5. Chatham College .....................................................................................................................................................................19 4.2.6. Greater Pittsburgh Community Food Bank..............................................................................................................................22
4.3 Food Waste Audit Results Tables ...................................................................................................................................................23 4.3.1. Chatham College Food Waste Audit Results ..........................................................................................................................23 4.3.2. Whole Foods Supermarket Food Waste Audit Results ...........................................................................................................24 4.3.3. East End Food Cooperative Supermarket Food Waste Audit Results.....................................................................................25 4.3.4. CMU University Center Food Waste Audit Results..................................................................................................................26 4.3.5. Jewish Association on Aging (JAA) Food Waste Audit Results...............................................................................................27 4.3.6. Estimated Food Waste Amounts .............................................................................................................................................28
5. Task C: RESEARCH FOOD WASTE COLLECTION AND COMPOSTING SYSTEM OPTIONS AND COSTS.....................................29 5.1 Precedent Study of Existing Food Waste Collection and Composting Operations..........................................................................29
5.1.1. Norcal Waste Systems Inc. in San Francisco, CA...................................................................................................................30 5.1.2. Eastern Organics Resources (EOR) in Wrightstown, NJ.........................................................................................................30 5.1.3. Rutland County Commercial Food Waste Composting Program in Rutland, VT.....................................................................31 5.1.4. Conclusion: ..............................................................................................................................................................................32
5.2 Economic Analysis ..........................................................................................................................................................................32 5.2.1. Results.....................................................................................................................................................................................36 5.2.2. Conclusions .............................................................................................................................................................................45
6. Task D: CONSTRUCT COLLECTION AND COMPOSTING PILOT MODEL .........................................................................................48 7. Task E: DESIGN AND DEVELOP MARKETING MATERIALS ..............................................................................................................50
7.1 Design Web Based Financial Modeling Tool ...................................................................................................................................50 7.2 Develop Business Plan for Invessel Composting ............................................................................................................................51

Allegheny Food Waste Collection and Composting Feasibility Study 2006 November 8, 2006 Page 4 of 51
1. EXECUTIVE SUMMARY
Food – derived organic materials remain one of the most problematic components in the waste stream to recycle. Preliminary data from 2001 PA DEP Waste Composition Study indicates that food waste comprises an estimated 7.3 percent of waste materials land filled in urban Southwestern Pennsylvania communities. Nationally, the EPA estimates that food waste comprises approximately 10% of the solid waste stream. Moreover, PA is the fifth largest food processor in the country. However, because of the challenges inherent in the separation, collection, and processing of food waste, effective composting or other food waste recycling programs have been slow to develop.
This regional study examines the feasibility of implementing a pilot program to collect food waste from a variety of food waste generators (FWGs) and direct it into a windrow composting operation. Ideally the compost made from local food waste is in some part returned to the generator and/or to the people buying the food that contributes to the compost, and so on. Food waste composting is an example of what William McDonough calls a “cradle to cradle” production cycle. When regional food waste materials are collected, composted and then used to improve soil conditions for food production in that region, composting becomes a regenerative process.
This Report provides a unique perspective on key variables that point to developing a local collection and composting system that can maximize the amount of food waste diverted at the source into composting operations. There is significant environmental quality and business opportunities to be gained with implementing a broad based organic waste composting system for our region.
The Food Waste Composting Coalition team interviewed a diverse group of local urban food waste generators, hauler, and compost processors, and conducted abbreviated food waste audits with a cross section of the Food Waste Generators (FWGs) who expressed interest in participating in a pilot program. The team developed and analyzed a large number of scenarios using data from our interviews and audits to determine combinations in the variables that produced savings in the cost to separate and compost food waste. A financial modeling tool for evaluating cost advantages for the commercial food waste generator participating in the collection of organics was used to generate cost models based on local variable conditions defined for each scenario. Our analysis of these scenarios and cost data resulted in the following guidelines and pilot models for developing economically viable collection and composting food waste systems.
1.1 Guidelines If the total number of pulls/collections for both the solid waste and the food waste equals or is less than the current number of
weekly pulls/collections then the FWG can experience a cost savings when composting their food waste.
Large FWGs, for which greater than 50% of their waste stream is food waste, are likely to benefit economically from a food waste collection and composting program.
Allegheny Food Waste Collection and Composting Feasibility Study 2006 November 8, 2006 Page 5 of 51
If the food waste and solid waste can be pulled/collected at the same time and taken to a composting facility and landfill that are either at the same site or in close proximity to each other, then there is a cost savings regardless of food waste generator size. As a result the following condition would apply:
The addition of food containing animal products to an in-vessel composting food waste diversion program did not result in a significant cost savings to the FWG.
An increase in solid waste tipping fees can result in the economic viability of a food waste collection and composting program for large FWGs with a high percentage of food waste in their waste stream.
Factors related to economy of scale create a disadvantage for small food waste generators who want to participate in a food waste collection and composting program. A subsidy can increase the likelihood that small FWGs could effectively participate in a food waste collection and composting program.
Grant funding to cover the capitol costs for collection and hauling equipment reduces the operating costs for the organics haulers and enables a significantly higher number of scenarios to be economically viable. . It was found that 14% of the scenarios reviewed were economically viable without subsidies, while 38% became economically viable when subsidies were applied.
1.2 Pilot Model The team used these guidelines in developing a model for a pilot food waste collection and composting process that we propose to implement in Phase II of the Food Waste Collection & Composting Project. We applied them to the group of interested FWGs, hauler, and organic composters who are ready to begin collection and/or composting, to configure three pilot models that address a range in food waste volumes we observed among local FWGs.
Pilot Model A: Small-scale Vol
Facilitate the development of a working relationship between one or more small-scale urban FWGs (where food waste is less than 12% of their total daily waste) and one or more “on farm” processor who would also collect food waste from the FWGs.
Pilot Model B: Mid-size Vol
Facilitate the development of a working relationship between one or more mid-sized urban FWGs (where food waste is between 17% and 47% of their total daily waste) and a commercial composting business who would collect food waste from the FWGs and also accept food waste from an independent hauler contracted by the FWG.
Pilot Model C: Large Vol
Facilitate the development of a working relationship between one or more large sized urban FWGs (where food waste is greater than 50% of their total daily waste), and an independent hauler who will take the food waste to a commercial composting business.
Allegheny Food Waste Collection and Composting Feasibility Study 2006 November 8, 2006 Page 6 of 51
Over the course of a Pilot program implementation (at least 12 months), our research would focus on monitoring key aspects of these working relationships including:
Critical communication issues between processor and FWG
Management of food waste source separation training for FWG
Contract terms and agreements between FWGs and Processors (e.g. pick ups and food waste requirements)
FWG issues with food waste storage and pick up (e.g. physical space limitations)
Requirements for trucks and equipment used to transport food waste
Processor permitting and bonding responsibilities
Actual cost savings / increases
Another part of the focus would be to make the information accessible to local stakeholders who are interested in refining the source separation, collection and composting of food waste.
1.3 Next Steps The Coalition team sees their next steps toward the goal of implementing a pilot program to include:
Seeking the funding needed to proceed with the pilot study
Continuing the development of marketing materials using a website as a means for delivering the information.
Pursuing the possibility of involving a local landfill operator in establishing a composting operation at or near their site. Share the feasibility information with interested FWGs.
There is sufficient momentum coming from the Phase I effort to assume that outcomes from the implementation of a pilot program would advance the willingness and ability of local stakeholders to invest time and resources in making the collection and composting of commercial food waste a viable option for recycling larger quantities of organic solid waste.
Allegheny Food Waste Collection and Composting Feasibility Study 2006 November 8, 2006 Page 7 of 51
2. PROGRAM DESCRIPTION
2.4 Problem Food – derived organic materials remain one of the most problematic components in the waste stream to recycle. Preliminary data from 2001 PA DEP Waste Composition Study indicates that food waste comprises an estimated 7.3 percent of waste materials land filled in urban Southwestern Pennsylvania communities. However, because of the challenges inherent in the separation, collection, and processing of food waste, effective composting or other food waste recycling programs have been slow to develop. Current waste handling costs in southwestern Pennsylvania, among the lowest in the nation, have been a major deterrent to establishing composting and other alternative waste handling practices. However, as recycling goals and landfill costs increase, programs that allow for the diversion of large amounts of organic materials, including food waste, are needed. Some municipalities are beginning to take actions that support waste reduction and recycling. Businesses that recycle organic and inorganic waste are starting to develop in our region. This is a gradual transition process we must address with more focus and support. The Allegheny Food Waste Composting Coalition is taking the initiative to develop a plan that pilots a food waste collection and composting program for the Greater Pittsburgh area.
2.5 Background on the Project
The project has taken 5 years to reach the current stage. Starting in November of 2001 with a series of discussions that included representatives from several local university facility management services, the City of Pittsburgh’ recycling department, the county health department recycling coordinators office, a non-profit organization with a focus on waste reduction, a private consulting company, and the Pittsburgh DEP office, a coalition of interested stakeholders began making plans to implement a pilot project. In January 2003, with a grant from the PA DEP, R.W. Beck completed an initial feasibility study for this project. Results of the Beck study and other preliminary investigations indicated that a composting program for food waste from institutions and businesses could compete economically with conventional waste handling practices when funding is used to offset equipment and training costs. While we can utilize the outcomes from collection and composting programs implemented in other areas, detail around several factors must be developed before a pilot program can be effectively designed and implemented for Allegheny County.
Allegheny Food Waste Collection and Composting Feasibility Study 2006 November 8, 2006 Page 8 of 51
Key factors include:
• Volume and weight of organic food waste, as defined by PA’s permitting requirements, available for commercial composting based on audits from a variety of urban institutions and businesses.
• The minimum volume / weight of diverted compostable food waste required to lower the overall waste handling costs for participating generators.
• Area institution and business requirements for an organic food waste separation, collection and pickup system implementation.
• The minimum / maximum volume and composition of available organic food waste that regional facilities can add to their composting operation.
2.6 Coalition Membership Coalition members include; Carnegie Mellon Green Practices, PA Department of Environmental Protection, Allegheny County Health Department, PA Resources Council and Applied Information Strategies.
2.7 Project Objective Current project efforts for Phase I are directed at acquiring baseline information needed for planning a pilot program to collect and compost source separated organic matter (SSOM), primarily food waste, from a variety of urban institutions and businesses in Allegheny County (e.g. universities, hospitals, restaurants, grocery stores, etc.).
2.8 Project Scope Developing a plan for a Pilot Program includes activity for each of the task areas below:
Task A Recruit urban businesses and institutions to participate in a proposed pilot program
Task B Conduct abbreviated food waste audits with participating businesses and institutions to determine volume and weight of available food waste, and identify the impact separating food waste has on their current waste handling practices and costs. The program development effort will conduct waste audits at 2 Grocery Stores, 2 Restaurants, 2 Universities/Colleges, and 1 Hospital over a 3 to 4 day period.
Task C Research options and costs for critical components in a food collection and composting system.
Task D Construct a collection and composting model, based on requirements of participating stakeholders, economic considerations and logistical parameters.
Task E Design and develop marketing materials for recruitment of additional program participants.
Allegheny Food Waste Collection and Composting Feasibility Study 2006 November 8, 2006 Page 9 of 51
Information coming from this program research and development effort enables the Coalition to work out a project implementation plan and grant application to carry forward a pilot collection and composting program. Outcomes from this development effort include:
• Estimates of Source Separated Organic Matter (SSOM) weight and volume available from a selection of urban institutions and businesses in Allegheny County.
• Estimates for minimum amount of food waste needed for overall program effectiveness. • Comparative models showing projected economic and logistical viability to conduct a pilot to collect and compost organic
food waste from institutions and businesses in Allegheny County • Classification of participating businesses and institutions by type, size, location and estimated amount of potential food
waste available for composting • Revised program information and approach to recruiting additional food waste generators and composting opportunities
for the pilot plan • Stakeholder training development requirements for participants to effectively implement source separation for organic
food waste.
Allegheny Food Waste Collection and Composting Feasibility Study 2006 November 8, 2006 Page 10 of 51
3. Task A: RECRUIT URBAN BUSINESSES AND INSTITUTIONS
3.1 Description of the process The Food Waste Composting Coalition team created a list of potential Food Waste Generators (FWGs) from Pa Resource Council’s knowledge base and the Coalition team experience. Urban institutions and businesses, where large amounts of food waste were generated and who were more likely to be interested in a pilot program were the focus of our recruitment effort.
The research team recruited from a diverse group of FWGs that included a university and college, hospital, senior resident and nursing home, wholesale food producer, food markets and a restaurant chain, Our team approached each FWG with the intent to recruit them as participants in the waste audit. If the FWG expressed interest during the initial phone call, the team member asked to meet with them to discuss how we would work together to complete the audit and why it was important.
An important piece in the communication strategy for recruitment was defining the interaction between the FWG and team members to conduct the audit. Helping everyone be as clear as possible about each other’s expectations was critical for success. The team composed a “Letter of Introduction” that was used during the first meeting with the FWG administration to explain the project and audit scope. The Letter of Introduction was based on the General Project Description and describes the audit from the FWG perspective. The information about how the audit worked and who was doing what, was included in the training to help set staff expectations.
The team found it difficult to recruit food service providers in large hospitals for the audit. These institutions require an “ok” from several levels of management and are often simultaneously engaged with multiple projects that stretch their time and attention.
In addition to FWGs, the team was actively recruiting processors in the area who were already composting organic waste or who were seriously considering doing it. Only one commercial processor and several farmers in the area currently have permits to compost food waste. Permits for on-farm composting of food waste are different than for a commercial composting operation. Interviews and a site visit were conducted with the majority of processors contacted. We also interviewed an independent hauler who is interested in participating in a Pilot.
3.2 Food Waste Generator Recruitment During the period of this study the Coalition team identified and contacted a total of 17 urban FWGs that included: 3 food markets, 2 universities and 1 college, 3 health care organizations, and 8 businesses. The team completed:
12 Interviews
11 site visits
Allegheny Food Waste Collection and Composting Feasibility Study 2006 November 8, 2006 Page 11 of 51
Nine of the FWGs who completed a site visit expressed an interest in participating in a pilot program. Of these nine, an abbreviated food waste audit was completed with:
2 food markets
1 university
1 college
2 health care organizations
1 business.
3.3 Compost Processor Recruitment During the period of this study the Coalition team identified and contacted a total of nine composting processors that included: 6 farms, 2 commercial composting businesses and one land fill operation. The team completed:
8 interviews
5 site visits
Of the 5 processors who expressed serious interest in participating in a pilot program:
1 is a commercial compost processor with a permit to recycle food waste but without hauling
2 are farmers with composting permits
1 is a commercial compost processor with a permit to compost yard waste but without a permit for composting food waste
1 is a landfill operation with a permit to compost yard waste but without a permit for composting food waste.
3.4 Independent Hauler Recruitment During the period of this study the Coalition team identified and contacted one independent hauler with a permit for hauling who is interested in participating in a pilot program.
Allegheny Food Waste Collection and Composting Feasibility Study 2006 November 8, 2006 Page 12 of 51
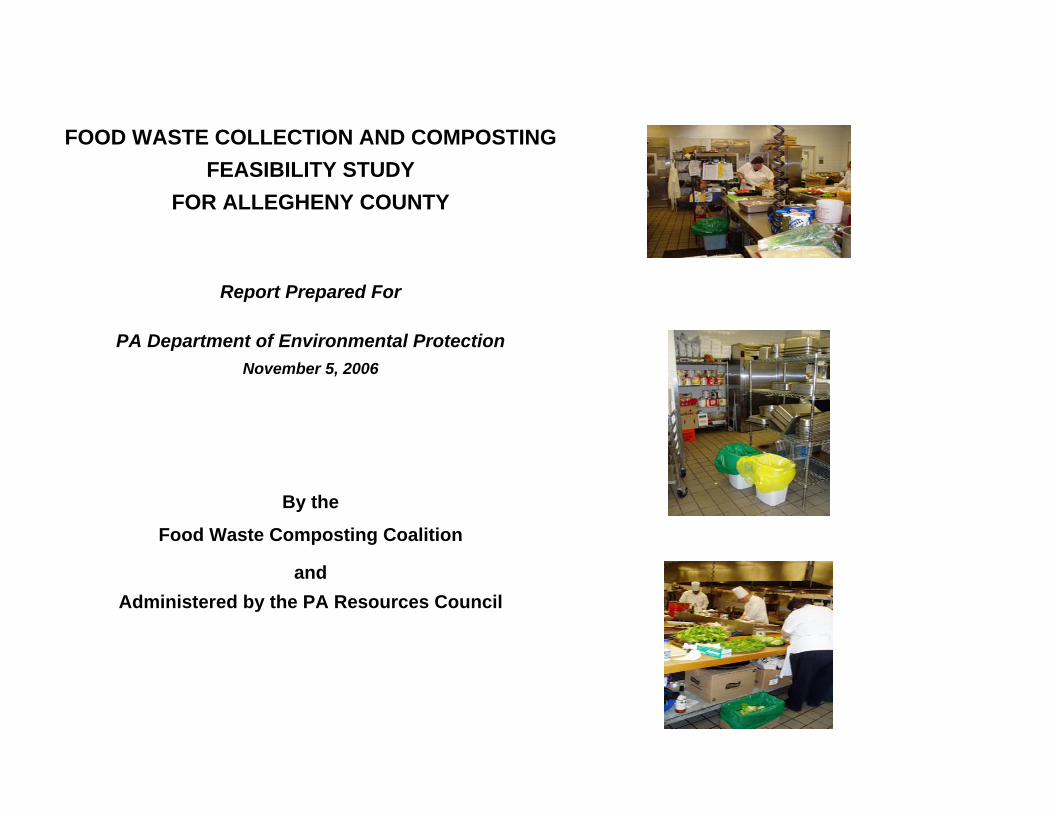
4. Task B: CONDUCT ABBREVIATED FOOD WASTE AUDITS For purposes of the study, the Coalition team decided to audit food waste in two discreet categories:
GREEN food waste was defined as plant based food without any dairy, meat, or oils.
YELLOW food waste was defined as all other food waste except grease.
The staff training conducted by team members provided instruction on classifying different kinds of foods into one of these two categories. During the audit, color-coded signs and plastic bags were used in the sorting areas to reinforce the categories. Bags of waste were weighed on a scale by team members, who wrote the weight on a recording sheet along with the time and level of contamination.
4.1 Food Waste Audit Process Description This outline details the major steps taken in the process of setting up and implementing the abbreviated food waste audit by the core team and any volunteers involved from the participating Food Waste Generators.
4.1.1. Prepare For Staff Training Identify the number and names of the staff to be trained for the Audit. Get to know the key contacts/shift supervisors overseeing the hands on operational areas Set up training and implementation schedule with both the management and participants Secure a location for conducting the training on site Include any volunteers who will help with measurement of food waste Check for any safety concerns effecting volunteers and monitors in the kitchen areas.
4.1.2. Implement The Training Explain the objective and background for this audit Describe the food waste categories and sorting requirements Do hands on food waste sorting practice Walk through and update the proposed plan for implementing audit:
o Role of core team member, volunteer if applicable, FWG staff o Location of containers in workstations involved with food preparation and collection

Allegheny Food Waste Collection and Composting Feasibility Study 2006 November 8, 2006 Page 13 of 51
o How food waste will be handled once collected. (e.g. When/where the containers will be emptied, how measured, etc.)
Determine how frequently do we need to measure (identify contents and weigh) the containers over the course of the day based on staff input
4.1.3. Verify The Setup And Implementation Plan Review the set up and implementation plan for pre and post consumer food waste separation with key personnel a day or two prior to implementation. (e.g. location of sorting stations, time of day preparation starts, who will be there, when, etc.)
4.1.4. Prepare For Food Waste Audit Photograph the setup Deploy containers Install designated signage for pre and post consumer food waste sorting areas
4.1.5. Implement The Food Waste Audit Identify various food waste components collected in each container as much as possible Weigh each container (Note: if food waste being collected is consistently the same, such as meat scraps it may only be necessary to weigh 3 or 4 containers and then keep a count of the number of containers generated for the day) Enter this information on the data collection sheet by day and time. Work with staff person to dispose of the container waste in appropriate place.
4.1.6. Collect And Compile The Data Compile data by individual FWG, as a group of FWG, and by type of food waste if applicable.
4.1.7. Conduct A Debrief Session With FWG Management And Staff Review the measurement outcomes of the food waste audit with participants Collect anecdotal information from food waste handlers, supervisors experience with sorting food waste Thank participants for their help with this project.
These steps are applied to the following businesses and institution recruited by the Core Team as participants for the abbreviated food waste audit. The following sections contain descriptive summaries of five audits completed and the tables that display the audit results.

Allegheny Food Waste Collection and Composting Feasibility Study 2006 November 8, 2006 Page 14 of 51
4.2 Food Waste Audit Summary 4.2.1. Whole Foods Market
A food waste audit was conducted at Whole Foods Market located in the neighborhood of Shadyside in Pittsburgh during the dates of March 30th –April 1st, 2006. As part of the preliminary planning for the waste audit, Michael Merlina, Meat Department Assistant Team Leader (Assistant Meat Department Manager) and Green Team Co-chair, met with representatives of PRC on March 16th for a preliminary interview on Whole Foods Market current waste handling practices. Currently, the food waste generated at Whole Foods Market is sent to a landfill. Food waste generated through food preparation, and food material left on plates and serving trays, are bagged with other materials and placed in a compactor that is emptied once a week.
A system to collect the food waste for the waste audit was designed during the initial interview. During the waste audit, all food waste would be gathered separately, bagged and weighed throughout the day as they are taken to the compactor. Food left over on customer plates would not be considered for this waste audit.
A training program was held on Tuesday, March 21st with all department Team Leaders (Managers). The Team Leaders were first given a brief introduction to the project. They then participated in a variety of hands on activities designed to inform them of the food waste collection system and generate interest in the project. The staff appeared to be very receptive to the waste audit. They agreed that because so much waste is created in all departments throughout the entire day, it would be most efficient for all staff members to remove and weigh the food waste generated in their own department throughout the study.
During the three-day waste audit a total of 4,850.1 pounds of food waste was collected. The food waste was separated into two categories: Green and Yellow. All vegetative food materials that can be composted in a windrow was placed in green bags and weighed separately. All other food material, including animal products, which can be composted in an in-vessel composter, was placed in yellow bags and weighed. An average of 1,143.2 lbs of “green” food waste and 473.5 lbs of “yellow” food waste was collected each day.
WHAT DID WE LEARN:
Periodically, the staff was asked how they felt about participating in this program. Most felt that it was fairly simple, as Whole Foods Market aspires to create a “Green Image” and composting food waste is a concept that is familiar among most staff.
Each Department Team Leader was responsible for training their respective department staff. Team Leaders felt that training went smoothly and most staff expressed an interest in participating in the study.

Allegheny Food Waste Collection and Composting Feasibility Study 2006 November 8, 2006 Page 15 of 51
Whole Foods Market sponsors a “Green Team” from which a representative from each department participates in monthly meetings to discuss “Green Practices” in Whole Foods Market. The study was well received among Green Team members and they agreed to help train and supervise staff throughout the study.
Locating enough space for food waste collection bins in some departments is a challenge. The size of the bins is important. They need to be tall enough that food isn’t spilled on the floor and small enough that they don’t get too heavy with large amounts of waste.
There is limited space at the Whole Foods loading dock, making it difficult to store food waste separately from the other waste. Unless a solution to the food waste storage could be worked out, separated food waste would need to be stored in totes and picked up frequently.
On October 12th 2006, Mia Manion, Café Production Cook and Green Team Co-chair, and Val Testa, Café Production Cook and Green Team Co-chair, met with PRC representatives to discuss Whole Foods Market’s interest in participating in a food waste collection and composting pilot program. Ms. Manion and Ms. Testa expressed a commitment to setting up a composting program at Whole Foods Market within the next year. Action to set up a food waste collection and composting program at Whole foods market has been taken, and representatives of PRC are currently assisting Whole Foods Market in this process.
4.2.2. Carnegie Mellon University – University Center A food waste audit was conducted at Carnegie Mellon’s University Center (UC), located in the Oakland area of Pittsburgh, on April 5th thru 8th, 2006. As part of the preliminary planning for the waste audit, several meetings were held with Barb Kviz, Environmental Coordinator for CMU Facilities Management, Parkhurst Food Services Director Russ Williams, and Dining Services Director Barb Verbanetts. Parkhurst prepares most of the food it serves on campus from scratch. Large quantities of fresh meat, fruits and vegetables are used to prepare meals for students and faculty as well as catering for meetings and other special events. A separate kitchen is maintained for the preparation of kosher meals. Food waste sources for the audit at CMU included three food preparation kitchens, three food distribution locations, a dish washing area, and one room where pots and pans were washed and large quantities of coffee brewed for catering, all managed by Parkhurst, along with one additional food vendor operating in the UC. The UC represents a substantial part of the larger CMU campus and there are other sources for food waste on campus not included in the audit. Food Services currently dumps all pre and post consumer food
Allegheny Food Waste Collection and Composting Feasibility Study 2006 November 8, 2006 Page 16 of 51
waste together with paper, cans, glass and plastics1 into plastic bags in large waste bins, and disposes of the bagged materials in a 32 yard compactor for the UC. Facilities Management has the compactor pulled once a week. In preparation for the UC audit, orientation and training was conducted on March 28 and 29 for 40 Parkhurst staff, 2 staff from the Oakland Original, the other food vendor participating in the audit, and 3 student volunteers. Setup to place the collection bins and a walk thru to rehearse the logistics for collecting and disposing of the separated food waste at the 8 sites was done on April 4th. Signs identifying the ‘Green” and “Yellow” food types were placed on the wall and counters next to collection bins with corresponding green and yellow plastic bags in them. At the request of CMU’s Environmental Coordinator, PRC staff included source separation for metals, glass, and #1 and #2 plastics in the training, and added separate collection bins, provided by Facilities Management, in the setup of the smaller food collection containers provided by PRC. During the audit, PRC staff along with several CMU student volunteers took responsibility for removing the bags of pre and post consumer food waste from collection bins at all the sites identified, while designated Parkhurst staff disposed of the other collected waste. During the audit period an average of 358.33 lbs per day of “green” food waste, and 284.66 lbs per day of “yellow” food waste were collected. There is significant variability in food waste output levels over the year as a result of CMU’s calendar of events. WHAT DID WE LEARN:
Parkhurst staff was asked, as part of a debriefing session following the audit, if collecting and replacing the food waste bags
on an as need basis was a task they could incorporate into their work flow. Almost all the staff felt it wasn’t feasible to add this task to their workload. It was determined that an additional staff person, primarily responsible for this task, would be needed if food waste were handled separately. The labor cost would be approximately $121 per day. Food waste collection could be expanded to three additional food distribution locations in the UC.
Everyone including the Parkhurst managers was impressed with how well everyone on staff, from the chefs to the dishwashers, was able to separate both pre and post consumer food waste. The contamination level was minimal. They felt the signs and bag colors were helpful. Temps hired for catering or filling in for staff who were sick or taking vacation had a hard time with separation. Trained staff sometimes took on the role of instructor with them.
Locating enough bins in the main kitchen to accommodate the multiple workstations is a problem with the current configuration of this space. The size of the bins is important. They need to be tall enough that food isn’t spilled on the floor and small enough that they don’t get too heavy with large amounts of waste.
1 While paper, metals, glass and plastics are collected separately across the campus, these materials were not being separated at this time by staff in the food preparation, distribution, and cleanup areas.
Allegheny Food Waste Collection and Composting Feasibility Study 2006 November 8, 2006 Page 17 of 51
Parkhurst staff persons responsible for emptying the regular large trash bins were impressed with how much lighter these bags were when food waste was removed. They could see that one payoff for this separation would be that they wouldn’t be lifting such heavy bags all the time.
There is limited space at the UC loading dock, making it difficult to store food waste separately from the other waste. Unless a solution to the food waste storage could be worked out, separated food waste would need to be picked up daily.
The general level of awareness across all staff members and student volunteers about the value of food waste as composting material was expanded. One Parkhurst staff member asked PRC team member for help setting up a composting project for her daughter at school. Other staff asked questions and were involved in talking with student volunteers and PRC team members about how this separation of food waste was useful to the environment.
4.2.3. East End Food Cooperative
A food waste audit was conducted at the East End Food Cooperative (EEFC) located in the neighborhood of Point Breeze in Pittsburgh during the dates of March 23-25, 2006. As part of the preliminary planning for the waste audit, David Headings, Produce Department Manager, and Sarah Lewis, Café Manager, met with representatives of PRC on March 15th for a preliminary interview on the EEFC’s current waste handling practices. Currently, the food waste generated at the EEFC is sent to a landfill. Food waste generated from the produce department, through food preparation in the cafe, and food material left on plates and serving trays, are bagged with other materials and placed in dumpsters that are emptied six days a week.
A system to collect the food waste for the waste audit was designed during the initial interview. During the waste audit, all food waste from the café prep areas and serving trays would be gathered separately, bagged and weighed periodically throughout the day. In addition, all food waste from the produce department would be gathered separately, bagged and weighed periodically throughout the day. Food left over on customer plates would not be considered for this waste audit.
Mr. Headings and Ms. Lewis were responsible for training café and produce department staff participating in the food waste audit. Mr. Heading & Ms. Lewis reported that training the staff went smoothly, since the EEFC is a natural foods grocery store and a majority of the staff express interest in environmental issues.
During the three-day waste audit a total of 451.4 pounds of food waste was collected. Only vegetative food materials that can be composted in a windrow was collected and placed in green bags and weighed separately. All other food material, including animal products, were not collected because they represent approximately less than 1% of food waste generated at the EEFC. An average of 150.5 lbs of “green” food waste was collected each day.
WHAT DID WE LEARN:
Allegheny Food Waste Collection and Composting Feasibility Study 2006 November 8, 2006 Page 18 of 51
Periodically, the staff was asked how they felt about participating in this program. Most felt that it was “easy” and would simply require a breaking of “old habits” to throw food waste and garbage in separate containers.
Most staff at EEFC are excited for the potential of the EEFC to begin composting food waste and realized the benefits of the process. There was no contamination and they felt the signs and bag colors were helpful.
Locating enough bins in the main kitchen to accommodate the multiple workstations is a problem with the current configuration of this space. The size of the bins is important. They need to be tall enough that food isn’t spilled on the floor and small enough that they don’t get too heavy with large amounts of waste or take up too much room in the café.
The building owner is fearful of a rat problem with the storage of food waste. Rodent-proof containers will have to be used to store the food waste in the dumpster area.
On October 12th 2006, EEFC General Manager Rob Baron and Produce Department Manger David Headings met with PRC representatives to discuss their interest in participating in a food waste collection and composting pilot program. Mr. Baron and Mr. Headings expressed great excitement for this possibility. Action to set up a food waste collection and composting pilot program has been taken, and representatives of PRC are assisting the EEFC in this process
4.2.4. Jewish Association On Aging A food waste audit was conducted at Jewish Association on Aging located in the Squirrel Hill area of Pittsburgh, on June 19th thru 21st, 2006. As part of the preliminary planning for the waste audit, several meetings were held with Guy McAlister, Director of Food and Nutrition for the JAA, his Assistant Director, and Mike Blackwell, Head Chef. A subsequent telephone conversation with Rick Drozynski, JAA Environmental Director, was completed to get the quantities of solid waste and the current associated costs. The kitchen at the JAA facility prepares approximately 1000 meals per day on a regular basis. More than half these kosher meals are distributed to Charles Morris Nursing and Rehabilitation Center residents on site, while other meals are prepared, packaged, and distributed to elders at home. Most kosher food is purchased prepackaged, already cut and cleaned, frozen and caned. As a result there is little pre-consumer food waste generated in the preparation of meals. Most usable foods that are not integrated into weekly meals at the JAA facility and any unused packaged meals are passed on to the Pittsburgh Community Food Bank. Food waste sources for the audit at the JAA focused on 7 work areas within the kitchen area including 2 dish washing rooms where post consumer food waste was collected from the nursing home residents’ returned trays. PRC supplied the bins for collecting the food waste. Kitchen staff currently dumps all pre and post consumer food waste together with paper, waxed cartons, cans, glass and plastic containers into plastic bags in large waste bins. The bagged materials are disposed of in a compactor at the loading dock outside the kitchen area. The compactor is pulled once a week. Currently there is no recycling program being implemented by the JAA.

Allegheny Food Waste Collection and Composting Feasibility Study 2006 November 8, 2006 Page 19 of 51
In preparation for the JAA kitchen audit, orientation and training was conducted on June 15th with 12 Food and Nutrition staff members. It was necessary to orient and train additional staff members, who were not available for the initial training, as part of the daily audit activities. Under these circumstances it was necessary to closely monitor and encourage sorting behavior, particularly with dishwashers, to keep contamination of food waste to a minimum. Signs identifying the ‘Green” and “Yellow” food types were placed on the wall and counters next to collection bins with corresponding green and yellow plastic bags in them. During the audit, one PRC staff member took responsibility for removing the bags of pre and post consumer food waste from collection bins at designated intervals, while a JAA Food and Nutrition staff person disposed of the other collected waste. Over the three-day period an average of 32.5 lbs per day of “green” food waste, and 351 lbs per day of “yellow” food waste were collected. Food waste levels are likely to rise during religious holidays when special foods are prepared. WHAT DID WE LEARN:
When food preparation involves mostly prepackaged frozen or canned foods, even when using large quantities, there is little “green” waste available for composting.
Long term workers (20 to 30 years) with the JAA Food and Nutrition staff were more willing than younger short term staff to separate the food waste and ask the PRC team member questions when they were unsure if the food waste was “green” or “yellow”.
Staff members responsible for clearing trays and scraping dishes were generally resistant to food waste collection because they believed it took too much time to separate the compostable from the non-compostable materials on the returned trays.
Shift schedules can impact formal training programs making additional oversight and the support materials displayed on walls and counters very important to effective sorting behavior and levels of contamination.
Staff members who have to make more dramatic changes to their standard operating behavior in order to accommodate the food waste sorting can offer creative ideas for improving the process as it affects them. Given more involvement with the process, staff members have more opportunity to help define effective ways to sort food waste. For example, a dishwasher who verbally expressed concern and irritation with the amount of time it took to sort the food and other materials on trays also suggested a procedure to make the separation less time consuming in response to a request for ideas from a Coalition team member.
4.2.5. Chatham College
A food waste audit was conducted at Anderson Dining Hall on Chatham College’s campus during the dates of April 3-5, 2006. Parkhurst Dining Service operates Anderson Dining Hall and Snack Bar. As part of the preliminary planning for the waste audit, Leslie Ekstrand,
Allegheny Food Waste Collection and Composting Feasibility Study 2006 November 8, 2006 Page 20 of 51
General Manager of Parkhurst Dining Service, and Robert Dubray, Director of Facilities Management, met with representatives of PRC on March 27th for a preliminary interview of the dining hall’s current waste handling practices. Currently, the food waste generated at Anderson Dining Hall is either flushed down a garbage disposal or sent to a landfill. Food waste generated through food preparation is bagged with other materials and placed in dumpsters that are emptied six days a week. Food material left on plates, as well as on serving dishes, is washed down a garbage disposal. A system to collect the food waste for the waste audit was designed during the initial interview. During the waste audit, all food waste from the prep areas would be gathered separately, bagged and weighed periodically throughout the day. After each meal food waste from the serving trays would be sent to the pot sink to be scraped into bags, weighed and then placed in the dumpsters. Food left over on plates would be scraped into a bin placed near the dish room window. None of the food would be sent to the garbage disposal during the three days of the audit. A training program was held on Tuesday, April 28th during the cafeteria staff’s lunch. The cafeteria staff members were first given a brief introduction to the project. They then participated in a variety of hands on activities designed to inform them of the food waste collection system and generate interest in the project. During the three-day waste audit a total of 991.5 pounds of food waste was collected. The food waste was separated into two categories: Green and Yellow. All vegetative food materials that can be composted in a windrow was placed in green bags and weighed separately. All other food material, including animal products, which can be composted in an in-vessel composter, was placed in yellow bags and weighed. An average of 140.8 lbs of “green” food waste and 188.7 lbs of “yellow” food waste was collected each day. One of the most positive outcomes of this food waste audit was an educational effort focused on waste reduction. Ekstrand encouraged the involvement of students from the Rachel Carson Institute in the waste audit. During each meal, a food waste collection bin was set up on a table by the dish room window. As students came to place their trays in the dish room, a volunteer from the Rachel Carson Institute asked each student to place all of their leftover food and paper products in the bin. Signs around the bin displayed the amount of food waste that had been collected during each meal. The educational effort resulted in a 10-12 pound reduction in food waste generated from the cafeteria each day of the waste audit. When asked about their interest in participating in a food waste collection and composting pilot program, Dubray and Ekstrand explained that Chatham is committed to incorporate environmentally sensitive practices within their operations. However, there are several concerns about collecting food waste for composting. First and foremost, is the potential to create odors and attract pests through the collection of food waste. Chatham is located in a beautiful park-like setting with residents that live in close proximity to the campus. Chatham takes every precaution to maintain good relations with their neighbors. With their current waste handling practices, at least half of the food waste that is generated is washed down a garbage disposal. Therefore, the amount of food waste entering their dumpsters is not significant at
Allegheny Food Waste Collection and Composting Feasibility Study 2006 November 8, 2006 Page 21 of 51
this time. Both Dubray and Ekstrand felt that food waste could not be store for more than a day and that they preferred to have it removed several times a day. Other concerns about participating in a food waste collection and composting program include the following:
Lack of space in the kitchen for extra bins specifically for food waste. Decreasing work efficiency Resistance from the staff
Both Ekstrand and Dubray felt that because the cost to operate a garbage disposal is nominal, they would not realize any cost savings by participating. However, they both acknowledged that Chatham’s commitment to environmentally-sensitive practices could initiate an interest in this program among the administration. WHAT DID WE LEARN:
Space issues for extra bins for the food waste are a significant obstacle for food waste composting. Not only were there space issues in the loading dock area, but also within the kitchen area.
The majority of the food waste came from the pot sink, where serving trays are scraped after each meal. This food waste typically is flushed down a garbage disposal.
The staff was receptive to the training and willing to participate as long as it did not create extra work for them. Separating food waste from the solid waste stream was considered “extra work” by staff. All staff interviewed felt that it cut down on work efficiency.
A garbage disposal is currently a very cost-effective means of disposing of food waste. It also removes the food waste immediately. Therefore, not only does Chatham dispose of large amounts of food waste for little cost, but they also do not have to worry about attracting pests to their dumpsters or creating odor problems. These factors serve as disincentives for participating in a food waste collection and composting project.
When students were informed of the amount of food waste they generate daily, they became more careful and conscious of throwing away leftovers. Bringing this issue to the student’s awareness was an effective educational tool for bringing about a change in disposal habits.
Allegheny Food Waste Collection and Composting Feasibility Study 2006 November 8, 2006 Page 22 of 51
4.2.6. Greater Pittsburgh Community Food Bank The Greater Pittsburgh Community Food Bank is a model for environmentally friendly business practices. The Food Bank operates from a LEED-certified facility, has an extensive recycling program, and is interested in diverting food waste from their waste stream by composting. On March 21, representatives met with and interviewed Gail Robbins, Director of Operations, for this study.
In late 2004 and early 2005 PRC conducted a feasibility study investigating the possibility of utilizing an in-vessel composting system to divert their food waste materials from their waste stream. A thorough review of their waste stream was conducted for that study. The GPCFB has granted their permission to utilize that information for this study. In the past the GPCFB has kept immaculate records of all materials in their waste and recycling streams, including most of the food waste. However, shortly after the in-vessel composting feasibility study was completed, the maintenance of their waste record began to wane due to staff turn over. Around that same time, the GPCFB underwent a significant reduction in the amount of food material they receive when one of their sources closed. According to Robbins, the change resulted in a 30% reduction to their waste stream. Therefore, past waste records were adjusted by a reduction of 30% for this study. The GPCFB has a very unique waste stream because the amount of material that is present in the waste stream can vary greatly from day to day. Although monthly averages are around 54 tons of solid waste a month, they can vary from 27.2 to 80.9 tons per month. The amount of food waste is also highly variable. For example during November 2002 the amount of food waste that was generated was 4.58 tons. During February 2005 the amount of food waste was 47.01 tons. This variability presents many challenges in setting up a hauling schedule for their food waste. WHAT DID WE LEARN?
The GPCFB’s volunteers already separate out food waste as they are packing orders.
There is tremendous support by the administration of GPCFB for the composting of their food waste.
The GPCFB has ample space for additional bins for food waste; however, they cannot store food waste for more than two or three days.
The high variability in daily and monthly amounts of food waste presents many challenges in setting up a cost-effective hauling
schedule for their food waste.
Allegheny Food Waste Collection and Composting Feasibility Study 2006 November 8, 2006 Page 23 of 51
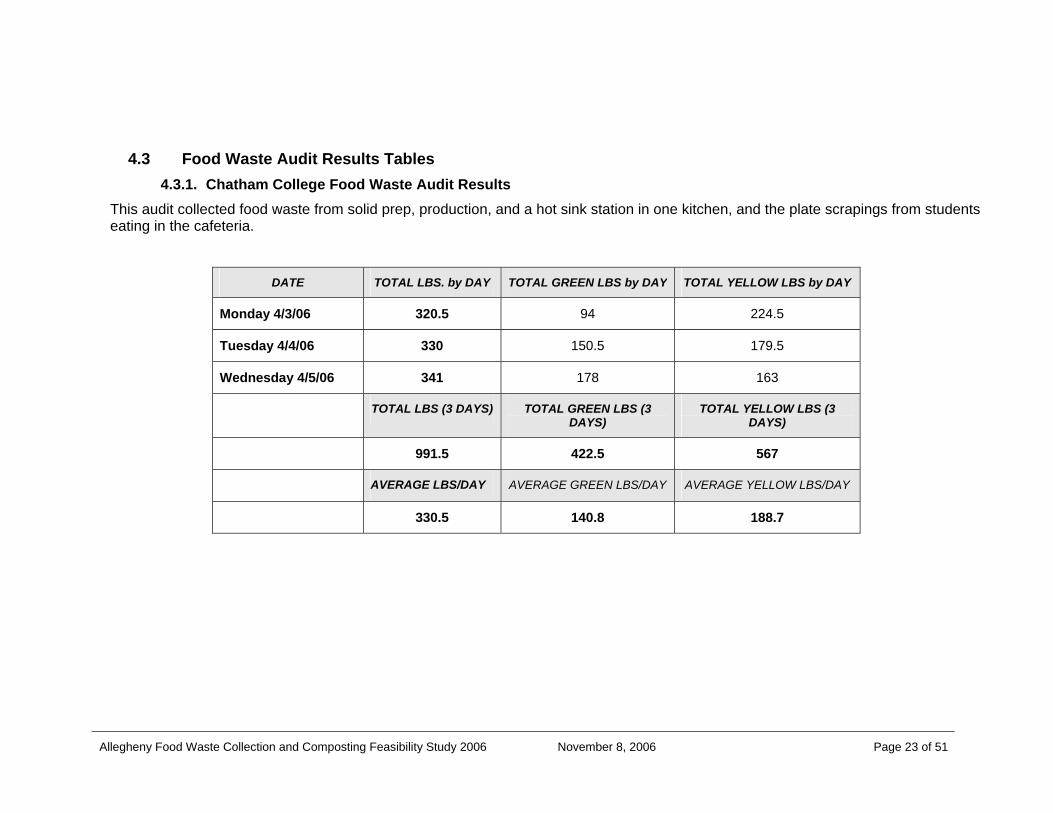
4.3 Food Waste Audit Results Tables 4.3.1. Chatham College Food Waste Audit Results
This audit collected food waste from solid prep, production, and a hot sink station in one kitchen, and the plate scrapings from students eating in the cafeteria.
DATE TOTAL LBS. by DAY TOTAL GREEN LBS by DAY TOTAL YELLOW LBS by DAY
Monday 4/3/06 320.5 94 224.5
Tuesday 4/4/06 330 150.5 179.5
Wednesday 4/5/06 341 178 163
TOTAL LBS (3 DAYS) TOTAL GREEN LBS (3 DAYS)
TOTAL YELLOW LBS (3 DAYS)
991.5 422.5 567
AVERAGE LBS/DAY AVERAGE GREEN LBS/DAY AVERAGE YELLOW LBS/DAY
330.5 140.8 188.7
Allegheny Food Waste Collection and Composting Feasibility Study 2006 November 8, 2006 Page 24 of 51
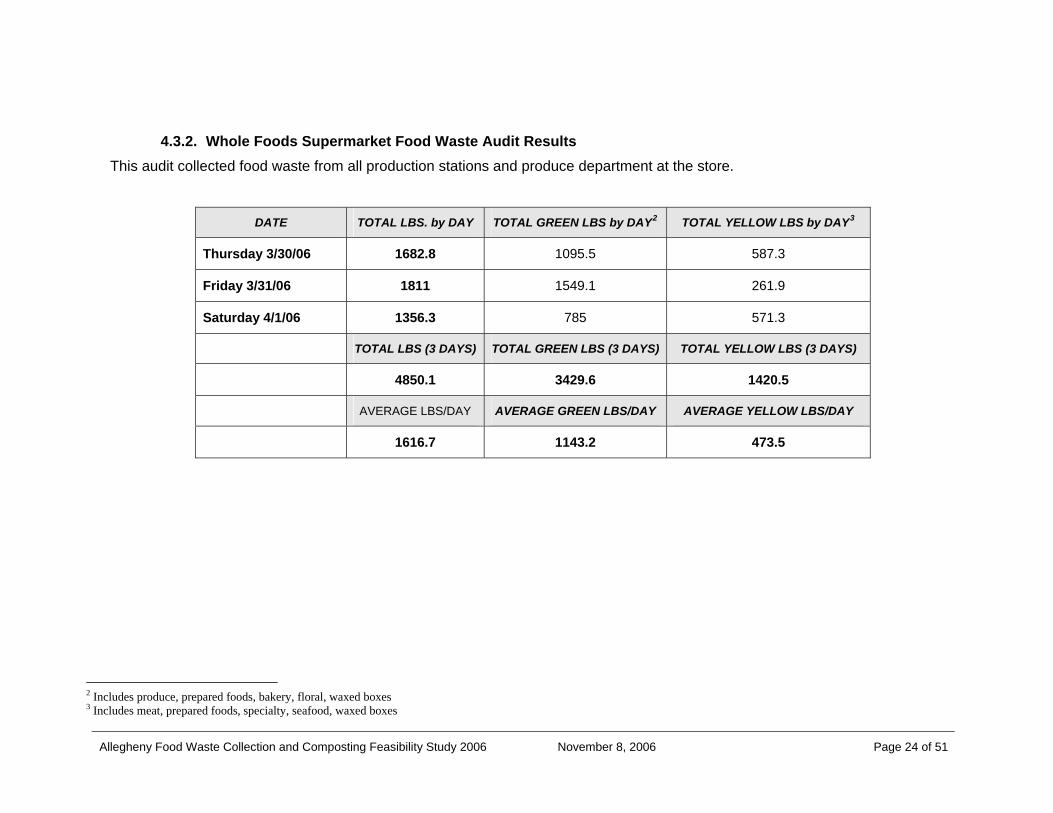
4.3.2. Whole Foods Supermarket Food Waste Audit Results This audit collected food waste from all production stations and produce department at the store.
DATE TOTAL LBS. by DAY TOTAL GREEN LBS by DAY2 TOTAL YELLOW LBS by DAY3
Thursday 3/30/06 1682.8 1095.5 587.3
Friday 3/31/06 1811 1549.1 261.9
Saturday 4/1/06 1356.3 785 571.3
TOTAL LBS (3 DAYS) TOTAL GREEN LBS (3 DAYS) TOTAL YELLOW LBS (3 DAYS)
4850.1 3429.6 1420.5
AVERAGE LBS/DAY AVERAGE GREEN LBS/DAY AVERAGE YELLOW LBS/DAY
1616.7 1143.2 473.5
2 Includes produce, prepared foods, bakery, floral, waxed boxes 3 Includes meat, prepared foods, specialty, seafood, waxed boxes

Allegheny Food Waste Collection and Composting Feasibility Study 2006 November 8, 2006 Page 25 of 51
4.3.3. East End Food Cooperative Supermarket Food Waste Audit Results This audit collected primarily green food waste matter from the store Café and produce department.
DATE TOTAL LBS. by DAY TOTAL GREEN LBS by DAY TOTAL YELLOW LBS by DAY4
Thursday 3/23/06 150.4 140.4 5 - 10
Friday 3/24/06 98.6 88.6 5 - 10
Saturday 3/25/06 202.4 192.4 5 - 10
TOTAL LBS (4 DAYS) TOTAL GREEN LBS (3 DAYS)
TOTAL YELLOW LBS (3 DAYS)
451.4 421.4 30
AVERAGE LBS/DAY AVERAGE GREEN LBS/DAY AVERAGE YELLOW LBS/DAY
150.5 140.5 10
4 Yellow food waste is a very small part of the Café operations and the daily lbs represent an approximate range. The largest number, 10, has been selected for the calculations.
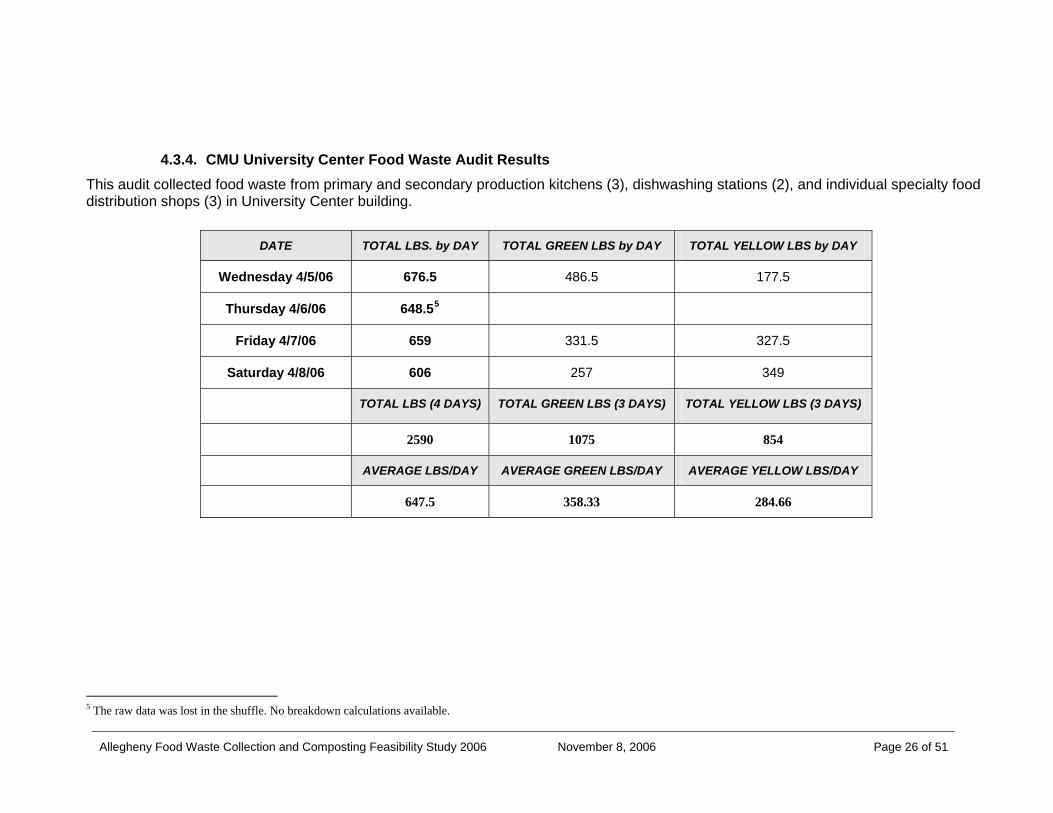
4.3.4. CMU University Center Food Waste Audit Results
This audit collected food waste from primary and secondary production kitchens (3), dishwashing stations (2), and individual specialty food distribution shops (3) in University Center building.
DATE TOTAL LBS. by DAY TOTAL GREEN LBS by DAY TOTAL YELLOW LBS by DAY
Wednesday 4/5/06 676.5 486.5 177.5
Thursday 4/6/06 648.55
Friday 4/7/06 659 331.5 327.5
Saturday 4/8/06 606 257 349
TOTAL LBS (4 DAYS) TOTAL GREEN LBS (3 DAYS) TOTAL YELLOW LBS (3 DAYS)
2590 1075 854
AVERAGE LBS/DAY AVERAGE GREEN LBS/DAY AVERAGE YELLOW LBS/DAY
647.5 358.33 284.66
Allegheny Food Waste Collection and Composting Feasibility Study 2006 November 8, 2006 Page 26 of 51
5 The raw data was lost in the shuffle. No breakdown calculations available.
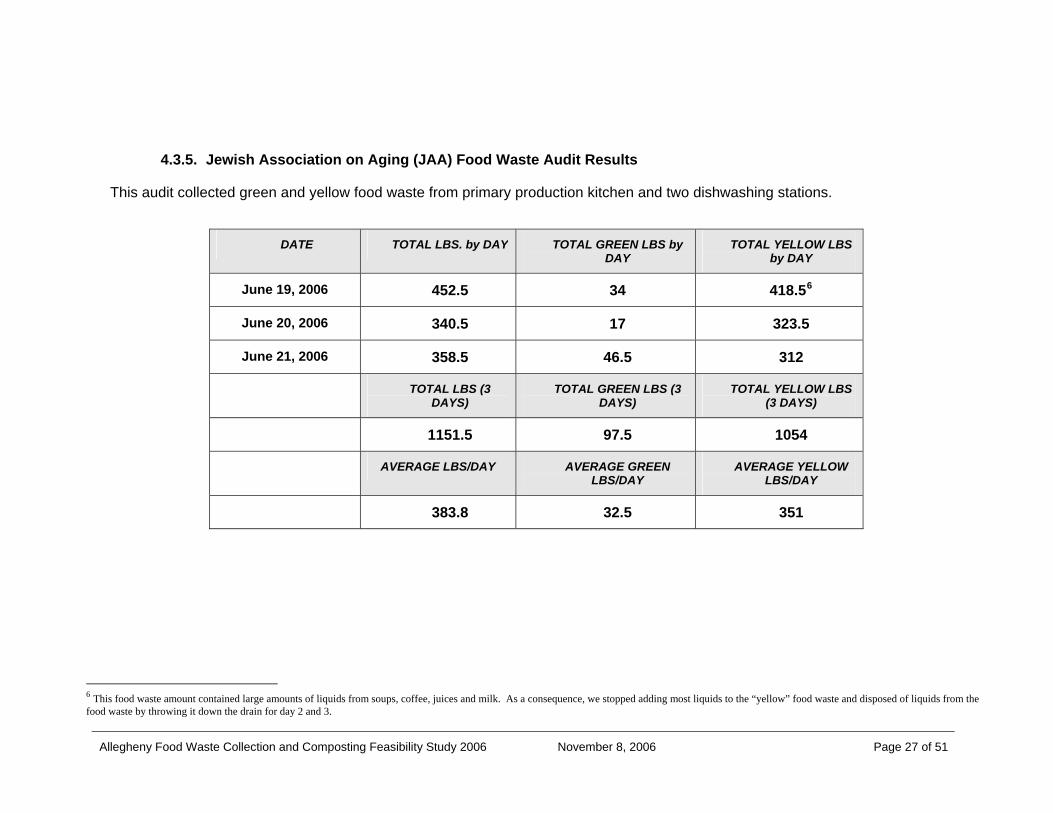
4.3.5. Jewish Association on Aging (JAA) Food Waste Audit Results
This audit collected green and yellow food waste from primary production kitchen and two dishwashing stations.
DATE TOTAL LBS. by DAY TOTAL GREEN LBS by DAY
TOTAL YELLOW LBS by DAY
June 19, 2006 452.5 34 418.56
June 20, 2006 340.5 17 323.5
June 21, 2006 358.5 46.5 312
TOTAL LBS (3 DAYS)
TOTAL GREEN LBS (3 DAYS)
TOTAL YELLOW LBS (3 DAYS)
1151.5 97.5 1054
AVERAGE LBS/DAY AVERAGE GREEN LBS/DAY
AVERAGE YELLOW LBS/DAY
383.8 32.5 351
Allegheny Food Waste Collection and Composting Feasibility Study 2006 November 8, 2006 Page 27 of 51
6 This food waste amount contained large amounts of liquids from soups, coffee, juices and milk. As a consequence, we stopped adding most liquids to the “yellow” food waste and disposed of liquids from the food waste by throwing it down the drain for day 2 and 3.
Allegheny Food Waste Collection and Composting Feasibility Study 2006 November 8, 2006 Page 28 of 51
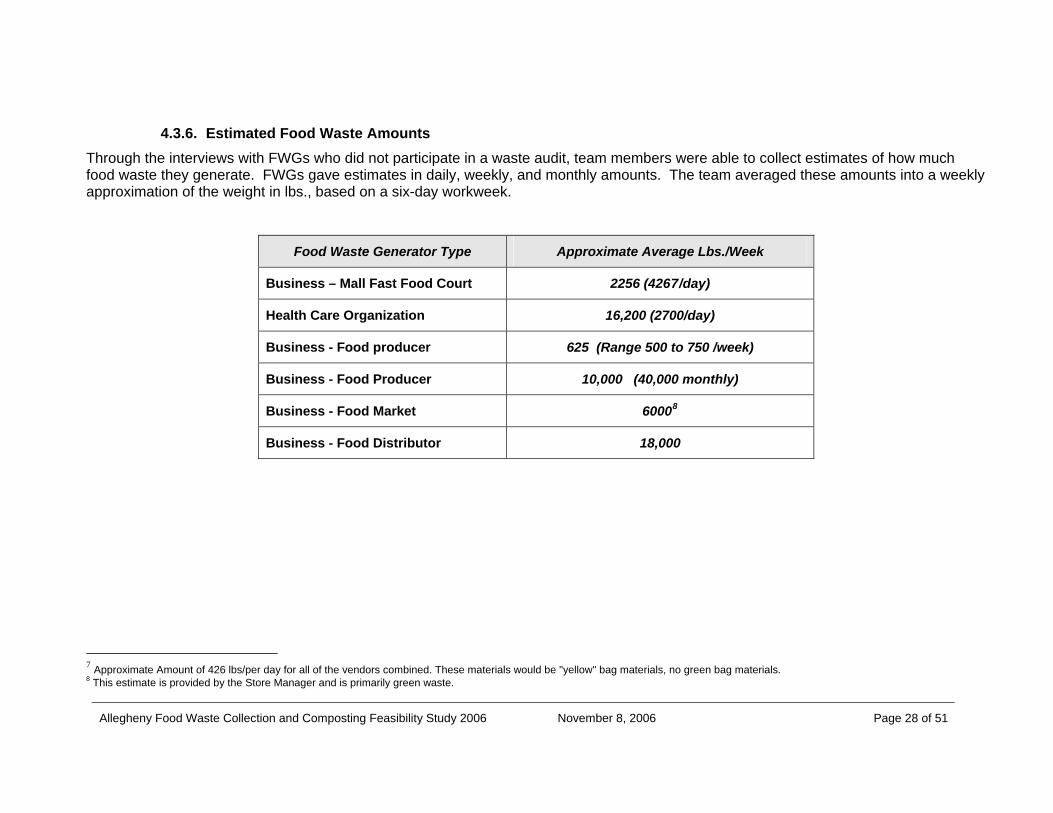
4.3.6. Estimated Food Waste Amounts Through the interviews with FWGs who did not participate in a waste audit, team members were able to collect estimates of how much food waste they generate. FWGs gave estimates in daily, weekly, and monthly amounts. The team averaged these amounts into a weekly approximation of the weight in lbs., based on a six-day workweek.
Food Waste Generator Type Approximate Average Lbs./Week
Business – Mall Fast Food Court 2256 (4267/day)
Health Care Organization 16,200 (2700/day)
Business - Food producer 625 (Range 500 to 750 /week)
Business - Food Producer 10,000 (40,000 monthly)
Business - Food Market 60008
Business - Food Distributor 18,000
7 Approximate Amount of 426 lbs/per day for all of the vendors combined. These materials would be "yellow" bag materials, no green bag materials. 8 This estimate is provided by the Store Manager and is primarily green waste.
Allegheny Food Waste Collection and Composting Feasibility Study 2006 November 8, 2006 Page 29 of 51
Task C: RESEARCH FOOD WASTE COLLECTION AND COMPOSTING SYSTEM OPTIONS AND COSTS
4.1 Precedent Study of Existing Food Waste Collection and Composting Operations
To begin examining the feasibility of implementing a food waste collection and composting operation in Allegheny County, it was important to look at successful examples of operations that have been successfully operating in different areas of the United States. Three operations were identified and a questionnaire developed to use as a basis for conducting phone interviews with managers for each of the composting facilities selected. They are:
Norcal Waste Systems Inc. in San Francisco, CA Eastern Organics Resources (EOR) in Wrightstown, NJ Rutland County Commercial Food Waste Composting Program in Rutland, VT
The three companies were identified through a query to the U.S. Composting Council and the review of two publications:
Profile of Northeast States Food Residuals Composting Projects: 1999 Update compiled by the Northeast Recycling Council
Recycling 222: On-Site Institutional Composting by JG Press, Inc. 2004.
Two of the companies are large-scale composters, with EOR and Norcal processing over 60,000 tons and 80,000 tons a year respectively. The Rutland County Program is a small-scale food waste composting program that processed approximately 2590 tons of food waste over the seven years it was in operation.
A representative from each of the three companies were interviewed on the following topics: size and geographic range of operation, types of food waste generators (FWG) served, types of food waste accepted, permitting requirements, their collection processes, processing systems at the composting facilities, staff training and economics.
The following sections provide a summary of each interview conducted for the precedent study.
Allegheny Food Waste Collection and Composting Feasibility Study 2006 November 8, 2006 Page 30 of 51
4.1.1. Norcal Waste Systems Inc. in San Francisco, CA
Of the companies reviewed Norcal, established 10 years ago, is the oldest. According to Chris Choate, Norcal’s Vice President of Sustainability, Norcal is the largest food waste composting facility in the country, processing over 80,000 tons of food waste annually. They serve a complete range of FWGs from small restaurants to large-scale food processors. They accept all types of food waste and utilize the Ag Bag system for in-vessel composting. The Ag-Bag, similar to the type of bags that are used on farms for silage, allows for much more flexibility in what can be composted, and greater volumes of food waste collected. Norcal both hauls and processes the food waste. They feel that this is in large part the reason for their success. By providing both services, they are able to maintain a high level of communication between the hauling and composting phases. This is particularly helpful in maintaining low contamination levels and a high level of customer satisfaction. Norcal’s food waste diversion program is unique in that it is currently subsidized by the City of San Francisco. The City has set up their waste handling rates so that all those that participate in this program receive a 25% decrease in waste handling costs for the amount of waste that is diverted. Therefore, the size or amount of food waste generated is not a prohibiting factor. Currently the overall recycling rate in the City of San Francisco is 67%. According to Choate, they have set the goal of 75% participation rate by 2010.
4.1.2. Eastern Organics Resources (EOR) in Wrightstown, NJ
EOR, established five years ago, handles food waste from100 large-scale FWGs including supermarkets and grocery stores, colleges and universities, food warehouses, food processors, repack centers and importers. Repack centers and importers that ship food from all over the world to ports in Philadelphia and New York are their largest customers. Although they service a much smaller number of FWGs than Norcal, they process over 60,000 tons of food waste annually. They target the largest food waste generators (FWG) in the region for economic reasons. EOR processes only pre-consumer food items including fruits, vegetables and bakery goods. They also accept floral, yard and wood waste, as well as waxed cardboard. They are currently planning on converting to an in-vessel composting system, and project that this change would allow them to increase their processing capacity by an additional 400 tons of material a day. EOR does not provide hauling services to their customers, but rather contracts with over ten different hauling companies in the region. When they find a food vendor, they contract with a hauler in the area. The food vendor is given one price for both processing and hauling. To handle contamination, the contract between EOR and the FWG specifies that only 1% of the material by weight can be made up of foreign materials. If there is a higher level of contamination, the material either gets shipped back or the FWG is charged a fee for land filling the material and fined to cover extra handling costs.
Allegheny Food Waste Collection and Composting Feasibility Study 2006 November 8, 2006 Page 31 of 51
Nelson Widell of EOR stressed that to ensure a cost-savings for the FWG, the route density must be high to reduce the cost of hauling. According to Widell, an average route density for supermarkets might be 10 supermarkets in a 20-mile radius. For this reason they do not actively recruit supermarkets. Widell also strongly felt that the minimum cost savings FWGs require to begin diverting food waste is a 25% reduction in waste handling costs. Because their FWGs are very large they are able to guarantee that level of cost savings.
4.1.3. Rutland County Commercial Food Waste Composting Program in Rutland, VT
The review of the Rutland County Commercial Food Waste Composting Program offered a variety of different insights to the precedent study. In contrast to the other facilities reviewed, this project was a small grassroots effort focused on diverting food waste from a variety of FWGs to an established, 400-acre cattle farm. The farm staff did much of the manual work involved in picking up and hauling the food waste. The effort was successful during its operation but was extremely labor intensive. According to Deane Wilson, of Rutland County Waste Reduction, the program was started in 1997 and ran through October 2004, when farm staff turnover forced its temporary suspension. The program started as a small project with three supermarkets diverting food waste to an on-farm composting facility. At its peak 15 FWG were participating, but during the last year there were two supermarkets and one produce distributor participating in the program. Rutland County provided both composting and hauling services to their FWGs. They found that by establishing a close relationship with the FWGs, they were better able to identify potential problems as they were setting up the program. Initially they targeted a very broad range of FWGs, but found the most economical benefit dealing with large generators such as supermarkets and produce warehouses. At the start of the project, they were also willing to accept all organics, but soon realized that culled produce from supermarkets and produce warehouses were the easiest to collect and manage, while bakery products were very problematic as they attracted a lot of wildlife. They were also able to run trials with food waste containing animal products from one supermarket. Contamination levels of the food waste were a persistent problem throughout the program. Rutland County did provide training and used signage to decrease contamination levels. However, the staff turnover rate at many of the FWGs was high; therefore, it was necessary to conduct repeated trainings. Despite their efforts the hauler would often have to separate out packaging as he was picking up the food waste.
The average waste handling fee, including hauling and processing costs, as well as taxes, in Rutland County is $100/ton. Rutland County was charging a total of $75/ton to haul and process the food waste. When advertising the program, they found that not only diversion rates, but also “green theme” company policies, were effective in promoting the program.
Allegheny Food Waste Collection and Composting Feasibility Study 2006 November 8, 2006 Page 32 of 51
4.1.4. Conclusion:
Although the three composting facilities differed greatly, their responses were similar in regards to certain topics. EOR and Norcal both stated that an in-vessel composting system allowed for an increased processing capacity and diversion rate. All facilities conducted a FWG staff training at the beginning of each new collection and composting program. All commented that contamination of food waste was a persistent problem, requiring vigilant monitoring. Each repeated staff training if contamination rates were significant. Also, despite the size differences, each of the three facilities tried to ensure a minimum of a 25% price reduction in waste disposal costs for the material that was diverted. Each also used or sold all of the compost produced each year. Finally, all felt that, as waste handling costs continue to increase, the rate of food waste composting across the nation would increase.
4.2 Economic Analysis The economic viability of a food waste collection and composting program for FWGs was proposed by the Food Waste Composting Coalition (FWCC) research team as part of the feasibility study for Allegheny County. To facilitate this investigation our research group obtained a financial modeling tool in an Excel spreadsheet called “Worksheet for Evaluating the Collection of Organics for the Commercial Sector” from Portland Metro, the regional solid waste agency for Portland, Oregon.9
The Portland Metro model can be used to determine changes in the weekly cost to the Food Waste Generator (FWG) when diverting food waste to a composting facility. The model can also be used to calculate what effect increased tipping fees would have on the total waste handling costs when the FWG was also participating in a food waste collection and composting program.
The Portland Metro model factors in a number of variables when determining changes in weekly costs. These variables include the following:
Tipping Fees: Hauler Costs: Amount And Composition Of Waste Stream:
Current landfill tipping fee Operating costs per hour for the hauler Total volume of waste stream Organics tipping fee Amount of time per pick up Density figures for food waste
Number of collections per week Density figures for waste materials excluding food waste Collection container costs Use of a compactor
9 Portland City economist, Neal Johnson, who provided much guidance and assistance in using the model for this study, developed the model in 2003.
Allegheny Food Waste Collection and Composting Feasibility Study 2006 November 8, 2006 Page 33 of 51
Current percentage of organics by weight in the waste stream
Projected percentage of the total organic waste stream that would be collected for composting
For purposes of the Allegheny County study, our research group utilized the Portland Metro model to analyze the effect that a number of specific variables have on the economic viability of a food waste collection and composting in this region. These variables include the following:
Number of pulls per week for both food waste and solid waste Use of compactor and its effect on density and number of pulls per week Percentages of waste stream that can be composted Effect of subsidizing hauling costs for a pilot project Increase in landfill tipping fees
Data from five of the FWGs interviewed for this study was used to study the economic viability of a regional food waste collection and composting program. The five FWGs included:
1. Wholesale Produce Industry of Pittsburgh (WPIP) 2. Whole Foods Market (WFM) 3. Greater Pittsburgh Community Food Bank (GPCFB) 4. Carnegie Mellon University Center (CMUC) 5. East End Food Coop. (EEFC)
These five FWGs are grouped into three classes of generators based on average weight of their daily solid waste and the percent of food waste in the total waste stream.
Large FWGs Wholesale Produce Industry of Pittsburgh (WPIP) and the Greater Pittsburgh Community Food Bank (GPCFB) generate an average of 1.75 to 3 tons of solid waste a day, and their food waste comprises between 75% and 80% of their waste stream.
Mid-size FWGs
Whole Foods Market (WFM), and Carnegie Mellon University Center (CMUC) generate on average 1 to 1.75 tons of solid waste a day and their food waste comprises between 17% and 47% of their total waste

Allegheny Food Waste Collection and Composting Feasibility Study 2006 November 8, 2006 Page 34 of 51
stream.
Small FWGs East End Food Coop (EEFC) generates on average 0.6 tons of solid waste a day and their food waste comprises 12 % of their waste stream.
Roll offs and/or compactors are used for solid waste storage at GPCFB, WFM, and CMUC. Waste from the EEFC is stored in an 8 yard dumpster, while waste from WPIP is separated into a number of containers on site so that all recyclables are diverted from the waste stream. The range in sizes allowed for the investigation of several different scenarios as possibilities for a pilot project based on the availability of local commercial resources that include processors, processor /haulers, and independent haulers to move the food waste into a composting process.
Regional farmer(s)could provide food waste hauling and composting services for small-scale FWGs.
A commercial composting facility could provide food waste hauling and composting services for mid-sized and large scale FWGs.
An independent hauler could provide food waste hauling to a composting facility for large-scale FWGs.
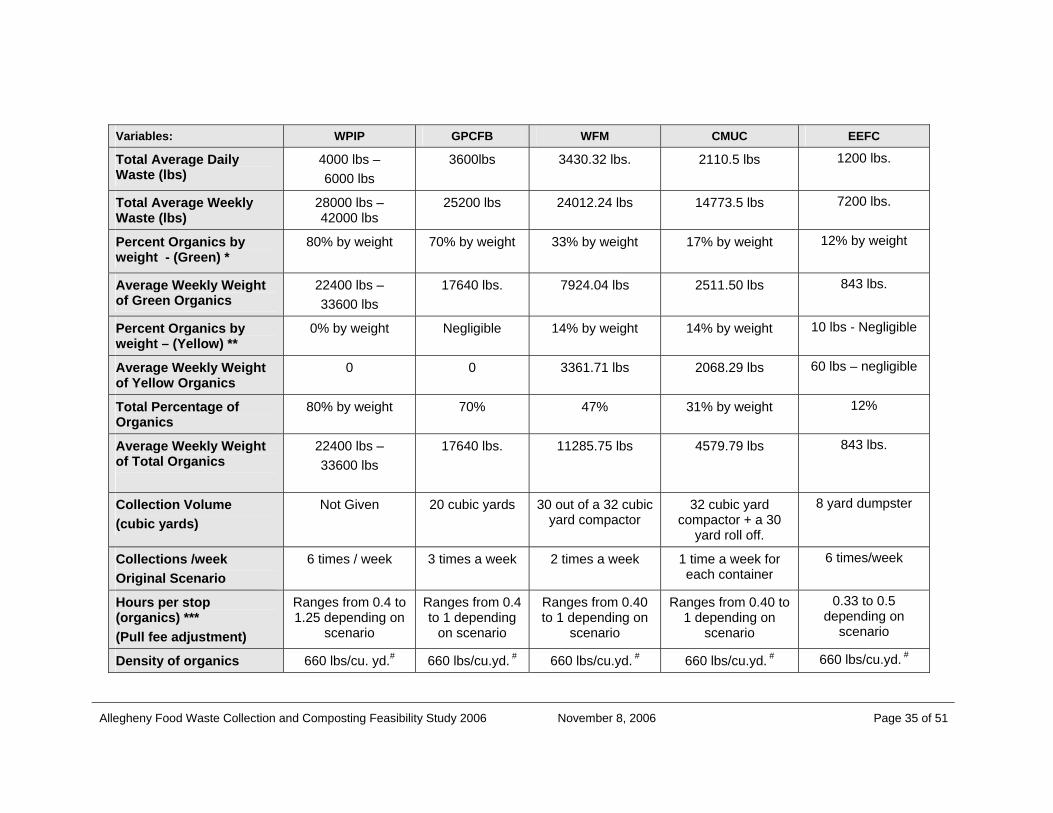
Data used for the economic analysis was gathered through interviews and waste audits at FWG sites. Some of the information used in the model is based on estimates given by the FWG, while other information is based on a review of waste handling bills, and the data gathered during the assessment and waste audits. This variable information is listed by Food Waste Generator (FWG) in Table 6a below.
Table 5a – Data Used to Analyze Economic Viability of a Food Waste Collection and Composting Project in Allegheny County, PA.
Variables: WPIP GPCFB WFM CMUC EEFC
Solid Waste Tip Fee
$30.00/ton (Estimated)
$28.12 $27.82/ton $26.39/ton $27.44/ ton ^
Organics Tip Fee $25.00/ ton**** $25.00**** $25.00**** $25.00**** $25.00 ****
Solid Waste Pull Fee
$139.11 ***** $134.98 $144.45 $132.61###### $21.42/pull^^
Allegheny Food Waste Collection and Composting Feasibility Study 2006 November 8, 2006 Page 35 of 51
Variables: WPIP GPCFB WFM CMUC EEFC
Total Average Daily Waste (lbs)
4000 lbs – 6000 lbs
3600lbs 3430.32 lbs. 2110.5 lbs 1200 lbs.
Total Average Weekly Waste (lbs)
28000 lbs – 42000 lbs
25200 lbs 24012.24 lbs 14773.5 lbs 7200 lbs.
Percent Organics by weight - (Green) *
80% by weight 70% by weight 33% by weight
17% by weight 12% by weight
Average Weekly Weight of Green Organics
22400 lbs – 33600 lbs
17640 lbs. 7924.04 lbs 2511.50 lbs
843 lbs.
Percent Organics by weight – (Yellow) **
0% by weight Negligible 14% by weight 14% by weight 10 lbs - Negligible
Average Weekly Weight of Yellow Organics
0 0 3361.71 lbs 2068.29 lbs 60 lbs – negligible
Total Percentage of Organics
80% by weight 70% 47% 31% by weight 12%
Average Weekly Weight of Total Organics
22400 lbs – 33600 lbs
17640 lbs. 11285.75 lbs 4579.79 lbs 843 lbs.
Collection Volume (cubic yards)
Not Given 20 cubic yards 30 out of a 32 cubic yard compactor
32 cubic yard compactor + a 30
yard roll off.
8 yard dumpster
Collections /week Original Scenario
6 times / week 3 times a week 2 times a week 1 time a week for each container
6 times/week
Hours per stop (organics) *** (Pull fee adjustment)
Ranges from 0.4 to 1.25 depending on
scenario
Ranges from 0.4 to 1 depending
on scenario
Ranges from 0.40 to 1 depending on
scenario
Ranges from 0.40 to 1 depending on
scenario
0.33 to 0.5 depending on
scenario
Density of organics 660 lbs/cu. yd.# 660 lbs/cu.yd. # 660 lbs/cu.yd. # 660 lbs/cu.yd. # 660 lbs/cu.yd. #
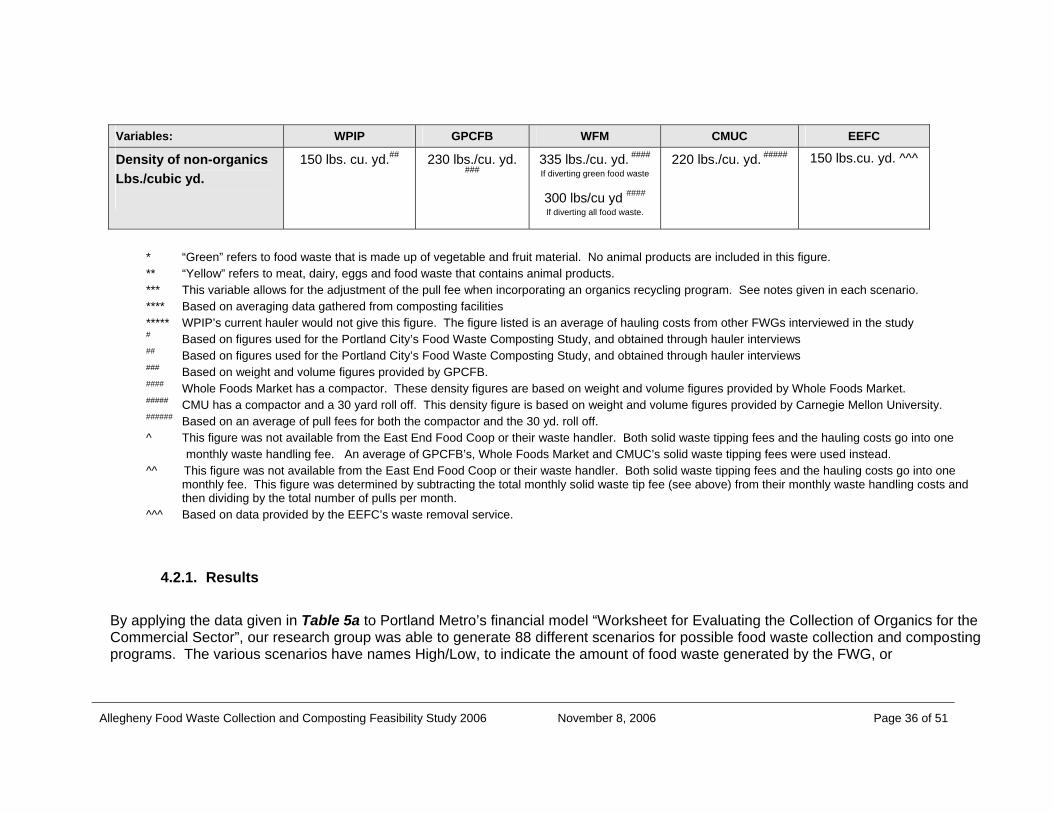
Allegheny Food Waste Collection and Composting Feasibility Study 2006 November 8, 2006 Page 36 of 51
Variables: WPIP GPCFB WFM CMUC EEFC
Density of non-organics Lbs./cubic yd.
150 lbs. cu. yd.## 230 lbs./cu. yd. ###
335 lbs./cu. yd. ####
If diverting green food waste
300 lbs/cu yd ####
If diverting all food waste.
220 lbs./cu. yd. #####
150 lbs.cu. yd. ^^^
* “Green” refers to food waste that is made up of vegetable and fruit material. No animal products are included in this figure. ** “Yellow” refers to meat, dairy, eggs and food waste that contains animal products. *** This variable allows for the adjustment of the pull fee when incorporating an organics recycling program. See notes given in each scenario. **** Based on averaging data gathered from composting facilities ***** WPIP’s current hauler would not give this figure. The figure listed is an average of hauling costs from other FWGs interviewed in the study # Based on figures used for the Portland City’s Food Waste Composting Study, and obtained through hauler interviews ## Based on figures used for the Portland City’s Food Waste Composting Study, and obtained through hauler interviews ### Based on weight and volume figures provided by GPCFB. #### Whole Foods Market has a compactor. These density figures are based on weight and volume figures provided by Whole Foods Market. ##### CMU has a compactor and a 30 yard roll off. This density figure is based on weight and volume figures provided by Carnegie Mellon University. ###### Based on an average of pull fees for both the compactor and the 30 yd. roll off. ^ This figure was not available from the East End Food Coop or their waste handler. Both solid waste tipping fees and the hauling costs go into one monthly waste handling fee. An average of GPCFB’s, Whole Foods Market and CMUC’s solid waste tipping fees were used instead. ^^ This figure was not available from the East End Food Coop or their waste handler. Both solid waste tipping fees and the hauling costs go into one
monthly fee. This figure was determined by subtracting the total monthly solid waste tip fee (see above) from their monthly waste handling costs and then dividing by the total number of pulls per month.
^^^ Based on data provided by the EEFC’s waste removal service.
4.2.1. Results
By applying the data given in Table 5a to Portland Metro’s financial model “Worksheet for Evaluating the Collection of Organics for the Commercial Sector”, our research group was able to generate 88 different scenarios for possible food waste collection and composting programs. The various scenarios have names High/Low, to indicate the amount of food waste generated by the FWG, or

Allegheny Food Waste Collection and Composting Feasibility Study 2006 November 8, 2006 Page 37 of 51
Green/Yellow10 to indicate the type of food waste being collected for composting. The objective for the modeling was to determine how the following variables would impact the economic viability of a food waste collection and composting program for this region.
Size of Food Waste Generator Number of pulls per week for both food waste and solid waste Use of compactor and its affect on density and number of pulls per week Percentages of waste stream that can be composted Location of the composting facility in relation to the landfill Effect of subsidizing hauling costs for a pilot project Windrow Composting vs. Invessel Composting
The results are shown using the following Tables: 5b, 5c, 5d, 5e, and 5f. One table, containing multiple scenarios, was created for each of the five FWGs selected for this analysis. A description of each scenario is given in the table as well as the scenarios resulting effect on current weekly waste handling costs. The following assumptions apply to each scenario:
• The current solid waste pull fee has been applied as the organics pull fees to calculate the value for “Effect on current weekly waste costs without Subsidy” (column 13).
• Calculations for the “Effect on current weekly waste costs with 60% subsidy” (column 14) are based on the assumption that grant funding would cover capital costs for hauling equipment, resulting in a 60% reduction in hauling costs. Data used to derive this reduction is based on processor interviews.
The following color code was used to highlight those scenarios that resulted in a cost savings:
All scenarios resulting in a 0.1 – 10% cost savings were highlighted in yellow. All scenarios resulting in a cost savings of 11-20% were highlighted in orange. All scenarios resulting in a cost savings of +20% were highlighted in red.
10 “Green” refers to food waste that is made up of vegetable and fruit material. No animal products are included in this figure. “Yellow” refers to meat, dairy, eggs and food waste that contains animal products.
Allegheny Food Waste Collection and Composting Feasibility Study 2006 November 8, 2006 Page 38 of 51
The research group also looked at the effect that increasing land fill tipping fees would have on the total waste handling costs when the FWG was also participating in a food waste collection and composting program. Scenarios without subsidies, already developed for the five FWGs included in the analysis, were selected for this calculation. The selected scenarios are highlighted in green on Tables 5b through 5f. Table 5g displays the results of this additional analysis. Seven new scenarios were calculated using the Portland Metro financial model. In these scenarios the tipping fee was increased for each FWG to the point where it became more cost effective for the FWG to separate organics than to land fill all their solid waste. Column nine in Table 5g, “Increased Amount Over Current SW Tipping Fees (per ton)”, identifies the dollar increase in the tipping fee, over the current costs, required before different sized FWGs, would expect to see a reduction in their solid waste collection costs.
The financial model used for each scenario can be found in Appendix V: FWG Economic Scenarios Data Analysis Models. These models are listed in Appendix V by FWG name and classified into three groups: (1) “No capital subsidy” (2) “With capital subsidy” and (3) “Increased Tipping Fee”. Additionally a compact disk containing the financial models is included with the written report. The electronic versions of the financial models presented in Appendix V. display the comments for a number of variables used in the analyses and provide more information on how each scenario was set up.
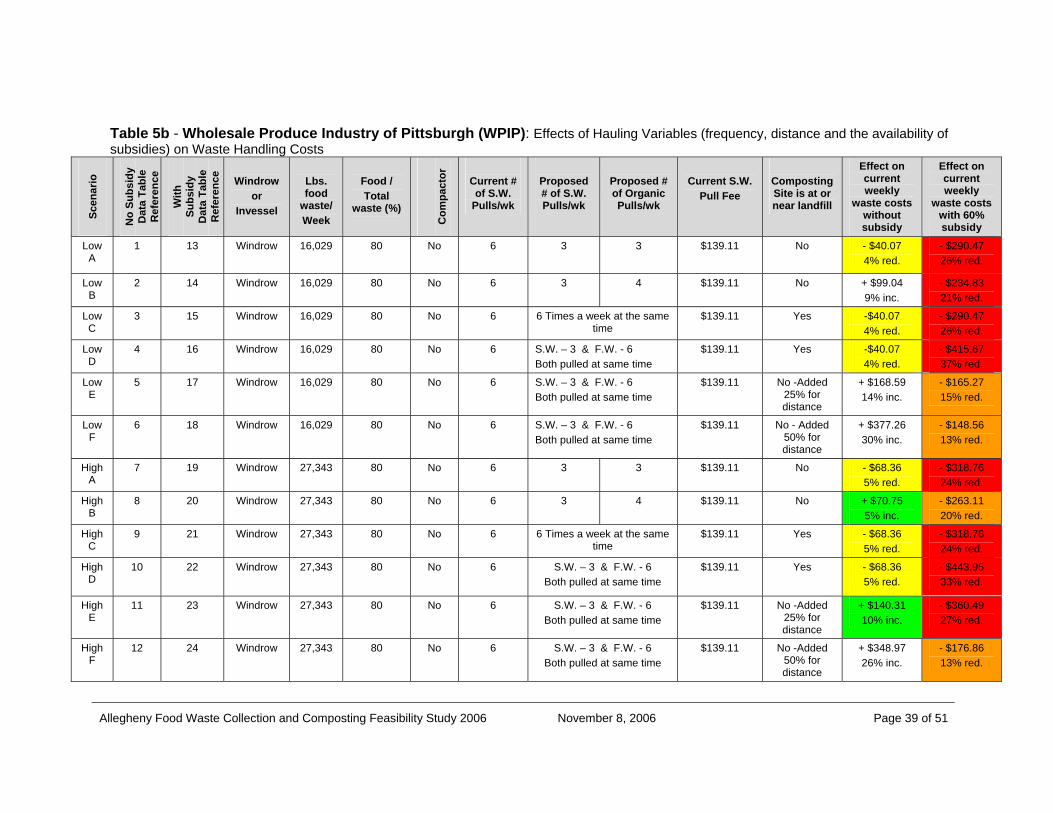
Allegheny Food Waste Collection and Composting Feasibility Study 2006 November 8, 2006 Page 39 of 51
Table 5b - Wholesale Produce Industry of Pittsburgh (WPIP): Effects of Hauling Variables (frequency, distance and the availability of subsidies) on Waste Handling Costs
Scen
ario
No
Subs
idy
Dat
a Ta
ble
Ref
eren
ce
With
Su
bsid
y D
ata
Tabl
e R
efer
ence
Windrow
or Invessel
Lbs. food
waste/ Week
Food / Total
waste (%)
C
ompa
ctor
Current # of S.W.
Pulls/wk
Proposed # of S.W. Pulls/wk
Proposed # of Organic Pulls/wk
Current S.W.
Pull Fee
Composting Site is at or near landfill
Effect on current weekly
waste costs without subsidy
Effect on current weekly
waste costs with 60% subsidy
Low A
1 13 Windrow 16,029 80 No 6 3 3 $139.11 No - $40.07 4% red.
- $290.47 26% red.
Low B
2 14 Windrow 16,029 80 No 6 3 4 $139.11 No + $99.04 9% inc.
- $234.83 21% red.
Low C
3 15 Windrow 16,029 80 No 6 6 Times a week at the same time
$139.11 Yes -$40.07 4% red.
- $290.47 26% red.
Low D
4 16 Windrow
16,029 80 No 6 S.W. – 3 & F.W. - 6 Both pulled at same time
$139.11 Yes -$40.07 4% red.
- $415.67 37% red.
Low E
5 17 Windrow
16,029 80 No 6 S.W. – 3 & F.W. - 6 Both pulled at same time
$139.11 No -Added 25% for distance
+ $168.59 14% inc.
- $165.27 15% red.
Low F
6 18 Windrow
16,029 80 No 6 S.W. – 3 & F.W. - 6 Both pulled at same time
$139.11 No - Added 50% for distance
+ $377.26 30% inc.
- $148.56 13% red.
High A
7 19 Windrow
27,343 80 No 6 3 3 $139.11 No - $68.36 5% red.
- $318.76 24% red.
High B
8 20 Windrow
27,343 80 No 6 3 4 $139.11 No + $70.75 5% inc.
- $263.11 20% red.
High C
9 21 Windrow
27,343 80 No 6 6 Times a week at the same time
$139.11 Yes - $68.36 5% red.
- $318.76 24% red.
High D
10 22 Windrow
27,343 80 No 6 S.W. – 3 & F.W. - 6 Both pulled at same time
$139.11 Yes - $68.36 5% red.
- $443.95 33% red.
High E
11 23 Windrow
27,343 80 No 6 S.W. – 3 & F.W. - 6 Both pulled at same time
$139.11 No -Added 25% for distance
+ $140.31 10% inc.
- $360.49 27% red.
High F
12 24 Windrow
27,343 80 No 6 S.W. – 3 & F.W. - 6 Both pulled at same time
$139.11 No -Added 50% for distance
+ $348.97 26% inc.
- $176.86 13% red.
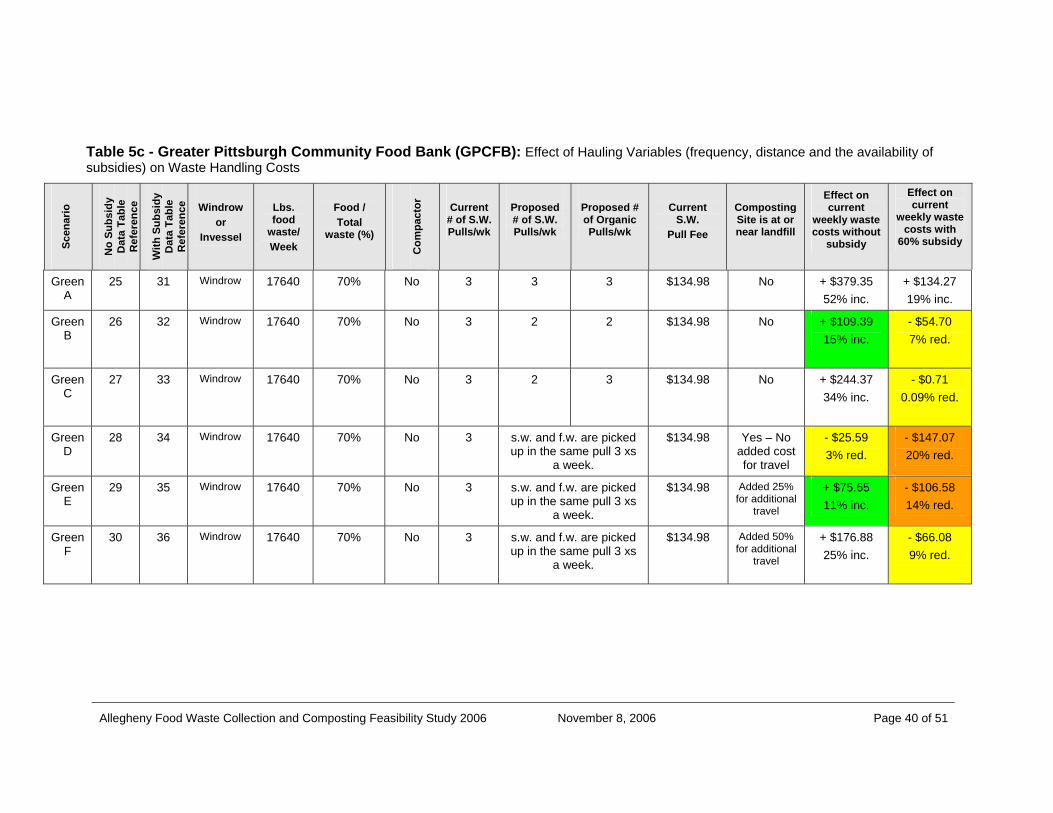
Allegheny Food Waste Collection and Composting Feasibility Study 2006 November 8, 2006 Page 40 of 51
Table 5c - Greater Pittsburgh Community Food Bank (GPCFB): Effect of Hauling Variables (frequency, distance and the availability of subsidies) on Waste Handling Costs
Scen
ario
No
Subs
idy
Dat
a Ta
ble
Ref
eren
ce
With
Sub
sidy
D
ata
Tabl
e R
efer
ence
Windrow
or Invessel
Lbs. food
waste/ Week
Food / Total
waste (%)
C
ompa
ctor
Current
# of S.W. Pulls/wk
Proposed # of S.W. Pulls/wk
Proposed # of Organic Pulls/wk
Current
S.W. Pull Fee
Composting Site is at or near landfill
Effect on current
weekly waste costs without
subsidy
Effect on current
weekly waste costs with
60% subsidy
Green A
25 31 Windrow 17640 70% No 3 3
3 $134.98 No + $379.35 52% inc.
+ $134.27 19% inc.
Green B
26 32 Windrow 17640 70% No 3 2
2 $134.98 No + $109.39 15% inc.
- $54.70 7% red.
Green C
27 33 Windrow 17640 70% No 3 2
3 $134.98 No + $244.37 34% inc.
- $0.71 0.09% red.
Green D
28 34 Windrow 17640 70% No 3 s.w. and f.w. are picked up in the same pull 3 xs
a week.
$134.98 Yes – No added cost for travel
- $25.59 3% red.
- $147.07 20% red.
Green E
29 35 Windrow 17640 70% No 3 s.w. and f.w. are picked up in the same pull 3 xs
a week.
$134.98 Added 25% for additional
travel
+ $75.65 11% inc.
- $106.58 14% red.
Green F
30 36 Windrow 17640 70% No 3 s.w. and f.w. are picked up in the same pull 3 xs
a week.
$134.98 Added 50% for additional
travel
+ $176.88 25% inc.
- $66.08 9% red.
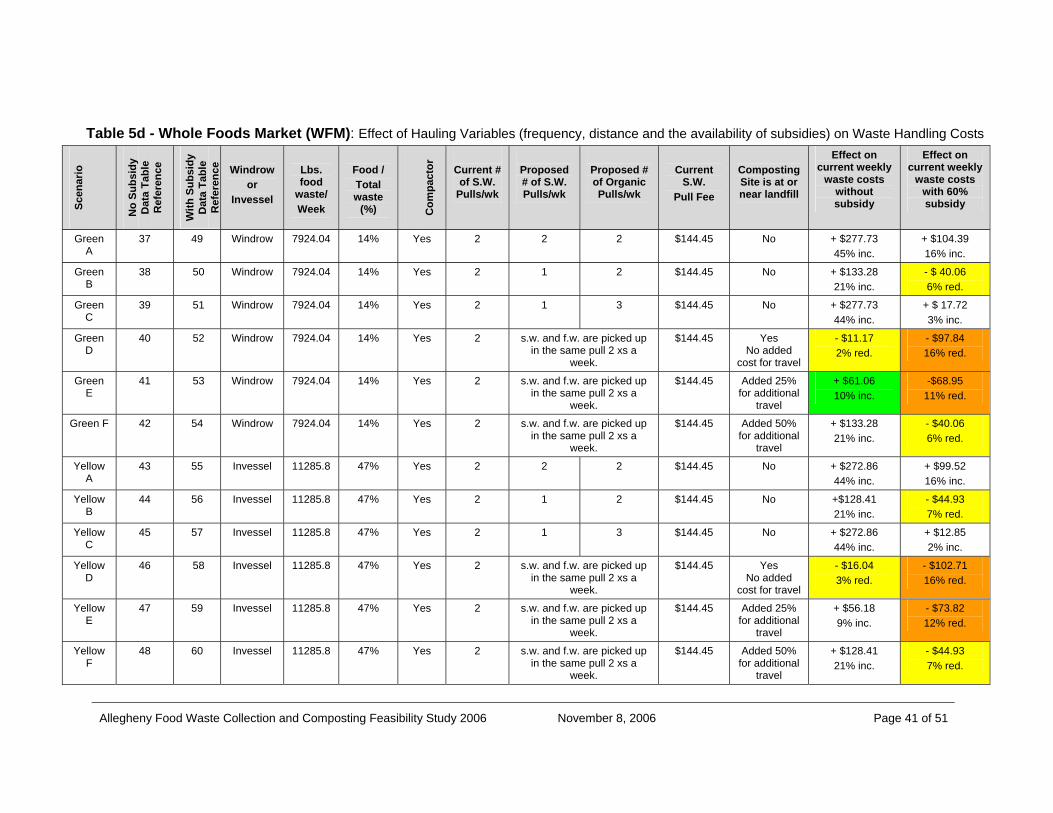
Allegheny Food Waste Collection and Composting Feasibility Study 2006 November 8, 2006 Page 41 of 51
Table 5d - Whole Foods Market (WFM): Effect of Hauling Variables (frequency, distance and the availability of subsidies) on Waste Handling Costs
Scen
ario
No
Subs
idy
Dat
a Ta
ble
Ref
eren
ce
With
Sub
sidy
D
ata
Tabl
e R
efer
ence
Windrow
or Invessel
Lbs. food
waste/ Week
Food / Total waste
(%)
C
ompa
ctor
Current # of S.W.
Pulls/wk
Proposed # of S.W. Pulls/wk
Proposed # of Organic Pulls/wk
Current
S.W. Pull Fee
Composting Site is at or near landfill
Effect on current weekly
waste costs without subsidy
Effect on current weekly
waste costs with 60% subsidy
Green A
37 49 Windrow 7924.04 14% Yes 2 2 2 $144.45 No + $277.73 45% inc.
+ $104.39 16% inc.
Green B
38 50 Windrow 7924.04 14% Yes 2 1 2 $144.45 No + $133.28 21% inc.
- $ 40.06 6% red.
Green C
39 51 Windrow 7924.04 14% Yes 2 1 3 $144.45 No + $277.73 44% inc.
+ $ 17.72 3% inc.
Green D
40 52 Windrow 7924.04 14% Yes 2 s.w. and f.w. are picked up in the same pull 2 xs a
week.
$144.45 Yes No added
cost for travel
- $11.17 2% red.
- $97.84 16% red.
Green E
41 53 Windrow 7924.04 14% Yes 2 s.w. and f.w. are picked up in the same pull 2 xs a
week.
$144.45 Added 25% for additional
travel
+ $61.06 10% inc.
-$68.95 11% red.
Green F 42 54 Windrow 7924.04 14% Yes 2 s.w. and f.w. are picked up in the same pull 2 xs a
week.
$144.45 Added 50% for additional
travel
+ $133.28 21% inc.
- $40.06 6% red.
Yellow A
43 55 Invessel 11285.8 47% Yes 2 2 2 $144.45 No + $272.86 44% inc.
+ $99.52 16% inc.
Yellow B
44 56 Invessel 11285.8 47% Yes 2 1 2 $144.45 No +$128.41 21% inc.
- $44.93 7% red.
Yellow C
45 57 Invessel 11285.8 47% Yes 2 1 3 $144.45 No + $272.86 44% inc.
+ $12.85 2% inc.
Yellow D
46 58 Invessel 11285.8 47% Yes 2 s.w. and f.w. are picked up in the same pull 2 xs a
week.
$144.45 Yes No added
cost for travel
- $16.04 3% red.
- $102.71 16% red.
Yellow E
47 59 Invessel 11285.8 47% Yes 2 s.w. and f.w. are picked up in the same pull 2 xs a
week.
$144.45 Added 25% for additional
travel
+ $56.18 9% inc.
- $73.82 12% red.
Yellow F
48 60 Invessel 11285.8 47% Yes 2 s.w. and f.w. are picked up in the same pull 2 xs a
week.
$144.45 Added 50% for additional
travel
+ $128.41 21% inc.
- $44.93 7% red.
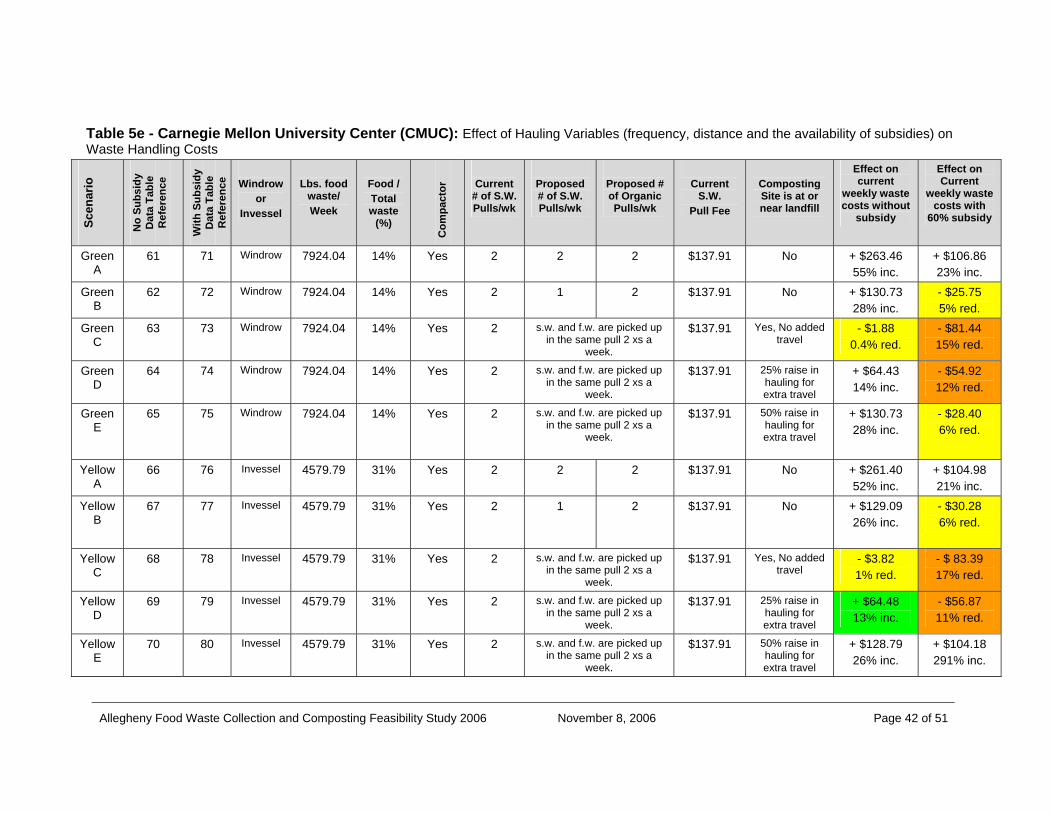
Allegheny Food Waste Collection and Composting Feasibility Study 2006 November 8, 2006 Page 42 of 51
Table 5e - Carnegie Mellon University Center (CMUC): Effect of Hauling Variables (frequency, distance and the availability of subsidies) on Waste Handling Costs
Scen
ario
No
Subs
idy
Dat
a Ta
ble
Ref
eren
ce
With
Sub
sidy
D
ata
Tabl
e R
efer
ence
Windrow
or Invessel
Lbs. food
waste/ Week
Food / Total waste
(%)
C
ompa
ctor
Current
# of S.W. Pulls/wk
Proposed # of S.W. Pulls/wk
Proposed # of Organic Pulls/wk
Current
S.W. Pull Fee
Composting Site is at or near landfill
Effect on current
weekly waste costs without
subsidy
Effect on Current
weekly waste costs with
60% subsidy
Green A
61 71 Windrow 7924.04 14% Yes 2 2 2 $137.91 No + $263.46 55% inc.
+ $106.86 23% inc.
Green B
62 72 Windrow 7924.04 14% Yes 2 1 2 $137.91 No + $130.73 28% inc.
- $25.75 5% red.
Green C
63 73 Windrow 7924.04 14% Yes 2 s.w. and f.w. are picked up in the same pull 2 xs a
week.
$137.91 Yes, No added travel
- $1.88 0.4% red.
- $81.44 15% red.
Green D
64 74 Windrow
7924.04 14% Yes 2 s.w. and f.w. are picked up in the same pull 2 xs a
week.
$137.91 25% raise in hauling for extra travel
+ $64.43 14% inc.
- $54.92 12% red.
Green E
65 75 Windrow 7924.04 14% Yes 2 s.w. and f.w. are picked up in the same pull 2 xs a
week.
$137.91 50% raise in hauling for extra travel
+ $130.73 28% inc.
- $28.40 6% red.
Yellow A
66 76 Invessel 4579.79 31% Yes 2
2 2 $137.91 No + $261.40 52% inc.
+ $104.98 21% inc.
Yellow B
67 77 Invessel 4579.79 31% Yes 2
1 2 $137.91 No + $129.09 26% inc.
- $30.28 6% red.
Yellow C
68 78 Invessel 4579.79 31% Yes 2 s.w. and f.w. are picked up in the same pull 2 xs a
week.
$137.91 Yes, No added travel
- $3.82 1% red.
- $ 83.39 17% red.
Yellow D
69 79 Invessel 4579.79 31% Yes 2 s.w. and f.w. are picked up in the same pull 2 xs a
week.
$137.91 25% raise in hauling for extra travel
+ $64.48 13% inc.
- $56.87 11% red.
Yellow E
70 80 Invessel 4579.79 31% Yes 2 s.w. and f.w. are picked up in the same pull 2 xs a
week.
$137.91 50% raise in hauling for extra travel
+ $128.79 26% inc.
+ $104.18 291% inc.
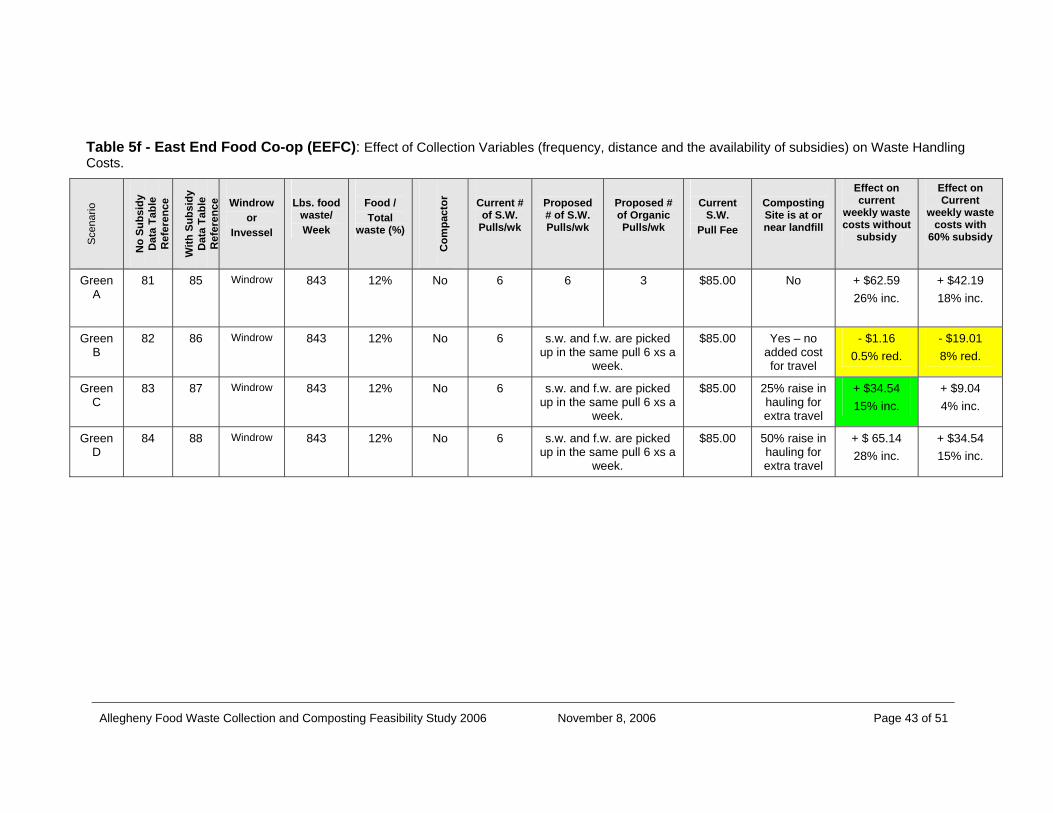
Allegheny Food Waste Collection and Composting Feasibility Study 2006 November 8, 2006 Page 43 of 51
Table 5f - East End Food Co-op (EEFC): Effect of Collection Variables (frequency, distance and the availability of subsidies) on Waste Handling Costs.
Sce
nario
No
Subs
idy
Dat
a Ta
ble
Ref
eren
ce
With
Sub
sidy
D
ata
Tabl
e R
efer
ence
Windrow
or Invessel
Lbs. food
waste/ Week
Food / Total
waste (%)
C
ompa
ctor
Current # of S.W.
Pulls/wk
Proposed # of S.W. Pulls/wk
Proposed # of Organic Pulls/wk
Current
S.W. Pull Fee
Composting Site is at or near landfill
Effect on current
weekly waste costs without
subsidy
Effect on Current
weekly waste costs with
60% subsidy
Green A
81 85 Windrow 843 12% No 6 6
3 $85.00 No + $62.59 26% inc.
+ $42.19 18% inc.
Green B
82 86 Windrow 843 12% No 6 s.w. and f.w. are picked up in the same pull 6 xs a
week.
$85.00 Yes – no added cost for travel
- $1.16 0.5% red.
- $19.01 8% red.
Green C
83 87 Windrow 843 12% No 6 s.w. and f.w. are picked up in the same pull 6 xs a
week.
$85.00 25% raise in hauling for extra travel
+ $34.54 15% inc.
+ $9.04 4% inc.
Green D
84 88 Windrow 843 12% No 6 s.w. and f.w. are picked up in the same pull 6 xs a
week.
$85.00 50% raise in hauling for extra travel
+ $ 65.14 28% inc.
+ $34.54 15% inc.
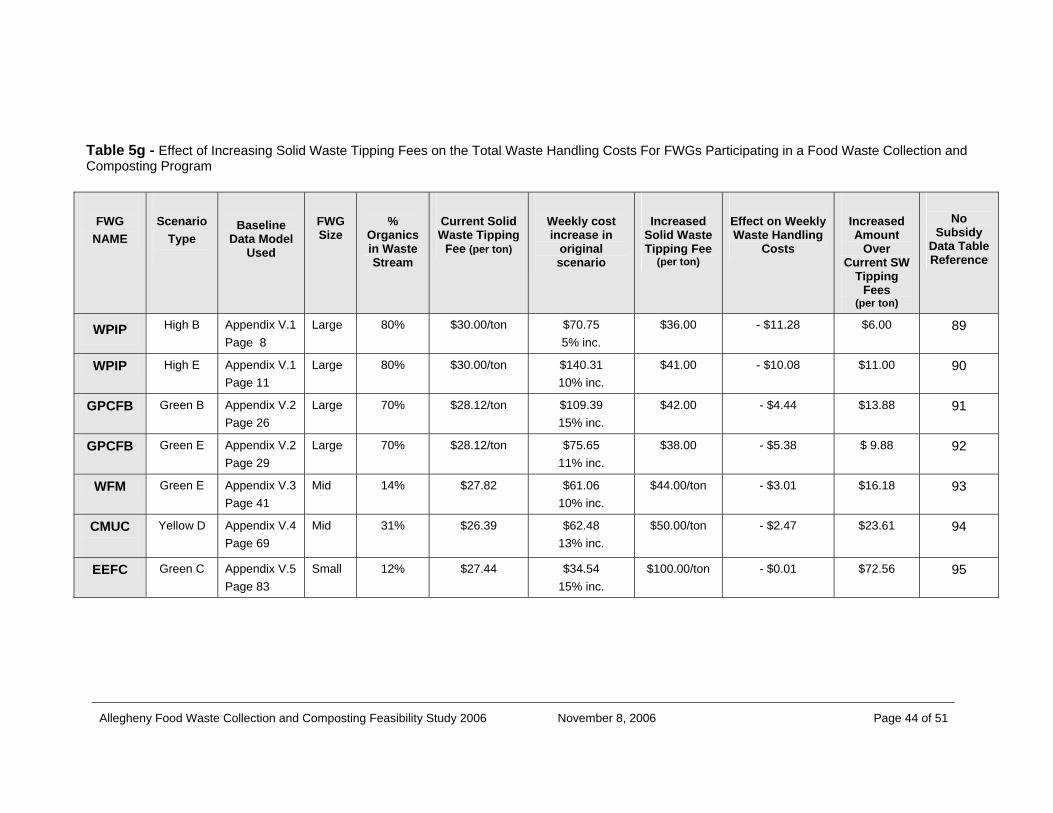
Allegheny Food Waste Collection and Composting Feasibility Study 2006 November 8, 2006 Page 44 of 51
Table 5g - Effect of Increasing Solid Waste Tipping Fees on the Total Waste Handling Costs For FWGs Participating in a Food Waste Collection and Composting Program
FWG
NAME
Scenario
Type
Baseline Data Model
Used
FWG Size
%
Organics in Waste Stream
Current Solid Waste Tipping
Fee (per ton)
Weekly cost increase in
original scenario
Increased
Solid Waste Tipping Fee
(per ton)
Effect on Weekly Waste Handling
Costs
Increased Amount
Over Current SW
Tipping Fees
(per ton)
No
Subsidy Data Table Reference
WPIP High B Appendix V.1 Page 8
Large 80% $30.00/ton $70.75 5% inc.
$36.00 - $11.28 $6.00 89
WPIP High E Appendix V.1 Page 11
Large 80% $30.00/ton $140.31 10% inc.
$41.00 - $10.08 $11.00 90
GPCFB Green B Appendix V.2 Page 26
Large 70% $28.12/ton $109.39 15% inc.
$42.00 - $4.44 $13.88 91
GPCFB Green E Appendix V.2 Page 29
Large 70% $28.12/ton $75.65 11% inc.
$38.00 - $5.38 $ 9.88 92
WFM Green E Appendix V.3 Page 41
Mid 14% $27.82 $61.06 10% inc.
$44.00/ton - $3.01 $16.18 93
CMUC
Yellow D Appendix V.4 Page 69
Mid 31% $26.39 $62.48 13% inc.
$50.00/ton - $2.47 $23.61 94
EEFC Green C Appendix V.5 Page 83
Small 12% $27.44 $34.54 15% inc.
$100.00/ton - $0.01 $72.56 95
Allegheny Food Waste Collection and Composting Feasibility Study 2006 November 8, 2006 Page 45 of 51
4.2.2. Conclusions
The analyses by our research group examines diverse perspectives and helps determine guidelines important to the development of a proposed food waste collection and composting pilot program that is economically viable for Allegheny County. The considerations given to a variety of scenarios that integrate multiple variables provide an expanded view of the economic balances in a collection and composting system. GUIDELINES:
If the total number of pulls/collections for both the solid waste and the food waste equals or is less than the current number of weekly pulls/collections then the FWG can experience a cost savings when composting their food waste. This is true because typically processing fees at composting facilities in this region are slightly less than landfill fees at this time. If the weekly hauling costs do not increase, then the reduction in processing fees results in a cost savings for the FWG. However, it is not always possible to maintain or reduce the current number of pulls/collections given the following conditions:
o If the FWG does not have a high enough percentage of food waste in their waste stream, so that the diversion of food waste does not result in a significant reduction in the volume of the overall waste stream.
o If space issues prohibit the storing of waste materials for a length of time greater than their current practice. o If there are concerns about pests and odor problems that necessitate the frequent collection of the food waste. o If the solid waste is stored in a compactor and is already being pulled infrequently (once a week).
Large FWGs, for which greater than 50% of their waste stream is food waste, are likely to benefit economically from a food waste
collection and composting program. This is true because of the following: o Food waste has a much higher density than other waste materials. For example the food waste from WPIP comprises 80%
of their waste stream by weight. Yet, because the density of food waste in comparison to the density of other waste materials is much greater, the food waste of WPIP comprises only 48% by volume. Likewise the food waste at the GPCFB comprises 70% of the waste stream by weight and only 45% by volume.
o Therefore the greater the volume of food waste, the higher the likelihood that its diversion would result in a significant reduction in the number of weekly solid waste pulls/collections.
Allegheny Food Waste Collection and Composting Feasibility Study 2006 November 8, 2006 Page 46 of 51
If the food waste and solid waste can be pulled/collected at the same time and taken to a composting facility and landfill that are either at the same site or in close proximity to each other, then there is a cost savings regardless of food waste generator size. As a result the following condition would apply:
o This would require a truck with two compartments that could collect food waste and other organics separately from solid waste.
o This would also require that the composting facility be sited at or near a landfill.
The addition of food containing animal products to an in-vessel composting food waste diversion program did not result in a significant cost savings.
o Of the five FWGs studied, only Whole Foods Market and Carnegie Mellon University Center had a significant amount of animal products and food waste containing animal products in their waste stream. Although the addition of these materials significantly increased the percentage of food waste in the total waste stream, the cost savings to both FWGs was nominal.
o The use of an invessel composter however can add other benefits to the process. For example it would increase the amount of food waste diverted from the waste stream and make source separation of food waste easier. The separation of all food waste from solid waste stream enables the solid waste to be stored for longer periods with out concern for odors and pests and could result in the reduction of weekly solid waste pulls. In-vessel composting would provide the opportunity for participation by a broader range of FWGs, for example restaurants.
An increase in solid waste tipping fees can result in the economic viability of a food waste collection and composting program for
large FWGs with a high percentage of food waste in their waste stream. o In the WPIP High B scenario (see Table X) investigated, a realistic increase of $6/ton in solid waste tipping fees resulted in a
cost savings. o All other scenarios required a $10 or more increase in solid waste tipping fees. o The smaller the FWG the greater the increase required before food waste composting would become cost effective. For
example, because only 12% by weight of the EEFC’s waste stream is food waste, solid waste tipping fees would have to be $72.56 greater per ton than composting tipping fees in order for food waste composting to be economically viable.
Grant funding to cover the capitol costs for collection and hauling equipment reduces the operating costs for the organics haulers
and enables a significantly higher number of scenarios to be economically viable. In the economic analyses, a hauling subsidy of 60% was applied to large and mid-sized FWGs. A hauling subsidy of 32% was applied to small FWGs. The difference in subsidies
Allegheny Food Waste Collection and Composting Feasibility Study 2006 November 8, 2006 Page 47 of 51
was a result of the difference in costs to pull a roll off or compactor as opposed to collecting waste from a dumpster. It was found that 14% of the scenarios without subsidies were economically viable, while 38% became economically viable when subsidies were applied.
o Small FWGs are not as likely to experience a cost saving because the route density for a solid waste hauler will be greater than that of an organics hauler; therefore resulting in a higher cost for the organics hauling. A subsidy for organics hauling can eliminate this cost difference.
o A subsidy allows for travel between the landfill and the composting facility without an increase in cost. o A subsidy can allow for a slight increase in the number of total waste pick ups, in the event the FWG cannot maintain or
reduce the number of pickups for the reasons listed above. o A subsidy can increase the cost savings dramatically so that FWGs have a financial incentive to participate in a food waste
collection and composting program. o The facts related to economy of scale create a disadvantage for small food waste generators who want to participate in a
food waste collection and composting program. A subsidy can increase the likelihood that small FWGs could effectively participate in a food waste collection and composting program.

Allegheny Food Waste Collection and Composting Feasibility Study 2006 November 8, 2006 Page 48 of 51
5. Task D: CONSTRUCT COLLECTION AND COMPOSTING PILOT MODEL Given the data and experience gathered for this feasibility study, the Food Waste Composting Coalition team was able to construct a framework for implementing a pilot program to collect food waste from a variety of Food Waste Generators (FWGs) and divert it to local windrow composting operations in the region. At this time we have no invessel composting options in the area to consider. It seems clear to this team, looking at the economic guidelines and the variations in scale for both the FWGs and processors, that a single model for operating a collection and composting process is not economically viable for the diverse group of regional FWGs, commercial compost processors, farm composters, independent haulers, land fill operators, and processor/haulers we interviewed. If we are to maximize the amount of food waste diverted for composting by increasing the number of FWGs participating in the collection of food waste, it is important to examine the details for implementing the process from more than one perspective.
Our research team is proposing to continue this study with a Phase II Pilot Program to implement and monitor three pilot models that are based on scale and the availability of regional resources ready to participate.
Pilot Model A: Small-scale Vol
Facilitate the development of a working relationship between one or more small-scale urban FWGs (where food waste is less than 12% of their daily total waste stream) and one or more “on farm” processor who would also collect/haul food waste from the FWGs.
Pilot Model B: Mid-size Vol
Facilitate the development of a working relationship between one or more mid-sized urban FWGs (where food waste is between 17% and 47% of their daily total waste stream) and a commercial composting business who would collect food waste from the FWGs and also accept food waste from an independent hauler contracted by the FWG.
Pilot Model C: Large Vol
Facilitate the development of a working relationship between one or more large sized urban FWGs (where food waste is greater than 50% of their daily total waste stream), and an independent hauler who will take the food waste to a commercial composting business.
Over the course of a Pilot program implementation (at least 12 months), our research would be focused on monitoring key aspects of these working relationships including:
Critical communication issues between processor and FWG
Management of food waste source separation training for FWG
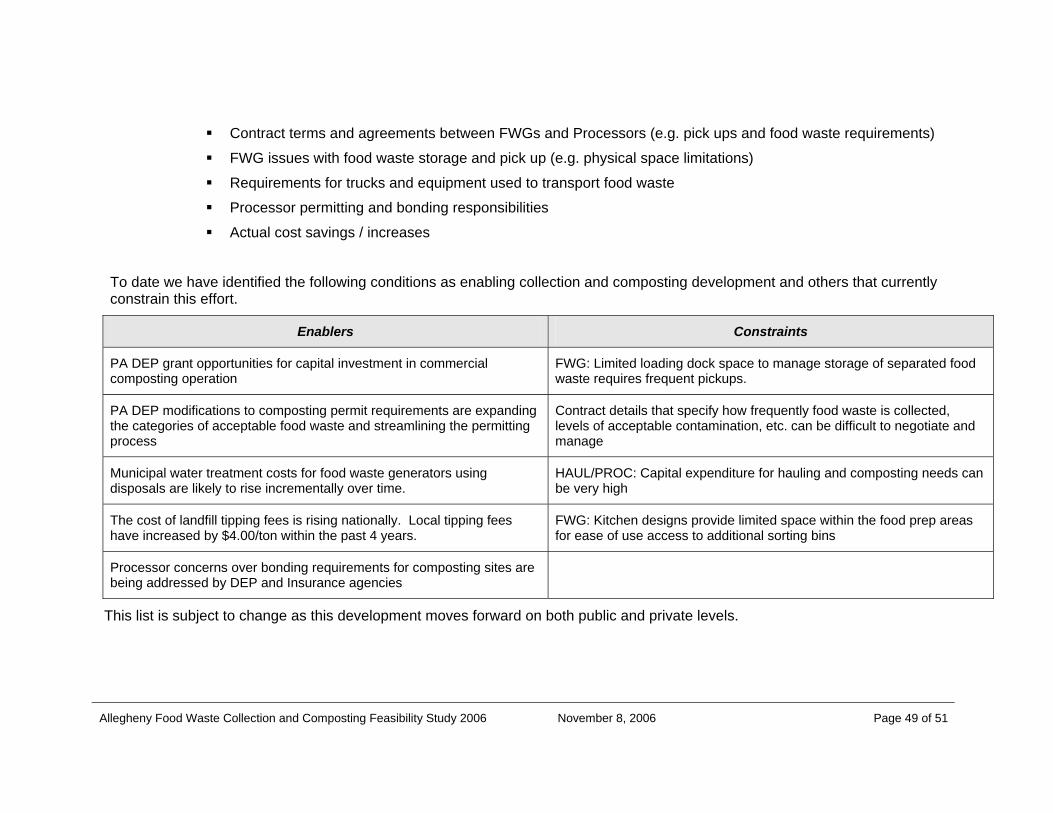
Allegheny Food Waste Collection and Composting Feasibility Study 2006 November 8, 2006 Page 49 of 51
Contract terms and agreements between FWGs and Processors (e.g. pick ups and food waste requirements)
FWG issues with food waste storage and pick up (e.g. physical space limitations)
Requirements for trucks and equipment used to transport food waste
Processor permitting and bonding responsibilities
Actual cost savings / increases
To date we have identified the following conditions as enabling collection and composting development and others that currently constrain this effort.
Enablers Constraints
PA DEP grant opportunities for capital investment in commercial composting operation
FWG: Limited loading dock space to manage storage of separated food waste requires frequent pickups.
PA DEP modifications to composting permit requirements are expanding the categories of acceptable food waste and streamlining the permitting process
Contract details that specify how frequently food waste is collected, levels of acceptable contamination, etc. can be difficult to negotiate and manage
Municipal water treatment costs for food waste generators using disposals are likely to rise incrementally over time.
HAUL/PROC: Capital expenditure for hauling and composting needs can be very high
The cost of landfill tipping fees is rising nationally. Local tipping fees have increased by $4.00/ton within the past 4 years.
FWG: Kitchen designs provide limited space within the food prep areas for ease of use access to additional sorting bins
Processor concerns over bonding requirements for composting sites are being addressed by DEP and Insurance agencies
This list is subject to change as this development moves forward on both public and private levels.
Allegheny Food Waste Collection and Composting Feasibility Study 2006 November 8, 2006 Page 50 of 51
6. Task E: DESIGN AND DEVELOP MARKETING MATERIALS
The Food Waste Composting Coalition research team’s conception of what kinds of information would offer prospective participants clear and convincing arguments to support their investment of time, energy, and possibly additional monies and how that information is best presented has evolved over the course of this study. Such marketing tools are recognized as one component in the recruitment of participants for the food waste collection and composting pilot implementation. Initially our team imagined some well designed pamphlets utilizing case studies from other food collection and composting programs to illustrate a win-win situation for each stakeholder group.
While many of the food waste generators, commercial processor/haulers, farmers, and the independent hauler interviewed for this feasibility study have expressed their willingness to participate in a pilot program, for some this commitment comes with qualifications. The usual qualifiers are (1) the need to know what it will cost them initially to participate and (2) how their participation can be sustained over time. These are hard questions to answer with any real confidence because each stakeholder group in the collection and composting process is working with a different set of variables and expectations. In order to address this situation, the team shifted the marketing approach from a static presentation of information gathered from other like stakeholder groups to a dynamic presentation that enables individual stakeholders to bring their own values for selected variables into making a prediction of economic viability for their role in the process.
6.1 Design Web Based Financial Modeling Tool For some months our team has worked with a small group of undergraduate consultants from the Tepper School of Business at CMU to design a web based financial modeling tool, using Excel software. The objective for this modeling tool is to create an opportunity for individual stakeholders to manipulate values for selected variables in the collection and composting process to predict economic outcomes and parameters that more closely relate to their business conditions.
Making this tool and associated information about composting easily accessible via a website, to interested businesses and organizations, provides visibility for the Food Waste Collection and Composting Project and helps others interact to understand how this system of organic waste management can be adapted and adopted as a standard operating procedure. This part of the project will be continued in Phase II.
Allegheny Food Waste Collection and Composting Feasibility Study 2006 November 8, 2006 Page 51 of 51
6.2 Develop Business Plan for Invessel Composting
Our research team determined that generating new businesses to expand composting methods was another important marketing approach that would increase opportunities to divert organic waste into composting. Invessel technology provides an effective method for composting all food waste. Our team was able to engage another small group of students, who are graduate consultants in the Tepper School of Business Entrepreneurial Program, and who have agreed to develop a business plan for invessel composting as a project for their graduate degree. The business plan offers an operational and economic baseline model that people interested in invessel business development could use to start their own planning process and/or secure required funding for a start-up, early stage or ongoing business. The Plan would be available on the website.
The Tepper School Don Carter Entrepreneurial Program is ranked 6th among entrepreneurial programs across the country. The Program provides graduate students with exceptional depth in planning, funding, and sustaining a successful new business. The Program focuses on three key areas for start-up survival: marketing, organization and funding. Students take required and advanced electives in each of these areas to acquire the planning skills to develop and execute a start-up plan. Students in the Program become Entrepreneurial Fellows and can participate in workshops with an executive guest speaker, do a summer internship, while completing a final project.
These graduate consultants at Tepper are also working as chapter members of a national program called Net Impact. Net Impact’s mission is to “improve the world by growing and strengthening a network of new leaders who are using the power of business to make a positive net social, environmental, and economic impact. With more than 125 student and professional chapters on 4 continents in 75 cities and 80 graduate schools, a central office in San Francisco, and partnerships with leading for and non profit organizations, Net Impact enables members to use business for social good in their graduate education, careers, and communities.”
It is anticipated that the business plan would be available by end of summer, 2007. This part of the project will be continued in Phase II.