Embed Size (px)
Citation preview

Food Processing Export Strategy Cheese – Action Plan
Consultation Document - Draft Final -
Project: Trade Enhancement Programme A (TEP-A Lot 2, Comp 4)
Assignment: 4.15.10 Policy and Capacity Building: Food Processing Export Council
Author: Paul Baker Date: September 2007
Disclaimer: The views and propositions expressed herein are those of the expert (Paul Baker) and do not necessarily represent any official view of the European Commission or any other organisations mentioned in the Report

Export Strategy for Processed Food – Cheese Action Plan
Paul Baker September 2007 i
Preface This report has been produced as part of an assignment to support capacity building of the Food Processing Export Council (FPEC) in order to ensure that the Council is able to perform and act as a qualified partner for the Ministry of Trade and Industry (MTI), representing and serving the development of the Egyptian food processing sector. The purpose of the report is to briefly analyse the export situation of the cheese sector and to put-forward suggestions for a possible series of actions to support cheese exports (‘Action Plan’). In its current form, the report attempts to raise a number of relevant issues to be addressed by the industry, and policy-making and support institutions, as part of the development of an industry-wide medium-tern strategy for cheese exports. Finally, the reader should note that the views and propositions expressed in this report are those of the author and do not necessarily represent the views of the European Commission (funding agency), COPCA (contractor), the Egyptian Food Export Council (beneficiary) or any other organisation mentioned in the Report.

Export Strategy for Processed Food – Cheese Action Plan
Paul Baker September 2007 ii
Table of Contents
1. Introduction ............................................................................................................. 1 1.1. Food Export Strategy Recommendations .............................................................. 1 2. Global context: diary and cheese developments ................................................... 3 2.1. Dairy sector situation in mid-2007 .......................................................................... 3 2.2. Dairy sector short-term prospects .......................................................................... 5 2.3. Demand side developments ................................................................................... 5 2.4. Supply side developments...................................................................................... 8 2.4.1. Processed cheese developments (European Union)..................................... 10 2.4.2. Prospects for cheese in the European Union................................................. 11 2.4.3. Prospects for cheese in Middle East and North Africa................................... 13 2.5. Trade patterns....................................................................................................... 16 2.5.1. Global trade patterns ...................................................................................... 16 2.5.2. Gulf Region trade patterns ............................................................................. 17 2.6. Global supply – demand balancing ...................................................................... 18 3. Egypt’s strategic positioning ................................................................................. 19 3.1. Brief overview of the Egyptian cheese sector. ..................................................... 19 3.2. Current export position ......................................................................................... 20 3.3. Strategic issues..................................................................................................... 24 3.3.1. Scenarios for future development................................................................... 24 3.3.2. Geographical market focus............................................................................. 26 3.3.3. Other issues.................................................................................................... 32 4. Outline cheese export ‘action plan’ ...................................................................... 35 4.1. Current situation.................................................................................................... 35 4.2. Strategy development: defining, agreeing and aligning priorities ........................ 35 4.3. Overview of key issues and action areas............................................................. 37 4.3.1. Assessment of future prospects and scenarios for the cheese sector .......... 37 4.3.2. Enhancing awareness and information on international markets .................. 38 4.3.3. ‘Image building’ and awareness raising ......................................................... 39 4.3.4. Export market diversification .......................................................................... 41

Export Strategy for Processed Food – Cheese Action Plan
Paul Baker September 2007 iii
Index of Tables Table 1 Cheese consumption and growth by region................................................... 6 Table 2 Per capita cheese consumption and growth by region .................................. 6 Table 3 Cheese imports and growth by region............................................................ 7 Table 4 Cheese production and growth by region ...................................................... 9 Table 5 Cheese exports and growth by region............................................................ 9 Table 6 EU15 production of processed cheese (2001-2005) ................................... 10 Table 7 EU15 exports of processed cheese (2001-2005) ........................................ 11 Table 8 GCC: imports of cheese and curd (HS 0406) in 2005 ................................. 17 Table 9 Egypt cheese exports: value 2005 – 2007 ................................................... 21 Table 10 Egypt cheese exports: volume 2005 – 2007 ................................................ 21 Table 11 Egypt cheese exports: average unit values 2005 – 2007 ............................ 21 Table 12 Egypt cheese exports: main markets by value 2005 – 2007 ....................... 22 Table 13 Egypt cheese exports: main markets by volume 2005 – 2007 .................... 22 Table 14 Egypt cheese exports to COMESA .............................................................. 23 Table 15 Egypt cheese exports to ‘other’ sub-Saharan Africa.................................... 23 Table 16 Country specific tariff quotas for cheese applied by the EU ........................ 29 Index of Figures Figure 1 Monthly index of international prices of dairy products (98-00=100)............. 4 Figure 2 EU stocks of skim milk and butter .................................................................. 4 Figure 3 Prices of milk in selected countries, and indicative world price ..................... 4 Figure 4 EU export shares of world markets ................................................................ 4 Figure 5 Outlook for the EU cheese market (million tonnes), 1991-2014.................. 13 Figure 6 Cheese trade flows (>= 10,000 tonnes) ....................................................... 16 Index of Boxes Box A International investments in cheese production in MENA ............................... 15 Box B: ESR recommendations for a brand orientated approach for white cheese..... 27

Export Strategy for Processed Food – Cheese Action Plan
Paul Baker September 2007 iv
List of Acronyms ABARE Australian Bureau of Agricultural and Resource Economics ALEB Agricultural-Led Export Businesses Project (funded by USAID) CAP Common Agricultural Policy (European Union) CIS Commonwealth of Independent States COMESA Common Market for Eastern and Southern Africa EAC East African Community EFPS Egyptian Food Processing Sector EGP Egyptian Pound ESR Export Strategy Report (“Food Export Strategy Study – PS137 – Final Report”,
STEM-VCR, May 2006, for IMC) EU European Union EU-10 Member States that joined the European Union on May, 1st 2004 EU-15 Member States of the European Union before May, 1st 2004 FAO Food and Agriculture Organisation of the United Nations FAPRI Food and Agricultural Policy Research Institute FDI Foreign Direct Investment FP Food Processing FPI Food Processing Industry FPEC Food Processing Export Council FSR Food Sector Review (“Egyptian Processed Food Sector Review – Final Report”
ECORYS-NEI, May 2005, for IMC) GCC Gulf Cooperation Council GOEIC General Organization for Exports and Imports Control IMC Industrial Modernisation Centre IPRT Inward Processing Relief Traffic MENA Middle East and North Africa MFN Most Favoured Nation MTI Ministry of Trade and Industry NDM Nonfat Dry Milk OECD Organisation for Economic Cooperation and Development SMP Skim Milk Powder SWOT Strengths, Weaknesses, Opportunities, Threats TARIC Integrated Tariff of the European Communities TEP-A Trade Enhancement Programme A ToR Terms of Reference TRQ Tariff Rate Quota WMP Whole Milk Powder

Export Strategy for Processed Food – Cheese Action Plan
Paul Baker September 2007 1
1. Introduction
This Report is intended as a consultation document, providing background analysis of international and Egyptian cheese trade performance, leading to development of an outline ‘Action Plan’ for cheese exports. Through the document a range of issues are raised that – in the opinion of the author – should be addressed as part of a comprehensive ‘Export Strategy’ and ‘Action Plan’ for the cheese sector. Deliberately, the document tries to focus on aspects that are specifically relevant for enhancing exports but it is recognised, at the same time, that improving the export performance of the cheese sector will require issues to be analysed and addressed throughout the entire sector value chain. With regard to the proposed elements of the ‘Action Plan’, they are not a comprehensive description of required actions, but rather are intended to be illustrative and to serve as a basis for promoting future discussion within the sector and other relevant stakeholders. As the starting point for this analysis, and the reasons underlying the choice of the cheese sector, stem from an earlier ‘Food Export Strategy Report’; the recommendations from the Report are outlined in the following sub-section. Following from this, Section 2 provides an overview of the global context and developments in the sector; Section 3 examines Egypt’s strategic export positioning; and Section 4 provides an outline ‘Action Plan’.
1.1. Food Export Strategy Recommendations
The IMC: “Food Export Strategy Report” (May 2006)1 has identified cheese as a product for which Egypt could “reinforce its strong position in the area as a leading supplier of cheese and curds (especially processed cheese)”. This reinforcement could build upon the success that Egypt has already had in establishing itself as a regional hub of marketing oriented multinational cheese producers. The Strategy Report concerns itself primarily with 3 categories of cheese product:
Processed (pasteurised processed cheese and spreads, cold packed cheese etc.), for which the export potential is considered to be in fast-growing markets including GCC, Russia and ex-Soviet Republics, ‘proximity markets’ such as Iraq, Libya, Sudan, Ethiopia, and perhaps the EU. The Strategy Report suggests that the success of Egypt in attracting FDI from major branded multinationals and, as a consequence, the strong competitiveness of the processed cheese sector could provide the ‘springboard’ for development of Egypt as a regional hub supplier.
Mozzarella di Buffalo (un-ripened soft cheese), for which potential exports markets include the mature markets of EU and USA. With rising prices for Mozzarella, reflecting inter alia supply constraints and rising costs for Italian producers, the Strategy Report suggests the possibility for Egypt to position itself as a low-cost competitor to Italy and/or as supply partner to Italian producers and distributors.
Domiati/Domiata2 (pickled soft cheese), for which the Strategy Report focuses on brand development and registration of a ‘Domiati brand’ that could serve to unify the
1 “Food Export Strategy Study – PS137 – Final Report”, STEM-VCR, May 2006 2 Domiati is the most popular soft white cheese produced in Egypt.

Export Strategy for Processed Food – Cheese Action Plan
Paul Baker September 2007 2
Egyptian offer of soft white cheese3. The markets offering opportunities for Egyptian ‘branded’ soft white cheese are seen mainly to be in GCC, but may also include neighbours such as Sudan, or further away in South and South-East Asian minority markets and, even, USA (subject to proper market evaluation). However, in the face of existing strong local brands, the successful branding and promotion of Egyptian white cheese is seen as a prerequisite for penetrating markets in MENA region.
The main activities (action plan) proposed in the Strategy Report to maintain and/or strengthen Egypt’s export position in the cheese sector include:
Brand development: the creation of a brand-orientated approach, especially for white cheese (e.g. creation of a protected designation of origin (POD) trademark for ‘Domiati brand’) that could effectively differentiate the Egyptian product from ‘generic’ and locally supplied products in export markets (particularly in GCC and MENA). Similarly, a brand orientated approach would be necessary to enter premium segments of the market for Mozzarella. Given the high costs and specialised skills required for developing sophisticated branded marketing strategies, the Strategy proposes a joint approach with an industry partnership with one of the major multinational companies already producing in Egypt4.
Marketing: Aggressive promotion of (branded) Egyptian cheeses particularly in Middle East and North Africa. With respect to soft white cheeses - such as Domiati – creation of a strong brand identity is seen as a pre-requisite for export success given the existence of strong local brands. Further, the Strategy proposes adoption of a more aggressive promotional plan to be implemented in all main food retail chains in the Middle East.
Export rebate: reflecting the fact that the processed cheese segment is highly dependent on imported raw materials, maintaining the export rebate is seen as important for ensuring that Egypt maintains its price competitiveness5,6.
Other, less sector specific measures, include improving export logistics infrastructure (particularly to GCC), and targeting the Iraqi market. It is in this context that the present document attempts to make some steps towards the development of an outline strategic action plan for the enhancement of Egyptian cheese exports. This reflects the need to go beyond the rather limited ‘action plan’ contained in the ESR. Deliberately, given the limited time and resources available for this activity, the focus of the background analysis is upon developments in the global market place. It is clearly desirable that this analysis should, eventually, be accompanied by a complementary detailed analysis of the local (Egyptian) situation.
3 The Strategy Report also raises the possibility that one if the major multinational companies could play a leading partner role in this band development. 4 The Strategy Report specifically mentions Lactalis. 5 The Export strategy points to the fact that the price competitiveness of Egyptian processed cheese production (compared to regional competitors) stems from the relative cost of imported raw materials compared to domestic milk supplies. For example, Saudi Arabia has a more integrate dairy sector with cheese production more reliant on local milk production, which – at the time of writing the Strategy Report – was estimated to be significantly more expensive than imported raw materials used by Egyptian producers. 6 For cheese produced from locally produced milk supplies (e.g. Domiati), the Strategy Report suggests that the export rebate should be ‘earmarked’ for upgrading the supply chain.

Export Strategy for Processed Food – Cheese Action Plan
Paul Baker September 2007 3
2. Global context: diary and cheese developments
This section provides a brief overview of the current global situation in the cheese sector. Its purpose is to provide a background context in which to place the strategic considerations that will motivate the development of an outline ‘action plan’ for Egyptian cheese exports.
2.1. Dairy sector situation in mid-2007
The global dairy sector has been under going a period of soaring prices. According to FAO estimates7, between November 2006 and April 2007 the FAO’s price index of traded dairy products rose by 46 percent (see Figure 1). Behind this aggregate figure, prices of skim milk powder (SMP) and whole milk powder (WMP) increased by 56 and 61 percent respectively. By contrast, price increases for cheese and butter were more modest, by 18 and 34 percent respectively. The slower growth in the world price of cheese (and butter) compared to other dairy products reflects the fact that trade between developed countries – which is characterized by relatively flat demand and tariff rate quotas – accounts for a much higher proportion of total world trade than is the case for other dairy products. These record prices are attributed to a combination of short-run factors and structural causes mainly affecting supply-side conditions. On the one hand, drought in Australia, suspension of milk powder exports by India, and the export taxes applied by Argentina are restraining export supply in the short term. On the other hand, European Union dairy policy reform is changing the structure of international markets as its export market share declines (see Figure 4). In this context, the rapid rise in prices for powdered milk observed since the autumn of 2006 is primarily attributable to the exhaustion of public stocks in the EU (see Figure 2). The high international price has meant that it has reached a level at which the indicative world price is at a level similar to that in the USA and EU, thus enabling them to export without subsidies (see Figure 3). Commentators suggest that this may act as a break on further prices increases. More important for the short-term future is, perhaps, the need for reconfiguration in the production balance of different dairy-based products. As the FAO points out “prices of milk powders are now far too high relative to the other milk products. For example, the ratio of WMP to cheese prices has averaged about 0.85 in 2003-2006, but the ratio now stands at 1.25. Market correction should bring those prices closer into line, as processors allocate more production to powders and less to other under-priced dairy products, eventually resulting in a weakening of milk powder prices”8. As a consequence, additional milk production is expected – at least in the short run - to be allocated to other dairy products and away from cheese.
7 “Food Outlook Global Market Analysis”, FAO, June 2007, available at: http://www.fao.org/giews/english/fo/ 8 Ibid, footnote 7

Export Strategy for Processed Food – Cheese Action Plan
Paul Baker September 2007 4
Figure 1 Monthly index of international prices of dairy products (98-00=100)
Source: FAO, June 2007 Figure 2 EU stocks of skim milk and butter
Source: FAO, June 2007
Figure 3 Prices of milk in selected countries, and indicative world price
Source: FAO, June 2007 Figure 4 EU export shares of world markets
Source: FAO, June 2007

Export Strategy for Processed Food – Cheese Action Plan
Paul Baker September 2007 5
2.2. Dairy sector short-term prospects
There is a great deal of uncertainty over the likely track of prices for dairy products in the short-term. According to USDA9, the fundamental factors that have promoted the rapid escalation in dairy prices will continue to persist. Exportable dairy product supplies are not expected to grow significantly either from the major Oceania suppliers (Australia and New Zealand) or the EU and United States. In the United States, strong internal demand for dairy products such as cheese is diverting milk away from non-fat dry milk (NDM) production. The situation is similar in the EU, where the recent suspension of all EU export restitutions for dairy products is directly related to growth in internal consumption of cheese, while milk production is held steady by quotas. There is, however, an intuitive expectation that inevitably prices are cyclical and demand will flag particularly once the impact of these high prices are fully transmitted to consumers. Nevertheless, USDA concludes that it is difficult to envisage a scenario in which global prices in 2007 or 2008 drop dramatically to the EU intervention (support) levels or the lower U.S. price support levels.
2.3. Demand side developments10
Global consumption of milk and processed dairy products has been rising steadily in recent years, driven by higher incomes and changing consumption patterns, particularly in major developing countries in Asia. Of the major dairy products, total world consumption of butter increased by 10.5 percent in the five years to 2006, cheese by 9.5 per cent and whole milk powder by 8.5 percent. Consumption of skim milk powder, however, was down by 9 per cent over the period. Increases in world consumption of dairy products were driven largely by increased consumption in China, India, the Russian Federation and the Ukraine. Continued strong economic growth and rising incomes in these countries — particularly in China and India — together with the adoption of more western style diets are expected to promote moderate growth in import demand for milk and dairy products over the medium term. World demand for the various dairy products has diverged over the past few years, with demand increasing for cheese relative to other products such as butter and skim milk powder. Increases in cheese production in response to growing demand have come at the expense of other dairy products — particularly milk powder production. As a consequence of their lower availability relative to demand, prices of milk powders have risen strongly (see Section 2.1). Strong growth in global demand for cheese largely reflects rising consumer incomes, leading to increasing per person cheese consumption, particularly in the major developing countries of Asia and Eastern Europe. Robust income growth in these areas, and also in oil exporting countries of Africa and Latin America and the Caribbean have driven growing demand for dairy products (see Table 1 and Table 2).
9 USDA, “Dairy: World Markets and Trade”, Circular Series, FD 1-07, July 2007, available at http://www.fas.usda.gov/dlp/circular/2007/dairy_07-2007.pdf 10 Information sources for this section include: “Dairy outlook to 2011-12”, Australian Commodities, March 2007, ABARE Economics, available at: http://www.abareconomics.com/publications_html/ac/ac_07/ac_mar07.pdf. Some sections of the text are taken directly from these reports.

Export Strategy for Processed Food – Cheese Action Plan
Paul Baker September 2007 6
Table 1 Cheese consumption and growth by region
Consumption 2005 Average annual growth rate of consumption
Thousand tonnes Share of World 1985-90 1990-95 1995-00 2000-05 World 18,543 100% .. .. .. 2.8 Western Europe 8,416 45.4% .. .. .. 2.2 North America 4,653 25.1% 2.7 3.1 3.3 2.2 Australia & NZ 256 1.4% 3.2 0.2 5.7 2.6 Japan 250 1.3% 6.5 5.6 5.2 0.9 CIS 1,101 5.9% .. .. -4.4 13.6 Other Eastern Europe 90 0.5% -2.0 23.2 -0.1 6.1 North Africa 771 4.2% 1.1 3.5 5.2 8.6 - Egypt 709 3.8% 1.5 3.4 5.7 8.4 Sub Saharan Africa 208 1.1% 7.4 10.2 -0.2 0.1 Latin America 1,464 7.9% 3.3 4.8 3.3 0.2 - Argentina 361 1.9% 7.4 4.9 4.1 -3.9 - Brazil 472 2.5% 0.3 8.6 2.0 0.6 - Mexico 224 1.2% 3.7 0.7 7.7 3.6 Asia & Pacific 1,292 7.0% 1.6 0.6 3.0 2.6 - China 298 1.6% 6.6 3.4 2.6 6.5 - Korea 73 0.4% 63.1 10.4 31.5 10.6 - Turkey 125 0.7% -1.4 0.5 -1.4 -0.6 - Iran 216 1.2% 1.5 -4.2 0.2 -0.3 - Saudi Arabia 80 0.4% 6.1 -1.2 6.0 3.2 Source: FAO-OECD Agricultural Outlook Database (extracted from OECD Stat) and author’s calculations
Table 2 Per capita cheese consumption and growth by region
Average annual growth rate of consumption per capita
Consumption per capita 2005 (kg)
1985-90 1990-95 1995-00 2000-05 World 2.9 .. .. .. 1.5 Western Europe 16.8 .. .. .. 1.9 North America 14.2 1.7 1.7 2.1 1.2 Australia & NZ 10.5 1.8 -0.9 4.5 1.4 Japan 2.0 6.0 5.2 5.0 0.8 CIS 4.0 .. .. -4.3 14.0 Other Eastern Europe 3.7 -2.8 23.6 -0.3 6.0 North Africa 5.0 -1.4 1.5 3.4 6.8 - Egypt 9.6 -0.8 1.5 3.7 6.4 Sub Saharan Africa 0.3 4.2 7.1 -2.8 -1.9 Latin America 2.0 1.2 3.0 1.7 -1.3 - Argentina 9.3 5.8 3.5 2.9 -4.9 - Brazil 2.5 -1.7 6.9 0.5 -0.8 - Mexico 2.2 1.6 -1.3 6.1 2.3 Asia & Pacific 0.4 0.0 -1.3 1.9 1.2 - China 0.2 4.9 2.7 1.2 6.2 - Korea 1.5 74.1 9.3 30.0 10.2 - Turkey 1.7 -3.6 -1.4 -3.1 -1.8 - Iran 3.1 -1.6 -6.0 -1.0 -1.3 - Saudi Arabia 3.3 1.1 -3.8 3.1 0.5 Source: FAO-OECD Agricultural Outlook Database 2007-2016 (extracted from OECD Stat) and author’s calculations

Export Strategy for Processed Food – Cheese Action Plan
Paul Baker September 2007 7
For many years Japan has been the world’s large importer of cheese and has consistently accounted for around 20 per cent of world imports, or 200,000 tonnes a year. However, in 2005 the Russian Federation overtook Japan to become the world’s largest importer of cheese.. With growth in consumption consistently exceeding production in the Russian Federation, cheese imports are expected to continue to rise strongly. Mexico and the Republic of Korea have also become relatively large importers of cheese (see Table 3). The OECD-FAO11 and FAPRI12 foresee that the medium-term outlook for the dairy sector will remain dominated by substantial expansion in global demand for dairy products. The strong demand will be driven by income and population growth in many regions of the world, and by changes in consumer preferences towards dairy products. Demand growth is projected to be strongest in the non-OECD zone, most notably in Southeast Asia, the Far East and North Africa. The steady growth in import demand and the gradual growth in global supplies are forecasted to generate upward pressure on dairy product prices over the medium term. Supported by the steady rise in global consumption, cheese prices would display relatively high prices over the medium term. These medium-term perspectives remain strongly dependent on the future development in some key markets such as Russia and East Asia. Furthermore, the trend towards further concentration and globalisation of the dairy industry, and greater differentiation of dairy products, is expected to make trade projections increasingly complex and dependent on dairy firms’ cost structure, production and marketing strategy13. Table 3 Cheese imports and growth by region
Imports 2005 Average annual growth rate of imports
Thousand tonnes Share of World 1985-90 1990-95 1995-00 2000-05 World 1,495.8 100.0% .. .. .. 4.8 Western Europe 126.7 8.5% .. .. .. -6.6 North America 229.9 15.4% -0.6 2.4 4.3 1.7 Australia & NZ 42.0 2.8% -1.2 7.6 2.8 4.1 Japan 211.7 14.2% 5.7 7.8 5.5 0.6 CIS 272.5 18.2% .. .. -14.1 47.4 - Russia 259.7 17.4% .. .. -14.7 48.9 Other Eastern Europe 27.0 1.8% -14.2 116.2 -1.6 13.4 North Africa 59.0 3.9% -4.7 -4.9 2.3 5.4 - Algeria 25.0 1.7% -41.5 65.4 9.0 5.6 - Egypt 10.0 0.7% -1.4 -14.8 -4.8 -5.1 Sub Saharan Africa 15.5 1.0% -1.1 5.4 6.7 -1.5 Latin America 241.8 16.2% 4.0 9.2 6.0 0.9 - Mexico 83.3 5.6% 6.8 9.4 27.2 9.0 Asia & Pacific 337.6 22.6% -0.6 -0.1 4.3 4.1 - China 24.2 1.6% 30.0 28.5 11.7 15.1 - Korea 45.0 3.0% 5.9 147.2 22.5 8.1 - Saudi Arabia 83.0 5.5% 5.9 -0.1 6.2 2.6 Source: FAO-OECD Agricultural Outlook Database (extracted from OECD Stat) and author’s calculations
11 Agricultural Outlook 2006-2015, OECD-FAO, June 2006, available at: http://www.oecd.org/document/62/0,3343,en_2649_201185_37032958_1_1_1_1,00.html 12 “World Dairy Products”, FAPRI 2006 Agricultural Outlook, available at: http://www.fapri.org/models/dairy.aspx 13 Source: “Prospects for agricultural markets and income in the European Union 2006-2013”, European Commission, January 2007, available at: http://ec.europa.eu/agriculture/publi/caprep/prospects2006b/index_en.htm

Export Strategy for Processed Food – Cheese Action Plan
Paul Baker September 2007 8
2.4. Supply side developments
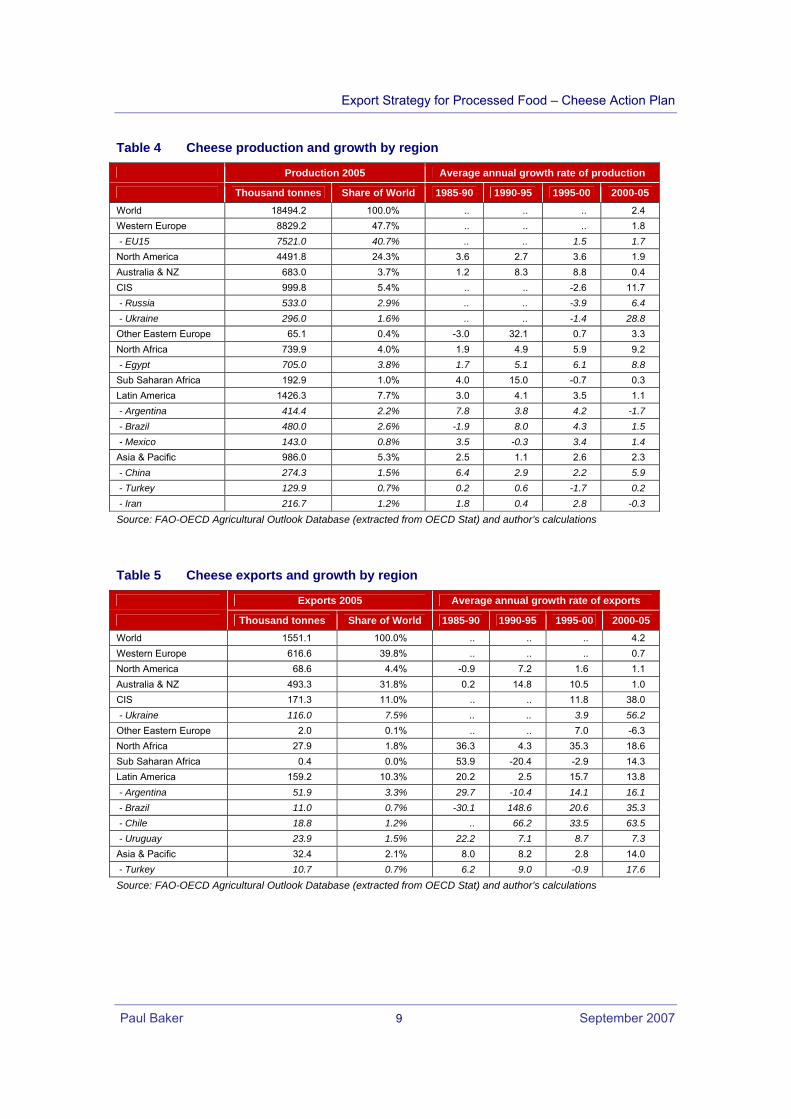
Developed country producers in Western Europe, North America and Oceania dominate global cheese production, accounting for around three-quarters of total production (see Table 4). The European Union together with Australia and New Zealand, also dominant cheese exports (see Table 5). However, in Australia, the current drought has sharply reduced dairy production and exports as dairy farmers reduce herds in order to control expenditures — particularly the higher feed costs associated with reduced irrigation water allocations. Poor seasonal conditions are also evident in New Zealand, with limited growth in dairy production expected for 2007. Elsewhere, new suppliers such as Argentina and Ukraine are emerging as important exporters of dairy products, including cheese. Over the medium term, significant increases in world cheese production are projected in response to continuing strong growth in global cheese demand. ABARE14 project that after 2009 growing cheese production and exports from major producers will lead to an easing in cheese prices. EU cheese exporters are expected to become more price competitive in global markets as the EU dairy industry is forced to become more efficient following reductions in subsidies under the revised Common Agricultural Policy. Although world demand for dairy products is expected to grow, a significant part of demand is expected to be met by domestic production. For example, increases in world milk production are expected as a result of the continued expansion of the dairy industries in China, India and Argentina. In these countries, new investment in dairy production has been spurred by rising average incomes, increasing domestic demand and higher world prices. Growth in dairy production in the major established producers, however, is expected to be relatively slow. In the United States, for example, growth in production is expected to be hindered by increased competition for grains (particularly for use in producing bio-fuels) and consequent higher feed costs. In Australia and New Zealand, dairy production is expected to grow moderately but is highly dependent upon on weather conditions. Apart from the EU, US and Oceania, Uruguay is also forecast to gain from the increase in cheese exports that are expected to grow by 23 % according to both OECD and FAPRI15. Ukraine would remain an important exporter of cheese, although with export quantities highly dependant on Russian imports.
14 Source: ibid footnote 10 15 Ibid, footnotes 11 and12.
Export Strategy for Processed Food – Cheese Action Plan
Paul Baker September 2007 9
Table 4 Cheese production and growth by region
Production 2005 Average annual growth rate of production
Thousand tonnes Share of World 1985-90 1990-95 1995-00 2000-05 World 18494.2 100.0% .. .. .. 2.4 Western Europe 8829.2 47.7% .. .. .. 1.8 - EU15 7521.0 40.7% .. .. 1.5 1.7 North America 4491.8 24.3% 3.6 2.7 3.6 1.9 Australia & NZ 683.0 3.7% 1.2 8.3 8.8 0.4 CIS 999.8 5.4% .. .. -2.6 11.7 - Russia 533.0 2.9% .. .. -3.9 6.4 - Ukraine 296.0 1.6% .. .. -1.4 28.8 Other Eastern Europe 65.1 0.4% -3.0 32.1 0.7 3.3 North Africa 739.9 4.0% 1.9 4.9 5.9 9.2 - Egypt 705.0 3.8% 1.7 5.1 6.1 8.8 Sub Saharan Africa 192.9 1.0% 4.0 15.0 -0.7 0.3 Latin America 1426.3 7.7% 3.0 4.1 3.5 1.1 - Argentina 414.4 2.2% 7.8 3.8 4.2 -1.7 - Brazil 480.0 2.6% -1.9 8.0 4.3 1.5 - Mexico 143.0 0.8% 3.5 -0.3 3.4 1.4 Asia & Pacific 986.0 5.3% 2.5 1.1 2.6 2.3 - China 274.3 1.5% 6.4 2.9 2.2 5.9 - Turkey 129.9 0.7% 0.2 0.6 -1.7 0.2 - Iran 216.7 1.2% 1.8 0.4 2.8 -0.3 Source: FAO-OECD Agricultural Outlook Database (extracted from OECD Stat) and author’s calculations
Table 5 Cheese exports and growth by region
Exports 2005 Average annual growth rate of exports
Thousand tonnes Share of World 1985-90 1990-95 1995-00 2000-05 World 1551.1 100.0% .. .. .. 4.2 Western Europe 616.6 39.8% .. .. .. 0.7 North America 68.6 4.4% -0.9 7.2 1.6 1.1 Australia & NZ 493.3 31.8% 0.2 14.8 10.5 1.0 CIS 171.3 11.0% .. .. 11.8 38.0 - Ukraine 116.0 7.5% .. .. 3.9 56.2 Other Eastern Europe 2.0 0.1% .. .. 7.0 -6.3 North Africa 27.9 1.8% 36.3 4.3 35.3 18.6 Sub Saharan Africa 0.4 0.0% 53.9 -20.4 -2.9 14.3 Latin America 159.2 10.3% 20.2 2.5 15.7 13.8 - Argentina 51.9 3.3% 29.7 -10.4 14.1 16.1 - Brazil 11.0 0.7% -30.1 148.6 20.6 35.3 - Chile 18.8 1.2% .. 66.2 33.5 63.5 - Uruguay 23.9 1.5% 22.2 7.1 8.7 7.3 Asia & Pacific 32.4 2.1% 8.0 8.2 2.8 14.0 - Turkey 10.7 0.7% 6.2 9.0 -0.9 17.6
Source: FAO-OECD Agricultural Outlook Database (extracted from OECD Stat) and author’s calculations

Export Strategy for Processed Food – Cheese Action Plan
Paul Baker September 2007 10
2.4.1. Processed cheese developments (European Union)16
The importance of processed cheese for local cheese industries is very different. The largest producer of processed cheese in the world is the USA where more than 20 % of all cheese consumed is processed cheese, followed by the EU. In Japan nearly the whole cheese production is used for processed cheese. In Russia processed cheese has a high share of cheese production too. In the European Union the production of processed cheese has been more or less stable in the last years (see Table 6). The main producing countries are Germany and France, the countries with the biggest milk production in the Union. Also Belgium, Spain, the United Kingdom and Austria are important too and production in Austria has increased sharply in the last years. Among the New Member States the major producers are Poland, the Czech Republic, Slovakia and Hungary. The production in these countries was boosted by direct investment of established Western manufacturers. Both the level of European exports (extra-EU) and the share of exports in processed cheese production are declining (see Table 7). One major reason is increased investment and transfer of technology to countries that have been traditionally been importers of processed cheese. Thus the production of processed cheese in emerging markets is increasing, to a large extent on the basis of raw materials which – withstanding recent price developments - are less expensive in the international market than in the EU. Table 6 EU15 production of processed cheese (2001-2005)
Tons
2001 2002 2003 2004 2005 Austria 20,900 23,990 29,385 31,659 33,214 Belgium 44,421 42,100 42,300 44,300 46,300 Denmark 21,000 20,500 20,500 20,000 22,000 Finland 18,597 19,613 19,600 17,000 17,257 France 135,299 132,276 125,872 129,133 123,570 Germany 175,369 177,484 167,330 175,200 177,100 Ireland 11,000 11,000 12,000 12,000 12,000 Italy 20,300 20,000 20,150 25,000 23,000 Netherlands 17,800 17,000 16,000 15,927 14,225 Spain 36,100 36,000 37,000 36,500 36,900 Sweden 6,000 7,314 7,406 6,870 6,870 United Kingdom 33,477 36,377 36,000 36,997 37,000 Total 540,263 543,654 533,543 550,586 549,436 Source: Assifonte
16 Sources: “The Role of Processed Cheese Markets for the Overall Cheese and Dairy Sector”, Monika Wohlfarth and Erhard Richarts, ZMP Zentrale Markt- und Preisberichtstelle available at http://www.assifonte.org/deutsch/processed_cheese/processed_cheese_market_2005.pdf

Export Strategy for Processed Food – Cheese Action Plan
Paul Baker September 2007 11
Table 7 EU15 exports of processed cheese (2001-2005)
Tons
2001 2002 2003 2004 2005 Austria 13,134 16,369 20,820 24,497 24,503 Belgium 48,888 50,361 48,344 52,423 51,514 Denmark 12,830 14,095 14,879 15,876 17,030 Finland 9,238 10,347 10,556 9,835 10,131 France 75,401 69,196 65,588 65,705 61,899 Germany 62,667 63,287 57,597 55,289 56,115 Greece 223 190 46 75 138 Ireland 8,488 7,802 7,662 12,534 13,214 Italy 5,315 6,385 8,267 10,438 9,152 Luxembourg 177 94 66 66 375 Netherlands 10,559 7,619 5,733 6,156 6,717 Portugal 19 18 41 54 59 Spain 4,893 4,327 4,893 3,892 4,342 Sweden 612 636 629 627 1,033 United Kingdom 17,296 20,741 21,187 20,805 19,192 Total (all exports) 269,740 271,467 266,308 278,272 275,414 Total (extra-EU) 101,814 100,325 90,945 81,575 75,019 Source: Assifonte
2.4.2. Prospects for cheese in the European Union
The European Union is the world’s largest producer and one of the top exporters of dairy products. Over the five years to 2006, EU dairy product exports accounted for around 42 per cent of total world cheese exports, 36 per cent of world butter exports, 22 per cent of world skim milk powder exports and 32 per cent of world whole milk powder exports. With EU dairy exports accounting for such large proportions of world trade in dairy products, changes in EU dairy output can have a large effect on trade flows and world prices. Over the last two decades, the EU cheese sector has been characterised by a strong and steady growth, both for production and consumption. Between 1995 and 2006 EU-15 cheese production increased by 24 %, and EU-10 production by 95 %. Cheese production absorbs more than 40 % of EU milk deliveries and is concentrated in five Member States, namely Germany, France, Italy, the Netherlands and Poland, which represent around 74 % of EU-25 cheese production. Intra-EU-25 cheese trade has increased by approximately 40 % between 1999 and 2006. 17 Milk production in the European Union is forecast to increase slowly over the medium term, reflecting the countervailing influences of relatively small increases to production quotas and some decoupling of dairy farmer support payments from production under CAP reform. Production quotas are expected to have the biggest impact on dairy production in the European Union. These quotas, which will be the subject of a mid-term revue in 2008, are expected to grow relatively slowly to 2015.18 17 Source: “Prospects for agricultural markets and income in the European Union 2007-2014”, European Commission, July 2007, available at: http://ec.europa.eu/agriculture/publi/caprep/prospects2007a/fullrep.pdf 18 Source: Ibid footnote 10

Export Strategy for Processed Food – Cheese Action Plan
Paul Baker September 2007 12
There is some debate over the likely effects of the CAP reforms put in place in 2005. A priori the EU dairy product output mix is expected to shift toward the production of higher value products like cheese, with bulk commodities — such as milk powders that compete for raw milk as an input — expected to decline. This change in product mix also reflects the relative strength of demand (and price differentials) for various dairy products within the European Union, with demand for cheese being particularly strong and expected to continue growing. As noted in Section 2.1, however, the current high prices for milk powders means that some commentators are suggesting that processors are likely to allocate more production to powders and less to other under-priced dairy products (such as cheese and butter). This suggestion is supported by recent developments such as Arla’s (Denmark) announcement in June 2007 that it will cease production of emmental cheese and switch the milk supplies to production of milk powder and mozzarella; announcing the decision, Arla Foods’ Production Director Niels Lange Jørgensen commented “Having analysed the milk powder market, we believe that prices will remain high for at least 1-2 years. At the same time, we believe that mozzarella has significant growth potential”19. Long-term trend projections by the EU Commission20 indicate that EU-27 cheese production is expected to expand further over the medium term by 10 per cent between 2006 and 2014, mainly driven by continued strong increases in the EU-12. According to the Commission’s analysis, the projected increase would constrain the expansion of production of bulk dairy products: the additional 922 000 tonnes of cheese that are expected to be produced during the period 2007-2014 (representing roughly 5 million tonnes of milk) would outweigh the projected increase in milk delivered (+3.9 million tonnes) over the same period, reducing the amount of milk available for the production of bulk dairy products like butter and SMP. With regard to exports, the European Commission expects that despite the reduction of export refunds for cheese during the first half of 2007, extra-EU-27 exports are forecast to increase further over the short term. However over the medium term, the steady growth in domestic consumption is expected to absorb most of the increase in cheese production, limiting the availabilities for cheese exports, which are projected to decline gradually to the level of 540 000 tonnes. Imports are projected to expand slightly, due to better use of preferential import quotas and the effect of trade liberalisation between the EU and Switzerland as of June 2007.
19 Source: http://www.arlafoods.com/appl/hj/hj202com/hj202d01.nsf/O/4072D67E9AED3B09C12572F300396536 20 Ibid footnote 17

Export Strategy for Processed Food – Cheese Action Plan
Paul Baker September 2007 13
Figure 5 Outlook for the EU cheese market (million tonnes), 1991-2014
Source: European Commission21
2.4.3. Prospects for cheese in Middle East and North Africa22
According to companies operating in the Middle East, cheese consumption is taking off, with at least double-digit growth experienced over the last two to three years, according to Business Monitor International estimates. The Middle East benefits from a dynamic dairy industry, which is fairly developed and sophisticated relative to other food processing sectors. Cheese has long been popular thanks to its durability and ability to stand up to the heat in the region, especially when compared to milk. Now, the product category is experiencing further growth still thanks to the success of companies that are producing and marketing cheeses as convenience and health foods. According to estimates from Proteus Insight23, in 2006 the volume sales of cheese in MENA is estimated at 1,351,420 tonnes (worth € 3,031.3 million and $US 3,814.2 million) compared to 1,388,070 tonnes in 2005. This fall reflected foot and mouth disease affecting the dairy herd in Egypt, the largest cheese market in the MENA region, which had a significant impact on the raw milk supply, with processors shifting raw milk into liquid and fresh dairy products. Nonetheless, by 2010, the market for cheese is expected to reach 1,495,220 tonnes, a 10.6% increase on 2006 levels. Per capita consumption is expected to reach 3.34kg by 2010, up from 3.21kg in 2006. Egypt and Turkey are the top two markets in the MENA region with total markets shares of 34.5% and 30.7% of the total volume of sales of cheese in 2006. However, the
21 Ibid footnote 17 22 Sources: “Cheese consumption spreading through the region”, Middle East and Africa Food & Drink Insight, Business Monitor International, May 2007, available at http://www.foodanddrinkinsight.com/file/9628/middle-east--africa.html ; “MENA: More scope for dairy”, Dairy Industries International, May 2007, available at http://www.dairyindustries.com/story.asp?id=2024468 ; “Future Key Global Cheese Markets 2007 – Key findings sample page”, Proteus Insight, March 2007, available at http://www.researchandmarkets.com/reportinfo.asp?report_id=455963. Some sections of the text are taken directly from these reports 23 Ibid footnote 22.

Export Strategy for Processed Food – Cheese Action Plan
Paul Baker September 2007 14
artisanal market in both countries plays an important role. The drop in artisanal production in Egypt and relatively stagnant levels in Turkey in 2006, resulted in both countries combined share of total volume sales declining to 65.2% in 2006 from 67.8% in 2005. In fact, an important challenge for commercial dairies in both countries will be to switch artisanal cheese consumption to commercial cheese production. The momentum is, however, with commercial cheese consumption as the local dairy industries continue to develop and the increasing urbanization of both markets is changing consumer purchasing patterns. Furthermore, the drop in raw milk supplies appears to have had a stronger adversely affect on the production of artisanal cheese in the largest market Egypt. Moreover, health-related problems in the supply of raw milk strengthens the marketing message of commercial dairies in reinforcing that healthy quality cheese is made by companies using the highest grade milk. Saudi Arabia accounted for 7.4% of volume sales but 17.2% of value sales (€ or $US) in 2006; compared to the region leader Egypt, which accounted for 28.6% of € value sales in 2006. Together with Turkey, these countries are expected to continue to be the largest markets in the MENA region in the coming few years. Underdeveloped markets, (e.g. Yemen, Iraq, Libya, Syria, and Iran) are seen to represent great potential and suppliers are likely to increase focus on these developing markets, particularly as competition in more mature MENA markets in the Gulf, Egypt and North Africa increases. International cheese producers are strengthening their positions in the MENA region. Key players, such as Kraft – which until recently had no production facilities and imported all its products - and Bel are increasing production capacity (see Box A). The Danish dairy company Arla had also established itself as a leading producer, although it suffered from the region-wide boycott of its products last year and it is only recently that regional sales resumed and are slowly climbing back up to pre-boycott levels in some categories. Meanwhile, local companies such as Al Marai – the regions largest dairy producer - were able to benefit from the boycott. Local players have also benefited from the trend of consumers preferring locally produced food and drink products. Local companies also have the advantage of knowledge of the market as well as strong distribution networks. Alongside traditional formats, there is an increasing popularity of more convenient forms of packaging, such as spreadable cheese in tubs, processed cheese slices and shredded cheese. This popularity reflects increasingly busy lifestyles, which has led to a growing demand for quick and convenient foods. Increasing health awareness is another trend that is driving cheese sales, as producers have come up with more ‘light’ – that is, low-fat and low-cholesterol – products. Some producers, aware of the importance of family in the Middle East, have started to market these products to mothers, highlighting their health benefits. For example, Kraft focuses on the calcium content of its cheese slices, and how this is good for the health of growing children. Local and international dairy companies agree that a key to growth for dairy products is innovation, and revamping away from more traditional products.

Export Strategy for Processed Food – Cheese Action Plan
Paul Baker September 2007 15
Box A International investments in cheese production in MENA
Kraft Foods investment in Bahrain
Kraft Foods are investing $40 million in the development of a new facility in Bahrain for the production of cheese and powdered drinks to be exported throughout the Middle East region. The company stated that its decision to invest in Bahrain demonstrated its commitment to its consumers in the GCC and Middle East. According to the company the choice of Bahrain reflected the success of the Bahraini Government to create a favourable economic environment to attract foreign investment. According to Patrick Satamian, Managing Director of Kraft Foods GCC, "Bahrain offers an ideal environment in which Kraft can expand, having a central location with good communication links within the GCC and a rapidly developing business sector." Press reports indicate that the factory will produce 50,000 tonnes of cheese and TANG powdered beverages.
Sources: http://kraft-foods-news.newslib.com/story/2486-3234368/ http://www.bahraingateway.org/index.cfm?fuseaction=document.home&id=379
Bel opens second factory in Egypt In 2007 Bel Egypt opened its second factory in Egypt, promising to bring in new products as well as boost production for both local and export markets. The €20 million investment will make Egypt the country the company’s 3rd most important factory processing location after France and Morocco. Egypt is seen as a important location both for its domestic market and as a base for penetrating MENA markets; Bel Egypt has become an export hub for the Middle East and North Africa region with 70 percent of production bound for outside the country.
Bel also opened a production plant in Syria in 2005 producing 5,000 tonnes of cheese.
Sources: http://www.dailystaregypt.com/article.aspx?ArticleID=7824
Arla Foods activities in the Middle East Before the region wide boycott of the companies products, the Middle East represented the most important market outside Europe for Arla Foods. It operates its own production site in Saudi Arabia (Danya Foods), which produces processed cheese, milk and fruit drinks. Prior to the boycott the company had ambitious plans to expand production, transferring some production of processed cheese out of Denmark to Saudi Arabia. Further, Arla acquired the management rights for three agencies (Lebanon, Qatar and Kuwait) to have greater control over the increased volumes of products to be supplied to consumers in the region.
Sources: http://www.arlafoods.com/APPL/HJ/HJ202COM/HJ202D01.NSF/O/6C36EDA0F8F33253C1257068003ECB12 http://www.arlafoods.com/appl/hj/hj202com/hj202d01.nsf/O/6BAACEB4E622410CC1257068003ECE48

Export Strategy for Processed Food – Cheese Action Plan
Paul Baker September 2007 16
2.5. Trade patterns
2.5.1. Global trade patterns
The three dominant dairy trading areas today, as in the past, are the European Union (EU), Australia, and New Zealand. Australia and New Zealand, both with low-cost milk production and industries actively involved in international marketing, are prominent suppliers to the Asian markets for cheese and dry milk powders. The EU focuses on nearby traditional markets and North America, mainly exporting premium cheese. Product differentiation and consumer preferences play major roles in shaping global dairy product demand and trade flows. For example, all high-income countries import EU cheese. The largest dairy trade flow worldwide is cheese from the EU to the United States, even though milk production costs in the EU are higher than in the United States. Recent years have seen the arrival of important new suppliers that have been eating away at the EU’s global market share. In particular, Latin American suppliers from Argentina, Chile and Uruguay are entering into the North American market, particularly in Mexico. At the same time, Ukraine and Belarus are positioned as key suppliers into the Russian market. Figure 6 Cheese trade flows (>= 10,000 tonnes)24
24 Source: “Dairy Trade Offensive Interests”, Ecolait presentation, June 2007, available at http://ec.europa.eu/agriculture/events/foodexport2007/eucolait_en.pdf

Export Strategy for Processed Food – Cheese Action Plan
Paul Baker September 2007 17
Globalization has tended to emphasize the strength of multinational dairy firms. As international dairy companies recognize the prospects for demand growth around the world, they are repositioning themselves to produce and sell milk and milk products from multiple locations. Foreign investors find the United States, with its large domestic market, particularly attractive for this purpose. Foreign companies such as Nestlé, Unilever, Bongrain SA, and the Fonterra Co-op Group now have a significant presence in the U.S. market.
2.5.2. Gulf Region trade patterns
Table 8 shows details of imports of cheese by GCC Member countries for 2005. These data, which probably underestimate the total levels of trade25, suggest that the total volume of imports of cheese products in the Gulf in 2005 reached approximately 160 thousand tons, with a value of approximately $ 510 million. Major suppliers include traditional EU suppliers such as Denmark – although Denmark’s exports have been known to have been adversely affected by the boycott in 2006 – and France. Also evident are the Oceanic supplies (Australia and New Zealand), together with ‘newer’ EU Member States of the Czech Republic, Poland and Hungary; for which the latter two countries have enjoyed strong growth in recent years of their exports to the region. Table 8 GCC: imports of cheese and curd (HS 0406) in 2005
Import Volume Import Value Unit Price
Imports from Tons Share of Total $US thousand
Share of Total
$US per ton
Index (Total =
100)
Denmark 34,612 22 102,219 20 2,953 92 Australia 26,123 17 107,935 21 4,132 128 Egypt 18,385 12 32,603 6 1,773 55 New Zealand 14,859 9 44,719 9 3,010 93 France 11,292 7 49,125 10 4,350 135 Morocco 9,642 6 34,247 7 3,552 110 Poland 5,031 3 18,988 4 3,774 117 Czech Republic 4,643 3 12,961 3 2,792 87 Hungary 4,538 3 9,303 2 2,050 64 Turkey 3,766 2 10,408 2 2,764 86 Saudi Arabia 3,538 2 12,638 2 3,572 111 Netherlands 3,217 2 11,966 2 3,720 115 Germany 3,092 2 11,680 2 3,777 117 USA 2,016 1 6,751 1 3,349 104 TOTAL 157,701 100 507,918 100 3,221 100 Source: ITC and author’s calculations based on COMTRADE statistics
25 It should be noted that neither Kuwait nor UAE report data to COMTRADE, as is also the case for Egypt. Accordingly data for these countries is based on mirror estimates (i.e. from exporting countries). In the case of trade between these countries, as there is no data available on their bilateral trade the corresponding data is set to zero. This means, specifically, that Egyptian exports to Kuwait and UAE are not included in the data shown in the table. For information on Egypt’s exports to these countries see Section 3.2.

Export Strategy for Processed Food – Cheese Action Plan
Paul Baker September 2007 18
Egypt is shown as the third most important supplier to the region26, and further analysis of the underlying data indicates the very strong growth of Egyptian exports to the Gulf Region. However, it is noticeable that the average unit values of cheese imported from Egypt are the lowest of all the main source countries; these are estimated at only 55% of the average unit value for all cheese imports by GCC Member countries.
2.6. Global supply – demand balancing
As described in Sections 2.1 and 2.2, the global dairy sector has been under going a period of soaring prices. According to ABARE27 world cheese prices are forecast to be higher over the next two years. In 2007-08, world cheese prices are forecast to average US$2950 a tonne. Looking further ahead, continuing growth in cheese production and exports from major producers is projected to lead to cheese prices falling to US$2480 a tonne in real terms (2006-07 dollars) in 2011-12, about 13 per cent below the forecast 2006-07 average. Taking a longer term perspective, the joint OECD-FAO28 outlook foresees an increase in global cheese trade from slightly less than 1.5 million tons in 2007 to slightly less than 1.9 million tons by 2016. The outlook suggests that while export growth from Europe (Western and Eastern) will be highly constrained and be virtually zero for North America, strong export growth is forecast for the regions of Latin America, Oceania (Australia and New Zealand) and CIS. All regions are expected to increase imports, but particularly evident are large increases in imports in CIS (Russia), Latin America, and Asia & Pacific (including Japan and Korea). Although the analysis does not provide an assessment of bi-lateral trade patterns, it is indicative of a strengthening of some of the key trade flows shown earlier in Figure 6; notably with increase supply of the North American market (including Mexico) from Latin American exporters (Argentina and Chile), and strengthening of Ukrainian exports to the CIS (primarily Russia); although the increase in import demand in the CIS is expected to significantly outstrip the increase in the export supply within the region. Beyond this, the OECD-FAO figures would indicate a very important role (equivalent to an additional 170 thousand tons of exports) for Australia and New Zealand in balancing ‘excess’ import demand, notably in Asia & Pacific (including Japan and Korea) but, also, CIS and Africa.
26 Ibid, footnote 25. 27 Source: ibid footnote 10 28 Source: OECD-FAO Agricultural Outlook 2007-2006; outlook data available from OECD-Statistics: http://stats.oecd.org/wbos/Default.aspx

Export Strategy for Processed Food – Cheese Action Plan
Paul Baker September 2007 19
3. Egypt’s strategic positioning
3.1. Brief overview of the Egyptian cheese sector.
A brief overview of the dairy processing sector is provided in the IMC: “Food Export Strategy Report” (May 2006)29. According to this report, there are around 25 companies involved in the industrial processing and packaging of dairy products in Egypt. Of these, only 14 companies are members of the Dairy Industry Development Association (DIDA) and about 7 or 8 can be considered as significant players. Overall the private commercial sector (basically members of the DIDA) account for around 15 percent of production of dairy products. They have, however, made significant progress since the early 1980s and taken market share away from the public sector company. Total cheese production in Egypt is estimated to be around 500 thousand tons/annum (DIDA, 2005). The main categories are:
White Soft Cheese - traditionally named “Feta” cheese though not same as the famous Greek, goat and sheep milk Feta cheese- (est. 350 thousand tons in 2003), about 75 percent of which is produced from buffalo and cow milk in small unlicensed factories, specially around the Damietta area in the North East Delta
Semi-hard Romano Cheese - The total production is estimated at 70 thousand tons in 2004, mostly for local and Arab markets, also producing some Parmesan grated cheese for fast food market.
Processed cheese - Egypt has established itself as a major player in the processed cheese sector and is positioned as a regional hub in the global market and strongly integrated with the major international (French) companies in the sector30. Total production capacity is probably close to 150 thousand tons, and between half to three-quarters of actual production is exported. This level of production places Egypt in the same league as the major European processed cheese producers such as Germany and France31. The production of cheese ‘triangles’ has been one of the success stories of the Egyptian dairy sector and Egypt has established itself as the regional leader in this segment. Three of the major French cheese producers are present in Egypt: Bongrain (Mashreq des Produits Laitieres); Bel Group (Bel Egypte) and Lactalis (Best Cheese Company). In addition there is production of cheese blocks (mainly cheddar) and a growing production of mozzarella cheese mainly for Pizza chains and a small amount of specialized European style cheeses
Virtually all of the ingredients and most of basic packaging materials utilised in the production of processed cheese are imported. For the multinational and major local companies in the sector the key aspects of their competitive strength in export markets relate to a combination of maintaining good quality (and health) standards, brand and new-product development, and low production costs (notably labour).
29 “Food Export Strategy Study – PS137 – Final Report”, STEM-VCR, May 2006; the information in this report updates the description provided in the “Egyptian Processed Food Sector Review – Final Report” ECORYS-NEI, May 2005, also for IMC. 30 Bongrain (Mashreq des Produits Laitieres); Bel Group (Bel Egypte) and Lactalis (Best Cheese Company). 31 See Table 6 and Table 7 in Section 2.4.1.

Export Strategy for Processed Food – Cheese Action Plan
Paul Baker September 2007 20
Below the first tier of producers are a number of smaller players producing mainly for the domestic market and for export primarily to close neighbouring markets (especially the Gulf region).
3.2. Current export position
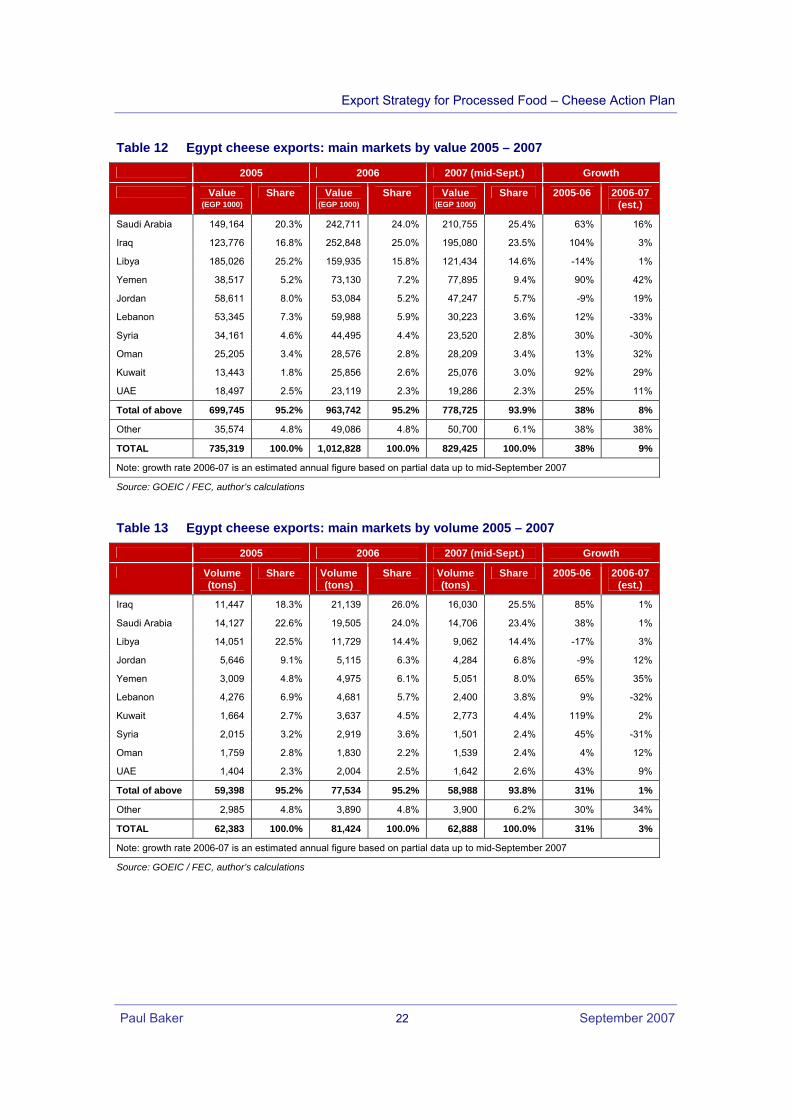
The strong recent performance of Egyptian cheese exports is illustrated in Table 9 and Table 1032. These data show that Egypt’s exports increased by 31% in volume and 38% in value between 2005 and 2006, reaching over 80 thousand tons and worth more than EGP 1 billion. On the basis of the data available up to mid-September, it appears likely that total cheese exports for 2007 will be around the level of 2006. In terms of the breakdown of cheese exports by category, the data are difficult to interpret. In particular, the data indicate sharply declining exports of processed, grated and powdered cheese. This does not accord with information from industry representatives that indicate that exports of processed cheese are continuing to expand and probably indicates, therefore, that these exports are being classified as ‘other’ cheese (HS 040690). For fresh cheese (HS 04610), the data suggest strong growth in 2006 but an apparent slump in exports in 2007; this information partly accords with industry analysts (see Section 2.4.3) that have noted the impact of the drop in raw milk supplies which appears to have had a stronger adversely affect on the production of artisanal cheese in Egypt and in turn may have led to some diversion of exports to the domestic market. Table 11 shows the average unit values of cheese exports. The overall picture indicates a modest overall increase in average unit values but this must be seen in the context of rapidly rising global prices for cheese, particularly in 2007 (see Section 2.1). In fact, available data up to September 2007 show falling average unit values of fresh cheese exports. The main markets for Egyptian cheese exports are concentrated among neighbouring countries (see Table 12 and Table 13); Saudi Arabia, Iraq and Libya together accounting for around two-thirds of exports. More broadly, the Middle East and North Africa accounts for the vast majority of Egyptian cheese exports (approximately 98% of all exports). Without a time series of export data, and given the large variations from year to year, it is not possible to give a clear picture of the geographical development of cheese exports. Nonetheless, it is noticeable that the share of exports to Yemen appears to be growing, while the shares to Lebanon and Syria are falling. There are virtually no exports to more developed markets (EU, North America, Japan)33, although there do appear to be some limited exports to South-East Asian markets (Taiwan, Vietnam). Over the last couple of years, however, there has been some tentative development of exports into sub-Saharan markets, including the COMESA countries. Excluding the already important markets of Libya and Sudan, exports to COMESA / sub-Saharan Africa can be expected to reach over EGP 15 million in 2007 32 Some data observations have been adjusted where there appears to be an incorrect correspondence between value and volume figures and/or where volume units are not provided. 33 Exports to Europe are minimal, at less than 40 tons per annum. Over the last two years exports to North America (USA and Canada) have been around 200 tons per annum. Exports to Japan have been small but appear to have increased in the current year to 80 tons.

Export Strategy for Processed Food – Cheese Action Plan
Paul Baker September 2007 21
(see Table 14 and Table 15), more than double their value in 2005. What is also noticeable is that the average unit values of exports to many of these countries are well above the levels for cheese exports as a whole. Table 9 Egypt cheese exports: value 2005 – 2007
Value (EGP thousand) Growth HS code
2005 2006 2007 (mid-Sept)
2005-06
2006-07
(est.)
Fresh cheese, including whey cheese and curd 040610 213,389 367,513 154,819 72% -44%
Grated or powdered cheese 040620 9,359 1,943 13 -79% …
Processed cheese, not grated or powdered 040630 82,105 3,356 0 -96% …
Other cheese (Cheddar, Colby, mixed, other) 040690 430,467 640,017 674,593 49% 41%
TOTAL OF ABOVE 735,319 1,012,828 829,425 38% 9%
Note: growth rate 2006-07 is an estimated annual figure based on partial data up to mid-September 2007
Source: GOEIC / FEC, author’s calculations
Table 10 Egypt cheese exports: volume 2005 – 2007
Volume (tons) Growth HS code
2005 2006 2007 (mid-Sept)
2005-06 2006-07 (est.)
Fresh cheese, including whey cheese and curd 040610 20,196 33,620 16,481 66% -35%
Grated or powdered cheese 040620 761 126 41 -83% …
Processed cheese, not grated or powdered 040630 5,966 223 0 -96% …
Other cheese (Cheddar, Colby, mixed, other) 040690 35,459 47,456 46,366 34% 30%
TOTAL OF ABOVE 62,383 81,424 62,888 31% 3%
Note: growth rate 2006-07 is an estimated annual figure based on partial data up to mid-September 2007
Source: GOEIC / FEC, author’s calculations
Table 11 Egypt cheese exports: average unit values 2005 – 2007
Ave unit value (EGP per ton) Growth HS code
2005 2006 2007 (mid-Sept)
2005-06 2006-07 (est.)
Fresh cheese, including whey cheese and curd 040610 10,566 10,931 9,394 3% -14%
Grated or powdered cheese 040620 12,292 15,456 … 26% …
Processed cheese, not grated or powdered 040630 13,761 15,081 … 10% …
Other cheese (Cheddar, Colby, mixed, other) 040690 12,140 13,486 14,549 11% 8%
TOTAL OF ABOVE 11,787 12,439 13,189 6% 6%
Note: growth rate 2006-07 is an estimated annual figure based on partial data up to mid-September 2007
Source: GOEIC / FEC, author’s calculations
Export Strategy for Processed Food – Cheese Action Plan
Paul Baker September 2007 22
Table 12 Egypt cheese exports: main markets by value 2005 – 2007
2005 2006 2007 (mid-Sept.) Growth
Value (EGP 1000)
Share Value (EGP 1000)
Share Value (EGP 1000)
Share 2005-06 2006-07 (est.)
Saudi Arabia 149,164 20.3% 242,711 24.0% 210,755 25.4% 63% 16%
Iraq 123,776 16.8% 252,848 25.0% 195,080 23.5% 104% 3%
Libya 185,026 25.2% 159,935 15.8% 121,434 14.6% -14% 1%
Yemen 38,517 5.2% 73,130 7.2% 77,895 9.4% 90% 42%
Jordan 58,611 8.0% 53,084 5.2% 47,247 5.7% -9% 19%
Lebanon 53,345 7.3% 59,988 5.9% 30,223 3.6% 12% -33%
Syria 34,161 4.6% 44,495 4.4% 23,520 2.8% 30% -30%
Oman 25,205 3.4% 28,576 2.8% 28,209 3.4% 13% 32%
Kuwait 13,443 1.8% 25,856 2.6% 25,076 3.0% 92% 29%
UAE 18,497 2.5% 23,119 2.3% 19,286 2.3% 25% 11%
Total of above 699,745 95.2% 963,742 95.2% 778,725 93.9% 38% 8%
Other 35,574 4.8% 49,086 4.8% 50,700 6.1% 38% 38%
TOTAL 735,319 100.0% 1,012,828 100.0% 829,425 100.0% 38% 9%
Note: growth rate 2006-07 is an estimated annual figure based on partial data up to mid-September 2007
Source: GOEIC / FEC, author’s calculations Table 13 Egypt cheese exports: main markets by volume 2005 – 2007
2005 2006 2007 (mid-Sept.) Growth
Volume (tons)
Share Volume (tons)
Share Volume (tons)
Share 2005-06 2006-07 (est.)
Iraq 11,447 18.3% 21,139 26.0% 16,030 25.5% 85% 1%
Saudi Arabia 14,127 22.6% 19,505 24.0% 14,706 23.4% 38% 1%
Libya 14,051 22.5% 11,729 14.4% 9,062 14.4% -17% 3%
Jordan 5,646 9.1% 5,115 6.3% 4,284 6.8% -9% 12%
Yemen 3,009 4.8% 4,975 6.1% 5,051 8.0% 65% 35%
Lebanon 4,276 6.9% 4,681 5.7% 2,400 3.8% 9% -32%
Kuwait 1,664 2.7% 3,637 4.5% 2,773 4.4% 119% 2%
Syria 2,015 3.2% 2,919 3.6% 1,501 2.4% 45% -31%
Oman 1,759 2.8% 1,830 2.2% 1,539 2.4% 4% 12%
UAE 1,404 2.3% 2,004 2.5% 1,642 2.6% 43% 9%
Total of above 59,398 95.2% 77,534 95.2% 58,988 93.8% 31% 1%
Other 2,985 4.8% 3,890 4.8% 3,900 6.2% 30% 34%
TOTAL 62,383 100.0% 81,424 100.0% 62,888 100.0% 31% 3%
Note: growth rate 2006-07 is an estimated annual figure based on partial data up to mid-September 2007
Source: GOEIC / FEC, author’s calculations

Export Strategy for Processed Food – Cheese Action Plan
Paul Baker September 2007 23
Table 14 Egypt cheese exports to COMESA
Value (EGP thousand) Volume (tons) Unit value (EGP / ton)
2005 2006 2007 (Sept.)
2005 2006 2007 (Sept.)
2005 2006 2007 (Sept.)
Libya 185,026 159,935 121,434 14,051 11,729 9,062 13,168 13,636 13,400
Sudan 4,508 1,676 2,202 275 98 125 16,400 17,104 17,600
Djibouti 1,008 1,213 956 55 63 51 18,431 19,275 18,609
Eritrea 0 … … 0 … … 478 … …
Ethiopia 7 … … 0 … … 20,001 … …
Kenya … 392 183 … 20 10 … 20,025 17,864
Madagascar 4,208 5,758 5,314 204 257 226 20,643 22,378 23,558
Malawi 4 … … 0 … … 9,532 … …
Mauritius 78 245 2,437 4 15 89 18,148 16,392 27,340
Seychelles … … 216 … … 9 … … 24,772
Uganda 13 6 … 1 1 … 13,251 10,961 …
Zambia 22 9 … 1 0 … 31,618 27,948 …
Zimbabwe … … 17 … … 2 … … 10,456
COMESA 194,875 169,234 132,760 14,591 12,183 9,574 13,356 13,891 13,866
COMESA (ex. Libya, Sudan) 5,341 7,623 9,124 266 356 387 20,114 21,435 23,593
Source: GOEIC / FEC, author’s calculations Table 15 Egypt cheese exports to ‘other’ sub-Saharan Africa
Value (EGP thousand) Volume (tons) Unit value (EGP / ton)
2005 2006 2007 (Sept.)
2005 2006 2007 (Sept.)
2005 2006 2007 (Sept.)
Angola … … 466 … … 38 … … 12,199
Benin 169 144 73 9 8 5 19,823 17,592 15,610
Cameroon … 322 122 … 41 8 … 7,896 15,297
Chad 4 22 … 0 1 … 9,630 28,250 …
Cote d'lvoire … 107 198 … 9 13 … 11,464 14,762
Ghana 290 115 138 19 6 12 15,319 18,656 11,194
Liberia 84 88 89 9 8 8 9,218 10,972 11,194
Mali … 317 … … 8 … … 38,829 …
Mauritania … 315 … … 43 … … 7,269 …
Mozambique 446 658 728 90 26 26 4,976 25,178 27,847
Senegal … 1,532 1,698 … 115 123 … 13,376 13,815
South Africa 1 829 835 0 38 33 3,057 21,911 25,520
TOTAL of above 993 4,449 4,347 127 303 266 7,834 14,672 16,324
Source: GOEIC / FEC, author’s calculations

Export Strategy for Processed Food – Cheese Action Plan
Paul Baker September 2007 24
3.3. Strategic issues
3.3.1. Scenarios for future development
As already noted, Egypt has already established an important position in the cheese sector, both in terms of the attractiveness of its domestic market and for export to the regional (‘Arab’) market. As noted in Section 2.4.3, the expectation is that the regional market for cheese will continue to expand strongly, which should provide the basis for continued expansion of Egyptian cheese production for both the domestic market and for export. For the natural cheese segment of Egyptian production that utilises local dairy production, the future prospects for production and export cannot be disassociated from developments in the domestic dairy sector. Here there is the underlying issue of switching from artisanal to commercial dairy and cheese production, for which the current momentum rests with the commercial dairy sector. Combined with changing demand patterns (e.g. urbanisation, health/safety/quality awareness, attraction to brands and new product) that favour commercial diary products, a continued shift away from artisanal cheese should strengthen the position of commercial producers in both domestic and (regional) export markets. One issue that remains uncertain is the possible impact of high (global) dairy prices on the development of the local dairy industry. As noted in Section 2, global prices for dairy products have risen very rapidly and the expectation appears to be that they will remain relatively high (compared to historical levels) for some time to come. If this turns out to be the case then - even if high prices act to dampen demand - it should a priori provide additional impetus for the development of the local dairy sector34. A high-demand high-price scenario for the dairy sector should encourage productivity and quality improvements in local milk production and, in turn, this should further favour development of commercial cheese production over artisanal production (as has already been seen – see Section 2.4.3). Moreover, even though high milk prices would provide a challenge for all natural cheese producers, they can be expected to have a more severe impact on those small scale producers at the lower end of the quality/price production segment. In the case of the processed cheese sector, as the sector relies on imported ingredients there is little connection between the sector and the domestic dairy industry. This situation is unlikely to change as it does not seem feasible that the Egyptian dairy sector could develop significant capacity for ingredients supply. One of the challenges, therefore, for the processed cheese sector is to manage production and supply in a period of high global prices for dairy ingredients. Higher costs for ingredients – of the magnitude seen over the recent past – will inevitably impact on prices to final consumer which may dampen the underlying growth in demand for cheese both in domestic market and export markets. At the same time, higher ingredients costs (for which prices are set in the global market) will tend to enhance the relative competitiveness of producers with more efficient and lower costs of production. Higher ingredient costs will also provide an
34 It is beyond the scope of this report to analyse the potential development of the Egyptian dairy sector. Assessment of the possible impact of high (global) dairy prices of domestic milk supplies would also need to accommodate considerations of the availability of land for dairy pasture and relative cost scenarios for fodder (cereals), etc.

Export Strategy for Processed Food – Cheese Action Plan
Paul Baker September 2007 25
additional incentive for producers to raise the level of value-added in their products, for example through quality improvements, product innovation, and brand development. As has already been witnessed, there has been a trend for multinational companies in high-cost countries to shift away from exporting processed cheese to localised production. Egypt has already been a beneficiary of this development and, given the expected short to medium-term development of the cheese market, appears well placed to attract further (domestic and international) investment in processed cheese production. In this respect, the main challenges faced by the sector appear to relate to maintaining Egypt’s cost competitiveness vis-à-vis possible alternative production locations in the region. A further challenge for strengthening Egypt’s attractiveness as a regional production hub for the processed cheese sector will depend on maintaining and expanding favourable access to existing and potential markets. The likely development path of the Egyptian cheese sector - as outlined above - would suggest that it may undergo a period of significant restructuring. The combination of a consumer base that is becoming more sophisticated, both in local and export markets, and high prices for cheese (and other dairy products) will mean that market conditions for ‘generic’ and low-quality cheese producers become increasingly difficult. Meanwhile, economies of scale and scope in commercial cheese production would suggest that a process of concentration of production is likely among the large and mid-sized companies, while leaving opportunities for smaller specialized high-quality producers. Overall, there are a range of possible scenarios for the future development of the dairy/cheese sector both globally and domestically and one clearly uncertain aspect is the sensitivity of the Egyptian cheese sector to different development paths for global dairy (and cheese) prices and for ingredient supplies (for processed cheese). Given the turbulence in global markets this is an area of analysis that should be considered in order to provide a coherent framework for assessing Egypt’s short to medium term export prospects. Issues to be addressed
What are the most realistic scenarios for global (and regional) developments in the markets for cheese products and in the evolution of prices for dairy products/cheese and ingredients? To what degree is the relative price/cost competitiveness of Egyptian cheese production influenced by changes in global market prices for cheese products and how sensitive are Egypt’s cheese exports to such changes?
To what extent are developments in the global market for cheese likely to affect the attractiveness of Egypt as a location for the production of cheese, and how might this affect Egypt’s potential to attract additional (foreign) investment into the sector?

Export Strategy for Processed Food – Cheese Action Plan
Paul Baker September 2007 26
3.3.2. Geographical market focus
As noted in Sections 2.4 and 2.5, global trade in cheese is dominated by Western Europe, Australia and New Zealand, with an increasing importance of Ukraine and Belarus as suppliers to Eastern Europe, and of Latin American suppliers from Argentina, Chile and Uruguay that are entering into the North American market. The position of these regions/countries is secured on the basis of significant dairy industries. Beyond these major supply regions/countries, the quantities of cheese trade internationally are relatively small and typically trade is undertaken only to close regional markets, reflecting a combination of factors such a trade barriers (tariff and non-tariff), differences in regional preferences for cheese products and the intrinsic perishable nature of the product. From the perspective of developing a strategic approach to Egypt’s exports of cheese, one underlying question is whether Egypt should content itself to cementing its position as a major regional hub supplying the MENA region, which (as described in Section 2.4.3) is expected to provide significant opportunities for growth? Or, alternatively, does Egypt have the ambition to seek out new market opportunities beyond the MENA region? This sub-section examines some of the issues facing Egypt in three geographical markets: MENA, developed countries (primarily Europe), and sub-Saharan Africa. Middle East and North Africa
As is clear from the analysis of Egypt’s exports of cheese (see Section 3.2), they are almost exclusively directed towards regional (‘Arab’) markets with three countries (Saudi Arabia, Iraq and Libya) accounting for around 65 percent of all exports. The strong growth of Egypt’s exports between 2005 and 2006 is indicative of a further strengthening of the country’s role as an important regional hub for cheese production and export and there appears to be a general consensus among commentators and industry representatives that the Egypt is well positioned to maintain and strengthen its exports to the MENA region, even though it will be necessary to keep an eye on possible increased interest in these markets from regional and global competitors. The combination of steady medium-term growth in global demand for cheese and strong growth in demand in MENA region, together with the expectation of limited (or even declining) growth in exports from the European Union and uncertainty over the capacity of Oceanic suppliers to raise production, suggest that there will be both significant opportunities within MENA35 region for export growth and, at the same time, that cheese prices will remain high in the medium-term. In the above context, the relatively low average unit values of Egypt’s exports compared to exports from other countries (see Section 2.5.2) indicates that Egypt is positioned as a low quality supplier to the Middle East / Gulf region36. Moreover, despite the rapid increase in global cheese prices, the average unit price of Egyptian exports of fresh cheese has actually been falling in 2007 (see Table 11). In this respect, as some
35 As noted in Section 2.4.3, relatively underdeveloped markets (e.g. Yemen, Iraq, Libya, Syria, and Iran) are seen as representing great potential. 36 Some caution is necessary since the low average unit values can, in part, be attributed to the fact that Egypt’s exports contain a relatively large proportion of low-cost ‘white’ cheese.

Export Strategy for Processed Food – Cheese Action Plan
Paul Baker September 2007 27
industry representatives point out, the position of Egypt’s exports are characterised by the following inter-related problems:
Poor image of Egyptian cheese as a whole, with ‘generic’ cheeses and some smaller brands identified as low-quality low-priced supplies;
Pricing approach of some producers that will accept below market prices simply to ensure export volumes;
Weak marketing position of some exporters in the face of relatively strong position of buyers in importing markets.
More generally, limitations on quality of local milk production for natural cheese places a constraint on the development of Egyptian product based on access to specialised/quality locally produced inputs and/or production techniques. This situation tends to push Egyptian producers towards either competing on price/cost (i.e. commoditised products) or – in the case of more successful/sophisticated producers - to investing in product innovation, though this requires access to the necessary technical and marketing capacity to develop and introduce sophisticated new products. With specific reference to Egypt’s exports of white cheese (and Mozarella), the Export Strategy Report (see Box B) makes a strong recommendation that Egypt should adopt a more brand orientated approach, particularly for white cheese. Such an approach would enable Egyptian white cheese to differentiate itself from similar products from other countries in the region, and if effectively implemented, generate consumer loyalty and provide a basis for raising prices (unit values) of Egypt’s exports37. Box B: ESR recommendations for a brand orientated approach for white cheese
Cheese & curd could benefit from a brand-oriented approach especially in White cheese (technically very similar) where a well-promoted brand could effectively differentiate a product and generate loyalty among the consumers. A brand and “trademark patent’ should urgently be started for Domiati, as it has been done with Feta by the Greeks. The Domiati brand could be a strong point of difference in the GCC where white cheese consumption is remarkable and rising and where no brand as so far appeared with a strong position in the market. The “trademark” process to promote Domiati POD (Protected Designation of Origin) could be started with one of the many specialized Intellectual Property Solicitors Bureau. The chances of obtaining a brand trademark Domiati look promising taking into account the successful precedent (similar) of Feta.
With regard to Europe, due to exorbitant cost of promoting brands, a trade marketing approach - with in stores promotion in the main hypermarkets – look more appropriate perhaps in a scheme jointly with the international cheese producers already present in Egypt and with deep know-how of the European market. In USA the potential of a Domiati brand should be tested with consumers and trade and quantified.38
The Mozzarella di Buffalo, this opportunity also probably requires a brand-promotional approach. Mozzarella of buffalo is a premium segment where quality and brand play an important role, the development of a trademark and logo would therefore be imperative in the product mix proposition. Again the process could be started with an industrial partner (i.e. cheese manufacturer in Egypt)
Sources: Export Strategy Report (“Food Export Strategy Study – PS137 – Final Report”, STEM-VCR, May 2006, for IMC)
37 The issue of developing a brand-orientated approach for Egyptian white cheese (Domiata) has been addressed under another assignment under the Trade Enhancement Programme (TEP-A). 38 See next sub-section for a discussion of export opportunities in ‘developed’ markets.

Export Strategy for Processed Food – Cheese Action Plan
Paul Baker September 2007 28
Overall, the medium to long-term scenario for general market conditions for cheese in the MENA region and, hence, Egypt’s export opportunities look largely positive. However, if Egypt is to take full advantage of these opportunities then the key issues for the industry appear to relate to strengthening the market position of Egypt’s exports so that – taken as a whole – it can move from low-price/quality to higher-price/quality product segments, particularly with reference to fresh cheese production and exports. On the one hand, this will require continued investment by cheese producers in quality improvements, product innovation, brand-development etc. On the other hand, it will be important that the overall ‘image’ of the Egyptian cheese sector is improved and, at the same time, that efforts to promoted the image and market position of Egypt’s cheese exports is not undermined by producers that continue to pursue strategies based on supplying low-quality, low-margin/cost products. In turn, this points to the need for the sector as a whole to accept a more strategic industry-wide approach to export behaviour.
Issues to be addressed
Raising the price (average unit value) of Egyptian exports and ensuring that Egyptian cheese exports achieve prices that reflect developments in global/regional cheese and dairy prices.
Enhancing the ‘Made in Egypt’ image for cheese products, in general, and developing brand orientated approach and trademark (POD) for Egyptian white cheese.
Strengthening product innovation and product marketing capacity.
Developed Markets (Europe, N. America, Developed Asia)
Currently, Egypt has very limited exports of cheese to more developed markets such in Europe, North America and the major developed economies in Asia (e.g. Japan and Taiwan)39. Moreover, given the current structure of global trade patterns (see Section 2.5.1) it seems unlikely that Egypt could position itself as a major supplier of cheese to either North America or Asia. On the one hand exports are limited by factors such as: transport distance/time and cost; low relative quality of Egyptian natural cheese40; and competition from major international producers/exporters (e.g. Latin America, Oceania). On the other hand, account needs to be taken of the highly distorted nature of cheese markets, particularly in Europe and North America, brought about through domestic agricultural policies in these regions and the maintenance of significant import barriers. With regard to the global pattern of trade in cheese, the major developed countries (Europe, USA, Canada and Japan) operate tariff rate quota (TRQ) systems41 under which quotas are set for a fixed amount of imports at a reduced (or zero) tariff. As imports outside the tariff rate quota tariff face much higher tariffs42 they are at a considerable competitive disadvantage relative to in-quota imports and, in essence, the 39 Exports to Europe are minimal, at less than 40 tons per annum. Over the last two years exports to North America (USA and Canada) have been around 200 tons per annum. Exports to Japan have been small but appear to have increased in the current year to 80 tons. 40 This does not necessarily reflect the quality of production processes utilized by Egyptian producers, but takes into account the fact that the quality of Egyptian milk supplies cannot attain the quality levels of major milk producing countries with more favourable climatic conditions and better dairy stock for producing high quality milk necessary for premium natural cheese production. 41 Application of a reduced tariff rate for a specified quantity of imported goods. Imports above this specified quantity face a higher tariff rate. 42 For example, the estimated ad valorum equivalent rate for EU tariffs on cheese imports are estimated at between 50 to 80 percent. Source: “The European Union’s Common Agricultural Policy: a stocktake of reforms”, Abare research report 07.13 (August 2007), available at: http://www.abareconomics.com/publications_html/crops/crops_07/EU_cap07.pdf

Export Strategy for Processed Food – Cheese Action Plan
Paul Baker September 2007 29
tariff quota systems can be used to manage the quantity of imported cheese without actually placing a fixed quota limit. As a consequence, unless there are specific ‘domestic’ problems of matching supply to demand, these systems tend to restrict outside quota imports to either high-value specialised cheeses or cheese destined for specific (ethnic) markets within the importing countries. The systems for operating and administering tariff quota systems vary and, in particular, differ in respect to the ways in which quotas are allocated to exporting countries (e.g. on historical basis or specific country allocations versus global access)43 but often appear to reflect and reinforce the existing global trade patterns (see Section 2.5.1). At the same time, the granting of tariff rate quotas has also been an element of the negotiation of bi-lateral trade agreements. In the case of the European Union, there are already precedents for the granting of country specific tariff rate quotas for cheese products. In the case of the EU, these have been granted not only to the Oceanic suppliers, Canada and other non-EU European countries but, also, under bilateral trade agreements (see Table 16). For example the EU-Chile Association Agreement granted a TRQ of 1,500 tons (rising over time) with no duty; the EU-South Africa Trade Development and Cooperation Agreement granted a TRQ of 5,000 tons (rising over time) at half duty; while the EU-Jordan Association Agreement allows for duty free imports of white cheese from sheep milk under an agreed tariff rate quota. By contrast, although the EU-Egypt Association Agreement provides for a tariff quota44 for EU cheese imports into Egypt there is no corresponding concession on the part of the EU. Table 16 Country specific tariff quotas for cheese applied by the EU
Country Type Quantity 2006 (tonnes) New Zealand Cheese for processing 4,000 Cheddar 7,000 Australia Cheese for processing 500 Cheddar 3,711 Canada Cheddar 4,000 Norway Jarlsberg, Ridder, Gouda, Edam, fresh, other 4,000 South Africa (a) Cheddar, Gouda, etc. 5,000 Turkey Kashkaval, etc. 1,500 Switzerland Cheeses other than Tilsit and some specified other cheeses 4,250 Chile (b) Cheese (not specified) 1,500 ACP countries Cheese (not specified) 1,000
Notes: a) 5,000 tons in 2000 rising by 5% a year. Unlimited in 2010 with no duty b) 2004, rising by 75 tonnes a year.
Source: ABARE45
As concerns the actual utilisation of TRQ’s for cheese products, for both the EU and USA the utilisation rates for tariff quotas for cheddar cheese are high (i.e. close to 100%) indicating a strong incentive for importers to utilise the TRQ access. By contrast, while USA utilisation rates are high for other cheese categories, historical data suggest that 43 For an in depth discussion of the operation of tariff rate quotas (TRQ) see: “Technical Issues Affecting Trade in Agricultural Products”, Rural Industries Research and Development Corporation (RIRDC) Publication Number 07/32, available at: http://www.rirdc.gov.au/reports/GLC/07-032.pdf 44 The TRQ is for 2,000 tons with a 50 percent duty reduction. 45 Source: ibid footnote 42
Export Strategy for Processed Food – Cheese Action Plan
Paul Baker September 2007 30
EU utilisation rates for TRQ for other cheese categories have been low46. However, as noted in Section 2, cheese prices have risen sharply and are expected to remain high for some time and this could act as an additional stimulus for cheese distributors, cheese processors, and the food service sector in the EU (and other developed countries/regions) to look harder for supplies from low cost producers. This may be particularly the case for the more ‘commoditised’ cheese types (e.g. cheddar, cheese for processing and pizza, etc.) or for categories where there are supply constraints in Europe (e.g. Buffalo Mozzarella47). Under the above scenario, exporters able to utilise the allowed TRQs have a considerable advantage that should better enable them to meet new opportunities in markets operating tariff rate quota systems. From the Egyptian perspective, if the cheese processing sector is to have serious pretensions to open up exports to the developed country markets then it should be pressing for the granting of TRQs from the EU (and other developed country markets). To achieve this outcome, in the first instance Egypt’s needs to promote its potential role as a strategic supplier of specific cheese-types (or price segments) for which there is excess demand. From this, it will need to work alongside potential partners/customers within these markets to jointly press for the granting of preferential access (TRQs) whilst ensuring that such requests are not perceived as having a destabilising impact on the market and the position of incumbent local suppliers. Such an approach would also need to take into account the potential implications within these markets and, hence, for Egypt’s export opportunities of other possible bi-lateral trade agreements48.
Issues to be addressed
Egypt’s access to developed country markets and the absence of tariff preferences. The cheese sector needs to pressure Egyptian government representative (trade negotiators) and EU representatives to extend Egypt’s preferential trade access to the EU to include cheese products.
Strengthen partnerships with importers in EU markets (including through existing multinationals present in Egypt) to lobby in support of granting preferential access for Egyptian cheese products.
Sub-Saharan Africa49
As noted in Section 3.2, over the last couple of years there appears to have been some tentative development of exports into sub-Saharan markets, in part stimulated by the COMESA trade arrangements. There undoubtedly is interest within the Egyptian cheese sector to investigate possible export opportunities within the COMESA countries and the rest of sub-Saharan Africa but the pattern of recent Egyptian exports indicates that the approach so far has been a rather opportunistic one, with significant exports only to a few countries such as Madagascar and Senegal (see Table 14 and Table 15). To all 46 Source, ibid footnote 43. It is not clear whether this reflects the fact that the EU nonetheless impose large in-quota tariffs on non-cheddar categories or reflects weak underlying demand for imports of these cheese categories. 47 This point is made in the report: “Food Export Strategy Study – PS137 – Final Report”, STEM-VCR, May 2006 48 If, for example, an EU-Mercusor agreement was concluded then the expanding South American dairy industry could be expected to push for enhanced EU market access which would in all likelihood further weaken the relative competitive position of Egyptian exporters. 49 For an overview of the dairy sector, trade position and status of the industry in sub-Saharan COMESA countries and EAC, see: “Regional Dairy Trade Policy Paper”, available at: http://www.dairyafrica.com/documents/Regional%20Dairy%20Policy%20Report%20-final.pdf. For information on the situation of the dairy sector in East and South Africa see the website of the Eastern and Southern Africa Dairy Association: http://www.dairyafrica.com/default.asp

Export Strategy for Processed Food – Cheese Action Plan
Paul Baker September 2007 31
intents, sub-Saharan Africa is a largely virgin market in terms of cheese exports (both from Egypt and elsewhere), although there is some presence in terms of exports (and limited production facilities) from the European multinationals and increasingly South American exporters. In terms of milk production, the major milk producers in Africa are Egypt, Sudan, Kenya and South Africa which collectively account for 52% of total milk produced in the continent50. Of these countries, however, only Egypt has any significant volume of cheese exports51. In the case of South Africa, production of cheese is around 82 thousand metric tons, but “South African Cheese”52 summarises the current export situation as follows: “Although a limited number of South African manufacturers have exported cheese to the European Union under the EU/SA Free Trade Agreement, South Africa is not yet a cheese exporting country with the result that most produce with only the domestic market in mind. Some smaller quantities do however find its way into a few African countries and Indian Ocean Islands on a regular basis.” It is difficult to evaluate the potential demand for dairy products in Africa, in general, and for cheese products, in particular. However, given the low per capita consumption of dairy products combined with growing demand and public health policies to promote consumption of dairy products, and the apparent shortfall between local dairy supply and underlying demand, it seems reasonable to conclude that there could be significant market opportunities. Further, given the general conditions in the region, from the perspective of Egyptian exports the potential opportunities can be expected to be almost exclusively for processed cheese (and some natural hard/semi-hard cheese) as existing supply/distribution chains are not seen to be suitable for handling fresh cheese. Industry representatives point to the need for better information on markets in sub-Saharan Africa, together with collective efforts to promote Egyptian cheese in order to create consumer awareness of the Egyptian product. Nonetheless, given the experience of Egyptian producers in developing products suitable for conditions in which cold-chains are relatively poorly developed and where consumer incomes are limited, Egypt should have an additional advantage (beyond competitive price/cost and trade agreement preferences) in developing export opportunities in these markets. Moreover, given the absence of any other significant cheese producing country on the African continent, Egypt appears to be well situated to build on its position as a cheese production hub for MENA and extend its presence as a supplier to sub-Saharan Africa53. At the same time, developing the sub-Saharan market may require addressing other specific issues that have been raised as potential concerns such as availability of suitable transport/logistics for exports and access to necessary banking/financial infrastructure in export markets. Overall, the volumes of cheese being imported into individual sub-Saharan country markets are small in global terms, and the current pattern of Egyptian exports to the region cover a relatively disparate collection of countries. Therefore, from a more
50 Source: “Dairying in Africa - Status and recent developments” O A Ndambi, T Hemme and U Latacz-Lohmann, available at: http://www.cipav.org.co/lrrd/lrrd19/8/ndam19111.htm 51 In this context, Morocco should also be mentioned as an important exporter of processed cheese; in 2006 Morocco exported approximately 26 thousand tons of processed cheese, with a geographical market spread very similar to that of Egypt. 52 See: http://www.cheesesa.co.za/index.htm 53 In this respect, it may be necessary to evaluate what possible constraints may be placed on Egyptian cheese producers as a result of licensing/franchising arrangements with multinational dairy/cheese companies that may place restrictions on the geographical markets they are able to serve.

Export Strategy for Processed Food – Cheese Action Plan
Paul Baker September 2007 32
strategic perspective, Egypt could follow a market development approach based on accommodating the needs of multiple small markets. This approach would aim to achieve overall significant volumes of exports through a broad geographical spread of exports that may consist of relatively small quantities to individual markets. Such an approach would probably require emphasising adaptability/flexibility to different individual market conditions combined with efficient and effective logistics/transport operations, and the identification and support for locally-based distribution networks.
Issues to be addressed
The severe shortage of market information available to Egyptian exporters on markets in sub-Saharan Africa.
Development of products suitable to meet the nutritional requirements and income constraints of consumers and suitable for local distribution systems.
Informing and raising awareness among consumers/distributors of Egyptian cheese products.
3.3.3. Other issues
Through the analysis of the ESR and on the basis of consultation with industry representatives in Egypt, a number of other issues have been raised with regard to Egypt’s export potential in the cheese sector. These are outlined below. Packaging
Although there appears to have been an improvement in the services provided by local packaging suppliers servicing the cheese sector, the sector is faced by rapidly rising prices for (imported) packaging materials. With the exception of glass, for which there is some local supply, most packaging materials are imported. Particularly for products that are sold in small size units, the cost of packaging can form a substantial part of the overall cost of the final product, meaning that even if actual products can be produced for a very competitive price, overall competitiveness can be reduced through relatively high price of packaging. This affects both the competitiveness of ‘commercial’ cheese producers in the domestic market and also vis-à-vis exports from producers that have access to cheaper source of packaging materials. Though it is beyond the scope of this report to analyse developments of the packaging sector (locally or globally), and though it is clear that Egypt is not in a position to develop indigenous supplies of paper-based packaging materials, for the longer term it may be worth considering whether Egypt is capable of developing its petrochemical industry/resources to provide a local supply of packaging materials. Workforce development (export marketing)
Although there do not appear to be specific constraints within the cheese/dairy sector for obtaining necessary support to perform (and/or train) technical and management functions related to production activities54, concerns have been raised about the shortage of workers with appropriate skills and experience to undertake (strategic) export development functions. This has resulted in a situation in which there is a
54 At the same time, some comments have been raised about the need to instil in the Egyptian workforce a quality orientated work-culture, and to bridge the gap between relying on outside (foreign) technical support to developing ‘in-house’ expertise.

Export Strategy for Processed Food – Cheese Action Plan
Paul Baker September 2007 33
premium to securing the services of suitably trained export development staff, with companies ‘poaching’ skilled personnel from each other. Transport & Logistics
Although there appears to be a general consensus that there have been improvements in international transport and logistics services available to exporters, and also with the general performance of customs procedures etc., there are still some problem areas. The transport connections and physical access for shipping to East Africa has been mentioned as a possible constraint on taking advantage of opportunities resulting from Egypt’s membership of COMESA, as there is a shortage of regular connections between Egypt and ports on the east coast of Africa. Support Services (public sector)
With regard to industry level support service provided through public sector or quasi-public organizations, the following issues have been raised:
Limitations in the capacity of national research infrastructure, in particular with regard to the capacity to provide information to cheese producers on new technological developments.
Severe market information shortages: companies face considerable difficulties in obtaining reliable information on potential market opportunities outside of their ‘normal’ export area, with specific reference being made to the lack of information on sub-Saharan Africa. In this respect, it is felt that the capacity of Egypt’s foreign commercial services should be strengthened to better provide exporters with market information relevant to the food sector.
Matchmaking activities: although there appears to be a consensus on the usefulness of IMC’s support for participation at international trade events, the level of preparation of participating companies is regarded as low, with many of them taking a reactive rather than pro-active approach to matchmaking activities. This, in part, can be seen to be related to the information shortages that companies face in assessing and identifying market opportunities and, hence, developing a plan for building contacts with relevant importers/distributors.
Industry Association
Currently there is no effective forum for cooperation and information sharing among exporting companies in the cheese sector. This has obvious disadvantages in terms of developing a collective approach and strategy for developing Egypt’s cheese exports. Among the areas where a collective voice and approach could be useful are inter alia:
Developing a general ‘code of practice’ for cheese exporters: this could address issues such as setting minimum prices for cheese exports, and developing industry positions with respect to strong customers/distributors in key markets55.
Sharing information on potential new market opportunities (e.g. COMESA/Africa) and developing joint marketing and promotion activities for Egyptian Cheese in response to these opportunities.
55 To paraphrase the comments of industry representatives, the main competitor for Egypt’s cheese exports is Egypt itself, since some producers are prepare to accept below market prices in order to secure export volumes even if this is detrimental to cheese exports as a whole and to the general ‘image’ of Egyptian cheese products.

Export Strategy for Processed Food – Cheese Action Plan
Paul Baker September 2007 34
Addressing issues such as branding of Egyptian cheese (for example in the case of the development of a Protected Designation of Origin - POD- for Domiata cheese)
Issues to be addressed
Improving local supply of packaging materials. Improving availability and expertise of export development staff. Improving transport availability to sub-Saharan Africa. Improving market information availability (especially for sub-Saharan Africa). Improving technical support services. Improving intra-industry cooperation and collaboration.
Export Strategy for Processed Food – Cheese Action Plan
Paul Baker September 2007 35
4. Outline cheese export ‘action plan’
4.1. Current situation
To date, there is no clearly defined industry-wide strategy or action plan for Egyptian cheese exports. Moreover, there is currently no recognisable overall strategy for development of the cheese sector as a whole. It is not the purpose of this report to propose such an overall strategy, but it is evident that such a strategy should form the framework for development of an export ‘action plan’. In fact, such an action plan is (or at least should be) one element – albeit an essential one – within the overall strategy for development of the cheese sector. In turn, an improved export performance can be seen as one of the key outcomes of an industry wide development strategy. In this respect, all actions undertaken to improve the cheese sector throughout the entirety of the supply chain from dairy production (for natural cheese) and ingredients supply (for processed cheese) to final consumer can be seen as integral to an action plan for cheese exports. Developing a coherent strategy for the sector as a whole and for exports implies willingness on the part of the sector – or at least some segments of the sector - to accept a cultural shift away from currently observed ‘opportunistic’ export behaviour towards a more strategic approach. In turn, if this strategic approach is to contribute to improvements in export performance, then there must be willingness for greater cooperation within the sector and between the sector and relevant institutions and other stakeholders, particularly in sharing knowledge and information and allowing others to benefit from the experience of successful exporters. As mentioned in Section 3.3.3, there is no effective forum for cooperation and information sharing among exporting companies in the cheese sector. A first step in developing an ‘action plan’ for promoting Egyptian cheese exports would, therefore, be the creation of a sector-level association that would define and articulate strategic priorities and to oversee implementation of the ‘action plan’
Recommendation 1: Cheese Exporters Association / Consultation Group
Creation of a cheese exporters association / consultation group to inter alia: define and articulate strategic priorities and oversee implementation of a cheese export ‘action plan’; identify, analyse and develop industry position/policy on key issues that affect the competitiveness and market access of cheese exports; develop and monitor observance of an export ‘code of practice’.
4.2. Strategy development: defining, agreeing and aligning priorities
As noted above, a strategic framework for development of the cheese sector has not been articulated to date. An outline strategy was developed in 2004/2005 as part of the Food Sector Review (FSR), which emphasized inter alia the following issues to be addressed:

Export Strategy for Processed Food – Cheese Action Plan
Paul Baker September 2007 36
Lack of supply good quality milk in sufficient quantity → establishment of milk producers groups and assist them in establishing milk collecting and cooling centres, encourage contract supply of milk (milk producers groups and industries)
Highly fragmented dairy sector without specialization → clustering of small milk processors (cheese makers) to collectively use raw material, packaging facilities, and to assist them in finding assured market outlets through contracting with retailers and exporters.
Low level of marketing compared to European cheese makers → continuous marketing strategy should be developed to maintain Egypt’s share of the Arabian market; while an aggressive strategy must be developed to European and North American market.
As described in Section 1.1, the third point above was picked-up and expanded in the Food Export Strategy Report (ESR), while extra attention was given to the importance of imported ingredients for the processed cheese segment and the need to maintain the export rebate system. This document will not address the issue of overall strategy development of the cheese sector, though clearly this should be articulated in order to provide an overall framework/context for an export strategy for the sector. The key elements of the strategy development phase (both for the sector and for export development) should nonetheless cover56: Development of an overall sector strategy defining objectives, activities and results
for the long term sustainable development of the cheese sector. Development – within the context of the overall cheese sector development strategy
- an export strategy defining objectives, activities and results for the long term sustainable expansion of cheese exports.
Consensus building to ensure support within the cheese industry (and relevant stakeholders) for the priorities, activities etc. proposed in the sector and export strategies.
Development and implementation of an operational plan (action plan) for the effective and efficient implementation of the sector and export strategies.
Recommendation 2: Cheese sector development and export strategy
Develop an overall sector strategy defining objectives, activities and results for the long term sustainable development of the cheese sector. This would include analysis of the current and future situation of the local and international cheese industry and identify priority areas to be addressed to enhance competitiveness and deliver sustainable growth of the sector.
Develop – within the context of the overall sector strategy - an export strategy defining objectives, activities and results for the long term sustainable expansion of cheese exports. This would include identifying and prioritising strategic options for a sustainable expansion of cheese exports and identifying priority areas to be addressed to deliver this expansion.
Develop consensus and support within the cheese/dairy industry (and relevant stakeholders) for the priorities, activities etc. proposed in the sector and export strategies.
56 These activities are described (in the context of the olive oil sector) in the parallel report “Food Processing Export Strategy, olive oil – action plan”.

Export Strategy for Processed Food – Cheese Action Plan
Paul Baker September 2007 37
Develop and implement an operational plan (action plan) for the effective and efficient implementation of the sector and export strategies.
4.3. Overview of key issues and action areas
Within the current report (this document) a number of issues have been raised that could be addressed as part of an action plan for enhancing the performance of Egypt’s cheese exports. The following sub-sections set out some recommendations for actions that could be taken to address some of the issues raised. In so doing, the proposed actions focus on actions/activities at an industry-wide level, which presupposes at least a minimum degree of cooperation among companies within the sector and between the sector and other relevant actors and stakeholders.
4.3.1. Assessment of future prospects and scenarios for the cheese sector
Section 2 of this report provides a brief overview of the global context and developments of the dairy and cheese sector. However, it is evident from this analysis that the dairy sector is evolving rapidly and that supply and demand conditions are subject to significant short-term and structural factors, which have led to the recent escalation of prices. Further, as pointed out, the trend to towards further concentration and globalisation of the dairy industry, and greater differentiation of dairy products, is expected to make trade projections increasingly complex and dependent on dairy firms’ cost structure, production and marketing strategy57. At the same time, there does not appear to be either any international or domestic assessment of Egypt’s position and prospects in the evolving global (or regional) dairy/cheese market (see, also, Section 4.3.3). This report (current document) has hopefully provided some insights on Egypt’s position and prospects but it is evident that a more in-depth evaluation is required. For example, there is a great deal of uncertainty as to the possible impact that different scenarios for the evolution of dairy prices would have on the relative price/cost competitiveness of Egyptian cheese production and how, in turn, this may influence the relative attractiveness of Egypt as a location for cheese production/foreign-investment. In this context, and given the need to articulate a clear strategy for development of the cheese sector and cheese exports, it would undoubtedly be useful that an in-depth evaluation is made of future prospects and scenarios for the Egyptian cheese sector that integrates both global and local developments and recognises that Egypt has now become an important player (at least in the regional) in the cheese market. This would assist the sector as a whole, and individual companies, to develop longer-term and more strategically orientated export-marketing strategies. In the first instance, such analysis should be integrated into the preparation of a cheese sector development and export strategy (see: Recommendation 2) and, subsequently, form part of ongoing monitoring and analysis of developments in the cheese market (see Recommendation 4). In practical terms, implementing an in-depth evaluation would
57 Ibid, footnote 13

Export Strategy for Processed Food – Cheese Action Plan
Paul Baker September 2007 38
probably require the expertise of specialist (international) sector consultants/ researchers58.
Recommendation 3: In-depth assessment of future prospects and scenarios
Undertake an in-depth assessment of future prospects and scenarios for the global, regional and local development of the dairy/cheese sector, tailored to matching Egypt’s potential to different market opportunities (regions, product-segment, etc.) and to analyse the impact of different scenarios for the development of supply and demand conditions and price movements on the export competitiveness and investment attractiveness of Egyptian cheese production.
Integrate analysis of future prospects and scenarios into the cheese sector development and export strategy and ongoing provision of market monitoring and information services.
4.3.2. Enhancing awareness and information on international markets
Egypt’s exports of cheese products are almost exclusively targeted towards the MENA region and there appears to be only limited availability of information and knowledge among cheese producers of opportunities that may be present outside of this market. In general terms, improving information on international market developments in the cheese sector, together with information on the requirements of different markets and ‘best-practice’ for exporting to these markets, would serve to enhance and improve export marketing. Sub-Saharan Africa provides one example where this is the case, with Egyptian companies pointing to the lack of information on markets and developments in the region. In this context, there is a need to develop ‘services’ to monitor developments in the global cheese market, to provide information to assist companies to identify export opportunities and, in those regions of specific interest to exporters, to provide relevant market information. Notwithstanding the availability of commercially provided market research, the development of a structure for provision of relevant sector/market information services will require identifying a ‘service provider’, allocation of resources, prioritisation of information needs, and the development of networks for the supply of relevant information. Currently, there appears to be no obvious organisation that could take the lead in initiating the creation of such a structure59.
Recommendation 4: Market monitor and information service
Develop and implement an international cheese sector monitoring and information service to provide information to cheese exporters (and other interested parties) on developments in the international cheese market; including inter alia: Global, regional and market-specific developments in cheese supply and demand situation and
forecasts, trade flows and price movements. International cheese sector/industry development and export/marketing strategies and initiatives,
business strategies, supply chain/value-added organization and development, export facilitation etc.
Relevant developments in international trade negotiations and market access issues (e.g. tariffs,
58 E.g. specialist market research companies; it may also be the case that these could be identified via the major international cheese producers already present in Egypt. 59 Possible candidates may include: Expolink, Egyptian Export Promotion Centre, Food Export Council, etc.

Export Strategy for Processed Food – Cheese Action Plan
Paul Baker September 2007 39
technical barriers to trade/standards, transport and logistics). Technical developments (international): technologies, innovation, research and development etc.
4.3.3. ‘Image building’ and awareness raising
Enhancing awareness and Egypt’s production and export potential
The modern commercial cheese producing sector is a relatively young industry that has developed rapidly and it is perhaps for this reason that - beyond industry ‘insiders’ - Egypt’s position as a major cheese exporter is not widely recognised60. However, with exports of 80 thousand tons in 200661, in volume terms Egypt’s exports exceeded those of many of the ‘leading’ cheese exporting nations; for example: USA (72 thousand tons), Switzerland (51 thousand tons), Ukraine (50 thousand tons)62. A programme designed to enhance international (and domestic) awareness of Egypt’s production and export potential could serve multiple purposes:
FDI attraction: there is already an important presence of foreign multinational companies in Egypt and the performance of the cheese sector in expanding production and exports is evidence of Egypt’s competitiveness, particularly in processed cheese. Increased investment in the sector would have obvious spin off benefits in terms of upgrading (in the case of mergers and acquisitions) and expanding production facilities, and in increasing employment in what is a relatively labour intensive sector.63
Export marketing: the medium term outlook is for a substantial expansion of global dairy/cheese demand64 and enhancing awareness of Egypt’s export potential both to customers/distributors and final consumers in ‘new’ markets is a key challenge if Egypt is to take full advantage of these opportunities. Raising the general profile of the cheese sector in Egypt (e.g. through industry marketing and promotion campaign(s)) would complement the efforts of individual exporters to increase awareness among potential clients.
Market access: particularly with reference to more ‘developed’ markets, access is subject to tariff rate quotas that significantly distort the relative competitiveness of imports from different countries. Raising awareness of the cheese sector’s export potential both with domestic and foreign representatives engaged in trade/market-access negotiations could serve firstly to support placing cheese export issues on the trade agenda and afterwards to support negotiations for granting of preferential access.
60 It should also be pointed out that Egypt does not report trade data to the UN COMTRADE database, which is one of the major sources for internationally comparable trade data. Further, for example, FAO and OECD estimates appear to considerably underestimate Egyptian cheese exports. 61 See Table 10. 62 Source: ITC based on COMTRADE statistics for 2006. 63 The issue of foreign investment attraction (in the context of the processed food sector as a whole) is addressed in the parallel report “Food Processing Export Strategy, Foreign Direct Investment Action Plan”. The cheese sector could well serve as one of the segments of the food processing sector that could be prioritized in developing an ‘investment value proposition’ for FDI attraction. 64 Import demand is expected to strong in regions where Egypt already has a strong presence (Middle East, North Africa) but also in regions where Egypt has virtually no visibility (East Asia, CIS). At the same time, if market access issues can be addressed, opportunities may even arise in some product segments – particularly for low cost suppliers of more commoditised products - within traditional major cheese production/supply regions (Europe, North America).

Export Strategy for Processed Food – Cheese Action Plan
Paul Baker September 2007 40
Upgrading and promoting the ‘image’ of Egyptian cheese
The evidence from the comparison of the unit prices of Egypt’s cheese exports compared to those of other exporting countries indicates that overall Egypt is positioned as a low cost supplier of cheese products. Although being a low cost producer clearly conveys a competitive advantage, the fact that even in well-established export markets Egypt’s cheese exports achieve prices (unit values) that are significantly below those of its competitors suggest that there is significant scope for raising the value-added in its products. On the one hand, it may be that the low unit values of Egyptian exports reflect genuine differences in the quality of Egyptian products, in which case raising the value-added in Egyptian cheese exports cannot be abstracted from the development of the supply chain as a whole, and efforts of companies to raise the quality of production and develop innovative products. On the other hand, there seems to be a strong opinion that there is an ‘incorrect’ perception among buyers and consumers in export markets of the quality of Egyptian products. The fact that exporters as a whole suffer the negative consequences of this ‘image deficit’ suggests that, in addition to the marketing/branding activities of individual companies, there is scope for an active programme to promote the image of Egyptian cheese. As noted in Section 3.3.2, it has already been proposed that Egyptian white cheese could benefit from the development of brand-orientated approach that would integrate the utilisation of a ‘protected designation of origin’ (POD) for Domiata cheese. Such a proposal could be integrated in a more general sector-wide marketing effort for promoting the ‘image’ of Egyptian cheese. Image building approach and sector marketing strategy
It is beyond the scope and competence of this report to go into detail on possible ‘image building’ approaches. Nonetheless, from the preceding discussion, different target groups for image building activities can be identified depending on their relationship to the cheese sector (consumers, distributors, importers, producers/investors, government etc.) and geographical location (existing markets (MEDA), ‘developed’ country markets (EU, etc.), potential markets (Africa, Asia, etc.). Furthermore, a distinction can be made between promoting the cheese sector per se (e.g. competitiveness, investment attractiveness, export potential, etc.) and promoting the products of the Egyptian cheese sector. These different target groups need to be identified and prioritised, with appropriate marketing strategies developed for these groups65. On the basis of prioritise targets, various actions can be envisaged under the heading of ‘image building and awareness raising’, for example:
65 For example, if the export strategy is focused on developing Egypt’s position as a production location for ‘buyers own label’ cheese or generic ‘commoditised’ cheese for further processing then it may not be necessary to develop actions to promote final consumer awareness of Egyptian cheese products. Rather, the focus will be on achieving strategic relationships with ‘intermediate’ customers (e.g. further processors, food service and food manufacturers, and major retailers with ‘own’ brand products etc.) and promotion of ‘Egypt brand’ to this customer group. In turn, where Egypt seeks to position itself as a strategic partner, this may lead to an emphasis on strategies that focus on developing the industry’s investment readiness (i.e. to attract investment interest to pursue partnership with or acquisition by large global players) and establishing positions of influence in major global supply chains. By contrast, if the focus is on exports of Egyptian products directly into high-quality final consumer market segments – with more sophisticated consumers – then creating final consumer awareness and individual product brand image will be essential.

Export Strategy for Processed Food – Cheese Action Plan
Paul Baker September 2007 41
Sector information service (web portal): to provide an easily accessible point of information to potential commercial partners (and their intermediaries) on the Egyptian cheese sector (e.g. supply/value-chain, products, enterprises, export capacity etc.);
Sector promotion and marketing information: to provide exporters and other stakeholders with common marketing and promotional materials (to use alongside company specific information). This should serve also to provide a more unified market image/profile of the Egyptian cheese sector enabling potential commercial partners to have a better and realistic understanding of the capacities (strengths, weaknesses) of the sector.
Product specific promotion and marketing: to strengthen the ‘image’ and ‘branding’ of specific types of Egyptian cheese (e.g. white/Domiata cheese).
Joint-sector promotional activities: to enhance cooperation and collaboration within the Egyptian cheese sector in their marketing/promotion activities. Building on the above, this should aim to increase efficiency and effectiveness through improved targeting of activities (in line with strategic priorities), cost-sharing, etc. and better coordination so as to establish a clear market positioning of the Egyptian cheese sector.
Recommendation 5: Image building and awareness raising
Develop an overall sector marketing strategy that identifies and prioritises target groups and their information requirements etc., and defines joint (sector-level) marketing strategies for different target groups.
Options (illustrative)
Consumer orientated marketing for “Egyptian Cheese” targeted towards final consumers in existing (MENA) markets; emphasis on highlighting aspects such as quality/taste, innovative products, etc.
Marketing orientated to final consumers and distributors in ‘new’ markets (e.g. sub-Saharan Africa) to promote “Egyptian Cheese”; emphasis on highlighting aspects such as health/nutrition values, relative cost efficiency, etc.
Marketing orientated towards ‘intermediate’ customers (e.g. further processors, food service and food manufacturers, and major retailers with ‘own’ brand products etc.); emphasis on aspects such as production capacity/quality, cost competitiveness, etc.
General program to promote awareness both domestically and internationally of the Egyptian cheese sector; emphasis on growth performance (production and export) and potential, cost competitiveness and investment attractiveness, etc.
4.3.4. Export market diversification
Egypt’s exports of cheese are highly concentrated in the MENA region. This limited geographical spread of exports is unsurprising given the pattern of trade flows within the cheese sector but could expose the cheese sector to some vulnerability in the event of unfavourable developments in the region. Moreover, as noted, the average unit values of

Export Strategy for Processed Food – Cheese Action Plan
Paul Baker September 2007 42
Egypt’s exports to the region are relatively low when compared to those of Egypt’s competitors. ‘Developed’ markets
With regard to ‘developed’ country markets, discussion of expanding Egypt’s exports goes hand-in-hand with discussion of trade preferences (see Section 3.3.2). If the cheese sector in Egypt wishes to secure access to these markets then in all probability it will require negotiation of tariff rate quotas (TRQs). This means that pressure will need to be exerted by the cheese industry in order to place discussion of trade preferences for Egyptian cheese exports in ongoing or future (bi-lateral) trade negotiations. At the end of the day, even though the actual size of quotas may be limited, the granting of TRQs could provide a bridgehead for Egyptian cheese exports into markets (e.g. EU, USA, Japan, etc.) that are currently to all intent ‘closed’. In the first instance, a more detailed assessment of the situation is necessary (see: Recommendation 3) in order to identify whether - given timings and agendas for possible future trade negotiations – Egypt can have feasible expectations possible of securing preferential access for its cheese exports to these markets. Nonetheless, taking in to account the recent development of the Egyptian cheese sector and current expectations for the future development of global cheese trade, it would seem that now is a propitious time for the cheese sector to explore such possibilities.
Recommendation 6(a): Market diversification - ‘developed’ countries
Undertake a detailed assessment of the prospects and potential implications for the Egyptian cheese sector of securing market access concessions (preferences) to the major developed country markets (especially the EU).
Develop and implement an industry-level strategy to support the inclusion of tariff quotas for cheese in the Egyptian trade negotiations.
‘New’ markets
Going beyond Egypt’s traditional exports to MENA (and possibilities in ‘developed’ markets) the current turbulence in the global cheese market means that export opportunities could arise in a wide variety of possible regions/countries. Mention has been made of strong demand in Asia and Eastern Europe, but also Latin America. Much of this demand is expected to be met by continued expansion in domestic dairy industries (for example in China, India, and Argentina) and the reinforcement of emerging intra- and inter-regional trade flows. In this context, it is not possible to clearly identify ‘new’ markets that may be prioritised as export targets for Egypt (see Recommendation 3). From a geographical perspective, a logical direction for Egypt to explore is the development of cheese exports to sub-Saharan Africa. Access has already been facilitated through the COMESA agreement and Egypt is already positioned as the largest cheese exporter on the continent. Furthermore, despite the fact that sub-Saharan Africa is typically regarded as a low income market, and account needs to be taken of the fact that export volumes from Egypt to the region are small, it is nonetheless the case that the average unit values of Egyptian cheese exports to the region are on

Export Strategy for Processed Food – Cheese Action Plan
Paul Baker September 2007 43
average significantly higher than for exports to the MENA region (see Table 14 and Table 15)66. Developing an industry-wide strategy for enhancing Egypt’s exports to the sub-Saharan region would cover a number of facets:
Improved market monitoring and information: (see Recommendation 4); Image building and awareness raising: to promote consumer and distributor
awareness of Egyptian cheese (see Recommendation 5);
Product development: to develop products adapted to local tastes, nutritional requirements, income levels and distribution chains;
Supply chain development: to identify and where necessary assist in the development of appropriate supply and distribution chains (e.g. transport, logistics, and local distribution).
Given the difficulties in obtaining information on many markets in Africa, the limited development of the market for cheese, and the lack of consumer/distributor awareness of Egyptian cheese, it seems almost self-evident that a coordinated approach to developing market opportunities in the region would be more efficient and cost-effective than if each individual company interested the region where to act independently. Furthermore, sharing information and experience among companies that have already ventured into these markets and those that may be interested in entering the market could have an overall positive effect without necessarily being detrimental to the interests of individual companies. Also, there would appear to be an important role that could be undertaken by the commercial services of the Egyptian public authorities present in the region, both as a source of obtaining market information and in facilitating image building and awareness-raising of Egyptian cheese and in the development of commercial links between Egyptian exporters and local consumers (e.g. support for matchmaking activities).
Recommendation 6(a): Market diversification - ‘new’ countries/markets
Develop and implement an industry-level strategy to diversify the geographical spread of Egyptian cheese exports.
Develop and implement an industry-level ‘action plan’ for prioritised export markets
Action plan (illustrative)
Develop market information system (see Recommendation 4) Develop image building and awareness raising campaign (see Recommendation 5) Assessment of market requirements and programme of product development Assessment of supply chain requirements and development Network development and institutional linkages
66 For example the average unit values of exports to COMESA countries (excluding Libya and Sudan) is around EGP 23,500 compared to EGP 13,200 for Egypt’s exports as a whole. In principle the data on export values obtained from GOEIC/FEC should not include freight costs.