Embed Size (px)
Citation preview
Food Price Watch, produced by the Poverty Reduction and Equity group at the World Bank, is a series that aims at drawing attention to trends in domestic food prices in low- and middle-income countries and their policy implications. Contact: José Cuesta ([email protected])
POVERTY REDUCTION AND EQUITY GROUPPOVERTY REDUCTION AND ECONOMIC MANAGEMENT (PREM) NETWORK
THE WORLD BANK
Global Price Trends
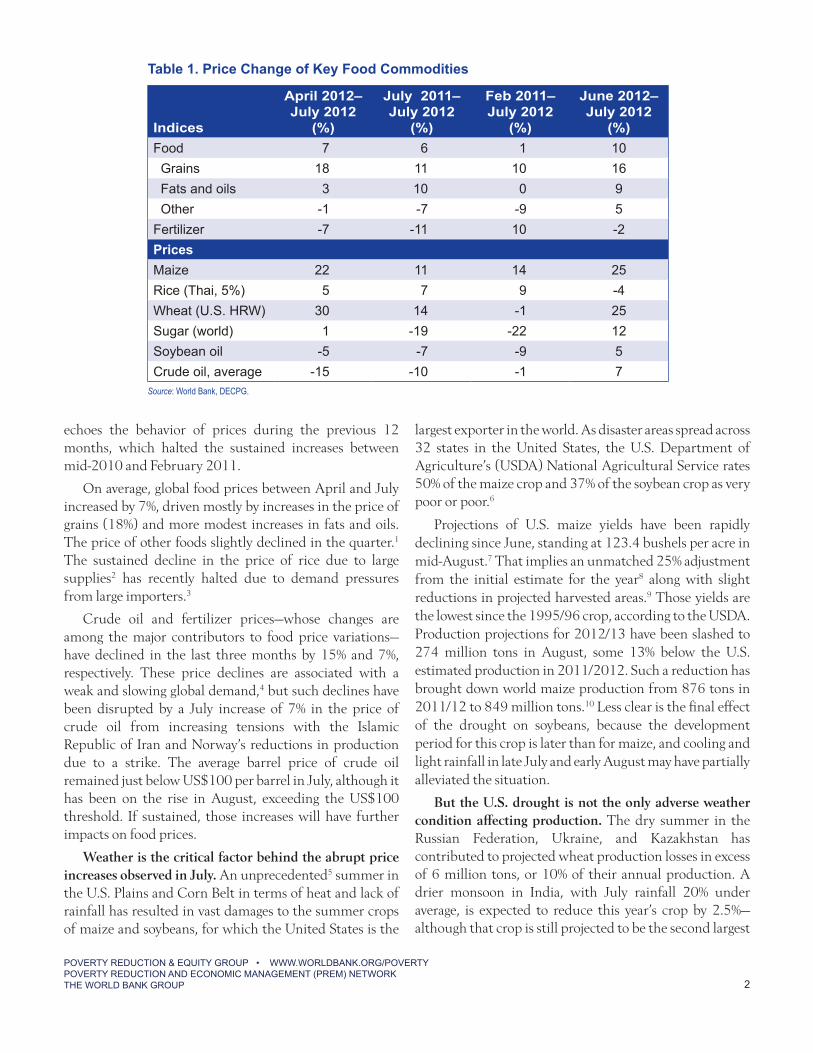
After two months of consecutive declines in May and June, the World Bank’s Food Price Index soared by 10% in July (figure 1). The index, which weighs the U.S. dollar price of several internationally traded food commodities, shows that sharp price increases in that month have been generalized, except for rice, which went down by 4%. The price of maize and wheat sharply rose by 25% each, as well as 12% for sugar and 5% for soybean oil (17% for soybeans) in July (table 1).
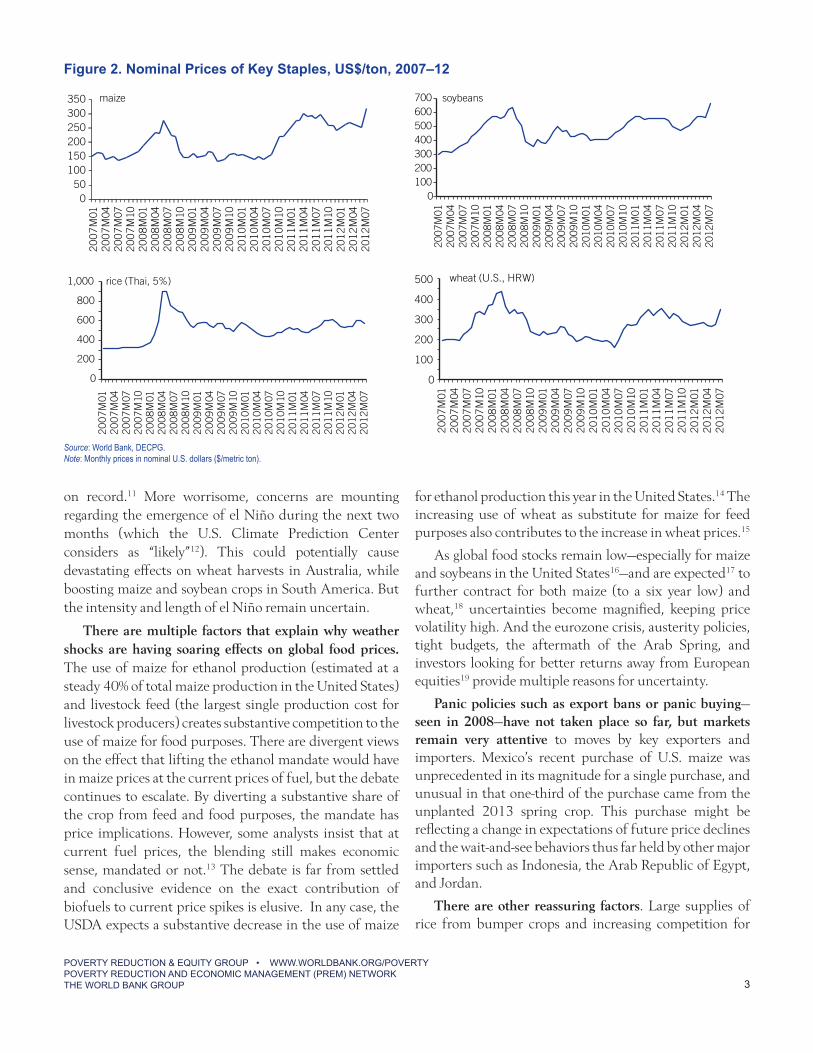
Given the persistently high global prices since the start of the year—noted in the previous Food Price Watch (FPW) in April of this year—the recent increases have pushed the prices of internationally traded maize and soybean to all-time peaks (figure 2). Maize and soybean prices in July exceeded in effect those observed during the June 2008 and February 2011 peaks. Prices of wheat and rice remain below their historical peaks, but are at levels comparable to 2011 spikes.
AUGUST 2012
Food Price Watch
The prices of internationally traded maize and soybeans reached all-time peaks in July, following an unprecedented summer in both the United States and Eastern Europe in terms of high temperatures and lack of rain fall. Wheat prices have also soared to levels comparable to the 2011 peaks but below all-time records. Prices of rice remain stable from abundant supplies. The abrupt food price increases turned favorable price prospects for the year upside down. World Bank experts do not currently foresee a repeat of 2008; however negative factors—such as exporters pursuing panic policies, a severe el Niño, disappointing southern hemisphere crops, or strong increases in energy prices—could cause significant further grain price hikes such as those experienced four years ago.
Countries in the Middle East and North and Sub-Saharan Africa are most vulnerable to this global shock. They have large food import bills, their food consumption is a large share of average household spending, and they have limited fiscal space and comparatively weaker protective mechanisms. Domestic food prices in these regions have also experienced sharp increases even before the global shock due to seasonal trends, poor past harvests, and conflict. Local circumstances will also largely determine how high domestic prices will be pushed from much higher international prices.
In addition to their effects on prices, previous droughts in developing countries have had severe economic, poverty and nutritional impacts, turning transitory shocks into lifetime and intergenerational perils. In such contexts, investments in drought-resistant crop varieties have provided large yield and production gains.
Monthly prices were volatile for the period between April and July. They increased in April, declined in May and June, and sharply increased in July. This volatile trend
Figure 1. World Bank Food Price Index
Source: World Bank, DECPG.Note: The Food Price Index weighs export prices of a variety of food commodities around the world in nominal U.S. dollar prices, 2005 = 100.
food grainsfats & oils other food
0
50
100
150
200
250
300
2007
M01
2007
M05
2007
M09
2008
M01
2008
M05
2008
M09
2009
M01
2009
M05
2009
M09
2010
M01
2010
M05
2010
M09
2011
M01
2011
M05
2011
M09
2012
M01
2012
m05
POVERTY REDUCTION & EQUITY GROUP • WWW.WORLDBANK.ORG/POVERTYPOVERTY REDUCTION AND ECONOMIC MANAGEMENT (PREM) NETWORKTHE WORLD BANK GROUP 2
echoes the behavior of prices during the previous 12 months, which halted the sustained increases between mid-2010 and February 2011.
On average, global food prices between April and July increased by 7%, driven mostly by increases in the price of grains (18%) and more modest increases in fats and oils. The price of other foods slightly declined in the quarter.1 The sustained decline in the price of rice due to large supplies2 has recently halted due to demand pressures from large importers.3
Crude oil and fertilizer prices—whose changes are among the major contributors to food price variations—have declined in the last three months by 15% and 7%, respectively. These price declines are associated with a weak and slowing global demand,4 but such declines have been disrupted by a July increase of 7% in the price of crude oil from increasing tensions with the Islamic Republic of Iran and Norway’s reductions in production due to a strike. The average barrel price of crude oil remained just below US$100 per barrel in July, although it has been on the rise in August, exceeding the US$100 threshold. If sustained, those increases will have further impacts on food prices.
Weather is the critical factor behind the abrupt price increases observed in July. An unprecedented5 summer in the U.S. Plains and Corn Belt in terms of heat and lack of rainfall has resulted in vast damages to the summer crops of maize and soybeans, for which the United States is the
largest exporter in the world. As disaster areas spread across 32 states in the United States, the U.S. Department of Agriculture’s (USDA) National Agricultural Service rates 50% of the maize crop and 37% of the soybean crop as very poor or poor.6
Projections of U.S. maize yields have been rapidly declining since June, standing at 123.4 bushels per acre in mid-August.7 That implies an unmatched 25% adjustment from the initial estimate for the year8 along with slight reductions in projected harvested areas.9 Those yields are the lowest since the 1995/96 crop, according to the USDA. Production projections for 2012/13 have been slashed to 274 million tons in August, some 13% below the U.S. estimated production in 2011/2012. Such a reduction has brought down world maize production from 876 tons in 2011/12 to 849 million tons.10 Less clear is the final effect of the drought on soybeans, because the development period for this crop is later than for maize, and cooling and light rainfall in late July and early August may have partially alleviated the situation.
But the U.S. drought is not the only adverse weather condition affecting production. The dry summer in the Russian Federation, Ukraine, and Kazakhstan has contributed to projected wheat production losses in excess of 6 million tons, or 10% of their annual production. A drier monsoon in India, with July rainfall 20% under average, is expected to reduce this year’s crop by 2.5%—although that crop is still projected to be the second largest
Indices
April 2012– July 2012
(%)
July 2011–July 2012
(%)
Feb 2011–July 2012
(%)
June 2012–July 2012
(%)Food 7 6 1 10 Grains 18 11 10 16 Fats and oils 3 10 0 9 Other -1 -7 -9 5Fertilizer -7 -11 10 -2Prices Maize 22 11 14 25Rice (Thai, 5%) 5 7 9 -4Wheat (U.S. HRW) 30 14 -1 25Sugar (world) 1 -19 -22 12Soybean oil -5 -7 -9 5Crude oil, average -15 -10 -1 7
Source: World Bank, DECPG.
Table 1. Price Change of Key Food Commodities
POVERTY REDUCTION & EQUITY GROUP • WWW.WORLDBANK.ORG/POVERTYPOVERTY REDUCTION AND ECONOMIC MANAGEMENT (PREM) NETWORKTHE WORLD BANK GROUP 3
on record.11 More worrisome, concerns are mounting regarding the emergence of el Niño during the next two months (which the U.S. Climate Prediction Center considers as “likely”12). This could potentially cause devastating effects on wheat harvests in Australia, while boosting maize and soybean crops in South America. But the intensity and length of el Niño remain uncertain.
There are multiple factors that explain why weather shocks are having soaring effects on global food prices. The use of maize for ethanol production (estimated at a steady 40% of total maize production in the United States) and livestock feed (the largest single production cost for livestock producers) creates substantive competition to the use of maize for food purposes. There are divergent views on the effect that lifting the ethanol mandate would have in maize prices at the current prices of fuel, but the debate continues to escalate. By diverting a substantive share of the crop from feed and food purposes, the mandate has price implications. However, some analysts insist that at current fuel prices, the blending still makes economic sense, mandated or not.13 The debate is far from settled and conclusive evidence on the exact contribution of biofuels to current price spikes is elusive. In any case, the USDA expects a substantive decrease in the use of maize
for ethanol production this year in the United States.14 The increasing use of wheat as substitute for maize for feed purposes also contributes to the increase in wheat prices.15
As global food stocks remain low—especially for maize and soybeans in the United States16—and are expected17 to further contract for both maize (to a six year low) and wheat,18 uncertainties become magnified, keeping price volatility high. And the eurozone crisis, austerity policies, tight budgets, the aftermath of the Arab Spring, and investors looking for better returns away from European equities19 provide multiple reasons for uncertainty.
Panic policies such as export bans or panic buying—seen in 2008—have not taken place so far, but markets remain very attentive to moves by key exporters and importers. Mexico’s recent purchase of U.S. maize was unprecedented in its magnitude for a single purchase, and unusual in that one-third of the purchase came from the unplanted 2013 spring crop. This purchase might be reflecting a change in expectations of future price declines and the wait-and-see behaviors thus far held by other major importers such as Indonesia, the Arab Republic of Egypt, and Jordan.
There are other reassuring factors. Large supplies of rice from bumper crops and increasing competition for
Figure 2. Nominal Prices of Key Staples, US$/ton, 2007–12
Source: World Bank, DECPG.Note: Monthly prices in nominal U.S. dollars ($/metric ton).
0
200
400
600
800
1,000
2007
M01
2007
M04
2007
M07
2007
M10
2008
M01
2008
M04
2008
M07
2008
M10
2009
M01
2009
M04
2009
M07
2009
M10
2010
M01
2010
M04
2010
M07
2010
M10
2011
M01
2011
M04
2011
M07
2011
M10
2012
M01
2012
M04
2012
M07
rice (Thai, 5%)
0100200300400500600700
2007
M01
2007
M04
2007
M07
2007
M10
2008
M01
2008
M04
2008
M07
2008
M10
2009
M01
2009
M04
2009
M07
2009
M10
2010
M01
2010
M04
2010
M07
2010
M10
2011
M01
2011
M04
2011
M07
2011
M10
2012
M01
2012
M04
2012
M07
soybeans
0
100
200
300
400
500
2007
M01
2007
M04
2007
M07
2007
M10
2008
M01
2008
M04
2008
M07
2008
M10
2009
M01
2009
M04
2009
M07
2009
M10
2010
M01
2010
M04
2010
M07
2010
M10
2011
M01
2011
M04
2011
M07
2011
M10
2012
M01
2012
M04
2012
M07
wheat (U.S., HRW)
050
100150200250300350
2007
M01
2007
M04
2007
M07
2007
M10
2008
M01
2008
M04
2008
M07
2008
M10
2009
M01
2009
M04
2009
M07
2009
M10
2010
M01
2010
M04
2010
M07
2010
M10
2011
M01
2011
M04
2011
M07
2011
M10
2012
M01
2012
M04
2012
M07
maize
POVERTY REDUCTION & EQUITY GROUP • WWW.WORLDBANK.ORG/POVERTYPOVERTY REDUCTION AND ECONOMIC MANAGEMENT (PREM) NETWORKTHE WORLD BANK GROUP 4
Thailand (the world’s largest exporter) have led to a recent rice price decline. Weak demand from the eurozone and a slight growth slowdown in China and the developing world in general (expected to grow at 5.3% in 2012, down from 6.1% in 2011) all favor price moderation.20 Declining fertilizer prices following bumper crops may bring price pressures down, if the trend is sustained.
But the jury is still out, for now. Global wheat production has been revised downward and presently stands below 2011/12 levels. The appreciation of the U.S. dollar may play against domestic prices, including food prices. The price of crude oil remains susceptible to wide fluctuations in the short run from adverse developments in the Middle East. Policy choices in key exporting countries will determine whether panic behavior emerges and spreads. Global stocks remain low and are expected to further decline this year. Weather developments in the near future—especially related to el Niño—will affect world production, but in which direction remains unclear. Markets are clearly much tighter than they were even a few months ago. Negative factors—such as exporters pursuing panic policies, a severe el Niño, disappointing southern hemisphere crops, or strong increases in energy prices—could yield significant further grain price hikes such as those experienced in 2008. In the longer run, prices are expected to remain high and volatile as a consequence of increasing supply uncertainties, increasing demand from a growing population, and the low responsiveness of the food system.21 In such a context, the ability to sustain agricultural (food) growth in adverse weather conditions—for example, by increasing the use of weather-resistant varieties—will determine the extent of damage that future shocks like this one may cause (in addition to other factors such as trade openness or strong safety nets).
Domestic Price Trends
How do U.S. food price increases affect domestic food prices across the world? Even though a substantial part of the U.S. maize crop is irreversibly damaged, the USDA’s projections of food inflation for 2012 remain unchanged with respect to predrought levels (between 2.5 and 3.5%), which already included a higher estimate for meat inflation (at 3.5–4.5%).22 As the world’s largest exporter of maize and soybeans, the extent to which price increases in the United States will be transmitted to other domestic markets will depend on a country’s level of reliance on imports; its capacity to protect itself from shocks; and if it allows the domestic pass through of international prices.23 On the
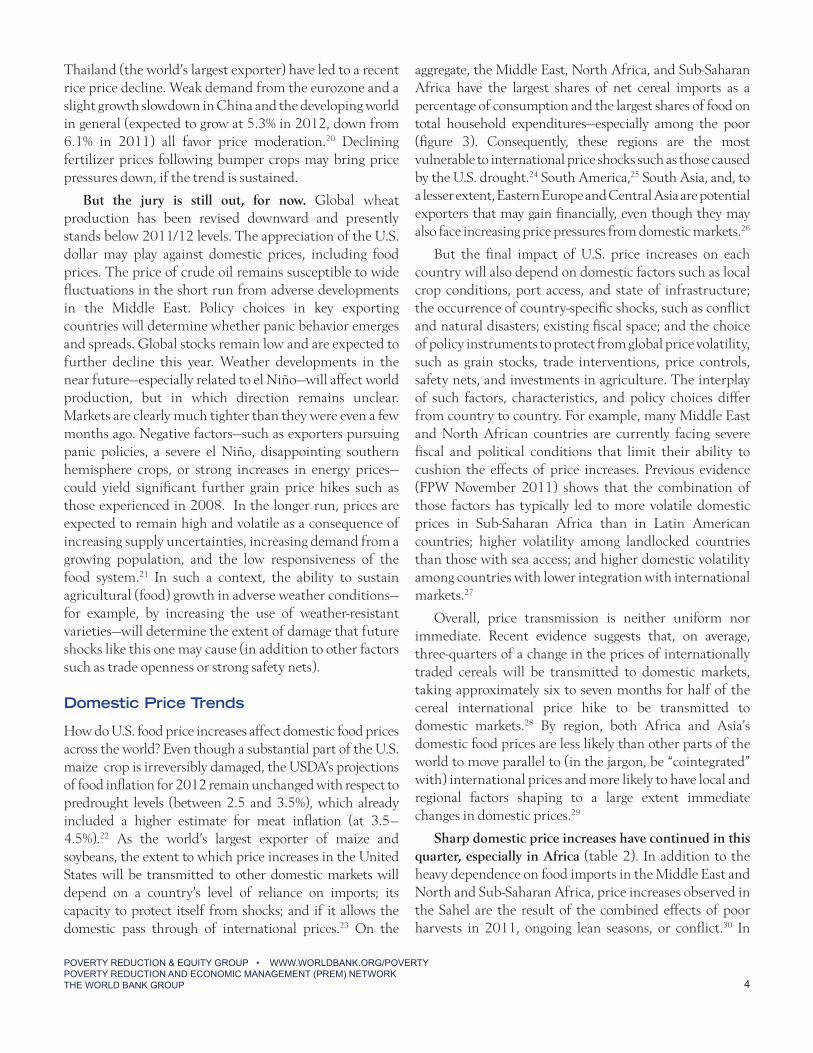
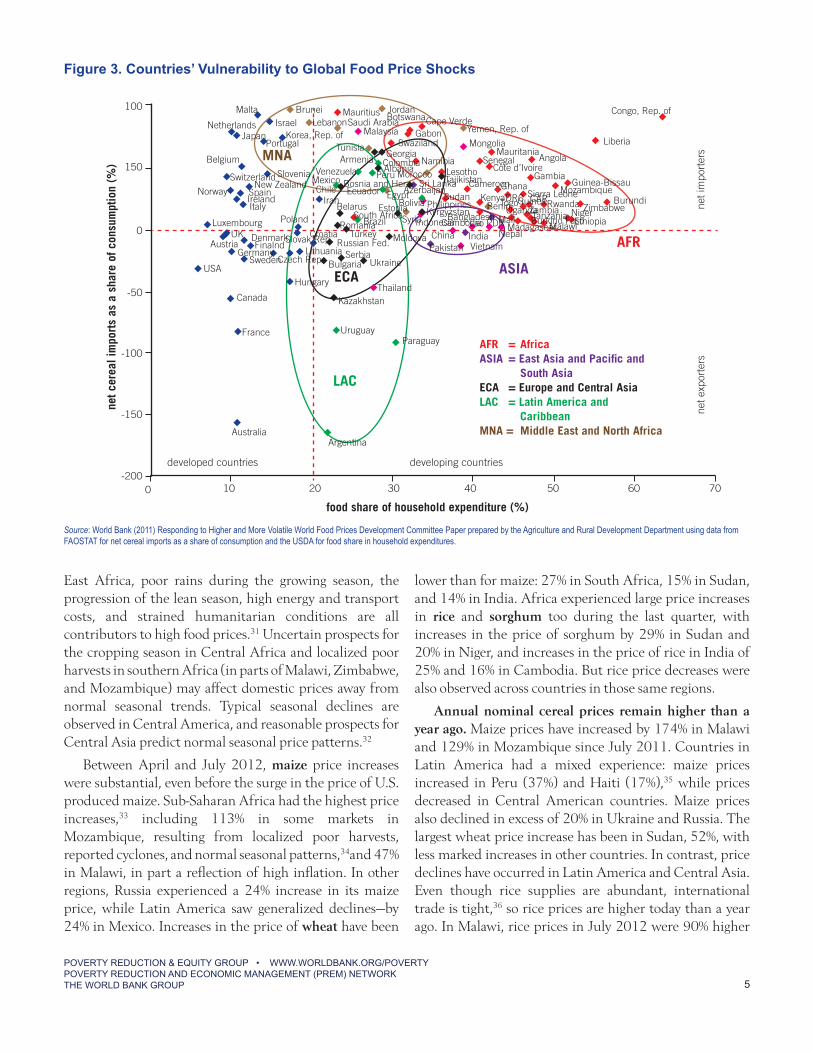
aggregate, the Middle East, North Africa, and Sub-Saharan Africa have the largest shares of net cereal imports as a percentage of consumption and the largest shares of food on total household expenditures—especially among the poor (figure 3). Consequently, these regions are the most vulnerable to international price shocks such as those caused by the U.S. drought.24 South America,25 South Asia, and, to a lesser extent, Eastern Europe and Central Asia are potential exporters that may gain financially, even though they may also face increasing price pressures from domestic markets.26
But the final impact of U.S. price increases on each country will also depend on domestic factors such as local crop conditions, port access, and state of infrastructure; the occurrence of country-specific shocks, such as conflict and natural disasters; existing fiscal space; and the choice of policy instruments to protect from global price volatility, such as grain stocks, trade interventions, price controls, safety nets, and investments in agriculture. The interplay of such factors, characteristics, and policy choices differ from country to country. For example, many Middle East and North African countries are currently facing severe fiscal and political conditions that limit their ability to cushion the effects of price increases. Previous evidence (FPW November 2011) shows that the combination of those factors has typically led to more volatile domestic prices in Sub-Saharan Africa than in Latin American countries; higher volatility among landlocked countries than those with sea access; and higher domestic volatility among countries with lower integration with international markets.27
Overall, price transmission is neither uniform nor immediate. Recent evidence suggests that, on average, three-quarters of a change in the prices of internationally traded cereals will be transmitted to domestic markets, taking approximately six to seven months for half of the cereal international price hike to be transmitted to domestic markets.28 By region, both Africa and Asia’s domestic food prices are less likely than other parts of the world to move parallel to (in the jargon, be “cointegrated” with) international prices and more likely to have local and regional factors shaping to a large extent immediate changes in domestic prices.29
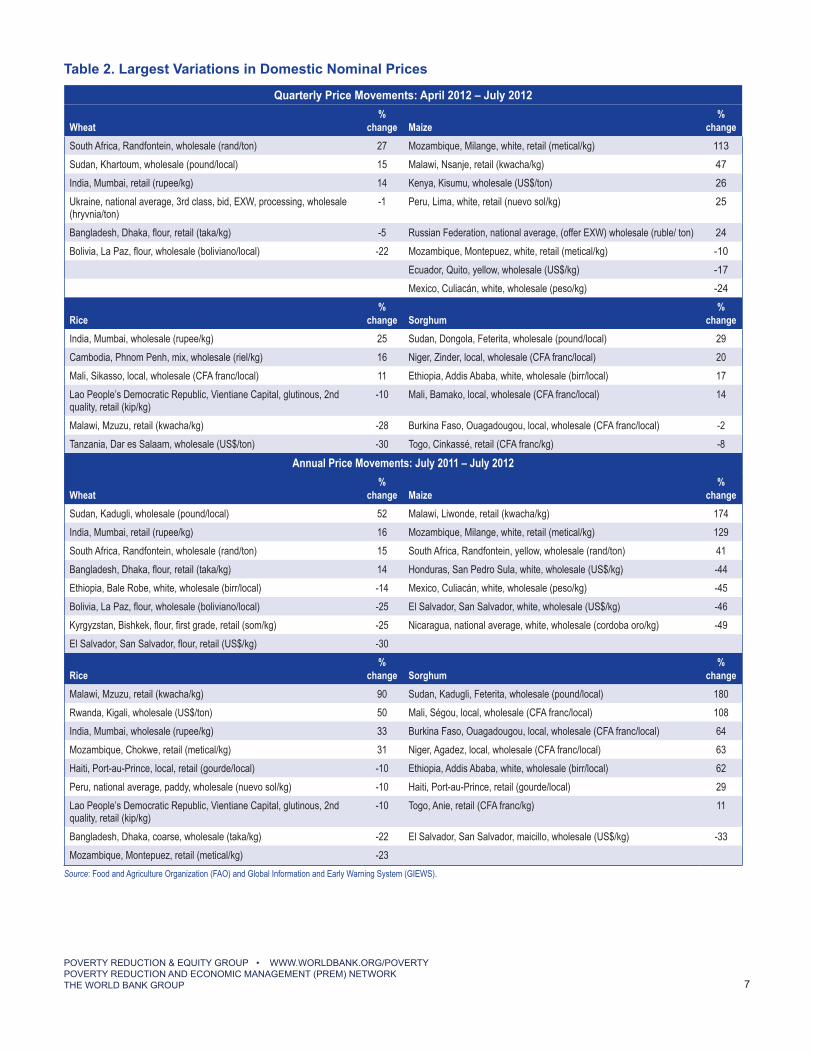
Sharp domestic price increases have continued in this quarter, especially in Africa (table 2). In addition to the heavy dependence on food imports in the Middle East and North and Sub-Saharan Africa, price increases observed in the Sahel are the result of the combined effects of poor harvests in 2011, ongoing lean seasons, or conflict.30 In
POVERTY REDUCTION & EQUITY GROUP • WWW.WORLDBANK.ORG/POVERTYPOVERTY REDUCTION AND ECONOMIC MANAGEMENT (PREM) NETWORKTHE WORLD BANK GROUP 5
East Africa, poor rains during the growing season, the progression of the lean season, high energy and transport costs, and strained humanitarian conditions are all contributors to high food prices.31 Uncertain prospects for the cropping season in Central Africa and localized poor harvests in southern Africa (in parts of Malawi, Zimbabwe, and Mozambique) may affect domestic prices away from normal seasonal trends. Typical seasonal declines are observed in Central America, and reasonable prospects for Central Asia predict normal seasonal price patterns.32
Between April and July 2012, maize price increases were substantial, even before the surge in the price of U.S. produced maize. Sub-Saharan Africa had the highest price increases,33 including 113% in some markets in Mozambique, resulting from localized poor harvests, reported cyclones, and normal seasonal patterns,34and 47% in Malawi, in part a reflection of high inflation. In other regions, Russia experienced a 24% increase in its maize price, while Latin America saw generalized declines—by 24% in Mexico. Increases in the price of wheat have been
lower than for maize: 27% in South Africa, 15% in Sudan, and 14% in India. Africa experienced large price increases in rice and sorghum too during the last quarter, with increases in the price of sorghum by 29% in Sudan and 20% in Niger, and increases in the price of rice in India of 25% and 16% in Cambodia. But rice price decreases were also observed across countries in those same regions.
Annual nominal cereal prices remain higher than a year ago. Maize prices have increased by 174% in Malawi and 129% in Mozambique since July 2011. Countries in Latin America had a mixed experience: maize prices increased in Peru (37%) and Haiti (17%),35 while prices decreased in Central American countries. Maize prices also declined in excess of 20% in Ukraine and Russia. The largest wheat price increase has been in Sudan, 52%, with less marked increases in other countries. In contrast, price declines have occurred in Latin America and Central Asia. Even though rice supplies are abundant, international trade is tight,36 so rice prices are higher today than a year ago. In Malawi, rice prices in July 2012 were 90% higher
Figure 3. Countries’ Vulnerability to Global Food Price Shocks
Source: World Bank (2011) Responding to Higher and More Volatile World Food Prices Development Committee Paper prepared by the Agriculture and Rural Development Department using data from FAOSTAT for net cereal imports as a share of consumption and the USDA for food share in household expenditures.
food share of household expenditure (%)
developed countries developing countries
net e
xpor
ters
net i
mpo
rter
s
net c
erea
l im
port
s as
a s
hare
of c
onsu
mpt
ion
(%)
Malta
Italy
Norway
Portugal
SpainIreland
Belgium
Slovenia
JapanIsrael
New ZealandSwitzerland
Korea, Rep. of
Brunei Jordan
Mexico
LebanonMauritius
Armenia
Malaysia
Tunisia
Saudi Arabia
Mauritania
Yemen, Rep. ofCape Verde
GabonSwaziland
Botswana
Namibia
Sri Lanka
MongoliaGeorgia
Lesotho
Sudan
GambiaTajikistan
Angola
Ghana
SenegalVenezuela
Netherlands
Côte d’Ivoire
Cameroon
Iran
South Africa
EgyptAzerbaijanBosnia and Herz
Estonia
PeruColombia
Chile
Albania
Ecuador
Brazil
BelarusPoland
Morocco
Bolivia PhilippinesBangladesh
UKLuxembourg
Kazakhstan
France
Canada
Hungary
Croatia
SwedenGermany
FinalndDenmark
Austria
USA
Slovak Rep
RomaniaTurkey
BulgariaSerbia
Ukraine
Thailand
ParaguayUruguay
Czech Rep
Russian Fed.Lithuania
Liberia
Congo, Rep. of
Mozambique
ZimbabweBurundi
Niger
Sierra LeoneRwanda
ZambiaDRC
Nepal
Guinea-Bissau
EthiopiaMalawiTanzaniaBurkino Faso
Kenya
IndiaChinaPakistan Vietnam
Moldova
Indonesia
Benin
CambodiaUganda
MadagascarLao PDRMaliKyrgyzstan
GuineaTogo CAR
Syria
ASIA
AFR
AustraliaArgentina
LAC
ECA
MNA
100
150
0
-50
-100
-200
-150
0 10 20 30 40 50 60 70
AFR = Africa ASIA = East Asia and Pacific and South AsiaECA = Europe and Central AsiaLAC = Latin America and CaribbeanMNA = Middle East and North Africa
POVERTY REDUCTION & EQUITY GROUP • WWW.WORLDBANK.ORG/POVERTYPOVERTY REDUCTION AND ECONOMIC MANAGEMENT (PREM) NETWORKTHE WORLD BANK GROUP 6
than in July 2011 (in Rwanda, 50% higher), while in India and Pakistan rice prices were 30% higher than a year ago. Steep price increases in sorghum have taken place in the Sahel and Eastern Africa (up to 220% in South Sudan and 180% in Sudan) during the last year.
Socioeconomic Impacts of Droughts
Droughts may have substantive economic, poverty, and nutritional effects. Impacts can be transitory, permanent, and/or intergenerational. Simulations based on historical data in Malawi37 point to average losses of 4.6 percent of its maize production each year, and an economywide loss of 1% of gross domestic product (GDP). Severe droughts expected to occur once every 25 years would magnify such effects tenfold.38 The most severe droughts are reported to increase poverty by 17 percentage points, especially hitting rural poor communities of small-scale farmers. In Zimbabwe, children exposed to the 1994–95 drought performed less well in school; had a lower body size at adulthood; and suffered early onset of chronic diseases, premature mortality, and reduced earnings as adults than children not exposed to the drought. Shorter adult women were found to have more complications during child birth, have children with lower birth weight, and faced higher probability of child mortality.39 In Indonesia, higher early life rainfall during 1954–73 was proven to have large positive effects on adult women—but not men—in 2000, who reported lower incidence of poor health, greater height, and attendance for more grades of school.40 The magnitude of impacts depends to a large extent on the size of agricultural production lost due to the drought. Dismal losses—around 40% of the normal nondrought production between 1970 and 2002—reported in three semiarid states of India,41 reduced 60–80% of households’ normal year incomes in the affected communities and raised the poverty incidence in those states by 19 percentage points.42
Household decisions before (date of planting, fertilization practices), during (seeking nonfarm employment opportunities), and after the drought (liquidation of productive assets, outmigration) may partially offset the socioeconomic impacts of the drought. Some estimates for India, Thailand, and China between 1970 and the early 2000s indicate that coping mechanisms might be able to redress between 25 and 60% of direct incomes lost to the drought.43 In addition, public policy may have a critical role in remedying and preventing the impacts of droughts. For example, interventions facilitating
the introduction of drought-resistant varieties have been shown to bring about important economic benefits. The adoption of drought-resistant varieties in drought-prone districts in India improved groundnut average yields by 23%, and reduced by 30% their yield variability compared to the prevalent varieties.44 Large yield increases (20% or more) for rice, wheat, and maize have been also reported across eastern and southern Africa and Latin America.45
Notes
1. “Other foods” quarterly trends reflect price declines for sugar and bananas and stable prices for beef between April and July 2012 (World Bank, Pink Sheet, DECPG, August 3, 2012).
2. Large supplies are expected from Thailand, Vietnam, and India (FEWS NET, Price Watch, June 12, 2012).
3. Demand pressures come from major importers such as Bangladesh, the Democratic People’s Republic of Korea, Nepal, the Philippines, and Nigeria (FAO, Cereal Supply and Demand Brief, July 5, 2012; and FEWS NET, Price Watch, June 12, 2012). At the same time, there have been domestic interventions in Thailand conducive to increasing rice stock piles. These interventions refer specifically to the extension of the rice mortgage scheme that ensures farmers a price well above the market. This results in increasing stock piles of rice in the hands of the government. The annual extension become effective August 1st, 2012.
4. Slowdown demand is associated with a weak economic outlook, sovereign debt crisis, and economic growth slowdown in China and more generally in non-OECD (plus OECD) countries (World Bank, Global Economic Prospects June 2012, Commodity Annex; World Bank, Update on Commodity Markets, June 4, 2012).
5. The occurrence and severity of the drought were unpredicted and prospects for the production of maize (both expected yields and harvested area) remained strong even until June.
6. USDA, Crop Progress, National Agricultural Statistics Service, August 13, 2012.
7. USDA, World Agricultural Supply and Demand Estimates, 2012 (WASDE 509), August 10.
8. Ibid, p.2.
9. The USDA predicts a reduction in the expected harvested area of about 2% (WASDE 509, 2). However, some analysts might be expecting larger reductions in the vicinity of 10%,
POVERTY REDUCTION & EQUITY GROUP • WWW.WORLDBANK.ORG/POVERTYPOVERTY REDUCTION AND ECONOMIC MANAGEMENT (PREM) NETWORKTHE WORLD BANK GROUP 7
Quarterly Price Movements: April 2012 – July 2012
Wheat%
change Maize%
changeSouth Africa, Randfontein, wholesale (rand/ton) 27 Mozambique, Milange, white, retail (metical/kg) 113Sudan, Khartoum, wholesale (pound/local) 15 Malawi, Nsanje, retail (kwacha/kg) 47India, Mumbai, retail (rupee/kg) 14 Kenya, Kisumu, wholesale (US$/ton) 26Ukraine, national average, 3rd class, bid, EXW, processing, wholesale (hryvnia/ton)
-1 Peru, Lima, white, retail (nuevo sol/kg) 25
Bangladesh, Dhaka, flour, retail (taka/kg) -5 Russian Federation, national average, (offer EXW) wholesale (ruble/ ton) 24Bolivia, La Paz, flour, wholesale (boliviano/local) -22 Mozambique, Montepuez, white, retail (metical/kg) -10
Ecuador, Quito, yellow, wholesale (US$/kg) -17Mexico, Culiacán, white, wholesale (peso/kg) -24
Rice%
change Sorghum%
changeIndia, Mumbai, wholesale (rupee/kg) 25 Sudan, Dongola, Feterita, wholesale (pound/local) 29Cambodia, Phnom Penh, mix, wholesale (riel/kg) 16 Niger, Zinder, local, wholesale (CFA franc/local) 20Mali, Sikasso, local, wholesale (CFA franc/local) 11 Ethiopia, Addis Ababa, white, wholesale (birr/local) 17Lao People’s Democratic Republic, Vientiane Capital, glutinous, 2nd quality, retail (kip/kg)
-10 Mali, Bamako, local, wholesale (CFA franc/local) 14
Malawi, Mzuzu, retail (kwacha/kg) -28 Burkina Faso, Ouagadougou, local, wholesale (CFA franc/local) -2Tanzania, Dar es Salaam, wholesale (US$/ton) -30 Togo, Cinkassé, retail (CFA franc/kg) -8
Annual Price Movements: July 2011 – July 2012
Wheat%
change Maize%
changeSudan, Kadugli, wholesale (pound/local) 52 Malawi, Liwonde, retail (kwacha/kg) 174India, Mumbai, retail (rupee/kg) 16 Mozambique, Milange, white, retail (metical/kg) 129South Africa, Randfontein, wholesale (rand/ton) 15 South Africa, Randfontein, yellow, wholesale (rand/ton) 41Bangladesh, Dhaka, flour, retail (taka/kg) 14 Honduras, San Pedro Sula, white, wholesale (US$/kg) -44Ethiopia, Bale Robe, white, wholesale (birr/local) -14 Mexico, Culiacán, white, wholesale (peso/kg) -45Bolivia, La Paz, flour, wholesale (boliviano/local) -25 El Salvador, San Salvador, white, wholesale (US$/kg) -46Kyrgyzstan, Bishkek, flour, first grade, retail (som/kg) -25 Nicaragua, national average, white, wholesale (cordoba oro/kg) -49El Salvador, San Salvador, flour, retail (US$/kg) -30
Rice%
change Sorghum%
changeMalawi, Mzuzu, retail (kwacha/kg) 90 Sudan, Kadugli, Feterita, wholesale (pound/local) 180Rwanda, Kigali, wholesale (US$/ton) 50 Mali, Ségou, local, wholesale (CFA franc/local) 108India, Mumbai, wholesale (rupee/kg) 33 Burkina Faso, Ouagadougou, local, wholesale (CFA franc/local) 64Mozambique, Chokwe, retail (metical/kg) 31 Niger, Agadez, local, wholesale (CFA franc/local) 63Haiti, Port-au-Prince, local, retail (gourde/local) -10 Ethiopia, Addis Ababa, white, wholesale (birr/local) 62Peru, national average, paddy, wholesale (nuevo sol/kg) -10 Haiti, Port-au-Prince, retail (gourde/local) 29Lao People’s Democratic Republic, Vientiane Capital, glutinous, 2nd quality, retail (kip/kg)
-10 Togo, Anie, retail (CFA franc/kg) 11
Bangladesh, Dhaka, coarse, wholesale (taka/kg) -22 El Salvador, San Salvador, maicillo, wholesale (US$/kg) -33Mozambique, Montepuez, retail (metical/kg) -23
Source: Food and Agriculture Organization (FAO) and Global Information and Early Warning System (GIEWS).
Table 2. Largest Variations in Domestic Nominal Prices
POVERTY REDUCTION & EQUITY GROUP • WWW.WORLDBANK.ORG/POVERTYPOVERTY REDUCTION AND ECONOMIC MANAGEMENT (PREM) NETWORKTHE WORLD BANK GROUP 8
“Responding to Higher and More Volatile World Food Prices,” 2011, http://iatrc.software.umn.edu/activities/annualmeetings/themedays/pdfs2011/2011Dec-S14-Delgado_paper.pdf).
22. However, today’s increases in the United States may have more to do with last year’s drought in Texas than today’s drought, which may show its most severe effects in months to come. As young cattle become sacrificed today and supplies increase, prices may decline before they increase as inventories grow scarce (USDA, Food Price Outlook, July 25, 2012).
23. There are other important factors that will have an effect on domestic prices such as exchange rates and domestic crop conditions.
24. World Bank (2011) Responding to Higher and More Volatile World Food Prices. Development Committee Paper prepared by Agriculture and Rural Development Department. Other regions typically have a more balanced structure of food importers and exporters or may consume commodities less traded internationally, such as rice.
25. In contrast, Central America is a region highly dependent on net imports of cereals, with households spending a large proportion of their incomes on food.
26. M. Sadler and C. Delgado, “Brief on the Impact of the U.S. Drought on the World,” World Bank, July 20, 2012.
27. This finding varies across commodities. In effect, domestic price volatility is higher among countries with an estimated low pass through of global prices than countries with a high pass through of global prices for maize and wheat, while the opposite appears to be the case for rice (FPW, November 2011).
28. F. Greb, N. Jamora, C. Mengle, and others, “Price Transmission from International to Domestic Markets,” World Bank mimeo, 2012.
29. The cited study finds that domestic prices’ cointegration with international prices is not always statistically significant. Conceptually, more integration with international markets may imply a higher transmission of global shocks into domestic markets, but also a higher smoothing of domestic shocks through global trade. Which effect dominates is uncertain.
30. World Bank, World and Sub-Saharan Africa—June 2012 Food Prices Update, AFTPM and AFTSN.
31. FEWS NET, Price Watch, July 31, 2012; FEWS NET, “Food Security Worsens in Sudan/South Sudan; Erratic
as reported by Reuters (Drought Seen Slashing U.S. Corn Crop to 5-Year Low, August 7, 2012). (http://in.reuters.com/article/2012/08/07/us-usa-agriculture-corn-idINBRE87603P20120807).
10. These numbers factor in larger than anticipated beginning stocks of maize recently corrected in the U.S. and Brazil due to larger production for 2011/12. Maize production elsewhere is mostly unchanged with increases in China, Argentina, Brazil and South Africa, offset by decreases in the European Union, Ukraine, India, and Canada (USDA, WASDE, 508, 509).
11. USDA, WASDE 508, 3.
12. Climate Prediction Center, Climate Diagnostic Bulletin, July 2012, http://www.cpc.ncep.noaa.gov/products/CDB/Forecast/forecast.shtml.
13. S. Irvin and D. Good, Ethanol—Does the RFS Matter? August 2, 2012, http://www.farmdocdaily.illinois.edu/2012/08/ethanoldoes_the_rfs_matter.html; B. Babcock, Preliminary Assessment of the Drought’s Impacts on Crop Prices and Biofuel Production, CARD Policy Brief 12-PB, July 2012, http://www.card.iastate.edu/publications/dbs/pdffiles/12pb7.pdf).
14. USDA’s WASDE (509, 2) reports a reduction of 400 million bushels of maize, a whopping 300 million additional reduction from estimates reported in July’s WASDE (508, 2).
15. USDA’s WASDE (509, 19) estimates that 6 million tons of wheat are destined for domestic feed use in 2012/13, up from 4.4 million tons in 2011/12 in the United States.
16. Stocks for maize and soybeans in the US are estimated in August to be 5% and 4%, respectively, for 2012/13USDA. WASDE 509, 12, 15.
17. International Grain Council, 2012, Grain Market Report August 23, 2012.
18. In the case of wheat stocks, they may potentially turn or remain illiquid as that large stocks sit in China and India for their own domestic consumption rather than export trade.
19. Marc Sadler, Daily Market Report, World Bank, May 24, 2012.
20. World Bank, Global Economic Perspectives, June 12, 2012.
21. Low responsiveness is particularly a problem in developing countries, which have less integrated input and output markets and are typically less able to protect themselves from volatility, which limits the responsiveness of food production to higher prices (World Bank,
POVERTY REDUCTION & EQUITY GROUP • WWW.WORLDBANK.ORG/POVERTYPOVERTY REDUCTION AND ECONOMIC MANAGEMENT (PREM) NETWORKTHE WORLD BANK GROUP 9
Start of Kiremt Rains in Ethiopia,” East Africa Food Security Outlook Update, July 2012,
http://www.fews.net/docs/Publications/East%20Africa_FSOU_07_2012.pdf .
32. FEWS NET, Price Watch, July 31, 2012.
33. All price increases refer to the specific markets reported in table 2 and not to the country’s overall food inflation
34. World Bank, “Africa Food Price Update,” June 12, 2012.
35. Prices of maize also declined in Nicaragua (49%), El Salvador (46%), Mexico (45%), Honduras (44%), Guatemala (34%), and Bolivia (26%).
36. FAO, “FAO Lowers Global Rice Forecast for 2012; But World Production Will Still Increase,” Bangkok, Thailand, August 6, 2012, http://www.fao.org/news/story/en/item/154122/icode/.
37. K. Pauw, J. Thurlow, and D. van Seventer, “Droughts and Floods in Malawi: Assessing the Economywide Effects,” IFPRI Discussion Paper 962, April 2010.
38. Results in Malawi differ by region, depending on the importance of agriculture and specific crop varieties’ susceptibility to droughts. They also differ by economic sector (some sectors are insulated from droughts) and may benefit from cheaper wages, for example, while other nonfarm sectors may suffer from lost agricultural commodities.
39. Specifically, the anthropometrics of Zimbabwean children aged 12 to 24 months during the 1994–95 drought were found to have lowered annual growth rates by between 1.5 and 2 centimeters four years later (J. Hoddinott and B. Kinsey, “Child Growth in the Time of Drought,” Oxford Bulletin of Economics and Statistics 63(3): 409–36 [2001]).
40. Girls “benefiting” from higher rainfall were 0.57 centimeters taller and completed 0.22 more grades of school than girls who did not benefit from higher rainfall. These effects more likely reflect a positive impact of rainfall in agricultural output, leading to better food availability and incomes, which ultimately affected the infant girls (S.
Maccini and D. Yang, “Under the Weather: Health, Schooling and Economic Consequences of Early-Life Rainfall,” American Economic Review 99 (3): 1006–26 [2009]. Another study finds preliminary evidence of similar positive effects of rainfall shocks on weight at birth in Colombia (J. P. Azevedo, C. Rodriguez Castelan and V. Sanfelice, “How Do Climate Change Impact Intergenerational Mobility? Identifying the Effects of Weather Shocks on Weight at Birth in Colombia,” mimeograph, World Bank [2012]).
41. S. Pandey and H. Bhandari, “Drought, Coping Mechanisms and Poverty: Insight from Rainfed Rice Farming in Asia,” IFAD Occasional Paper (2009). The three states covered by the study are Chattisgarh, Jharkhand and Orissa.
42. Another study reports losses between 25–58% of household incomes and poverty effects from 12–33% in eastern India (H. Bhandari, S. Pandey, R. Sharan, and others, “Economic Costs of Drought and Rice Farmers’ Drought-Coping Mechanisms in Eastern India,” in Economic Costs of Drought and Rice Farmers’ Coping Mechanisms: A Cross-Country Comparative Analysis, ed. S. Pandey, H. Bhandari, and B. Hardy [Los Baños: International Rice Research Institute, 43–112, 2007]).
43. P. Birthal, S. Nigam, A. Narayanan, and K. Kareem, “Potential Benefits from Adoption of Improved Drought-Tolerant Groundnut in India,” Agricultural Economics Research Review 25 (1; January–July): 1–14 (2012).
44. Ibid.
45. CGIAR, Climate, Agriculture and Food Security: A Strategy for Change, http://cgiar.bio-mirror.cn/pdf/CCAFS_Strategy_december2009.pdf (2009). Also, La Rovere and others quantify conservative economic gains of US$0.5 billion for 13 African countries from conservative gains in yields (up to 20%) and yield variability (reduction of 10%; R. La Rovere, G. Kostandini, A. Tahirou, and others, “Potential Impact of Investments in Drought Tolerant Maize in Africa,” Centro International de Mejoramiento del Maiz y del Trigo, Addis Ababa [2010]).