Embed Size (px)
Citation preview

Food and Energy in a Circular Economy
Final Report Stockholm June 30, 2017

CarbonNeutralCitiesAllianceInnovationFundRound2RFP
2
AuthorsMaria Lennartsson, City of Stockholm and Elisabeth Kvarnström, Research Institutes of Sweden,
BackgroundreportsBiogas generation: Hamse Kjerstadius, Lund University, Faculty of Engineering, Lund (2017)
Heat recovery: Jörgen Wallin, Royal Institute of Technology, Stockholm (2017)
Nutrient flows: Mats Johansson, Anna Norström, Maria Johansson & Tobias Robinson, Ecoloop, Stockholm (2017)

CarbonNeutralCitiesAllianceInnovationFundRound2RFP
3
TableofContents
1.CONTEXT 8
2.PROJECTPURPOSE 10
3.METHOD 10
4.BACKGROUND 12
5.SCENARIORESULTS 15
6.CLIMATEEFFECTS 24
7.COSTSOFSCENARIOS 25
8.BUSINESSANDMANAGEMENTMODELS 32
9.DISCUSSION 34
10.CONCLUSIONS 36
11.REFERENCES 38
APPENDICES 42 Appendix 1 – General assumptions for the comparison between scenarios 42 Appendix 2 – Assumptions behind the biogas comparison and the nutrient calculations 43 Appendix 3 – Assumptions for the heat calculations 46 Appendix 4 Baseline scenario results 47 Appendix 5 Nutrient flow scenarios – flowcharts 54 Appendix 6 – Nutrient tables 60 Appendix 7 – Assumptions Climate effects 62 Appendix 8 – Summary from the report “Source‐separating systems for wastewater and food waste – experiences, implementation, economy and societal benefit 63

CarbonNeutralCitiesAllianceInnovationFundRound2RFP
4
ExecutivesummaryStockholm Royal Seaport is appointed the next generation sustainable city districts with ambitious environmental goals including resource efficiency and becoming climate positive (according to the Climate Positive Development Program framework). One of the areas subject to investigations has been wastewater management. With funding from the Carbon Neutral Cities Alliance Innovation Fund this study has been possible to carry out.
Wastewater contains resources such as heat, organic matter and nutrients which to a certain degree can be recovered in conventional wastewater treatment processes. However, the mechanical, biological and chemical unit processes in a conventional wastewater treatment plant are not optimized for such resource recovery; they are optimized for reduction of pollutants in the wastewater with the aim of recipient and public health protection. Given the existing wastewater infrastructure in urban areas in Sweden, attempts to recover resources in conventional wastewater systems can only be made at the end of pipe – in the wastewater treatment plant.
It has been shown that a higher level of resource recovery, recycling and reuse could be obtained in the wastewater sector with upstream separation of different wastewater flowstreams. A pre‐feasibility study made by the City of Stockholm has shown that source separation provides the best potential for increase in resource recovery from wastewater in Stockholm. This project’s purpose is to deliver a feasibility study describing the potential and scenarios of source separating wastewater systems for biogas, heat and nutrients in (i) the Royal Seaport area in Stockholm and (ii) new developments in metropolitan Stockholm the coming 20 years. This report is presenting the results from a scenario assessment, where the potentials for increased recycling of biogas, heat and nutrients are explored for source‐separating wastewater systems when compared to a conventional scenario.
It should be noted that this report is presenting potentials for biogas, heat and nutrient recycling. The calculations behind these potentials are based on a number of necessary assumptions, which inherently will afflict the results with insecurity. They should therefore be seen as an assessment of potentials, not as absolute values or absolute results. There is still, however, a value to engage in scenario modeling to inform decision‐making processes, since carefully produced scenario modeling with clearly stated assumptions provides a possibility to better understand future possibilities.
ResourceRecoveryPotentialBiogas
A source‐separating scenario, where blackwater is separated from the greywater and where the organic waste goes via a kitchen waste grinder to a separate system, is estimated to increase the biogas potential for both organic waste and for wastewater, although the highest potential is estimated to lie with the separation of blackwater from the greywater, around 70%. It can also be concluded that the same potential is considerably lower for the organic waste flow,

CarbonNeutralCitiesAllianceInnovationFundRound2RFP
5
around 15%, but the losses in this flowstream, both within a conventional system and the source‐separating system can be influenced by targeting organic waste behavior at the household level. With source separated systems, biogas generation can increase with a minimum of 50%.
Heat
The separation of greywater from the blackwater improves the heat recovery potential. Theoretically, 33% more energy can be recovered with a heat exchanger on greywater compared to the same heat exchanger on a mixed wastewater (Nykvist, 2013). To improve the evenness of the flow, which is also important for the functionality of the heat recovery process irrespective of flow, it could be advisable to employ the heat recovery on a larger level than household/property level. In total 70‐80% of the heat can be recovered in a source separated system.
Nutrients
The nutrient recovery potential assessment includes two different scenarios, both a high‐tech nutrient recovery alternative which can be combined with the biogas technology explored under the biogas potential, an alternative called UASB high‐tech, and a lower‐tech scenario without biogas recovery, called urea sanitization.
The increase in potential of N reuse, compared to the conventional system, is over 2 600% for the UASB high‐tech scenario and over 3200 % for the urea sanitization scenario. The urea sanitization scenario also has the lowest N “discharge” outlet of all three scenarios.
For P the same dramatic shift can be seen for both source‐separating scenarios but from “other use” to “agricultural use” compared to the conventional scenario; the increase is over 2 200% for both source‐separating alternatives.
For the organic solid waste systems it can be seen that the source‐separating technology with garbage disposer to pipe provides a slight increase in biogas potential (15%) and a doubling of the nutrient recycling potential even if the total amount of nutrients is considerably lower than for blackwater. However, the garbage disposer to pipe system can relatively easily plug into the existing biogas production and agricultural reuse system for solid organic waste.
Water
With the proposed system, replacing a low‐flush toilet to a vacuum toilet, 15‐20% potable water can be saved.
ClimateeffectsThe potential to reduce GHG emissions is significant. A conservative estimate is that about 130 kg CO2e/capita can be reduced if the flowstreams are separated and management of the resources is optimized. 80% is related to recovery of heat, substituting district heating. This

CarbonNeutralCitiesAllianceInnovationFundRound2RFP
6
equals to a reduction of more than 5% of Stockholm’s average GHG emissions of 2,5 tonnes/capita.
CostestimatesIncreased performance of a technical system in most cases also entails increased costs. Kärrman et al. (2017) estimated that the implementation of a source‐separating sanitation system in a new, urban development most likely represents a slight increase in full supply costs. This increase is most likely to land to the largest degree on the developer and to a smaller degree on the utility, but will in both cases represent small costs compared to overall investments for the land development and the sanitation services (Kärrman et.al. 2016). The investments for the developer can be motivated by the saved heating costs. The investments for the utility will have to be weighed against the economic benefits. Kärrman et al. (2016) concluded that costs should not be a main barrier against the implementation of source‐separating systems in new, urban developments, neither from a water utility perspective, nor from a developer’s perspective, given that the increases are small compared to the respective overall costs for the developer and the water utility.
The economic benefits of the system are difficult to fully quantify due to lack of knowledge. In an early cost‐benefit analysis done for SRS, one conclusion was that even with limited quantifications, the source‐separating systems were expected to generate the largest benefits, even if all of them were not quantifiable (Kinell et al. unpublished). There is a need to further develop the knowledge about the different benefits of different sanitation systems, and their quantification.
Another aspect of societal accountability is the necessity to plan for possible future demands on the sanitation system of Stockholm in the decision‐making process due to the long lifetime of urban infrastructure. There are reasons to believe that the future may hold (i) stricter legislation regarding discharge levels of heavy metals, chemicals, and pharmaceutical residues, (ii) increased risks of flooding, (iii) water shortages, and (iv) increased demands on nutrient recycling to farmland.
The above highlights that source‐separation of blackwater from greywater will increase the potentials for biogas production, heat recovery, nutrient recycling and water saving. However, it requires acceptance among the stakeholders
x Developers need to accept changes in the design of the sanitation system on the property.
x Utilities need to accept that resource optimized systems may go beyond their conventional mandate and jurisdiction, and
x Farmers’ requirements of high‐quality fertilizers have to be in focus when designing new systems aimed at nutrient recycling.

CarbonNeutralCitiesAllianceInnovationFundRound2RFP
7
From a city perspective it may thus be that innovative city infrastructure, improving sustainability of a city’s function, may cause costs within the jurisdiction of one utility but also gains within another. Moreover, increased costs may occur outside the city’s utilities’ jurisdictions, as in this example to developers (and ultimately maybe to households), and gains in the other end: the agriculture. This complexity underlines the necessity of integrated decision‐making when it comes to investment in innovative infrastructure – the city needs to work in an integrated fashion and very closely with its own utilities and with all stakeholders involved.
The above highlights that separation of blackwater from greywater will increase the potentials for biogas production, heat recovery, nutrient recycling and water saving. However, there is a need for further development for blackwater recycling technologies, as well as the need to balance trade‐offs between optimal biogas production and optimal nutrient recovery. Also, there is a need to better understand the heat recovery potentials on greywater and its effects on wastewater treatment plant processes.

CarbonNeutralCitiesAllianceInnovationFundRound2RFP
8
1.ContextThe wastewater collection and treatment system in Stockholm can be considered one of the best and most efficient in the world in terms of pollution reduction in relation to costs of the processes. It is, and has been for a couple of decades, what is referred to as a “green factory”.
Wastewater contains resources such as heat, organic matter and nutrients which to a certain degree can be recovered in conventional wastewater treatment processes. However, the mechanical, biological and chemical unit processes in a conventional wastewater treatment plant are not optimized for such resource recovery, they are optimized for reduction of pollutants in the wastewater with the aim of recipient and public health protection. Given the existing wastewater infrastructure in urban areas in Sweden, attempts to recover resources in conventional wastewater systems can only be made at the end of pipe – in the wastewater treatment plant.
Figure 1.1: Energy, heat and nutrient recycling possibilities in a system separating blackwater and organic waste flows.
In a related sector, solid waste management, demands to increase recovery and recycling led to changes in waste management at source level in Sweden, with collection of separate waste fractions on household or neighborhood level. Separating kitchen waste from glass, cardboard, newspapers, plastic and a rest fraction is common practice in Sweden today. A similar logic applied to the wastewater sector would suggest that a higher level of resource recovery, recycling and reuse could be obtained also in the wastewater sector with upstream separation of different wastewater flowstreams.
Indeed, a pre‐feasibility study made by the City of Stockholm, showed that source separation provided the best potential for increase in resource recovery from wastewater in Stockholm (Wittgren et al., 2011). This study was, however, not comprehensive enough to allow for a decision for investment and the consensus was that better support for such a decision was needed. A better understanding of how and where to collect the resources in an optimized system, the related costs, and how the residual products will be managed and what the benefits are have to be reached for decision‐makers to feel comfortable to invest in source‐separating collection of wastewater at scale in urban areas in Sweden. It is of great importance to implement pilot projects with source‐separated flows of wastewater to gain more knowledge of the benefits and challenges with these systems. There are a few smaller projects
Nutrients
Energy
Water
Toiletwaste Hygienization Nutrients to agriculture
Foodwaste Biogas extraction Nutrients to agriculture
Greywater Local heat extraction
To WWTP for purification

CarbonNeutralCitiesAllianceInnovationFundRound2RFP
9
throughout the world, but no large‐scale (over 1.000 households) urban project where experiences can be drawn from yet.
A summary of possibilities to heat, organic matter and nutrient recovery in the conventional system and potentials for the same in a source‐separating system are summarized in Table 1.1. Table 1.1: Possibilities of heat, energy and nutrient recovery in conventional and source‐separated wastewater systems.
Conventional system Source‐separation of blackwater and organic kitchen waste
Heat
Even though modern wastewater treatment plants have heat recovery from treated wastewater, energy used to heat up water in our homes for bathing, washing clothes and dishes is going to waste in between the property and the treatment plant. On the property level, the use of horizontal heat exchangers with a theoretical efficiency of 20%, on the outgoing wastewater pipe is becoming common. With a storage tank and heat‐pump the efficiency can be increased to about 50%
Separation of greywater from blackwater allows for heat recovery from a wastewater with less solids and higher temperature (average temperature increase from 23°C to 30°C), compared to a mixed wastewater. It has been estimated that heat exchange on greywater, can recover up to 33% more energy compared to heat exchange on a mixed wastewater (Nykvist, 2013).
Biogas
The waste disposers that are currently being introduced in Stockholm are connected to the sewer system and the food waste is transported to the wastewater treatment plant. The treatment plants are designed to treat water, not to optimize the energy recovery, thus 40‐50% of the biogas potential is lost.
The food waste can be collected and treated separately to increase the generation of biogas with up to 85% that can be used to substitute petrol.
Nutrie
nts
The Swedish sewage sludge is high in phosphorus, and of high quality in comparison to sludge in other countries. There is also a certification process in place to ensure the quality of any sludge used in agriculture. A high degree of upstream elimination of pollutant sources in Swedish wastewater systems (de‐connection of industries or demand of pre‐treatment) has allowed for production of sewage sludge of this high quality. Nevertheless, domestic wastewater reflects the chemical product use in society and therefore still contains micro‐pollutants of concern which ends up in the sewage sludge. The Swedish farming community is currently reluctant to reuse sewage sludge and 19% of total sludge produced in Stockholm is used in agriculture today. Moreover, sludge reuse only allows for efficient reuse of phosphorus, not of potassium or nitrogen.
Separate collection of the blackwater would allow for the recycling of a nutrient product without the micro pollutants found in greywater, and hence with a potential for higher acceptance in the farming community. Moreover, it would allow for recycling of almost all nutrients in a Swedish wastewater, since there is a ban on using phosphorus in laundry detergents. The recycling of nitrogen is particularly interesting from an energy‐saving and climate perspective. Moreover, by keeping the nutrients in on land and out of fresh and sea water it contributes to a lower risk of eutrophication.

CarbonNeutralCitiesAllianceInnovationFundRound2RFP
10
2.ProjectpurposeAs Stockholm Royal Seaport (SRS) is located within the City boundary, the area will be serviced with traditional sewer systems. However, the assumption is that by separating flows at the household level, streams can be managed in such a way that biogas, heat and nutrients can be recovered to a higher degree compared to the conventional system.
This project’s purpose is to deliver a feasibility study describing the potential and scenarios of source separating wastewater systems for dense urban areas and a business model for the implementation of such systems.
2.1GoalstowhichtheprojectcontributesStockholm’s development area, Stockholm Royal Seaport, is appointed to be the next generation sustainable city district. The goals defined for wastewater management in the Royal Seaport are:
The energy and resource utilization in the water and wastewater management will be increased
i) Contribute to knowledge development regarding benefits of source‐separating system through pilot project(s).
ii) Ensure that the quality of collected flowstreams enables reuse of resources iii) Reuse heat from wastewater efficiently
In a broader sense source separation of blackwater and organic waste positively contributes towards the UN Sustainable Development Goals 6 (clean water and sanitation), 7 (affordable and clean energy), 9 (industry and innovation), 11 (sustainable cities and communities), 12 (responsible consumption and production) and 13 (climate action)1.
3.MethodIn this study a business‐as‐usual scenario for a new development area is compared to a scenario where source separation is implemented both for collection of kitchen waste and blackwater in Stockholm. This comparison is carried out both for two areas in the Royal Seaport Area together representing 8,000 households, as well as for the total potential for the metropolitan area of Stockholm with a planned new development of 100,000 households. The average household size used for the calculations is 2.4 persons/household, a figure based on Stockholm Royal Seaport statistics. More details used for the comparison is available in Appendices 1 through 3.
In the comparison, the business‐as‐usual scenario will be employed “at its best”, hence it takes into account existing policies for new development areas. For example, although only a rather low percentage have access to separate organic waste collection in Stockholm today, in the business‐as‐usual scenario the most common separate organic waste collection system will be
1 http://www.un.org/sustainabledevelopment/sustainable‐development‐goals/

CarbonNeutralCitiesAllianceInnovationFundRound2RFP
11
used. Another example is the stormwater. Overall today 46% of the city has combined sewers, but in the business‐as‐usual scenario for the city’s new developments it is assumed that existing policy on local retention of treatment of stormwater will be employed. Hence, the stormwater will NOT be included in the business‐as‐usual scenario nor in the source separating scenario.
It was assumed that the planning process of relevant areas of Stockholm Royal Seaport would have been further along at the completion of this study than is actually the case. Due to delays in the planning and design process, the reporting to the CNCA is based on the use of existing studies for the cost estimates elements. Therefore, the scenarios for biogas, heat and nutrient recovery potentials are not corresponding to the scenarios that were used in earlier studies for full supply costs and cost‐benefit analyses (see chapter 6).
It can be noted that two different scenarios are used for assessing the nutrient recovery potential, one high‐tech and one low‐tech. The reason behind is that the biogas alternative used for the source‐separated blackwater will demand the use of high‐tech processes to recover the nutrients, whereas the low‐tech option, urea sanitization, is a nutrient recycling‐efficient technology already in use in Sweden today for treatment of blackwater from on‐site sanitation systems. Hence, for the nutrient recycling scenario both systems will be assessed. Table 3.1 gives a summary of the scenarios used for the study.
Table 3.1: Overview of the scenarios used in the comparative study. More details in Appendices 1, 2 and 3.
Biogas Heat Nutrients Size 8,000 and 100,000 apartments
Conventional – organic waste
Separate collection of organic waste in paper bags. Conveyance of paper bags to the biogas plant through trucks. Continuously Stirred Tank Reactor (CSTR) for biogas production.
Separate collection of organic waste in paper bags. Conveyance of paper bags to the biogas plant through trucks. Continuously Stirred Tank Reactor for biogas production.
Conventional – wastewater
Combined wastewater conveyed to the wastewater treatment plant. Continuously Stirred Tank Reactor (CSTR) for biogas production.
Heat recovery through heat exchanger at the wastewater treatment plant.
Combined wastewater conveyed to the wastewater treatment plant. Continuously Stirred Tank Reactor (CSTR) for biogas production. Tertiary wastewater treatment.
Source‐separated – organic waste
Garbage disposer to separate pipe conveying organic waste slurry separately to the biogas plant. Upflow Anaerobic Sludge Blanket Septic Tank (UASB‐ST) reactor.
Garbage disposer to separate pipe conveying organic waste slurry separately to the biogas plant. Upflow Anaerobic Sludge Blanket Septic Tank (UASB‐ST) reactor.
Source‐separated – wastewater
Collection of blackwater separately for separate conveyance and treatment. Upflow Anaerobic Sludge Blanket Septic Tank (UASB‐ST) reactor.
Heat recovery from greywater on property or an area level.
Alternative 1: Collection of blackwater separately for separate conveyance and treatment. Upflow Anaerobic Sludge Blanket Septic Tank (UASB‐ST) reactor. High‐tech nutrient recovery via ammonia stripping and struvite precipitation.

CarbonNeutralCitiesAllianceInnovationFundRound2RFP
12
Alternative 2: Collection of blackwater separately for separate conveyance and treatment. Urea sanitization and no biogas production.
4.Background
4.1TheexistingsituationtodayBefore embarking on the scenario development it is useful to throw a glance at the existing system for Stockholm as it stands today. An overall picture of the conventional collection and treatment of organic waste and wastewater in Stockholm is shown in Figure 4.1.
Figure 4.1: Overall picture of the different waste flowstreams and their treatment in Stockholm today (Picture: Hamse Kjerstadius. Sources: see text below).
Collection of kitchen waste is implemented through a number of different systems throughout Stockholm today (IVL, 2015):
1. No separate collection – mixing of organic waste with other solid waste 2. Collection in separate bag to a stationary bin, emptied from the bottom (apartments) 3. Collection in separate bag to a stationary underground vacuum waste collection
(apartments) 4. Collection in separate bag to a mobile vacuum waste collection (apartments) 5. Collection in separate bag and bin (individual houses and apartments) 6. Kitchen waste grinder to sewer system (individual houses and apartments) 7. Optic sorting of color‐coded bags (apartments)

CarbonNeutralCitiesAllianceInnovationFundRound2RFP
13
Alternative 1, no separate collection of organic waste, is the most common approach today for households in Stockholm; only about 16% of the households have collection of organic waste today (personal communication: Carin Kvillborn, Stockholm Water Company). For alternative 2 through 4 above the collection of the kitchen waste is done in paper bags, Figure 2. Alternative 5, collection in separate bag and bin, is the dominant system for household with separate collection of organic waste in Stockholm today (personal communication, Carin Kvillborn, Stockholm Water Company), and is therefore considered the baseline for the Stockholm system in this study, Figure 4.1. Not all organic waste ends up in paper bags in households with organic waste collection; behavior within the household will determine the size of the losses arrow from the organic waste flow in Figure 4.1. The biogas is upgraded to bio‐methane and used to fuel buses in the public transport system in Stockholm, and the biosolids remaining after the anaerobic digestion is returned to agriculture for crop production (personal communication, Carin Kvillborn, Stockholm Water Company).
Figure 4.2: Collection of kitchen waste in paper bags (Source: IVL, 2015).
Combined domestic wastewater (blackwater and greywater combined) is collected both in combined (46%) and in duplicate gravity sewers (54%) in Stockholm (Stockholm Water Company, 2015a). The wastewater is treated in one of two wastewater treatment plants in Stockholm, Henriksdal or Bromma. The wastewater is subject to mechanical, biological and chemical treatment and average effluent values on a yearly basis are shown in Figure 1.1 and in Table 4.1. As can be seen in Table 4.1 and Figure 4.1, the effluent values of these key parameters are low. A figure of concern is the overflow volume and the Stockholm Water Company and the City of Stockholm is working actively to reduce the overflow volume. Heat remaining in the wastewater after treatment is recovered at the wastewater treatment plants before discharge, Box 4.1.
Table 4.1: Average yearly effluent values 2015 from Bromma and Henriksdal wastewater treatment plants (Source: Stockholm Water Company, 2015b).
Parameter BOD7 (mg/L) Tot‐P (mg/L) Tot‐N (mg/L) Overflow (m3/yr)
Average effluent 2016 3.28 0.17 8.6 695,000

CarbonNeutralCitiesAllianceInnovationFundRound2RFP
14
Stormwater is currently collected either separately (54% of Stockholm Water Company’s sewers are duplicate) or combined (46%). However, for the business‐as‐usual but conventional scenario in this report stormwater will not be included, since the Stockholm stormwater policy demands local retention and treatment of stormwater for new development areas. However, the fact that 46% of the sewer pipes are combined does influence the functionality of the wastewater treatment plants, an impact that is considered also in the business‐as‐usual conventional scenario. The combined sewers will continue to influence the treatment plants also for new development areas.
Box 4.1: Heat recovery in Stockholm’s wastewater treatment plants
Today heat recovery from wastewater is employed in two treatment plants in Stockholm: Henriksdal and Bromma. Assuming a heat pump efficiency (COP) of 3.5, the total amount of recovered heat in Henriksdal WWTP is 882 GWh. Henriksdal WWTP services 834 000 people which approximately translates into 350 000 apartments. Bromma WWTP recovers approximately 550 GWh heat annually from the wastewater. Bromma services 351 000 persons or 146 000 apartments. In total, the heat recovery from these plants is 1.4 TWh.
The amount of recovered heat from the Henriksdals and Bromma cannot be directly compared to the heat recovery potential calculated for 8 000 or 100 000 apartments in this report. The reason for this is that there is a regulation that stipulates that the temperature of the wastewater released to the sewer from buildings cannot be below the incoming water temperature to the buildings. In Stockholm, the average water temperature of the incoming water is around 8 °C. This number is used for the calculations in this report. In the treatment plants, the heat recovery system actually lowers the temperature of the wastewater significantly below 8 degrees in the heat recovery process. For Henriksdal treatment plant the temperature of the wastewater after the heat recovery system ranges between 0.4 to 4 °C over the year.
The temperature of the wastewater from buildings is around 27 °C (Bergrén, 2009), the average temperature of the wastewater to the treatment plants (Henriksdal) is 16.8 °C. This means that a lot of heat is lost in the wastewater system on its way to the treatment plant. Roughly 1.66 TWh is lost in the system servicing Henriksdal and Bromma.
In the WWTPs heat is added to the process which leads to that the average treated wastewater temperature in the WWTP, before the heat recovery system, is 18.3 °C (Henriksdal), hence approximately 1°C higher than the incoming wastewater temperature.

CarbonNeutralCitiesAllianceInnovationFundRound2RFP
15
5.Scenarioresults
5.1AsourceseparatedwastewatersystemThe proposed source‐separated wastewater system for SRS comprises three different flowstreams, with the following set‐up:
1. Collection of kitchen waste is proposed to be done with a waste grinder connected to a separate sewer. The slurry is then conveyed into sedimentation/collection tanks on an area level and transported by trucks to a biogas plant. The biogas is used to replace fossil fuels in the transport system and the biosolids are used in agriculture.
2. Greywater is collected separately and conveyed through a heat exchanger on the property or within the area before going to Henriksdal WWTP.
3. Blackwater is collected with extremely low‐flush toilets, preferably vacuum toilets to reduce the amount of water. The blackwater is treated locally (high‐tech option) or regionally (low‐tech option). The products from the blackwater treatment are used to replace commercial fertilizers.
5.2BiogasproductionpotentialThe biogas potentials for the two different scenarios are shown in Figures 5.1, 5.2 and 5.3.
Figure 5.1: Biogas potential for the conventional and the source‐separated scenarios for 8,000 households
Figure 5.2: Biogas potential for the conventional and source‐separating scenarios for 100,000 households.
050000100000150000200000250000300000
Organic solid waste Domestic wastewater TOTAL
Nm
3 /CH
4/yr
Biogas potential ‐ 8,000 households
Conventional
Source‐separated
0500000100000015000002000000250000030000003500000
Organic solid waste Domestic wastewater TOTAL
Nm
3 /CH
4/yr
Biogas potential ‐ 100,000 households
Conventional
Source‐separated

CarbonNeutralCitiesAllianceInnovationFundRound2RFP
16
Figure 5.3: Increase in potential for biogas production for 8,000 households and 100,000 households.
It can be noted that the source‐separating scenario is estimated to increase the biogas potential for both organic waste and for wastewater, although the highest potential is estimated to lie with the separation of blackwater from the greywater, around 70%. The main reason for this is that the organic carbon present in wastewater (mainly originating from the blackwater), in a conventional treatment process, is used as a carbon source in the biological nitrogen removal in the activated sludge process. Conventional nitrogen removal is not a desirable process to apply on source‐separated blackwater, if the intention is to reuse its nutrient content in agriculture. Therefore, more organic carbon is available for methane production in an anaerobic digester in source separated blackwater. Another, albeit smaller, influencing factor to the increased potential for biogas production for the source‐separated blackwater is the choice of anaerobic digester. The UASB‐ST is an appropriate choice for a dilute substrate, such as blackwater. It is a solid‐separating digester type which allows for greater solids retention time and thus a higher degradation compared to the more conventional CSTR digesters (Kjerstadius et al. 2012). This higher degradation has been shown in full‐scale experiments in the Netherlands (STOWA, 2014).
The results show that there is a small increase, around 15%, in biogas potential also for the source‐separated organic waste scenario, Figures 5.1, 5.2 and 5.3. However, it should be noted that the biogas potential for organic waste collection and treatment is highly dependent on user behavior on household level. Losses of organic waste to the waste fraction on household level differ highly between different studies (Kjerstadius et al. 2012, Atkins, 2016). Kjerstadius et al. (2012) reported losses of organic waste from different studies to vary between 23 – 78%, and further that these differences were subscribed to information issues and user behavior rather than due to the technical system per se. In this study the same losses, 50%, were assumed on household level, irrespective of scenario applied, based on studies made in a new development area in Helsingborg, Sweden (Kjerstadius et al., 2012).
0,010,020,030,040,050,060,070,080,090,0
Increase in potentialorganic solid waste
Increase in potentialblackwater
Increase total
% increase in
biogas p
oten
tial
compa
red to business‐as‐usual
8,000 households
100,000 households
CarbonNeutralCitiesAllianceInnovationFundRound2RFP
17
The difference between the 8,000 apartment scenario and 100,000 apartment scenario in relation to biogas potential is mostly directly related to size, hence the same pattern is observed between the conventional and the source‐separating scenarios for the larger as for the smaller sample size. However, a slightly higher loss level (10% instead of 6%) in the conveyance system has been assumed for the mixed wastewater, the greywater and the organic waste slurry due to longer retention time in the system. For the source‐separating scenario no losses have been assumed for the blackwater in the conveyance system due to short retention time (vacuum system). The increase in loss due to increased retention time in the system for the conventional scenario translates into an increase in the potential for the source‐separating system’s blackwater component slightly with size, Figure 5.3.
It can be concluded that the highest potential to improve the biogas production lies with the source separation of blackwater from the remaining wastewater flowstream. It can also be concluded that the same potential is considerably lower for the organic waste flow, but the losses in this flowstream, both within a conventional system and the source‐separating system can be influenced by targeting organic waste behavior at the household level.
It should be noted that the potentials for biogas production described above are assessment of potentials, not as absolute values or absolute results. They are based on a number of necessary assumptions, see Appendices 1 and 2 for details, which inherently will afflict the results with insecurity. There is still, however, a value to engage in scenario modelling to inform decision‐making processes, since carefully produced scenario modelling with clearly stated assumptions provides a possibility to better understand future possibilities.
5.3Heatrecoverypotential
5.3.1BackgroundHeating is needed to create a good thermal comfort in the dwellings and for domestic hot water production (DHW). In Swedish apartment complexes, most of the property energy consumption is related to the heating demand. In the traditional case, about 70 % of the heating demand relates to space heating and 30 % to domestic hot water consumption (DHW). However, for new buildings built with stricter requirements on energy performance, the relative share of DHW demand is increased in relation to the demand for heating. In passive houses, where the total energy demand should be no higher than 54 kWh/m2, DHW often represent around 50 % of the total heating demand (Nykvist, 2012). With the Stockholm Royal Seaport’s requirements and ambitions to reach an energy demand of 40‐45 kWh/m2, early calculations show that more than 50% of the heat in the wastewater needs to be recovered.
Therefore, the heat loss in the wastewater represents an important issue to address to reach the future goal of increased energy efficiency in the building stock. It has been estimated that Sweden could, over a 20‐year period, save 12 TWh by heat recovery from mixed wastewater, of which 25% in new developments (Nykvist, 2012). However, heat is already recovered in Stockholm at two wastewater treatment plants, Box 4.1.

CarbonNeutralCitiesAllianceInnovationFundRound2RFP
18
The potential for heat recovery will depend on the type of heat exchanger and the system design. 5.4 presents theoretical heat recovery potential for wastewater, depending on heat exchanger and system type.
Figure 5.4: Energy‐saving potential from heat recovery from mixed wastewater (Source: Nykvist, 2012).
Figure 5.4 is showing the theoretical heat recovery potential from mixed wastewater, using conventional technologies. By combining horizontal pipe and shower heat exchangers it is possible to reach an energy‐saving potential of 40%. The use of heat pumps can increase the energy‐saving potential up to 70%, all on mixed wastewater. However, heat pumps are more complicated and costly installations and demand more even flows for optimum operation (Nykvist, 2012).
On a larger scale, heat recovery ratio can be increased even more. If a heat pump is used for wastewater, more than 80 % efficiency is possible (Wallin, 2015). The heat recovery ratio increase with the introduction of a heat pump depends on a few different reasons;
� Recovered heat can be used for other purposes than DHW, thereby increasing the demand for heating and decrease the demand of storage;
� A heat pump eliminates the problem with the mismatch between the flow in the incoming DHW and when there is heat available in the drain;
� The temperature on the cooling side of the heat exchanger can be kept low and constant, eliminating the problem that the incoming tap water temperature changes with the ambient temperature.
5.3.2Heatrecoveryinsource‐separatedwastewatersystemsIn new development areas, where source separated wastewater systems are considered, the heat recovery potential can be increased, since heat can be recovered more easily and efficiently. The reason for this is that greywater can be used in efficient heat exchangers with

CarbonNeutralCitiesAllianceInnovationFundRound2RFP
19
lower demand for filtering and cleaning compared to mixed wastewater. Wastewater can only be used in heat exchangers that are designed for fluids containing a solid fraction.
The positive effects in a sources‐separated wastewater system are (i) increased wastewater temperature and (ii) the possibility to use more efficient heat exchangers, (Nykvist, 2012).
5.3.3Potentialofheatrecoveryinsource‐separatingsystemsonbuildinglevelTo evaluate the potential for heat recovery at building level for the two different scenarios, several assumptions need to be made. In this analysis, a comparison between mixed wastewater and greywater heat recovery installations are compared for different system types. For the wastewater heat recovery installation, performance data is taken from Nykvist (2012) and Wallin (2015 and 2017).
Mixed wastewater Grey water
Figure 5.5: Potential heat recovery with different technical installations for 8,000 apartments
Figure 5.6: Potential heat recovery with different technical installations for 100,000 apartments
0
5
10
15
20
25
30
Annu
al heat e
nergy [GWh]
050
100150200250300350400
Annu
al heat e
nergy [GWh]
Box 5.1: Heat exchange technology
One example of an efficient technique for heat recovery is a wide gap plate heat exchanger with particle filtering before the heat exchanger. An analysis with empirical data from an investigation of an installation in Stockholm (Wallin, 2017) shows that if a wide gap heat exchanger designed for greywater (Kelvion GF8X22H‐10) is used instead of a horizontal wastewater heat exchanger designed for wastewater, the heat transfer coefficient of the heat exchanger increases by about 45 times. Calculation is made with the assumption that the wide gap heat exchanger is designed to deliver the same heat recovery rate as the wastewater heat exchanger. This analysis provides a rough estimation on how much more efficient a plate heat exchanger designed for greywater can be. A more efficient heat exchanger provides an possibility to have significantly higher heat recovery ratio.

CarbonNeutralCitiesAllianceInnovationFundRound2RFP
20
Data for wastewater flows are taken from an investigation by the Swedish Energy Agency (Swedish Energy Agency, 2009).
The analysis highlights the potential benefits by source separating the wastewater enabling the possibility to have a more efficient heat exchanger for the greywater case. For the wastewater case the heat recovery ratio is between 17‐54 % and for the greywater case the ratio is between 19‐67 % depending on the system type.
Table 5.1: Energy‐saving potential and pay‐back times (Source: Wallin, 2015).
Wastewater Greywater (Source separated)
Heat recovery On property On property
Potential energy recovery (%) 38 67
Capital costs (MSEK) 143 141
Payback time (years) 16.5 9.2
5.3.4HeatrecoveryonanarealevelThere is also a possibility to recover heat on area level rather than on building level. The potential of a central heat recovery facility will depend on the heat losses between the buildings and the facility and the design of the system. Since a central system most likely needs to have a heat pump to recover the heat from the wastewater, the performance will also depend on the sizing of the system. If losses can be kept low, an area level system could recover towards 80 % of the available heat in the wastewater (Wallin, 2015). Investment costs could potentially be lower on area level than on property level. Both these factors, higher recovery rate and lower investment costs, could lead to a much shorter payback time compared to investments on property level.
To find the optimum size of heat recovery system for the SRS area in question a deeper analysis of the planned infrastructure and future land use is needed than was possible to do within this study. A deeper analysis and quantification of benefits related to a potential source‐separation of greywater from blackwater on area level is also needed. Qualitatively it can, however, be concluded that O&M would be simpler, and thus cheaper, for a heat recovery system on greywater than on mixed wastewater.
5.4NutrientrecoverypotentialThe nutrient recovery potential assessment includes two different scenarios, both a high‐tech nutrient recovery alternative which can be combined with the biogas technology explored under the biogas potential, an alternative called UASB high‐tech, and a lower‐tech scenario without biogas recovery, called urea sanitization. For both source‐separating scenarios the

CarbonNeutralCitiesAllianceInnovationFundRound2RFP
21
technology for conveyance of the organic waste is the same: kitchen waste grinder to separate piped system to tank.
The comparison between the three scenarios for 8,000 and 100,000 households are shown in Figures 5.5 and 5.6 and Table 5.1 below, and further in Appendices 5 and 6.
Kg N/yr Kg P/yr
Agricultural use Other use Discharge
Figure 5.7: N and P recovery potential for 8,000 households
Kg N/yr Kg P/yr
Agricultural use Other use Discharge
Figure 5.8: N and P recovery potential for 100,000 households.
There is no difference, except size, assumed in this modeling between the scenarios of 8,000 and 100,000 households, hence the increase in recycling potential remains the same based on percentage, Table 5.2.
0
20000
40000
60000
80000
100000
120000
Conventional Source separation‐ UASB, high‐tech
Source separation‐ urea sanitization
0
2000
4000
6000
8000
10000
12000
14000
Conventional Source separation ‐UASB, high‐tech
Source separation ‐urea sanitization
0
200000
400000
600000
800000
1000000
1200000
1400000
1600000
Conventional Source separation‐ UASB, high‐tech
Source separation‐ urea sanitization
020000400006000080000100000120000140000160000180000
ConventionalSource separation ‐ UASB, high‐techSource separation ‐ urea sanitizati

CarbonNeutralCitiesAllianceInnovationFundRound2RFP
22
The results from the modeling, showing that between 2600 to 3200% more N and 2200% more P can be recycled, clearly illustrates that source‐separating systems hold a strong capacity for improving the nutrient recycling from wastewater systems.
Table 5.2: Percentage increases in nutrient reuse potential for the two source‐separating scenarios.
Increase in potential UASB high‐
tech (%) Increase in potential urea
sanitization (%)
N P N P 8,000 households 2 618 2 222 3 216 2 265 100,000 households 2 618 2 222 3 216 2 265
It should be noted that the potentials for nutrient recycling described above are potentials only. They are based on a number of necessary assumptions, see Appendices 1 and 2 for details, which inherently will afflict the results with insecurity. They should therefore be seen as an assessment of potentials, not as absolute values or absolute results. There is still, however, a value to engage in scenario modeling to inform decision‐making processes, since carefully produced scenario modeling with clearly stated assumptions provides a possibility to better understand future possibilities.
It can be seen that both source‐separating scenarios drastically shift the main outlet of N from “discharge” to “agricultural use” compared to the conventional scenario, with the higher “agricultural use” for the urea sanitization scenario. As shown in Table 5.2 above, the increase in potential of N reuse, compared to the conventional system, is over 2600% for the UASB high‐tech scenario and over 3200 % for the urea sanitization scenario. The urea sanitization scenario also has the lowest N “discharge” outlet of all three scenarios, the reason being that the biogas process in the UASB high‐tech scenario will not be able to capture N as efficiently and hence feed N into the conventional wastewater processes with increased discharges both to air and water compared to the urea sanitization scenario where all N in the blackwater is kept within the recyclable flowstream.
For P the same dramatic shift can be seen for both source‐separating scenarios but from “other use” to “agricultural use” compared to the conventional scenario. Table 5.2 shows that the increase in P reuse potential, compared to the conventional system, is over 2200% for both source‐separating alternatives. The reason for the similar results for P is that the UASB high‐tech scenario captures P similarly to the urea sanitization scenario.
The agricultural use seen in all the conventional scenarios is related to the return of biosolids to agriculture from the solid organic waste flowstream. For the source‐separating scenarios the solid organic waste is contributing with an approximate doubling of the nutrients compared to the conventional system. This increase is due the nutrient losses in the pre‐treatment, screw separator press, of organic waste collected in bags, a step not necessary to apply to the organic

CarbonNeutralCitiesAllianceInnovationFundRound2RFP
23
waste in the source‐separated scenario with its garbage disposers to pipe (Kjerstadius et al., 2015).
Given the relatively low contribution to the nutrient recycling potential from the solid organic waste, even with a doubling for the source‐separating scenarios, blackwater is the more important flowstream to nutrient recycling compared to solid organic waste.
5.5WatersavingpotentialOne aspect that is given more attention recently, also in the Swedish context, is water saving measures. The water use per captia has been decreasing over the past decades, but mainly motivated by energy saving, i.e. to reduce the amount of water that needs to be heated.
With the proposed system 18‐30 litres per person and day can be saved, going from a low‐flush (4‐6 l/flush) to a vacuum toilet (<1l/flush). In relation to average Swedish water use of 120‐150 l/cap and yr the decreased water use would correspond to a 15‐20% reduction.
In the 8,000 household scenario that reduction in demand amounts to 130‐200 m3 of water that can be saved annually. In the 100,000 household scenario the reduction corresponds to a water saving of 1,5‐2,5 million m3 annually.
Box 5.2: If the sludge produced in the conventional scenario were reused in agriculture…
In the conventional scenario “other use” represents the use of sewage sludge for covering of old mining sites in Northern Sweden. It is worth noting that the P reuse potential compared to the conventional system, if the sludge were reused in agriculture rather than for covering of discontinued mining sites, would change. If 100% of the sewage sludge were reused in agriculture, the corresponding increased P reuse potentials for the source separating scenarios would be only 5 to 7%. This is not surprising given that the conventional wastewater treatment system, with P precipitation, is extremely efficient in capturing P in the sludge. For N the figures look a bit different. If 100% of the sludge from the conventional system were reused in agriculture the increased N reuse potential for the source‐separating system would still be 220 to 290% higher compared to the conventional system. These results are reflecting that the conventional system with N removal discharges N to air rather than capturing it to any larger degree in the sludge.

CarbonNeutralCitiesAllianceInnovationFundRound2RFP
24
6.Climateeffects Table 6.1 Summary of minimum potential to reduce greenhouse gas emissions (tonnes).
8,000 households 100,000 households Per capita (kg)
Biogas 207 2,592 11
Heat 1.,948 24,357 101
Nutrients 262 3,270 14
Total 2,417 30,219 126
Biogas and nutrients
Biogas is presently used to substitute fossil fuels for transport. The increased potential in biogas production could therefore contribute to a reduction of 200 tonnes CO2e annually for the 8,000 household scenario and 2,600 tonnes CO2e annually for the 100,000 household scenario respectively if used to substitute diesel.
Heat
The heat recovery would substitute the use of district heating. Even though the district heating system is highly efficient the effects of recovering heat on property level is substantial. For the 8,000 household scenario the reduction would be some 1 950 tonnes CO2e annually and 24 350 tonnes CO2e annually for the 100,000 household scenario. The figures are assumptions based on Fortum’s (energy utility) forecast for 2018. With planned reductions of fossil fuels in the district heating system, the effect will be less noticeable.
Nutrients
From a climate perspective, the importance of recycling nutrients is connected to the nitrogen content. Depending on the brand of commercial fertilizer the emissions from the production and transport of the fertilizer varies. The Swedish initiative “Climate Labeling of Food” has defined a maximum allowed emission at 3.6 kg CO2e/Kg nitrogen, which can be achieved with best available technology. The minimum increased potential by substituting commercial fertilizers with recycled nutrients from households would contribute to at least a reduction of 260 tonnes CO2e annually for the 8,000 household scenario and 3,300 tonnes CO2e annually for the 100,000 household scenario respectively.
The total reduction of 127 kg equals to a reduction of more than 5% of Stockholm’s average emissions 2015 of 2,5 tonnes/capita2. For assumptions, see Appendix 7.
2 http://miljobarometern.stockholm.se/klimat/utslapp-av-vaxthusgaser/utslapp-av-vaxthusgaser/

CarbonNeutralCitiesAllianceInnovationFundRound2RFP
25
7.Costsofscenarios
7.1BackgroundThe preliminary designs for Stockholm Royal Seaport’s source separating wastewater system are, at the submission of this report, not yet at a stage where the actual designs can be cost estimated. It is expected that the designs will be in a cost estimate state only by the end of 2017, hence, after the finalization of this project at hand. The cost discussion below is therefore based on cost estimates found in the literature.
It is also worth noting that cost estimates are, by their nature, imprecise. For example, Reicherter et al. (2001) gives the following guidelines on variability in cost estimates, in relation to the final costs, for infrastructure projects:
Table 7.1: variability in cost estimates in infrastructure projects (Reicherter et al. 2001).
Type of cost estimate Variability in cost estimate
Initial cost estimates ±30%
Cost calculation ±15%
Costs after awarding the contract ±5‐10%
Final costs ±0%
Cost estimates for source separating wastewater systems are even trickier, since their implementation still cannot be considered a conventional infrastructure project; few examples exist on which to base general cost estimates to begin with. Further confounding the comparison is the difference in the service delivered between the systems. A simple full supply cost comparison between conventional and innovative wastewater systems therefore becomes misguiding and would be inappropriate. As an example, a source separating wastewater system highly reduce the release of pathogens to water recipients since the flow with the highest pathogen content, the blackwater, is kept in land‐based loops. Moreover, source separating systems, as can be seen in Section 5.3, significantly reduce the release of N and P to air and water. Hence, the source separating system delivers a higher performing service than the conventional system, which in turn can be translated into differing environmental externalities for the two different systems.
This difference between the full supply cost and the total cost of projects has been illustrated by, for example, Rogers et al (1998), Figure 7.1. Note that the opportunity costs, economic externalities and environmental externalities can be both positive and negative. When calculating the full cost a higher performing system with fewer environmental externalities will lead to a lower full costs and hence represent a “negative” environmental externality.

CarbonNeutralCitiesAllianceInnovationFundRound2RFP
26
Figure 7.1: The relationship between full supply costs, full economic costs and full costs (from Rogers et al. 1998).
Therefore, in the below sections we are describing examples of full supply costs, as far as possible, given the limitations stated above, but also at qualitative and quantitative, when possible, estimations of for example the environmental and economic externalities.
7.2Fullsupplycosts–costestimatesfromSweden(Kärrmanetal.2017)Kärrman et al. (2017) have made the most recent cost estimates for source separating sanitation systems in the Swedish context for new, urban developments. A full analysis is available, in Swedish, in their report. Below some key concepts and conclusions from their study are presented.
Kärrman et al. (2017) have made cost estimates for two hypothetical, urban areas in Sweden, to compare extra costs related to the installation of separate collection of blackwater, kitchen waste and greywater in new, urban developments (Appendix 8). The cost estimates in the study use figures from existing source‐separating wastewater systems in e.g. the Netherlands, and actual costs for the Swedish setting for the conventional scenario.
In relation to costs for source‐separating sanitation systems the authors concluded the following:
x For urban, new development areas the implementation of a source‐separating sanitation system is slightly higher than for a conventional system.
x The bulk of that cost increase, however, is outside the water utility’s jurisdiction: it lies on the developers. (The increase in cost for the developer, however, can be considered small in comparison to the overall costs for the development; if the costs were to be covered by an increase in rent it would represent, for an average sized 2‐bedroom apartment, a monthly increase of 1,4%)

CarbonNeutralCitiesAllianceInnovationFundRound2RFP
27
x Hence, costs should not be a main barrier against the implementation of source separating systems in new, urban developments neither from a water utility perspective, nor from a developer’s perspective.
x However, the implementation of a source‐separating sanitation system will move costs between stakeholders so coordination between stakeholders is needed in a different way for source‐separating sanitation systems compared to the conventional system for which the institutional framework is set up.
7.2.1ReflectionontheKärrmanetal.(2017)resultsfromaStockholmRoyalSeaportperspectiveThe Kärrman et al (2017) study give some guidance and indications that are valid also for the Stockholm perspective, even if the scenarios investigated for the two different systems are not the same. It is reasonable to believe, for example, that (i) the implementation cost of a source‐separating system may be slightly higher than a conventional system also for SRS, (ii) costs should not be a main barrier against the implementation of a source‐separating system in Stockholm Royal Seaport, and that (iii) costs will be redistributed differently between stakeholders compared to a conventional system so overarching coordination between stakeholders will be needed. The indicated cost increase for the developer/home‐owner is questionable since the cost and the benefits of heat‐recovery have not been fully included in this study. According to Wallin (2015), it may even be a saving.
From a city perspective it may thus be that innovative city infrastructure, improving sustainability of a city’s function, may cause costs within the jurisdiction of one utility but also gains within another. Moreover, increased costs may occur outside the city’s utilities’ jurisdictions, as in this example to developers (and ultimately maybe to households), and gains in the other end: the agriculture. This complexity underlines the necessity of integrated decision‐making when it comes to investment in innovative infrastructure – the city needs to work in an integrated fashion and very closely with its own utilities and with all stakeholders involved.
For the water utility Kärrman et al (2017) estimated that the yearly cost increase per capita would be 25%, if the costs were to be carried by the citizens connected to the source‐separated system. If this would translate into a direct 25% increase of the water bill, across both the fixed and the varying part (Box 7.1), it would translate to an increase of about €100/year for a house. However, one can argue that the connection to the source‐separating system in both the SRS area and additional new developments throughout Stockholm, would improve for the whole of the city, since less nutrients will reach the waterways, there will be a decreased risk of spreading of disease, reduced discharge of pharmaceutical residues to the recipient among other things, see further Section 7.3 on cost‐benefit analysis.
One can also argue, as long as it does not go against existing laws and regulation, that a system that is slightly costlier for one specific area but also improving the service which benefits all

CarbonNeutralCitiesAllianceInnovationFundRound2RFP
28
citizens could be financed through a tiny tariff increase on all customers in Stockholm rather than through a tariff increase on the citizens for that specific area.
7.3Cost‐benefitanalysisA cost‐benefit analysis (CBA) is a decision‐support tool that helps comparing costs and benefits, including externalities, of two or more viable and mutually exclusive alternatives3. The method is anchored in economic theory, and established as a decision‐support tool in Sweden, e.g. in the Swedish Environmental Protection Agency (Kinell and Söderkvist, 2011). A weakness to the method is the difficulty of quantifying all factors. However, a CBA analysis is one way to at least highlight factors of importance, even if they, at the time of decision, cannot be fully quantified but only considered in a qualitative way.
7.3.1Cost‐benefitanalysisforanareainStockholmRoyalSeaportA CBA analysis has been made for source‐separating sanitation systems in the SRS area (Kinell et al. unpublished).
3 https://www.mitre.org/sites/default/files/publications/cost-benefit-analysis-govt-decisions-14-0929.pdf
Box 7.1: Water and sanitation tariff in Stockholm1
The water and sanitation tariff is set on local level by the municipal council. However, it is regulated by law that the total cost for water and sanitation services to the citizens cannot be higher than the costs considered necessary for the water utility to provide the services in question. The tariff should also consider principles of equality and reasonability.
The tariff in Stockholm is composed of two portions: (i) a “fixed” portion, and (ii) a portion based on consumption. The fixed portion of the tariff has three components: (i) the baseline fee which covers the basics of the service (invoicing, meters etc.), (ii) the “benefit” fee, which covers costs of water provision and wastewater treatment, and (iii) the stormwater fee which covers the water utility’s costs for providing stormwater services. The “fixed” fee still varies between types of consumers (single houses, clusters of houses, apartment complexes and industries have different baseline fees), consumption (the “benefit” fee varies according to consumption) and plot size (the stormwater fee is based on plot size, but can also be reduced if one can prove that the stormwater is infiltrated within the plot limits). The portion based on consumption is the same for the categories mentioned above (a special tariff is, however, applicable to heavier industries): €0.58/m3 consumed.
For a single house the “fixed” portion of the tariff amounts to €97/year for the baseline, €107/year for the “benefit”, and €44/year for stormwater, hence a total of €248. With the assumption of daily water use of 180L/capita and 4 people per house, the portion related to consumption, for a single house, is €175. In total, a family of four, living in a single house in Stockholm can be assumed to pay around €423/year for their water and sanitation services. For an apartment the calculation is less transparent, since the “benefit” fee and the stormwater fee both will depend on the size of the housing area. Moreover, water use is usually paid by the landlord and included in the rent.

CarbonNeutralCitiesAllianceInnovationFundRound2RFP
29
7.3.1.1ModelandsanitationsystemscomparedThe model for the CBA analysis is summarized in Figure 7.2 below.
Figure 7.2: The model used for the CBA analysis, figure adapted from Kinell et al. (unpublished).
The area for which the cost‐benefit study was made (7,000 apartments) is roughly responding to the area considered for the CNCA scenarios reported in Sections 5.1 to 5.3 of this report (8,000 apartments), although the cost‐benefit analysis made by Kinell et al (unpublished) also included the area’s work spaces (30,000) in their study. The number of people per apartment (1.9) is lower in the cost‐benefit analysis than assumed in the CNCA scenarios (2.4 – based on actual figures for the SRS)
Table 7.2: Overview of the scenarios used in the cost‐benefit analysis.
Cost estimates Cost‐benefit analysisSize 7,000 apartments and 30,000 work spaces Conventional – organic waste
Conventional: Combined wastewater conveyed to the WWTP. Tertiary treatment.
Conventional – wastewater
Enhanced conventional: Combined wastewater conveyed to WWTP. Tertiary treatment with addition of a membrane filter process. Costs based on actual costs and a tender for a planned extension.
Source‐separated – organic waste
Not included
Source‐separated – wastewater
“System 2”: urine‐diverting toilets in houses and offices. Urine is conveyed separately for intermediate storage, from which it is regularly transported to farmland for final storage before reuse. The remaining wastewater is conveyed to the WWTP, according to the conventional alternative above. “System 3”: Blackwater collection from vacuum toilets, through a vacuum system to intermediate storage, from which it is regularly transported to farmland for urea treatment and further storage before use. The remaining wastewater is conveyed to the WWTP, according to the conventional alternative above. Costs based on prefeasibility studies

CarbonNeutralCitiesAllianceInnovationFundRound2RFP
30
In this study three systems were compared against one another and against a 0 alternative:
x System 0 (reference): today’s sanitation system, where the mixed wastewater is conveyed to the wastewater treatment plant, with a certain inflow also of stormwater. The same treatment processes that were in place at the time of the study (around 2013) were assumed and an average of the sludge reuse of all treatment plants in Stockholm was used.
x System 1 (improved conventional): this system is an enhanced version of System 0, where planned process improvements were included: a membrane filter that will bring down N discharges to 4‐4.5 mg/L and P discharges to 0.1 mg/L. BOD. The sludge reuse assumed is the same as in System 0.
x System 2 (urine‐diversion): in this system urine‐diverting toilets are assumed in houses and offices, from which the urine is conveyed separately to an intermediate storage. From the storage the urine is transported to farmland for final storage before reuse. The remaining wastewater is conveyed to the treatment plant and assumed treated as in System 0.
x System 3 (separation of blackwater): in this system the blackwater flowstream is separated by means of vacuum toilets in houses and offices and conveyed by means of a vacuum piping system to an intermediate storage, before transport to farmland for treatment (wet composting) and reuse. The greywater in this system is conveyed to the treatment plant and assumed treated as in System 04.
7.3.1.2ResultsTable 7.3 shows a summary of both the costs (marked in red) and the benefits (marked in green) that were identified and qualitatively considered in the CBA by Kinell et al. (unpublished). Most of the benefit and cost factors listed in Table 7.3 were not possible to quantify due to lack of data of actual effects and their economic value. However, an overview of important factors and their qualitative assessment is still informative in the decision‐making process. The qualitative assessment shows that System 3, the system with separate collection of blackwater, is the system, which seems to offer the most benefits of the three assessed systems, Table 7.3. The same table also shows that qualitatively System 3 also would appear to have the highest costs of the three systems, when compared to the reference alternative.
4 This system roughly corresponds to the low-tech scenario used as one of the source-separating scenarios for generation of nutrient recovery potential.

CarbonNeutralCitiesAllianceInnovationFundRound2RFP
31
Table 7.3: A summary of the qualitatively considered benefits (marked green) and costs (marked red) for three different sanitation systems. Quantifiable factors are filled in with figures (adapted from Kinell et al. (unpublished)).
Benefits and costs (benefits are marked green and costs red) System 1 (enhanced
conventional)
System 2 (urine diversion)
System 3 (blackwater separation)
Decreased discharge of nitrogen and phosphorus to the recipient
0.29‐0.58 0,36‐0.78 0.5‐0.95
Decreased discharge of pathogens, parasites and viruses
Contributing to knowledge development
Contributing to the environmental profiling in SRS
Contributing to potential export of environmental technologies
Reduction of heavy metals to farmland 0.2 0.15
Increased recycling of nutrients to farmland 0.62 0.71
Acceptance of recycled products in agriculture
Reduced discharge of pharmaceutical residues to water
Reduced energy use 0.17 0.12
Potential to recover heat from greywater
Potentially decreased vulnerability compared to the reference alternative
Improved sanitization
Decreased water use
Decreased discharge of greenhouse gases 1.34 2
Estimated sum of minimum benefits compared to the reference alternative (MSEK/year)
0.3‐0.6 2.7‐3.1 3.5‐3.9
O&M costs
Organizational challenges
Different type of toilet
Vulnerability at power outages
More occurrences of human contact with wastewater
Estimated sum of costs (MSEK/year) 4,2 2,6 – 10,6 5,4 – 19,4
Ratio ‐ Benefits / costs 0,071 – 0,14 0,25 – 1,19 0,18 – 0,72
The span of costs for Alternative 2 and 3 is due to very rough estimates for (i) an early systems analysis and (ii) a prefeasibility study. Neither of these studies had focused on optimizing the design of the system but rather the environmental benefits and the technical feasibility. A

CarbonNeutralCitiesAllianceInnovationFundRound2RFP
32
detailed design would have to optimize technical performance of the system and assure the cost efficiency. The study also shows the difficulty to compare the economic costs of existing conventional technology with new systems ideas in early stages.
Even so, the study indicates that societal benefits in relation to the costs are worth considering as table 7.3 is only displaying minimum estimations of those benefits the authors felt confident to quantify.
With these uncertainties it is not possible to use the results in the table for a clear‐cut decision on which system gives the highest benefits to society. The authors (Kinell et al. (unpublished)) therefore concluded that the quantified results presented in Table 7.3 in its whole should be seen as indications that the expensive investments will produce benefits to the society. The authors also concluded that the source‐separating systems are expected to generate the largest benefits, even if all of them were not quantifiable.
The authors further underlined the long lifetime of sanitation investments in urban areas. This long lifetime of urban infrastructure leads to the necessity of planning for possible future demands on the sanitation system of Stockholm in the decision‐making process. There are reasons to believe that the future may hold (i) stricter legislation regarding discharge levels of heavy metals, chemicals, and pharmaceutical residues, (ii) increased risks of flooding, (iii) water shortages, and (iv) increased demands on nutrient recycling to farmland. Such a changing context and legislative landscape will of course affect how a CBA of sanitation systems would look like.
The authors further concluded that there is a need to further develop the knowledge about the different benefits of different sanitation systems, and their quantification. In this analysis the authors have attempted to quantify some of the important environmental factors, but more knowledge is needed about for example discharge of different substances, and maybe the use of a life‐cycle analysis perspective on discharge from different parts of the sanitation systems to improve the comparability of more substances.
8.Businessandmanagementmodels
8.1BusinessmodelGiven that the system design is not finished for the SRS area, let alone no decisions taken for investment in source‐separating systems, it is not yet possible to present a fully developed business plan for the concept. Instead, we are using a simplified business model for mapping purposes, as a structured way of looking at a business and mapping the activities related to source‐separating sanitation system services.

CarbonNeutralCitiesAllianceInnovationFundRound2RFP
33
Table 8.1 Potential cost and revenue distribution.
Developers Utility
Biogas Required additional Investment
Separate pipe (food waste) Separate pipe
Revenue Revenue from increased biogas production
Heat Required additional Investment
Separate pipe (gre water) + heat exchanger
As before
Revenue Decreased costs As beforeNutrients Required additional
Investment Separate pipe (blackwater) Separate pipe + Treatment plant
Revenue Decreased costs for treatment Revenue from fertilizers
According to the study described in section 7.2 the investment cost in a source‐separated system is most likely to land on the developer and the utility. However, the investments for the developer are motivated by the saved costs according to Wallin (2015 and 2017). The investments for the utility will have to be weighed against the economic benefits described in table 7.3 above.
8.2ManagementanddivisionofresponsibilityGiven the present situation, that Stockholm Water and Waste Company manages both kitchen waste and wastewater streams, the distribution of responsibilities is not that different from the existing situation.
The question is rather from which stream of revenue such a system will be financed as the flowstreams may fall under different legislation and thereby should be covered by different fees. The kitchen waste falls under the Waste Decree and mixed wastewater under the Water‐and Wastewater Services Act. The source‐separated blackwater could fall under either legislative framework; it could be considered source‐separated household waste or wastewater. The definition determines the principal utility and on what grounds fees can be collected. For Stockholm the definition is not clear and an ongoing legal study will provide a basis for such a decision.
CarbonNeutralCitiesAllianceInnovationFundRound2RFP
34
9.Discussion
9.1BiogasandnutrientsFrom the scenario modeling presented in this report it can be shown that an increase in recycling potential and thereby a reduction of climate emissions, can be achieved by a shift towards source‐separation of blackwater from greywater. The biogas potential can be increased by 70% for the separated blackwater compared to the conventional system. The corresponding potential for nutrient recycling is increased by between 2200 to 3200% for the source separating scenarios compared to the conventional scenario. It is also worth noting that the source‐separation scenarios decrease discharges of N and P to air and water, when compared to the conventional system. However, there are costs involved in realizing these potentials, as is always the case when increasing the performance of an urban technical system (e.g. going from secondary to tertiary wastewater treatment or from combined to duplicate sewer systems).
Furthermore, the optimal system for increase in biogas potential, the UASB‐ST system, is not the one optimal for nutrient recycling, which is the urea sanitization. Recovery of nutrients from blackwater that has gone through biogas production with a UASB‐ST will entail high‐energy and chemical demanding processes such as ammonia stripping and struvite precipitation, where ammonia stripping is a well‐established technology to treat biogas reject streams and struvite precipitation has been applied on anaerobically digested blackwater in full‐scale both in the Netherlands and Germany (Larsen et al., 2013). These high‐tech solutions, on the other hand, will produce highly concentrated products which are more easily stored and transported. The urea sanitization scenario, on the other hand, has the highest nutrient recycling potential. It is a method that is gaining a foothold in the Swedish setting for blackwater collected from on‐site systems (Länsstyrelserna, 2013, McConville et al. 2017). Its main drawback is that the end product is very dilute with large volumes to transport from the treatment plant to agricultural land, where further storage is needed for optimum use. In fact, it has been estimated that the transportation costs of blackwater, even if collected with vacuum toilets, will represent the largest expense in the yearly system’s cost (Vectura, 2012).
For the organic waste systems it can be seen that the source‐separating technology with kitchen waste grinder to pipe provides a slight increase in biogas potential (15%) and a doubling of the nutrient recycling potential even if the total amount of nutrients is considerably lower than for blackwater. The kitchen waste grinder to pipe system can be connected to the already established biogas production and agricultural reuse system for organic solid waste.
For agricultural reuse of blackwater products, acceptance by the farmers of the end products is crucial as are reliable agreements with farmers or other users of the products. This report does not look into the acceptance of the different end products, struvite and an ammonia solution for the UASB‐ST high‐teck scenario and sanitized blackwater for the urea scenario. For a real‐life

CarbonNeutralCitiesAllianceInnovationFundRound2RFP
35
setting where the intention is agricultural reuse, there is a great need to involve the farming community from the start of the technical development.
9.2HeatIt is clear that the heat available in the wastewater leaving households represents an important energy source, with a potential to recover up to 80% in a source‐separated wastewater system . This is especially important, as new developments will be required to be built according to passive house standards. This is an under‐tapped source of energy in existing housing and also in new developments, a fact that merits further studies. The increase in potential for heat recovery on greywater compared to mixed wastewater is gaining recognition in the sector but still represents an unknown, compared to heat recovery from mixed wastewater.
Extracting and reusing heat from wastewater in the same manner as has been done from ventilation is one of the most important aspects from a climate perspective. With current emission factors of the district heating system, it is also, from a climate perspective, a significant contribution to reduction of GHG emissions from the built environment.
One concern with upstream heat recovery on wastewater, frequently raised by wastewater utilities, is the risk of lower temperatures on incoming wastewater, which could jeopardize unit processes, such as N removal, in the treatment plant. However, separation of blackwater from the wastewater stream will lower the need for removal in the conventional wastewater treatment plant, which will also lower the heating need on treatment plant level.
Moreover, modelling for a new development area in Uppsala showed that the effect of heat recovery on building level had less of an overall effect on the incoming wastewater temperature to the treatment plant than the infiltration of ground water into pipes on its way to the treatment plant (Berggren et al., 2015).
9.3GeneralThe above highlights that separation of blackwater from greywater will increase the potentials for biogas production, heat recovery and nutrient recycling, all contributing to reducing emissions of GHG. However, there is a need for further development for blackwater recycling technologies, as well as the need to balance trade‐offs between optimal biogas production and optimal nutrient recovery. Furthermore, there is a need to better understand the heat recovery potentials on greywater both at property‐/city district levels but also its effects on wastewater treatment plant processes.
There are always additional costs related to innovation transition and development of knowledge. However, as Kinell et al. concluded, that even with higher investment cost and uncertainties, the source‐separating systems are expected to generate the largest benefits, even if all of them were not quantifiable to date.
From a climate perspective, systems that ensure recirculating of resources are always beneficial. Even in the Swedish context, with efficient energy‐ and wastewater management

CarbonNeutralCitiesAllianceInnovationFundRound2RFP
36
systems, the potential to reduce GHG emissions by separating flowstreams is significant. The increased potential for biogas generation, nutrient recycling and heat recovery that are the core benefits of such a system, are all important contributions to reduction of GHG emissions.
10.ConclusionsIt should be noted that this report is presenting potentials for biogas, heat and nutrient recycling. The calculations behind these potentials are based on a number of necessary assumptions, which inherently will afflict the results with insecurity. They should therefore be seen as an assessment of potentials, not as absolute values or absolute results. There is still, however, a value to engage in scenario modeling to inform decision‐making processes, since carefully produced scenario modeling with clearly stated assumptions provides a possibility to better understand future possibilities.
Biogas potential
A source‐separating scenario, where blackwater is separated from the greywater and where the organic waste is collected via a kitchen disposer to a separate system, is estimated to increase the biogas potential for both organic waste and for wastewater, although the highest potential is estimated to lie with the separation of blackwater from the greywater, around 70%. It can also be concluded that the same potential is considerably lower for the organic waste flow, around 15%, but the losses in this flowstream, both within a conventional system and the source‐separating system can be influenced by targeting organic waste behavior at the household level.
For the organic solid waste systems it can be seen that the source‐separating technology with waste disposer to pipe provides a slight increase in biogas potential (15%) and a doubling of the nutrient recycling potential even if the total amount of nutrients is considerably lower than for blackwater. However, the waste disposer to pipe system can relatively easily plug into the existing biogas production and agricultural reuse system for solid organic waste.
Heat potential
In new development areas, where it is possible to consider source‐separation the heat recovery potential can be increased. It has been estimated, theoretically, that 33% more energy can be recovered with a heat exchanger on greywater compared to the same heat exchanger on a mixed wastewater (Nykvist, 2013). To improve the evenness of the flow, which is also important for the functionality of the heat recovery process irrespective of flow, it could be advisable to employ the heat recovery on a larger level than household/property level. In total, up to 80% of the energy wastewater can be recovered.
Nutrient potential
The nutrient recovery potential assessment includes two different scenarios, both a high‐tech nutrient recovery alternative which can be combined with the biogas technology explored

CarbonNeutralCitiesAllianceInnovationFundRound2RFP
37
under the biogas potential, an alternative called UASB high‐tech, and a lower‐tech scenario without biogas recovery, called urea sanitization.
The increase in potential of N reuse, compared to the conventional system, is over 2600% for the UASB high‐tech scenario and over 3200 % for the urea sanitization scenario. The urea sanitization scenario also has the lowest N “discharge” outlet of all three scenarios. For P the same dramatic shift can be seen for both source‐separating scenarios but from “other use” to “agricultural use” compared to the conventional scenario; the increase is over 2200% for both source‐separating alternatives.
The choice of treatment method will influence the potential, the optimal system for increase in biogas potential, the UASB‐ST system is not the one optimal for nutrient recycling, which is the urea sanitization. Recovery of nutrients from blackwater that has gone through biogas production with a UASB‐ST will entail high‐energy and chemical demanding processes such as ammonia stripping and struvite precipitation. These high‐tech solutions, on the other hand, will produce highly concentrated products, which are more easily stored and transported which is vital in urban areas. The urea sanitization scenario, on the other hand, has the highest nutrient recycling potential and it is a method that is gaining a foothold in the Swedish setting for blackwater collected from on‐site systems. Its main drawback is that the end product is very dilute with large volumes to transport from the treatment plant to agricultural land, where further storage is needed for optimum use.
Climate effects
Source‐separating wastewater systems open up potentials to reduce GHG emissions significantly. The Stockholm Royal Seaport road map to a climate positive city district (2016) shows that for the Stockholm context, saving energy (heat) in the built environment is the one most important aspect to address. With a source separated wastewater system the heat recovery can be optimized and contribute to a significant reduction of GHG emissions. From a costing perspective, the energy saving potential at the property level, can also be a driver for developers to install a source‐separated system in the buildings.
The climate effect of biogas generation has also been high up on the agenda as a means to reduce GHG emissions whereas recycling of nutrients has been discussed from the point of phosphorus as an ending resource, not to oversee. Even so, it is the nitrogen content in commercial fertilizers that contributes to GHG emissions and the potential to reduce emissions through recycling a qualitative product that can be accepted by agriculture, are in the same range as generating biogas as a substitute to fossil fuels in the transport system
Costs
However, there are costs involved in realizing these potentials, as is always the case when increasing the performance of an urban technical system (e.g. going from secondary to tertiary wastewater treatment or from combined to duplicate sewer systems).

CarbonNeutralCitiesAllianceInnovationFundRound2RFP
38
The cost, however, have to be considered in relation to the benefits the upgrading can provide. The investments on the property level are most likely motivated by the cost‐savings from recycled heat, (Wallin 2017) and the costs for infrastructure can be motivated by the economic benefits, some quantified others yet to be quantified.
Acceptance
The developers’ acceptance for a new sanitation system that consists of waste disposers, vacuum toilet and three pipes out depends on the market for housing. As long as a system does not require that users need to change their behavior too much and that it contributes to improving the economic plan, it stands a good chance to be accepted. Moreover, the proposed system is included in the sustainability requirements for a current development plan in SRS with 14 developers.
The water utility is restricted by the legislation and the mandate they have been given, which is to treat/distribute water and collect/treat wastewater. The biogas, heat and nutrient‐rich flowstreams are by‐products that should be managed as resourcefully as possible. The overall benefits of a source‐separating wastewater system goes beyond this mandate, in the sense that to optimize the system, the system‐boundaries have to extended, and each flowstream with its particular resource must be managed in such a way that it’s coming to best use. This requires a different approach and a system‐thinking that goes beyond the water cycle.
For agricultural reuse of blackwater products, acceptance by the farmers of the end products is crucial as are reliable and long‐term agreements with farmers or other users of the products. This report does not look into the acceptance of the different end products, struvite and an ammonia solution for the UASB‐ST high‐teck scenario and hygienized blackwater for the urea scenario. For a real‐life setting where the intention is agricultural reuse, there is a great need to involve the farming community from the start of the technical development.
The above highlights that separation of blackwater from greywater will increase the potentials for biogas production, heat recovery, nutrient recycling and water saving. However, there is a need for further development for blackwater recycling technologies, as well as the need to balance trade‐offs between optimal biogas production and optimal nutrient recovery. Furthermore, there is a need to better understand the heat recovery potentials on greywater and its effects on wastewater treatment plant processes.
11.ReferencesAtkins. 2016. Plockanalys mat‐ och restavfall från hushåll 2015. Malmö Atkins Sweden, Inc.
Bergrén, J., 2009. ”Heat recovery from wastewater – apartment complexes. Follow‐up of experiences from two apartment complexes”. In Swedish.

CarbonNeutralCitiesAllianceInnovationFundRound2RFP
39
Berggren, A.B.; Ryd, E.; Persson, M.; Olivecrona, Z. 2015. ”Heat reuse from wastewater – Implementation in Rosensdal”. In Swedish. Student study, Swedish University of Agricultural Sciences, Uppsala, Sweden.
Bernstad, A.; Malmquist, L.; Truedsson, C.; la Cour Jansen, J. 2013. Need for improvements in physical pretreatment 438 of source‐separated household food waste. Waste Management. 33, 746‐754.’
Gröna Bilister – Fuel facts 2015 http://www.gronabilister.se/drivmedelsfakta2015
IVL. 2015. Evaluation of different organic waste collection systems in Stockholm. Swedish Environmental Research Institute, Stockholm, Sweden. In Swedish.
Jönsson, H.; Baky, A.; Jeppson, U.; Hellström, D.; Kärrman, E. 2005. Composition of urine, feces, greywater and biowaste for utilization in the URWARE model. The MISTRA program Urban Water, Report 2005:6.
Kinell, G., Söderqvist, T. 2011. ”Economic valuation using the stated preference method. A guidance for implementation and procurement”. In Swedish. Report 6469, Swedish Environmental Protection Agency, Stockholm. Downloaded from http://www.diva‐portal.org/smash/get/diva2:739119/FULLTEXT01.pdf
Kinell, G., Soutukorva, Å., Finnveden, G. Unpublished. “Cost‐benefit analysis of wastewater systems in Stockholm Royal Seaport”. In Swedish.
Kjerstadius, H.; Davidsson, Å.; la Cour Jansen, J. 2012. Sustainable systems for biogas from wastewater and organic solid waste. Rapport SGC 2012:271. Malmö, Swedish Gas Technology Centre. In Swedish.
Kjerstadius, H.; Haghighatafshar, S.; Davidsson, Å. 2015. Potential for nutrient recovery and biogas production from blackwater, food waste and greywater in urban source control systems. Environmental Technology, 36(13), 1707‐1720.
Kjerstadius, H.; Bernstad Saravia, A.; Spångberg, J. 2016. Can source separation increase sustainability of sanitation management? Report, Water and Environment Engineering, Lund University.
Kärrman, E., Kjerstadius, H., Davidsson, Å., Hagman, M. and Dahl, S. 2017. ”Source‐separating systems for wastewater and food waste – experiences, implementation, economy and societal benefit”. In Swedish. SVU report 2017‐04. Swedish Water and Wastewater Works Association.
Larsen, T.A.; Udert, K.M.; Lienert, J. (eds). 2013. Source separation and decentralization for wastewater management. IWA Publishing, London, the UK.
Lennartsson, M., Salmhofer, C., 2016. “The Stockholm Royal Seaport Road Map The Journey Has Begun”

CarbonNeutralCitiesAllianceInnovationFundRound2RFP
40
Länsstyrelserna. 2013. “Prerequisites for recycling of waste from vacuum toilets and holding tanks in Kungsbacka” In Swedish. Swedish County Boards’ report 2013:72, downloadable from http://extra.lansstyrelsen.se/havmoterland/SiteCollectionDocuments/Publikationer/2013‐72.pdf.
McConville, J., Kvarnström, E., Jönsson, H., Kärrman, E. & Johansson, M. 2017. Source Separation: Challenges and Opportunities for Transition in the Swedish Wastewater Sector. Resources, Conservation and Recycling, 120: 144‐156.
Nykvist, A. 2012. ”Heat Recovery from Wastewater in apartment buildings – Pre‐study for technology procurement” In Swedish. WSP Report. http://www.bebostad.se/wp‐content/uploads/2013/10/Bilaga_15_Forstudie_Varmeatervinningssytem_for_spillvatten_i_flerbostadshus.pdf.
Nykvist, A. 2013. “Energy calculations – wastewater” In Swedish. PM from WSP Sweden, Inc.
Rogers, P., Bhatia, R., Huber, A. (1998). Water as social and economic good: How to put principles into practice. Global Water Partnership, TAC background papers No. 2. http://emerald.tufts.edu/water/pdf/iwrm_AHL_TAC2.pdf
Stockholm City (2015). Stockholm’s Stormwater Policy. In Swedish. Downloaded December 6, 2016 from http://www.stockholmvatten.se/globalassets/pdf1/avloppsvatten/dagvatten/stockholms‐dagvattenstrategi_webb2015‐03‐09.pdf
Stockholm Water Company. 2015a. Stockholm’s future wastewater management – sewer system. Appendix C. Report Stockholm 2015‐06‐01. In Swedish. Downloaded December 6, 2016 from http://www.stockholmvatten.se/globalassets/sfa/pdf/tillstandsansokan/bilaga‐c/bilaga‐c‐teknisk‐beskrivning‐ledningsnat‐spillvatten.pdf
Stockholm Water Company. 2015b. Environmental Report for Stockholm Water Company 2015. In Swedish. Downloaded December 6, 2016 from https://insynsverige.se/documentHandler.ashx?did=1847509
STOWA. 2014. Evaluatie nieuwe sanitatie Noorderhoek Sneek. STOWA report 38, 2014. Downloadable from http://www.stowa.nl/publicaties/publicaties/evaluatie_nieuwe_sanitatie_noorderhoek_sneek
Svenskt Sigill, ”Climate labeling of food 2012:2” http://www.klimatmarkningen.se/wp‐content/uploads/2011/01/Klimatcertifiering‐for‐mat‐2012‐2.pdf
SVEBY. 2016. ”Management of hot water energy for calculation, measurement and verification” In Swedish. http://www.sveby.org/wp‐content/uploads/2016/07/Sveby‐PM‐tappvarmvatten‐160621.pdf
Swedish Energy Agency. 2009.“Measurements of domestic cold and hotwater in 44 dwellings”. In Swedish. ER 2009:26.

CarbonNeutralCitiesAllianceInnovationFundRound2RFP
41
Vectura. 2012.”Vacuum system in Värtan, the Royal Seaport Area” In Swedish. Vectura, Solna, Sweden.
Wallin, J. 2015. ”Huddinge Hospital – pre‐study of wastewater heat recycling Step 2”. In Swedish. Consultant report.
Wallin, J., 2017. “Extended study of efficiency of heat exchanger in wastewater heat recycling, Vasagatan 7 – Stockholm”. In Swedish. BELOK.
Wittgren, HB; Malmqvist, PA; Norström, A; Pettersson, F; Svensson, G: (2011) ”Systemanalys av kretsloppssystem för Norra Djurgårdsstaden, Stockholm. CIT Urban Water Management Report No 2011:1.

CarbonNeutralCitiesAllianceInnovationFundRound2RFP
42
Appendix1–Generalassumptionsforthecomparisonbetweenscenarios
Business‐as‐usual Source‐separation of organic household waste and blackwater
Reference/comment
Household size (persons/household)
2.4 2.4 Stockholm Royal Seaport Statistics
Size scenario Royal Seaport Area (# households)
8,000 8,000 The households in the Royal Seaport Area for which source separation can be implemented.
Size scenario metro area Stockholm (# households)
100,000 100,000 The planned new developments in the Stockholm metro area comprises of more than 100,000 apartments.
Organic waste collection system
Separate collection of organic waste in paper bags. Conveyance of paper bags to the biogas plant through trucks.
Garbage disposer to separate pipe conveying only organic waste to the biogas plant.
Blackwater and greywater systems
Blackwater and greywater is conveyed combined to the conventional WWTP
Blackwater is conveyed via vacuum pipes to separate WWTP. Greywater is conveyed via gravity sewers to the conventional WWTP.
Stormwater system Local retention and treatment of stormwater
Local retention and treatment of stormwater
Existing stormwater policy Stockholm City (2015)
*: the most commonly used system today among households with separate collection of organic waste.

CarbonNeutralCitiesAllianceInnovationFundRound2RFP
43
Appendix2–Assumptionsbehindthebiogascomparisonandthenutrientcalculations
Table A2.1: Biogas assumptions.
Business‐as‐usual scenario
Source separation of blackwater and organic household waste
References/comments
Organic waste collection system
Collection of organic waste in bag*
Garbage disposer to separate pipe system
Produced (g TS/cap/day and g
VS/cap/day)
68.2 58
68.2 58
Jönsson et al. (2005), Kjerstadius et al. (2016)
Collection rate (%) 50 50 Kjerstadius et al. (2016)
Losses (%) Collection: 2 Treatment: 20
Collection: 6 (8,000 hh) and 10 (100,000 hh) Treatment: 0
IVL (2015), average treatment losses for conventional system based on Bernstad et al (2013). Kjerstadius et al. (2016)
Digestion (%) 77 77 Kjerstadius et al. (2012)
Methane production (Nm3CH4/cap/yr)
3.26 3.91 (8,000 households) and 3.74 (100,000 households)
Kjerstadius et al. (2015) and Kjerstadius et al. (2016)
Type of anaerobic digester
CSTR UASB‐ST
Blackwater collection system
Combined with greywater and conveyed to the conventional WWTP.
Collection of blackwater separately for separate conveyance and treatment.
Produced (g TS/cap/day and g
VS/cap/day)
73.5 53.8
73.5 53.8
Jönsson et al. (2005), Kjerstadius et al. (2016)
Losses (% of TS and VS)
Collection: 6 (8,000 hh), 10 (100,000 hh) Treatment: 40
Collection: 0 Treatment: 0
IVL (2015), Kjerstadius et al. (2012), Kjerstadius et al (2016) No losses for source separation due to short retention time in vacuum system.
Digestion (%) 55 65 Kjerstadius et al. (2012)
Methane production (Nm3CH4/cap/yr)
3.23 (8,000 hh), 3.09 (100,000 hh)
6.64 Kjerstadius et al. (2015) and Kjerstadius et al. (2016)

CarbonNeutralCitiesAllianceInnovationFundRound2RFP
44
Greywater collection system and biogas potential
Combined with blackwater and conveyed to the conventional WWTP.
Separate collection and conveyed to the conventional WWTP.
Produced (g TS/cap/day and g
COD/cap/day)
54.5 48
54.5 48
Jönsson et al. (2005), Kjerstadius et al. (2016)
Losses (% of COD) Collection: 6 (8,000 hh), 10 (100,000 hh) Treatment: 40
Collection: 6 (8,000 hh), 10 (100,000 hh) Treatment: 40
IVL (2015), Kjerstadius et al. (2012), Kjerstadius et al (2016)
Digestion (%) 56 65 Kjerstadius et al. (2015)
Methane production (Nm3CH4/cap/yr)
1.94 (8,000 hh) and 1.85 (100,000 hh)
2.25 (8,000 hh) and 2.15 (100,000 hh)
Kjerstadius et al. (2015) and Kjerstadius et al. (2016)

CarbonNeutralCitiesAllianceInnovationFundRound2RFP
45
Table A2.2: Nutrient calculations assumptions.
Household wastewater
P per p/d, gram
N per p/d, gram Reference
Grey water 0,15 1,53 Jönsson, H.; Baky, A.; Jeppson, U.; Hellström, D.; Kärrman, E. 2005. Composition of urine, feces, greywater and biowaste for utilization in the URWARE model. The MISTRA program Urban Water, Report 2005:6.
Urine 0,9 11
Feces 0,5 1,5Total g/p*d 1,55 14,03Total kg/p*year 0,56575 5,12095Wastewater treatment and sewage system Overflow from sewage system, % of total volume 0,41%
Stockholm Water Company, 2015
Reduction of P in WWTP 97% Reduction of N in WWTP 59% P in sludge from WWTP 97%
All sludge to Other use
N in sludge from WWTP 21%
All sludge to Other use
Food waste P per p/d, gram
N per p/d, gram
Food waste to grinder 0,14 0,81
Kjerstadius, H.; Haghighatafshar, S.; Davidsson, Å. 2015. Potential for nutrient recovery and biogas production from blackwater, food waste and greywater in urban source control systems. Environmental Technology, 36(13), 1707‐1720.
Food waste to other waste (incineration) 0,13 0,78Nutrients in food waste lost as reject in pre‐treatment 55% 28%

CarbonNeutralCitiesAllianceInnovationFundRound2RFP
46
Appendix3–Assumptionsfortheheatcalculations Business‐as‐usual Source‐separation of
organic household waste and blackwater
Reference/comment
Energy use for hot water
25 kWh/m2 and yr 25 kWh/m2 and yr SVEBY (2016)
Average apartment size
100 m2 100 m2 Stockholm Royal Seaport statistics
Total amount of energy in wastewater/cap
1 042 kWh/cap and yr 1 042 kWh/cap and yr
Recovery of energy in WWTP
1.4 TWh Stockholm Water Company (2015b)
Connected cap 1 178 000

CarbonNeutralCitiesAllianceInnovationFundRound2RFP
47
Appendix4Baselinescenarioresults
A4.1Biogasproductionpotentialinthebusiness‐as‐usualscenarioThe biogas potential for the business‐as‐usual is using separate collection of organic household waste in bags and bins as the method of organic waste collection. This is the most commonly used collection method for those households with separate collection in Stockholm today. More details around the assumptions made for the business‐as‐usual scenario is shown in Annexes 1 and 2.
The increased potential described in the distance a biogas‐fuelled car can travel with the gas produced with the business‐as‐usual for the 8,000 households is 2.7 million km and the same figure for the 100,000 household scenario is 32 million km5. However, the most interesting figure is of course to compare the difference in potential between the conventional system and the source‐separating system, since that represents the net increase/decrease in resource recovery by shifting in infrastructural approach to collection of wastewater and organic waste.
A4.2Heatrecoverypotentialinthebusiness‐as‐usualscenarioThe average energy use for hot water used in calculations is 25 kWh/m2 built area and year (SVEBY, 2016). For the average sized apartment this is equivalent to 2 500 kWh/ year or 1 050 kWh/person.
Today heat recovery in wastewater at the property level is not widely applied, and the excess heat leaves the building with the wastewater. The more stringent energy efficiency requirements becomes, developers are testing techniques to recover some of the heat, but still only 5‐10% is recovered.
5 http://www.gasbilen.se/att-tanka-din-gasbil/faqfordonsgas/faqbransleforbrukning
Box A41: The biogas potential in a business‐as‐usual employed for the upcoming households in the Royal Seaport Area (8,000 households) and for the full planned development in the metropolitan area of Stockholm (100,000 households)
System 8,000 households methane production (Nm3CH4/yr)
100,000 households methane production (Nm3CH4/yr)
Conventional system – organic solid waste
63,000 780,000
Conventional system – domestic wastewater
99,000 1,190,000
Conventional system ‐ TOTAL 162,000 1,970,000

CarbonNeutralCitiesAllianceInnovationFundRound2RFP
48
Figure A4.1: Energy balance in an energy efficient building.
The excess heat is recovered at end‐of‐pipe in heat pumps in Bromma and Henriksdal wastewater treatment plants. Today, on a yearly basis approximately 28,7 GWh are recovered in those two treatment plants (Stockholm Water Company Environmental report 2015). With 1 178 000 person equivalents connected to the two WWTPs this is approximately 24 kWh/person and year, meaning that only 2% of the hot water energy is recovered. Hence, a lot of the energy in the domestic wastewater, derived from hot water use on household level, is lost before the wastewater reaches the wastewater treatment plant. The supplied energy for hot water constitutes approximately half of the total energy consumption on household level. By separating the greywater and blackwater on household level, the excess heat in the greywater can be recovered more efficiently at the property level. Existing technology is for conventional wastewater the recovery potential is 20‐25% with a potential to improve the recovery efficiency up to 70% (Nykvist, 2012).
A4.3Nutrientrecoverypotentialinthebusiness‐as‐usualscenarioIn a business‐as‐usual nutrient recovery scenario, the wastewater from the 8,000 and 100,000 households in the two different scenarios goes to Henriksdal wastewater treatment plant and the organic waste is collected separately in paper bags, Appendix 1. The resulting N and P flows are shown in Figure 4a, 4b, 4c and 4d (the flow charts are shown in Appendix 4). As can be seen there is no return of N and P to agriculture from wastewater treated in Henriksdal WWTP. This is somewhat in contradiction to Figure 1, where 19% of the Stockholm sludge is reported as reused in agriculture. The sludge reused in agriculture comes exclusively from Bromma WWTP.

CarbonNeutralCitiesAllianceInnovationFundRound2RFP
49
Henriksdal is “the natural” WWTP for the Royal Seaport area and Bromma WWTP will be decommissioned from service in the future, hence it is reasonable to model the conventional nutrient recovery business‐as‐usual based on Henriksdal WWTP.
For the organic waste it can be seen that there is high reuse today for the fraction that gets collected and digested; 2674 kg N/yr and 454 kg P/yr is the potential for the 8,000 households in the Royal Seaport and 33,428 kg N/yr and 5676 kg P/yr for the scenario with a 100,000 new apartments in the metro area of Stockholm, and Table 1. The larger problem here, which is the same both for the conventional collection of organic waste in paper bags and the source‐separating scenario with garbage disposers, is the behavior on household level, which is determining the size of organic household waste losses to the solid waste rest fraction on household level in Figures 1 and 4 a to d.
Table A4.1: N and P flows in the conventional scenario for 8,000 and 100,000 households.
Type of outlet
Outlet N 8,000 households (kg/yr)
P 8,000 households (kg/yr)
N 100,000 households (kg/yr)
P 100,000 households (kg/yr)
Discha
rge
Discharge to water 19606 325 245076 4064 Overflow to recipient 403,1
44,5 5039 556,7 Ash to landfill 0 1419 0 17739 Discharge to air 66195 0 827438 0
Other
use
Covering of mining sites 20586 10512 257330 131396
Agric
ultural
use
Organic waste biosolids to agric.
2674 454 33428 5676
Fertilizer from blackwater
0 0 0 0

CarbonNeutralCitiesAllianceInnovationFundRound2RFP
50
Figure A4.2: N flows in a conventional system for 8,000 households, kg N/yr.
0
20000
40000
60000
80000
100000
Discharge Other use Agricultural use
N flows 8,000 hh Conventional
Conventional
18%
0%0%
61%
19%
2% 0% Discharge to water
Overflow to recipient
Ash to landfill
Discharge to air
Covering of mining sites
Organic waste biosolids toagric.
Fertilizer from blackwater

CarbonNeutralCitiesAllianceInnovationFundRound2RFP
51
Figure A4.3 : P flows in a conventional system for 8,000 households.
0
2000
4000
6000
8000
10000
12000
Discharge Other use Agricultural use
P flows 8,000 hh Conventional
Conventional
3% 0%
11% 0%
82%
4%
0%
Discharge to water
Overflow to recipient
Ash to landfill
Discharge to air
Covering of mining sites
Organic waste biosolids to agric.
Fertilizer from blackwater

CarbonNeutralCitiesAllianceInnovationFundRound2RFP
52
Figure A4.4: N flows in a conventional system for 100,000 households.
0
200000
400000
600000
800000
1000000
1200000
Discharge Other use Agricultural use
N flows 100,000 hh Conventional
Conventional
18%
0%0%
61%
19%
2% 0%
Discharge to water
Overflow to recipient
Ash to landfill
Discharge to air
Covering of mining sites
Organic waste biosolids to agric.
Fertilizer from blackwater
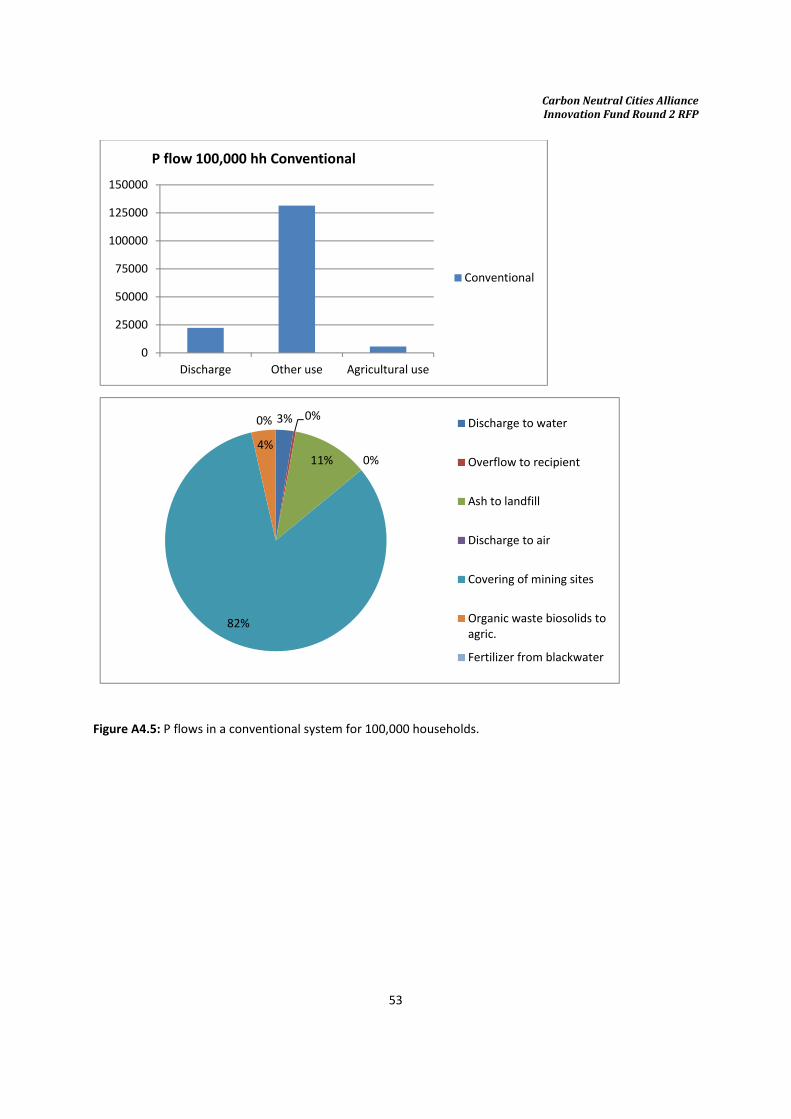
CarbonNeutralCitiesAllianceInnovationFundRound2RFP
53
Figure A4.5: P flows in a conventional system for 100,000 households.
0
25000
50000
75000
100000
125000
150000
Discharge Other use Agricultural use
P flow 100,000 hh Conventional
Conventional
3% 0%
11% 0%
82%
4%
0% Discharge to water
Overflow to recipient
Ash to landfill
Discharge to air
Covering of mining sites
Organic waste biosolids toagric.
Fertilizer from blackwater

CarbonNeutralCitiesAllianceInnovationFundRound2RFP
54
Appendix5Nutrientflowscenarios–flowcharts
Figure A5.1: N flows conventional system, 8000 households
Figure A5.2: P flows conventional system, 8000 households

CarbonNeutralCitiesAllianceInnovationFundRound2RFP
55
Figure A5.3: N flows conventional system, 100,000 households
Figure A5.4: P flows conventional system, 100,000 households

CarbonNeutralCitiesAllianceInnovationFundRound2RFP
56
Figure A5.5: N flows source‐separation high tech, 8000 households
Figure A5.6: P flows source‐separation high tech, 8000 households

CarbonNeutralCitiesAllianceInnovationFundRound2RFP
57
Figure A5.7: N flows source‐separation urea sanitization, 8 000 households
Figure A5.8: P flows source‐separation urea sanitization, 8 000 households.

CarbonNeutralCitiesAllianceInnovationFundRound2RFP
58
Figure A5.9: N flows source‐separation high tech, 100,000 households
Figure A5.10: P flows source‐separation high tech, 100,000 households

CarbonNeutralCitiesAllianceInnovationFundRound2RFP
59
Figure A5.11: N flows source‐separation urea sanitization, 100,000 households
Figure A5.12: P flows source‐separation urea sanitization, 100,000 households

CarbonNeutralCitiesAllianceInnovationFundRound2RFP
60
Appendix6–Nutrienttables
Table A6.1: N flows, 8,000 households.
Grouping OutletConventional (kg N/yr)
Source separation ‐ UASB, high‐tech
(kg N/yr)
Source separation ‐ urea sanitization
(kg N/yr)
Discharge
Discharge to water 19 606 10 521 2 158 Overflow to recipient 403,1 44 44 Ash to landfill 0 0 0 Discharge to air 66 195 23 984 16 317
Other use Covering of mining sites 20 586 2 242 2 266
Agricultural use
Organic waste biosolids to agric. 2 674 4 346 5 460 Fertilizer from blackwater 0 68 328 83 220
Table A6.2: P flows, 8,000 households.
Grouping OutletConventional (kg P/yr)
Source separation ‐ UASB, high‐tech
(kg P/yr)
Source separation ‐ urea sanitization
(kg P/yr)
Discharge
Discharge to water 325 247 32 Overflow to recipient 44,5 4,3 4,3 Ash to landfill 1 419 946 946 Discharge to air 0 0 0
Other use Covering of mining sites 10 512 1 015 1 034
Agricultural use
Organic waste biosolids to agric. 454 927 927 Fertilizer from blackwater 0 9 615 9 811

CarbonNeutralCitiesAllianceInnovationFundRound2RFP
61
Table A6.3: N flows, 100,000 households.
Conventional (kg N/yr)
Source separation ‐ UASB, high‐tech
(kg N/yr)
Source separation ‐ urea sanitization
(kg N/yr)
Discharge
Discharge to water 245 076 131 513 2 6974 Overflow to recipient 5 039 549,5 549.5 Ash to landfill 0 0 0 Discharge to air 827 438 299 798 203 966
Other use Covering of mining sites 257 330 280 30 28 323
Agricultural use
Organic waste biosolids to agric. 33 428 54 321 68 249 Fertilizer from blackwater 0 854 100 1 040 250
Table A6.4: P flows, 100,000 households.
Conventional (kg P/yr)
Source separation ‐ UASB, high‐tech
(kg P/yr)
Source separation ‐ urea sanitization
(kg P/yr)
Discharge
Discharge to water 4 064 3 082 400 Overflow to recipient 556,7 53,9 53,9 Ash to landfill 17 739 11 826 11 826 Discharge to air 0 0 0
Other use Covering of mining sites 131 396 12 694 12 923
Agricultural use
Organic waste biosolids to agric. 5 676 11 589 11 589 Fertilizer from blackwater 0 120 187 122 640

CarbonNeutralCitiesAllianceInnovationFundRound2RFP
62
Appendix7–AssumptionsClimateeffects
Biogas Emission factors g CO2e/kWh Biogas 25,40 Diesel (5% RME) 279,31 Energy substance kWh/ unit Biogas (kWh/Nm³CH4) 9,81Diesel (5% RME) (kWh/l) 9,77
Potentials Increased biogas production 8 000 HH 100 000 HH
Ammount of Biogas (Nm³CH4) 83 000 1 040 000 Corresponding energy content (kWh) If used for substituting diesel
814 630 10 207 407
Emission reduction (tonnes) 206,84 2 591,73
Heating Emission factor g CO2e/kWh
District heating 102,00 Potentials 8 000 HH 100 000 HH
Reduced need for district heating 70% reuse of energy kWh / year
19 100 000 238 800 000
Emission reduction (tonnes) 1 948,20 24 357,00 Nutrients Emission factor g CO2e/kg N
Ammonium nitrate 3600
Potential Replacement of N in Fertilisers (kg) 72 674 908 421
8 000 HH 100 000 HH
Emission reduction (tonnes) 261,63 3 270,32

CarbonNeutralCitiesAllianceInnovationFundRound2RFP
63
Appendix8–Summaryfromthereport“Source‐separatingsystemsforwastewaterandfoodwaste–experiences,implementation,economyandsocietalbenefitKärrman, E., Kjerstadius, H., Davidsson, Å., Hagman, M. and Dahl, S. 2017. In Swedish. SVU report 2017‐04. Swedish Water and Wastewater Works Association.
This section summarizes a full‐cost analysis made for two hypothetical cases with source‐separated wastewater systems. The method used was the annuity method, an interest rate of 4% and the use of the technical life expectancy rather than the financial life expectancy. The cost estimates in the study use figures from existing source‐separating wastewater systems in e.g. the Netherlands, and actual costs for the Swedish setting for the conventional scenario.
AssumptionsandScenariosThe following assumptions are made in the study:
Table A8.1: Assumptions for the Full‐cost analyis.
Cost estimates Full supply costs
Size 120,000 for conventional scenario, 10% with source‐separation for source‐separated scenario and 12,000 with source‐separation for 2nd source‐separated scenario
Conventional – organic waste
Separate collection of organic waste in paper bags.
Conventional – wastewater
Combined wastewater conveyed to the wastewater treatment plant. Biogas production. Tertiary wastewater treatment
Source‐separated – organic waste
Garbage disposer to separate pipe conveying organic waste slurry separately to the wastewater treatment plant. Biogas production.
Source‐separated – wastewater
Greywater is treated in an intensive activated sludge process, a process from which the sludge is mixed with the kitchen waste and the blackwater in a biogas reactor. The reject water from the biogas process is used for struvite precipitation and ammonia stripping. Outgoing water phase from the activated sludge process needs further precipitation to meet effluent standards, which is included in the cost estimate.
Three scenarios were used for the comparative study:
x Scenario A: for 100% of the population (120,000 people) the blackwater and greywater are mixed and conveyed to a conventional wastewater treatment plant and the organic kitchen waste is collected in a bag and used for biogas production.
x Scenario B: 10% of the city (12,000 people) is adapted for separate collection of greywater, blackwater and kitchen waste separately. 108,000 people have conventional wastewater systems in Scenario B.

CarbonNeutralCitiesAllianceInnovationFundRound2RFP
64
x Scenario C: this scenario is singling out the 10% with source separation in Scenario B and treating this population, 12,000 people, as its own entity – like a city of 12,000 people with 100% connection to source separating systems.
Observe that these scenarios are different to the scenarios considered in Sections 5.1 and 5.3 of this report. Table 3.1 shows how the scenarios differ between the different factors investigated in this report.
In the source‐separating blackwater system vacuum toilets are used in buildings, the blackwater is conveyed to a pumping station and thereafter to a separate treatment plant by means of a low‐pressure system (LPA system). The organic kitchen waste system has garbage disposers in the buildings, is conveyed to a pumping station by gravity and then separate conveyance of the organic kitchen waste slurry to the separate treatment plant, also by means of an LTA system. The greywater fraction is conveyed to the treatment plant by gravity, including pumping at strategic points.
At the treatment plant the greywater is treated in an intensive activated sludge process, a process from which the sludge is mixed with the kitchen waste and the blackwater in a biogas reactor. The reject water from the biogas process is used for struvite precipitation and ammonia stripping. Outgoing water phase from the activated sludge process needs further precipitation to meet effluent standards, which is included in the cost estimate. The conventional system’s cost estimates are based on data for Helsingborg, Sweden.
FullsupplycostestimatesThe figure below shows the estimated yearly full supply costs, per capita and total, and also, below, per stakeholder.
Figure A8.1: Cost estimate for a fictional city of 120,000 people with conventional or 10% source‐separating systems. In the green, dashed column the costs, if carried only by the citizens having the source‐separated system, are shown (Kärrman et al. 2017).

CarbonNeutralCitiesAllianceInnovationFundRound2RFP
65
Kärrman et al. (2017) conclude that the cost increase, in the given example, for the water utility is negligible, if the costs are dispersed on all citizens of the city. The same applies for the extra developer/building costs: if carried by all the citizens of the city in question the increased costs are negligible. However, if the area with source‐separating systems is to carry its own costs, the cost increase in relation to its sanitation system is 22%. However, it is important to remember that this cost increase is based on actual figures for the conventional system for 120,000 people and for “pilot costs” for the source‐separating system with only 12,000 people.
If this 22% cost increase for the source separated area is divided up between stakeholders, them being the developer, the waste utility, the water utility and agriculture, 25% increase is estimated for the water utility and 46% for the developer/building. It is also noteworthy that the waste utility, in this example where blackwater and kitchen waste is co‐treated in the treatment plant, has decreased costs compared to the conventional scenario and so does the agriculture6.
Looking closer at the costs for development it can be noted that although the source separating sanitation system is 46% more expensive than the conventional sanitation system for the developer in this cost estimate (Kärrman et al. 2016), its absolute amount is still small compared to the overall costs for the development. If the extra costs for the source‐separated systems for the developer were to be carried over to a normal sized 2‐bedroom unit’s rent it represents a yearly increase of €170, which translates to a rent increase of €14/month. However, for the developer, the source separation of blackwater and greywater also presents a possibility to increase heat recovery on building level, which is a mean for developers in upcoming areas in SRS to meet the very stringent energy efficiency demands, see Section 5.2.
The source‐separation of blackwater and greywater will contribute to an increase in recovered resources, as described in Sections 5.1 to 5.3 of this report. Kärrman et al. (2017) put figures on their case calculations to represent the increased revenue possibility from source‐separating systems in terms of increased biogas potential and increased nutrient recover, Figure 6.3.
6 The decrease in costs for the source-separated alternative is related to the higher concentration of the struvite and ammonia products compared to the conventional scenario.

CarbonNeutralCitiesAllianceInnovationFundRound2RFP
66
Figure A8.2: Annual revenue per capita for Scenario A, B and C (Kärrman et al. 2017).
It was estimated that the source‐separating system contributes minimally to increased revenues for biogas if the revenues are split on all citizens, but significantly so, 60%, if the revenue is split on the citizens having the source‐separating system. For nutrients is the same but a bit different scale‐wise: a 24% increase is noted if the revenues are split on all citizens compared to a 237% increase if split on the citizens having the source separating systems. The figures for increase in nutrient recovery calculated in Section 5.3 of this report are considerably higher than the ones calculated by Kärrman et al. (2017). One main reason for the large difference is that Kärrman et al. (2017) used the average sludge reuse from Helsingborg (43%) as the conventional scenario, whereas in Section 5.3, the average sludge reuse for Henriksdal WWTP, which is 0%, was used as the conventional scenario. With a 100% reuse of sludge from Henriksdal WWPT, Box 5.2, the recycling potential figures are more similar to Kärrman et al. (2017).
Even though the percentage revenue increases estimated are high, the overall revenues are still small in comparison to the actual cost of installing a source‐separating sanitation system. Hence, the revenue increase cannot motivate the investment by itself.
Kärrman et al (2017) also made a summary of cost estimates in other studies. The summary showed that in all studies the source separating system comes out as costlier, even though the increase varied considerably between the studies (11% to 258%). Reasons for the large differences are, for example, (i) the use of actual costs for the conventional system and “pilot costs” for the source‐separating system, (ii) system boundaries and context, (iii) what is included in the definition on of the conventional system, (iv) pipe length estimations, and (v) local costs, in the case of international studies. It is also important to remember that the

CarbonNeutralCitiesAllianceInnovationFundRound2RFP
67
conventional system and the source‐separating system offer different types of services, which is further discussed in Section 6.
The authors also looked at a different source‐separating system, to which they compared their cost estimate results, Box 6.1. The cost estimates for the urea treatment of blackwater showed to be comparable to the cost estimates generated for the high‐tech system used in the study. Hence, it was concluded that, given all the uncertainties connected to cost estimates in general and to innovative technologies in particular, a low‐tech system such as the urea treatment, could be, cost‐wise, a feasible alternative to the high‐tech alternative used in their study.
Box A8.1: Sensitivity analysis – comparison of two blackwater systems (Kärrman et al. 2017).
As a sensitivity analysis on their full supply cost estimates Kärrman et al. (2017) compared their results with another source‐separating system, one in which the total blackwater volume is collected first at neighborhood level in tanks. The tanks are assumed to be emptied once a week and the blackwater transported to farmland for low‐intensive urea treatment before storage and reuse. For this alternative, organic kitchen waste was assumed to be collected in paper bags, as in the conventional case. It was further assumed that greywater is conveyed to the conventional treatment plant by means of the conventional sewer system, so costs for greywater treatment in this estimation are assumed to be zero. For a small area where greywater can be connected to the conventional sewer system without any implications on the network or the treatment plant, an estimation of zero costs is considered to be acceptable.
For this system with collection of blackwater on neighborhood level, a decrease in costs would be achieved by shorter piping lengths per capita and in avoiding a separate treatment plant for blackwater. Increased costs would, however, be incurred for transport of the dilute blackwater out of the urban area. Such a system, where the full blackwater flowstream is kept out of the water phase, minimizes risks of pathogen and nutrient loading to the recipient. Such a system also allows for more flexibility in the development phase of an urban area, where the services can be gradually adapted in relation to the gradually increased population. However, this system would increase the heavy traffic in the residential area, with the weekly emptying of the neighborhood tanks.
The sensitivity analysis showed that the urea treatment blackwater collection system, as described above, was similar in costs to the high‐tech treatment alternative presented in this section. The costs related to agriculture are much higher for the urea treatment alternative, compared to the high‐tech alternative. This increase in costs is related to the dilute nature of urea‐treated blackwater, with its increased costs for transportation among other things.