Embed Size (px)
Citation preview
1
Food and Agriculture Benchmark
Draft methodology
Report for public consultation
December 2020
From 16 December 2020 to 31 January 2021, the World Benchmarking Alliance (WBA) is holding a public consultation on the draft methodology for the Food and Agriculture Benchmark. Interested
stakeholders are invited to review the draft and share their comments (via the feedback form here) with us by emailing to [email protected].
This consultation is part of WBA’s continuous stakeholder engagement process. It builds on earlier
presentations and meetings with a wide range of stakeholders, with input from WBA’s Allies, civil society, academics, business, business associations, investors and policymakers. A set of numbered consultation
questions for which we seek explicit feedback is outlined in this document and listed in the feedback form. We also welcome feedback on any other aspect of the document.
2
Table of contents Introduction ............................................................................................................................... 4
Acknowledgements .................................................................................................................... 6
About the World Benchmarking Alliance .................................................................................... 7
WBA’s food and agriculture transformation................................................................................ 8
Food and Agriculture Benchmark and spotlight benchmarks ............................................................. 8
Access to Seeds Index .......................................................................................................................... 9
Seafood Stewardship Index ................................................................................................................. 9
Food and Agriculture Benchmark ................................................................................................ 9
The food systems transformation agenda ......................................................................................... 10
A value chain approach ...................................................................................................................... 11
From company profiles to scorecards ............................................................................................... 11
Benchmark development – A multi-stakeholder approach............................................................... 12
Process and timelines ............................................................................................................... 13
Methodology development and public consultation ........................................................................ 14
Data collection ................................................................................................................................... 14
Data analysis ...................................................................................................................................... 14
Publication of the 2021 Food and Agriculture Benchmark................................................................ 14
How are companies assessed? .................................................................................................. 14
Approach to scoring ........................................................................................................................... 15
Approach to weighting ....................................................................................................................... 16
Updating methodologies over time ................................................................................................... 18
Draft indicators for the Food and Agriculture Benchmark ......................................................... 19
A Governance and strategy ...................................................................................................... 20
A1. Sustainable development strategy .............................................................................................. 20
A2. Governance and accountability for sustainable development ................................................... 20
A3. Stakeholder engagement ............................................................................................................. 20
B Environment ......................................................................................................................... 21
B1. Scope 1 and 2 greenhouse gas emissions .................................................................................... 21
B2. Scope 3 greenhouse gas emissions .............................................................................................. 22
B3. Protection of terrestrial natural ecosystems ............................................................................... 22
B4. Sustainable fishing and aquaculture ............................................................................................ 23
B5. Soil health and agrobiodiversity .................................................................................................. 23
B6. Fertiliser and pesticides use ......................................................................................................... 24
B7. Water use ..................................................................................................................................... 25
B8. Food loss and waste ..................................................................................................................... 25
B9. Plastic use and packaging waste .................................................................................................. 26
B10. Animal welfare ........................................................................................................................... 26
B11. Antibiotics use and growth-promoting substances ................................................................... 27
C Nutrition ............................................................................................................................... 27
C1. Availability of healthy foods ........................................................................................................ 28
C2. Accessibility and affordability of healthy foods ........................................................................... 29
C3. Availability of sustainable protein ............................................................................................... 29
C4. Clear and transparent labelling .................................................................................................... 30
C5. Responsible marketing ................................................................................................................. 31
C6. Workforce nutrition ..................................................................................................................... 32

3
C7. Food safety ................................................................................................................................... 32
D Social inclusion ..................................................................................................................... 33
Integration of core social indicators into the benchmark ................................................................. 33
Core social indicators ......................................................................................................................... 33
D1. Commitment to respect human rights ........................................................................................ 34
D2. Commitment to respect the human rights of workers ............................................................... 34
D3. Identifying human rights risks and impacts ................................................................................. 34
D4. Assessing human rights risks and impacts................................................................................... 34
D5. Integrating and acting on human rights risks and impacts ......................................................... 34
D6. Engagement with affected and potentially affected stakeholders ............................................. 34
D7. Grievance mechanisms for workers ............................................................................................ 34
D8. Grievance mechanisms for external individuals and communities............................................. 34
D9. Health and safety fundamentals ................................................................................................. 34
D10. Living wage fundamentals ......................................................................................................... 34
D11. Working hours fundamentals .................................................................................................... 34
D12. Collective bargaining fundamentals .......................................................................................... 34
D13. Workforce diversity disclosure fundamentals........................................................................... 34
D14. Gender equality and women’s empowerment fundamentals .................................................. 34
D15. Personal data protection fundamentals .................................................................................... 34
D16. Responsible tax fundamentals .................................................................................................. 34
D17. Anti-bribery and anti-corruption fundamentals........................................................................ 34
D18. Responsible lobbying and political engagement fundamentals. .............................................. 34
Transformation-specific social indicators .......................................................................................... 34
D19. Child labour ................................................................................................................................ 34
D20. Forced labour ............................................................................................................................. 35
D21. Living wage ................................................................................................................................ 35
D22. Health and safety ....................................................................................................................... 36
D23. Farmer productivity and resilience ............................................................................................ 36
D24. Land rights ................................................................................................................................. 37
Annexes ................................................................................................................................... 38
Annex 1: Indicator glossary ................................................................................................................ 38
Annex 2: WBA guiding principles ....................................................................................................... 38
Annex 3: Definitions and references .................................................................................................. 40

4
Introduction To achieve key United Nations (UN) Sustainable Development Goals (SDGs) by 2030, we need to transform
our food systems from farm to fork. Doing so requires large-scale and fundamental action led by those who
drive environmental, health and social pressures in the system. The Food and Agriculture Benchmark will
assess 350 of the most influential food and agriculture companies on the issues underpinning the food
systems transformation agenda. The benchmark aims to stimulate companies to apply sustainable business
practices and address key topics underpinning this agenda throughout their operations, and to use their
influence to encourage their partners along the value chain to do the same.
In 2021, the global spotlight will be on food and agriculture. The COVID-19 pandemic is having a massive
impact on people’s livelihoods, public health, food systems and the world of work. While it has laid bare the
fragility of the food system, there are opportunities to build back better by addressing climate change and
environmental degradation as part of efforts to protect the health, livelihoods, food security and nutrition of
all people. The announcement of the 2021 United Nations Food Systems Summit underlines this, aiming to
maximise the benefits of a food systems approach across the entire 2030 Agenda. In the third quarter of
2021, WBA will present the first Food and Agriculture Benchmark, assessing corporate sector contributions
to the food systems transformation agenda. A baseline assessment of company commitments to key topics
are presented on 16 December 2020, to underline the importance of companies making commitments and
setting targets in support of the 2030 Agenda.
Our methodologies and benchmarks serve as roadmaps for companies, setting out the steps they can take
to meet the needs and expectations of their stakeholders. This draft methodology brings together the key
topics and issues on which society expects companies to take action and is the result of WBA seeking
extensive expert and stakeholder advice and consultations over the past two years. It describes the
development process for the methodology, proposed draft indicators, approaches to scoring and weighting,
and timelines for the benchmark.
The proposed draft indicators presented in this document build on the framework we published and
presented during the High-Level Political Forum in July 2020. By consciously building on the work of our Allies,
and on other relevant frameworks, standards and instruments wherever possible, we translated the food
systems transformation agenda into a recipe for change for the private sector. WBA held extensive expert
and stakeholder consultations around different topics, which provided further input. Notably, these
consultations resulted in the establishment of an additional measurement area – governance and strategy –
and enabled us to refine key topics and translate them into indicators.
With this publication, we seek additional input from stakeholders on the methodology for the benchmark.
In each section, we present key consultation questions and seek explicit input. We also welcome feedback
on other aspects of this draft methodology. We follow a similar process of requesting stakeholder input
on the draft methodologies for the Access to Seeds Index and the Seafood Stewardship Index, two spotlight
benchmarks of WBA’s food and agriculture transformation.
WBA will assess the performance of the 2,000 most influential companies globally (the SDG2000) by 2023,
across different sectors and industries, and including the 350 companies that will be assessed in the Food
and Agriculture Benchmark. We will assess all 2,000 companies on a set of core social indicators. We
published and consulted on the draft core social indicators this year. The final indicators will be published in
January 2021 as part of the social transformation framework. These final indicators will be integrated into

5
the methodology for the Food and Agriculture Benchmark, which is reflected in this document, but they are
not part of this consultation.
Once we have received and incorporated feedback, WBA will publish a finalised methodology report for the
Food and Agriculture Benchmark in early 2021, that we will then use to assess the 350 companies in the
benchmark.
Consultation questions
1 Do you have general feedback on the Food and Agriculture Benchmark?
2 Do you have general feedback on the draft methodology for the Food and Agriculture Benchmark?
6
Acknowledgements This draft methodology was not created in isolation, and WBA would like to thank those who helped shape
the model and initial indicator list. In particular, our thanks for contributions throughout the development of
the draft methodology go to the Food Foundation and Fixing the Business of Food, a joint initiative by the
Sustainable Development Solutions Network (SDSN), the Barilla Center for Food & Nutrition Foundation, the
Columbia Center on Sustainable Investment, and Santa Chiara Lab – University of Siena. Moreover, we are
grateful to the members of our Expert Review Committee (ERC), and the organisations that support them,
for their guidance and support.
WBA is funded by a group of governments, foundations and philanthropic organisations that share our vision
for the future. We would like to thank them for their support, without which none of our work would be
possible. A full list of WBA’s funders is set out on the final page of this report.
Our continually growing alliance of more than 180 organisations represents civil society, business networks,
financial institutions and multilateral organisations, with SDG 17: Partnerships for the Goals at its core. WBA
would like to thank our Allies for the support and expertise they provide, and we look forward to their
contributions during the consultation period.
7
About the World Benchmarking Alliance WBA is a diverse and growing group of organisations from across the globe, motivated by the common
ambition to create a world that works for all – as embodied by the SDGs. We share the vision that achieving
these goals requires a systems perspective, as the 17 SDGs are interlinked. We also agree that to accomplish
systemic transformation, the private sector has a key role to play.
WBA uses a systems approach to develop benchmarks, placing a strong emphasis on transforming the
systems that have the greatest potential to drive economic, environmental and social progress. Systems
thinking helps us make better sense of the issues, as well as identify the most influential companies in each
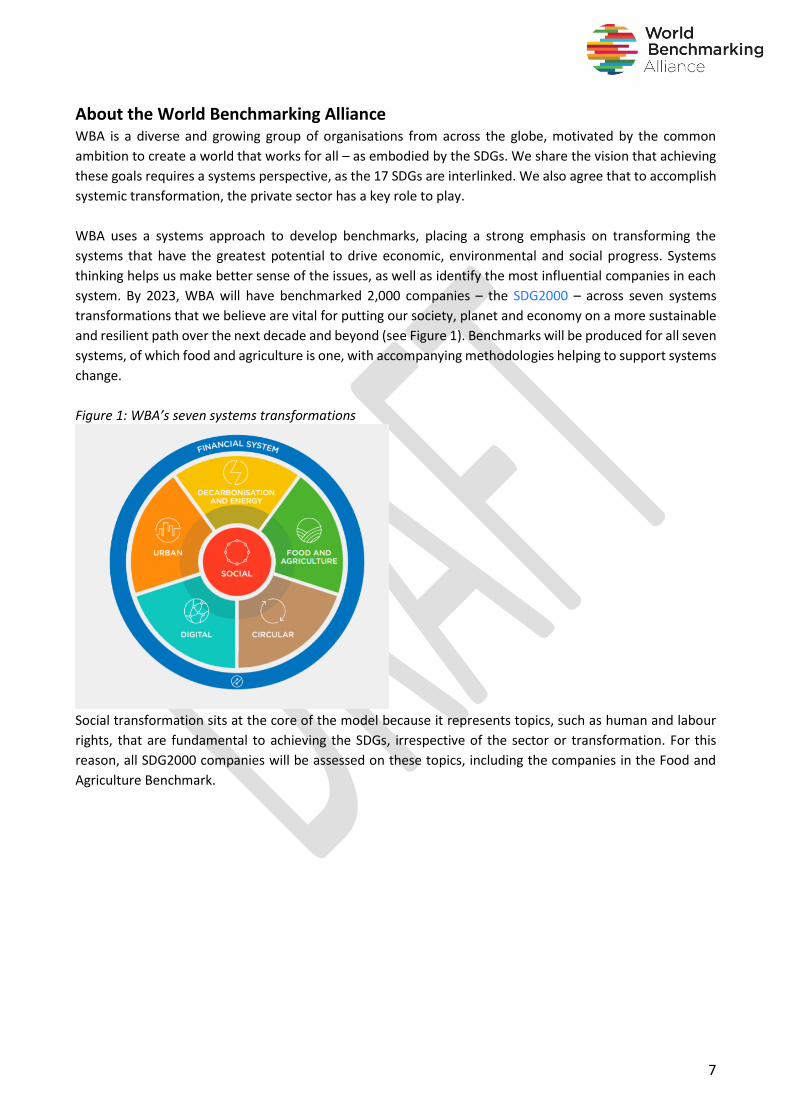
system. By 2023, WBA will have benchmarked 2,000 companies – the SDG2000 – across seven systems
transformations that we believe are vital for putting our society, planet and economy on a more sustainable
and resilient path over the next decade and beyond (see Figure 1). Benchmarks will be produced for all seven
systems, of which food and agriculture is one, with accompanying methodologies helping to support systems
change.
Figure 1: WBA’s seven systems transformations
Social transformation sits at the core of the model because it represents topics, such as human and labour
rights, that are fundamental to achieving the SDGs, irrespective of the sector or transformation. For this
reason, all SDG2000 companies will be assessed on these topics, including the companies in the Food and
Agriculture Benchmark.
8
WBA’s food and agriculture transformation Transforming food systems requires action by all actors in the system. This includes policy, science, civil
society and the corporate sector, which are interdependent, and each playing a crucial role to creating an
enabling environment for each actor to take responsibility. The food and agriculture sector spans many sub-
sectors, industries and companies. In a corporate system that is so interwoven, business leadership is vital to
ensure that all companies play their part, acknowledging their purpose and strengths within the value chain,
if we are to be able to access healthy diets, a healthy planet and a system that leaves no one behind. Within
WBA’s food and agriculture transformation, the Food and Agriculture Benchmark takes a broad value chain
approach, whereby the Access to Seeds Index and the Seafood Stewardship Index that are developed
alongside, allow for an in-depth assessment of the seed and seafood industries, respectively.
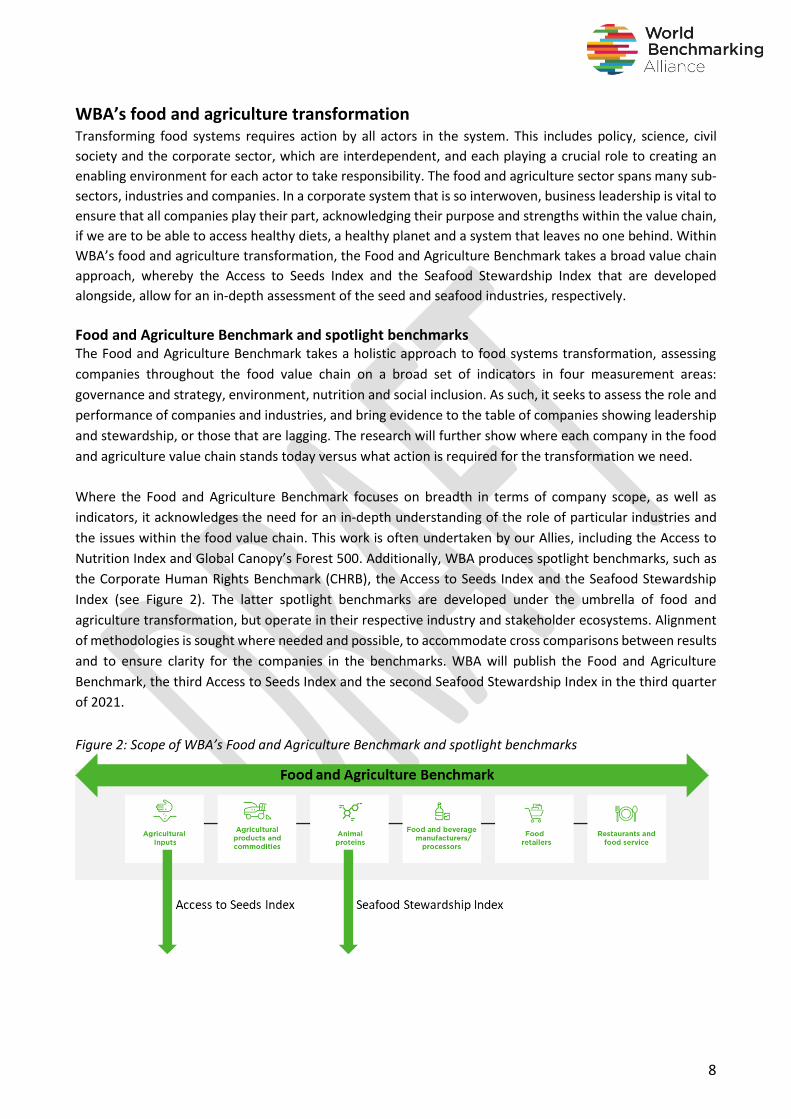
Food and Agriculture Benchmark and spotlight benchmarks The Food and Agriculture Benchmark takes a holistic approach to food systems transformation, assessing
companies throughout the food value chain on a broad set of indicators in four measurement areas:
governance and strategy, environment, nutrition and social inclusion. As such, it seeks to assess the role and
performance of companies and industries, and bring evidence to the table of companies showing leadership
and stewardship, or those that are lagging. The research will further show where each company in the food
and agriculture value chain stands today versus what action is required for the transformation we need.
Where the Food and Agriculture Benchmark focuses on breadth in terms of company scope, as well as
indicators, it acknowledges the need for an in-depth understanding of the role of particular industries and
the issues within the food value chain. This work is often undertaken by our Allies, including the Access to
Nutrition Index and Global Canopy’s Forest 500. Additionally, WBA produces spotlight benchmarks, such as
the Corporate Human Rights Benchmark (CHRB), the Access to Seeds Index and the Seafood Stewardship
Index (see Figure 2). The latter spotlight benchmarks are developed under the umbrella of food and
agriculture transformation, but operate in their respective industry and stakeholder ecosystems. Alignment
of methodologies is sought where needed and possible, to accommodate cross comparisons between results
and to ensure clarity for the companies in the benchmarks. WBA will publish the Food and Agriculture
Benchmark, the third Access to Seeds Index and the second Seafood Stewardship Index in the third quarter
of 2021.
Figure 2: Scope of WBA’s Food and Agriculture Benchmark and spotlight benchmarks
9
Access to Seeds Index
In regions where agricultural systems are dominated by smallholder farmers, access to the key inputs to
produce more and better food is often lacking. Since its establishment in 2012, the Access to Seeds Index has
set out to increase transparency around the seed industry and encourage seed companies to improve access
to seeds for smallholder farmers. The index focuses on three main regions – Western and Central Africa,
Eastern and Southern Africa, and South and Southeast Asia. In particular, the index highlights the importance
of local and regional companies, alongside their global peers, in providing access to seeds for smallholder
farmers, confirming that the sector is highly diverse and locally driven.
Seafood Stewardship Index
Three billion people rely on seafood as an essential part of their diet. Providing this nutritious food presents
serious challenges for the seafood industry, which is faced with unique challenges. In 2019, the first Seafood
Stewardship Index was published. The index was developed to provide more clarity about the corporate
performance of the largest global seafood companies on specific issues. These include the protection of
human rights in fisheries; supply chain transparency; and illegal, unreported and unregulated (IUU) fishing.
Food and Agriculture Benchmark The food systems transformation agenda has been broken down into four interlinked measurement areas:
governance and strategy, environment, nutrition and social inclusion. Based on the topics in these areas, the
benchmark will assess the contributions of the 350 companies in its scope. These measurement areas and
key topics have been widely discussed with WBA Allies, key stakeholders and the benchmark’s Expert Review
Committee (ERC). As such, we aim to bring together expectations and key frameworks on the food systems
transformation agenda to provide clarity, consistency and guidance for all stakeholders. The benchmark also
aligns with accountability mechanisms, providing clarity for activities, reporting and disclosure, to help
structure data collection. This process enables longer-term engagement with companies, investors,
policymakers and civil society through stakeholder coalitions around the benchmark results.
Scope of the Food and Agriculture Benchmark
The Food and Agriculture Benchmark will assess 350 keystone companies spanning the entire value chain.
The existing concept of keystone actors was used to enhance accountability and determine which companies
in the food and agriculture system can drive business action where it matters the most. Keystone companies
are globally active, have diversified businesses and operate in multiple food groups and industries. The
unique scale of our approach means that approximately one-third of these companies has never been
benchmarked by other initiatives.
The 350 companies in scope have been organised into six segments or sub-sectors (see Figure 3). These
sub-sectors are tied to the draft indicators, which conceptualise and place key topics along the value chain
where they are most materially relevant. The Food and Agriculture Benchmark takes a food-centric approach.
For this reason, commodities and industries such as tobacco, cotton and forestry (and consequently, leading
companies within each) are not included, primarily because of a lack of alignment with and contribution to
the nutrition measurement area.

10
Figure 3: The food and agriculture value chain
The food systems transformation agenda
Food systems contribute to economic prosperity, human health and planetary health. Poor diets are the main
contributor to the global burden of disease. Approximately 3 billion people cannot afford a healthy diet, and
more than 3 billion people suffer from one or more manifestations of poor nutrition. The global population
is predicted to be 9.7 billion by 2050, but food systems are already operating beyond some planetary
boundaries. Agriculture and its associated land-use changes are the biggest contributors to climate change,
land degradation, deforestation and biodiversity loss. The need for fundamental transformation of food
systems has become undeniable. Food systems transformation ties in these interlinked aspects of human
and environmental health and livelihoods, and links to key global agendas including the SDGs and the Paris
Agreement.
The draft methodology aims to translate the food systems transformation agenda into a recipe for change
for the private sector. It provides a roadmap for business for a journey toward a sustainable future in which
no one is left behind. The first step was the development and publication of the framework in July 2020,
which set out the critical areas and topics where private sector action is needed and where companies must
step up their efforts to collectively transform the system. It presented the three interlinked areas of the food
systems transformation: environment, nutrition and social inclusion.
As a result of stakeholder consultations and expert input on the framework, a fourth overarching
measurement area, governance and strategy, was added. This area confirms and reflects the need for
assessing the 350 companies on their corporate strategies and business models for sustainable
development objectives and targets (see Figure 4).
Figure 4: The food systems transformation agenda
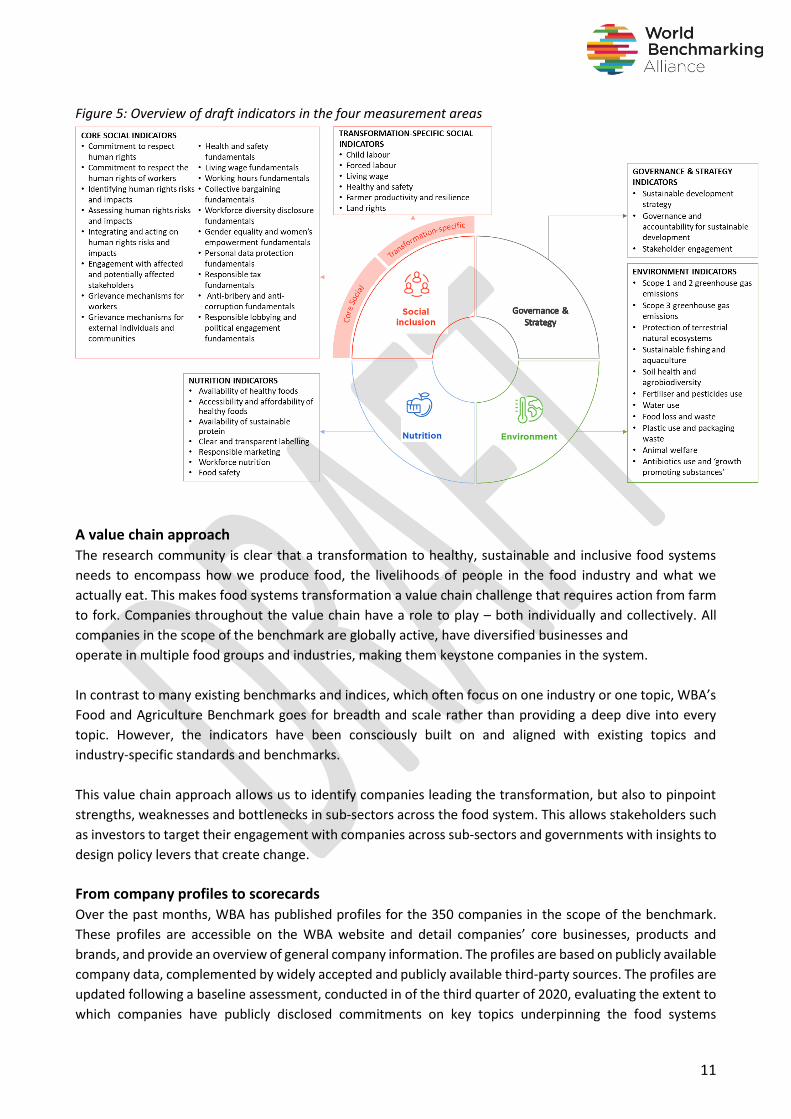
WBA has translated the topics in the framework into indicators on which the companies in the benchmark
will be assessed next year. An overview of the indicators outlined in this document is shown in
Figure 5.
11
Figure 5: Overview of draft indicators in the four measurement areas
A value chain approach
The research community is clear that a transformation to healthy, sustainable and inclusive food systems
needs to encompass how we produce food, the livelihoods of people in the food industry and what we
actually eat. This makes food systems transformation a value chain challenge that requires action from farm
to fork. Companies throughout the value chain have a role to play – both individually and collectively. All
companies in the scope of the benchmark are globally active, have diversified businesses and
operate in multiple food groups and industries, making them keystone companies in the system.
In contrast to many existing benchmarks and indices, which often focus on one industry or one topic, WBA’s
Food and Agriculture Benchmark goes for breadth and scale rather than providing a deep dive into every
topic. However, the indicators have been consciously built on and aligned with existing topics and
industry-specific standards and benchmarks.
This value chain approach allows us to identify companies leading the transformation, but also to pinpoint
strengths, weaknesses and bottlenecks in sub-sectors across the food system. This allows stakeholders such
as investors to target their engagement with companies across sub-sectors and governments with insights to
design policy levers that create change.
From company profiles to scorecards
Over the past months, WBA has published profiles for the 350 companies in the scope of the benchmark.
These profiles are accessible on the WBA website and detail companies’ core businesses, products and
brands, and provide an overview of general company information. The profiles are based on publicly available
company data, complemented by widely accepted and publicly available third-party sources. The profiles are
updated following a baseline assessment, conducted in of the third quarter of 2020, evaluating the extent to
which companies have publicly disclosed commitments on key topics underpinning the food systems
12
transformation agenda. High-level results of this baseline assessment are displayed in their profiles on the
WBA website.
The profiles will evolve with the development of the benchmark over the coming months and years. Company
performance overviews will be built into the profiles, turning them into scorecards. They will form the basis
of conversations with companies and their stakeholders about company performance in the food systems
transformation agenda.
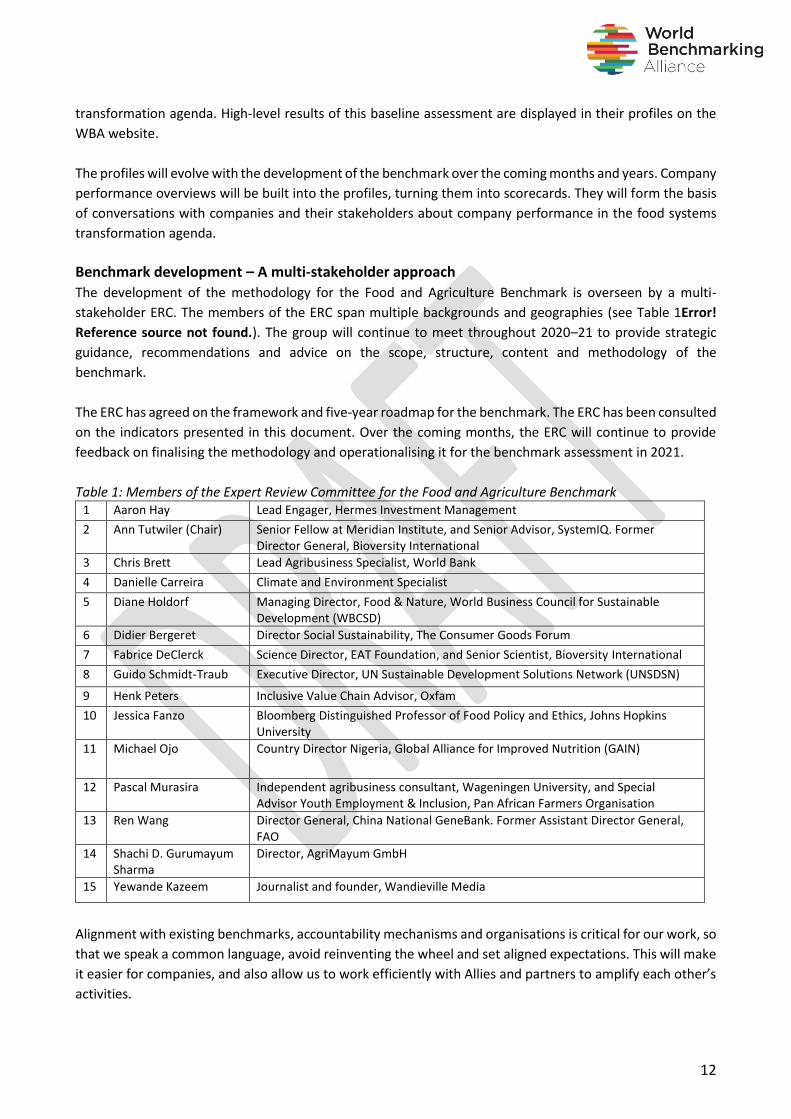
Benchmark development – A multi-stakeholder approach
The development of the methodology for the Food and Agriculture Benchmark is overseen by a multi-
stakeholder ERC. The members of the ERC span multiple backgrounds and geographies (see Table 1Error!
Reference source not found.). The group will continue to meet throughout 2020–21 to provide strategic
guidance, recommendations and advice on the scope, structure, content and methodology of the
benchmark.
The ERC has agreed on the framework and five-year roadmap for the benchmark. The ERC has been consulted
on the indicators presented in this document. Over the coming months, the ERC will continue to provide
feedback on finalising the methodology and operationalising it for the benchmark assessment in 2021.
Table 1: Members of the Expert Review Committee for the Food and Agriculture Benchmark 1 Aaron Hay Lead Engager, Hermes Investment Management
2 Ann Tutwiler (Chair) Senior Fellow at Meridian Institute, and Senior Advisor, SystemIQ. Former Director General, Bioversity International
3 Chris Brett Lead Agribusiness Specialist, World Bank
4 Danielle Carreira Climate and Environment Specialist
5 Diane Holdorf Managing Director, Food & Nature, World Business Council for Sustainable Development (WBCSD)
6 Didier Bergeret Director Social Sustainability, The Consumer Goods Forum
7 Fabrice DeClerck Science Director, EAT Foundation, and Senior Scientist, Bioversity International
8 Guido Schmidt-Traub Executive Director, UN Sustainable Development Solutions Network (UNSDSN)
9 Henk Peters Inclusive Value Chain Advisor, Oxfam
10 Jessica Fanzo Bloomberg Distinguished Professor of Food Policy and Ethics, Johns Hopkins University
11 Michael Ojo Country Director Nigeria, Global Alliance for Improved Nutrition (GAIN)
12 Pascal Murasira Independent agribusiness consultant, Wageningen University, and Special Advisor Youth Employment & Inclusion, Pan African Farmers Organisation
13 Ren Wang Director General, China National GeneBank. Former Assistant Director General, FAO
14 Shachi D. Gurumayum Sharma
Director, AgriMayum GmbH
15 Yewande Kazeem Journalist and founder, Wandieville Media
Alignment with existing benchmarks, accountability mechanisms and organisations is critical for our work, so
that we speak a common language, avoid reinventing the wheel and set aligned expectations. This will make
it easier for companies, and also allow us to work efficiently with Allies and partners to amplify each other’s
activities.
13
In addition to the ERC meetings, we have carried out a number of review sessions with specialists in different
topics. Similarly, relevant scientific and stakeholder sources have been examined to inform indicator
development. Table 2 below provides an overview of the key sources and organisations we have consulted
about the draft indicators.
Table 2: Overview of key sources and stakeholders consulted Measurement area Key sources and stakeholders
Governance and strategy Global Reporting Initiative (GRI), Sustainability Accounting Standards Board (SASB), SDG Impact Standards: Enterprises (2020), SDGD (Sustainable Development Goals Disclosure) Recommendations (2020),
United Nations Development Programme (UNDP), World Economic
Forum.
Environment Agrobiodiversity Index, Accountability Framework initiative (AFi), Aquatic Life Institute, Business Benchmark on Farm Animal Welfare (BBFAW), B-LAB UNGC, CDP Climate, Champions 12.3, Compassion in World Farming (CIWF), CDP Forests, CDP Water, Consumer Goods Forum (CGF), FAIRR, Food and Agriculture Organization (FAO), FLW Protocol, Food Foundation – Plating Up Progress (PuP), Forest500, GHG Protocol Agricultural Guidance (2014), GlobalGAP, GRI, KnowTheChain, SASB, WBA’s Seafood Stewardship Index (SSI), Science Based Targets initiative (SBTi), Science Based Targets Network (SBTN), ProTerra Foundation, Roundtable on Sustainable Palm Oil (RSPO), TiFN Food & Nutrition, Wageningen University & Research (WUR), World Resources Institute (WRI), Waste and Resources Action Programme (WRAP), World Wide Fund for Nature (WWF), Zoological Society of London (ZSL) SPOTT.
Nutrition Access to Nutrition Initiative (ATNI), B-LAB UNGC, GCF, Committee on World Food Security (CFS)–FAO, FAIRR, FAO, Forum for the Future, Global Alliance for Improved Nutrition (GAIN), Global Food Safety Initiative (GFSI), GRI, Micronutrient forum, PuP, SASB, SUN Business Network, United Nations Children’s Fund (UNICEF), World Business Council for Sustainable Development (WBCSD), Workforce Nutrition Alliance.
Social inclusion WBA’s Access to Seeds Index (ATSI), WBA’s Corporate Human Rights Benchmark (CHRB), Ethical Trade Initiative (ETI), FAIRR, FAO, Forest Stewardship Council (FSC), Forest500, Future Fit Foundation, GRI, IDH – the sustainable trade initiative, International Labour Organization (ILO), Interlaken Group and Resources Initiative, KnowTheChain, OECD–FAO, Oxfam, Roundtable on Sustainable Biomaterials (RSB), RSPO, Save the Children, SASB, WBA Social Transformation, SSI, UNGP, UN Guiding Principles, WBCSD, World Bank, ZSL SPOTT.
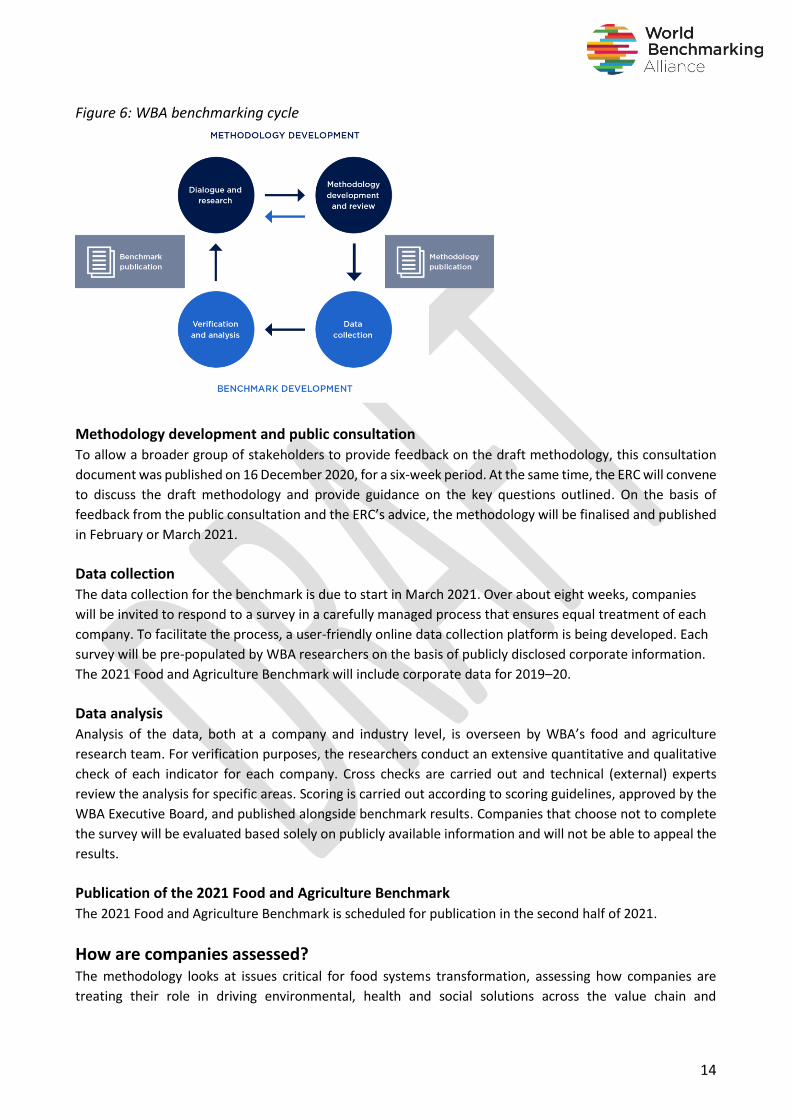
Process and timelines The benchmark is published in accordance with the benchmark cycle (see Figure 6), from methodology
development to data collection and analysis to benchmark publication. After review of the methodology and
stakeholder input and expert advice, the cycle starts again. Public consultation over the methodology for the
2021 Food and Agriculture Benchmark kickstarts this process, leading to the publication in the second half of
2021. Throughout the process, companies will be informed about key engagement opportunities, updated
timelines and development updates.
14
Figure 6: WBA benchmarking cycle
Methodology development and public consultation
To allow a broader group of stakeholders to provide feedback on the draft methodology, this consultation
document was published on 16 December 2020, for a six-week period. At the same time, the ERC will convene
to discuss the draft methodology and provide guidance on the key questions outlined. On the basis of
feedback from the public consultation and the ERC’s advice, the methodology will be finalised and published
in February or March 2021.
Data collection
The data collection for the benchmark is due to start in March 2021. Over about eight weeks, companies
will be invited to respond to a survey in a carefully managed process that ensures equal treatment of each
company. To facilitate the process, a user-friendly online data collection platform is being developed. Each
survey will be pre-populated by WBA researchers on the basis of publicly disclosed corporate information.
The 2021 Food and Agriculture Benchmark will include corporate data for 2019–20.
Data analysis
Analysis of the data, both at a company and industry level, is overseen by WBA’s food and agriculture
research team. For verification purposes, the researchers conduct an extensive quantitative and qualitative
check of each indicator for each company. Cross checks are carried out and technical (external) experts
review the analysis for specific areas. Scoring is carried out according to scoring guidelines, approved by the
WBA Executive Board, and published alongside benchmark results. Companies that choose not to complete
the survey will be evaluated based solely on publicly available information and will not be able to appeal the
results.
Publication of the 2021 Food and Agriculture Benchmark
The 2021 Food and Agriculture Benchmark is scheduled for publication in the second half of 2021.
How are companies assessed?
The methodology looks at issues critical for food systems transformation, assessing how companies are
treating their role in driving environmental, health and social solutions across the value chain and

15
acknowledging their responsibility for taking appropriate action. As such, it is assumed that a company can
contribute through its products, operations and supply chain. The methodology incorporates company
actions that are both positive and negative – encouraging progressive and transformative performance while
still calling out damaging behaviours. One challenge of a value chain approach that takes into account
multiple topics is how to balance the relevance of each topic to different sub-sectors. Although every
company in the benchmark has a role to play in all four measurement areas, the degree of influence and
impact on certain topics varies by industry and company.
The majority of topics in the benchmark are applicable to all companies in the scope of the benchmark, but
there are a limited number of cases where topics do not apply to certain companies. For example, animal
welfare is not directly relevant to companies that do not produce, source or sell animal-related products.
Equally, a sugar manufacturer does not undertake activities related to sustainable seafood. Consequently,
the benchmark will not assess companies on topics and indicators on which they cannot be expected to play
a role.
In addition, there are a number of indicators for which a company’s activities – and thus expectations – differ
across the value chain. They have different expectations for different industries, depending on their position
in the chain. The benchmark will acknowledge these differences between industries and companies.
Two ways to accommodate for differences across sub-sectors in the benchmark methodology are a) the way
company actions are assessed and thus scored and b) how much weight is given to specific indicators and
measurement areas in the benchmark results.
Approach to scoring
A set of guidelines for each indicator will be used to score company performance. Each indicator has a fixed
scale, whereby the company receives a score depending on the scoring criteria. WBA scores will have a 0–2
range: a score of 0 reflects no performance and a score of 2 reflects best performance.
Each indicator is scored against a set of predefined criteria related to the elements outlined in the draft
indicators section below. The elements for each indicator reflect what is expected of the company and what
it will be assessed and scored on. Draft scoring guidelines are already in development, but will be published
with the first benchmark results next year.
To accommodate differences in the sphere and degree of influence of corporate action across the value
chain, the elements and respective scoring guidelines may differ depending on the sub-sector. For indicators
with different scoring guidelines for different parts of the value chain, the company will be assessed on the
scoring guidelines for its respective sub-sector. Where the company is vertically integrated and more than
one scoring guidelines applies to its respective business operations, this will be taken into consideration in
the assessment process.
Consultation question
3 Where possible, the benchmark aims to capture and encourage company actions from farm to fork.
We welcome feedback on how to best account for differences in corporate expectations across the
value chain and whether this draft methodology captures these sufficiently.
16
Core social indicators will be scored differently because they assess minimum requirements of corporate
behaviour. These indicators will be assessed on a 0–1 scale, represented by the following levels:
• Met: the company met all the elements for a particular indicator (1 point)
• Partially met: the company met some elements for a particular indicator (0.5 points)
• Not met: the company did not meet any of the elements for a particular indicator (0 points).
Approach to weighting
Companies are assessed and ranked using a weighted scorecard approach. For each measurement area,
companies are assessed against the indicators. Currently, there are 45 indicators. Each indicator is assigned
a score according to the scoring guidelines. Based on the individual indicator scores, the weighted sum of
scores for an indicator group (such as a measurement area) is aggregated. A company’s total score is the
weighted sum of scores per measurement area. This approach results in an overall score for each company
as well as a score per measurement area.
Taking into consideration the value chain approach, and while aiming for a fair and meaningful aggregation
of corporate performance to reach an overall benchmark score, WBA is considering two options for the
allocation of weights across the measurement areas. For both options, the following considerations apply:
• Because all topics in all four measurement areas – governance and strategy, environment, nutrition
and social inclusion – are considered equally important, indicators within one measurement area will
carry equal weight.
• The weighting approach will be the same for all sub-sectors and companies in the benchmark,
meaning that the weight per measurement area will be consistently applied across.
• The governance and strategy measurement area carries a weight of 10%, noting its relatively low
number of indicators (three).
• In the social inclusion measurement area, companies are assessed on 24 indicators. This includes a
set of 18 core social indicators that are applied across WBA benchmarks and receive a weight of 20%.
Each core social indicator will have a single weighting, except for topic 4 (Assessing human rights
risks and impacts) and topic 5 (Integrating and acting on human rights risks and impact), which will
be double weighted.
Due to the inherent complexity of the benchmark’s agenda and WBA’s value chain approach, the following
key challenges play a part in the two proposed options:
• The number of indicators in each measurement area is different: governance and strategy (three),
environment (11), nutrition (seven) and social inclusion (24).
• The benchmark acknowledges that not all topics are relevant for all industries and companies. As
such, particularly in the nutrition measurement area, not all indicators apply to all companies,
bringing down the number of weighted indicators for a set of industries and companies.
17
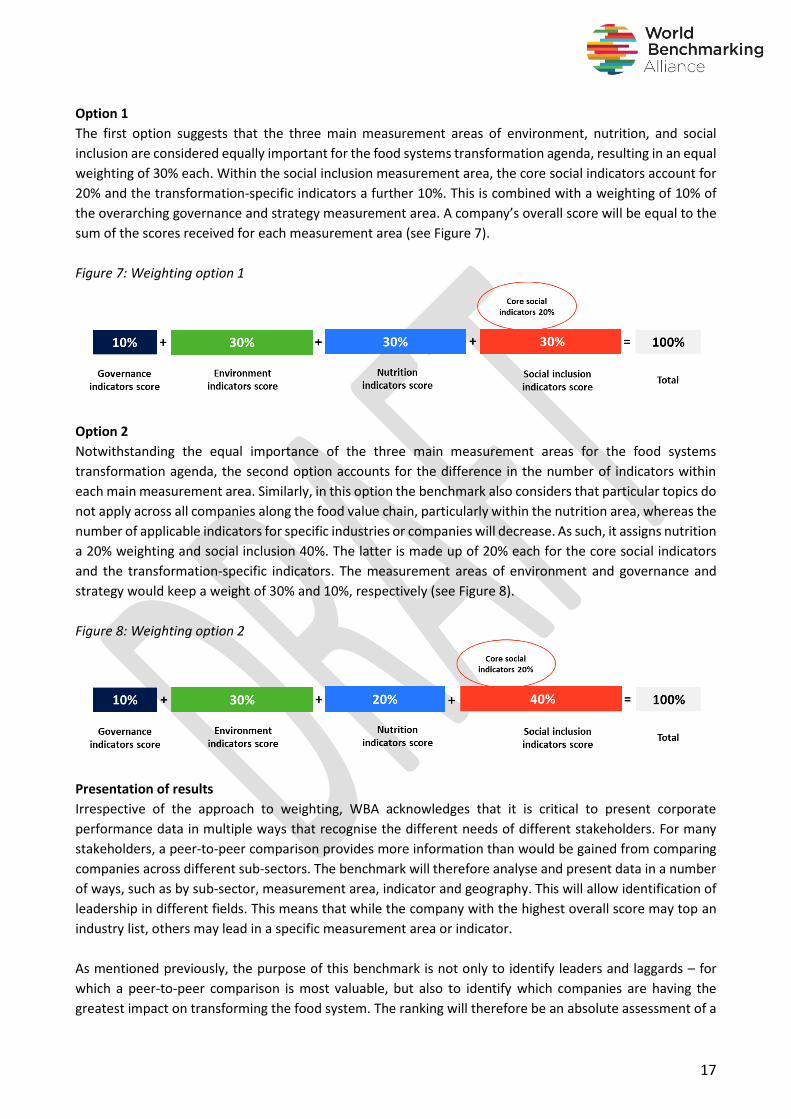
Option 1
The first option suggests that the three main measurement areas of environment, nutrition, and social
inclusion are considered equally important for the food systems transformation agenda, resulting in an equal
weighting of 30% each. Within the social inclusion measurement area, the core social indicators account for
20% and the transformation-specific indicators a further 10%. This is combined with a weighting of 10% of
the overarching governance and strategy measurement area. A company’s overall score will be equal to the
sum of the scores received for each measurement area (see Figure 7).
Figure 7: Weighting option 1
Option 2
Notwithstanding the equal importance of the three main measurement areas for the food systems
transformation agenda, the second option accounts for the difference in the number of indicators within
each main measurement area. Similarly, in this option the benchmark also considers that particular topics do
not apply across all companies along the food value chain, particularly within the nutrition area, whereas the
number of applicable indicators for specific industries or companies will decrease. As such, it assigns nutrition
a 20% weighting and social inclusion 40%. The latter is made up of 20% each for the core social indicators
and the transformation-specific indicators. The measurement areas of environment and governance and
strategy would keep a weight of 30% and 10%, respectively (see Figure 8).
Figure 8: Weighting option 2
Presentation of results
Irrespective of the approach to weighting, WBA acknowledges that it is critical to present corporate
performance data in multiple ways that recognise the different needs of different stakeholders. For many
stakeholders, a peer-to-peer comparison provides more information than would be gained from comparing
companies across different sub-sectors. The benchmark will therefore analyse and present data in a number
of ways, such as by sub-sector, measurement area, indicator and geography. This will allow identification of
leadership in different fields. This means that while the company with the highest overall score may top an
industry list, others may lead in a specific measurement area or indicator.
As mentioned previously, the purpose of this benchmark is not only to identify leaders and laggards – for
which a peer-to-peer comparison is most valuable, but also to identify which companies are having the
greatest impact on transforming the food system. The ranking will therefore be an absolute assessment of a
18
sector’s performance against the expectations for the transformation, presented as a relative comparison
between the companies in the benchmark.
Updating methodologies over time
With 2030 less than a decade away, there is no time to waste. The 2021 UN Food Systems Summit is a vital
moment to boost the UN’s Decade of Action. So the aim of the Food and Agriculture Benchmark is to
immediately start engaging with companies and multiple stakeholders, to be well positioned for the decade
ahead. At the same time, we continue to learn and have therefore set a five-year roadmap for the
development of the benchmark. As preferences evolve, markets shift and science advances, WBA will review
and improve methodologies to ensure they are dynamic and relevant.
While corporate expectations for many topics are clearly defined, a robust consensus on corporate
frameworks and metrics is still emerging for others. In cases where a meaningful assessment cannot yet be
undertaken, the topic might be introduced into the benchmark in future years. WBA will further engage with
key stakeholders and experts to help understand expectations and metrics for these topics and to formulate
a measurable indicator to ensure assessment in future iterations.
More generally, the benchmark will track emerging societal expectations and WBA will explore where it can
incorporate more impact-oriented metrics, based on (science-based) targets or thresholds. One example is
the development of science-based targets for the interrelated systems of fresh water, biodiversity, land and
ocean by the Global Commons Alliance.
Through continued dialogue and alignment with our Allies and stakeholders, these aims will be actively
discussed with companies, federations and relevant platforms. This will be part of our stakeholder
consultation and feedback process to inform methodology and indicator development.
Consultation question
4 The two weighting options incorporate differing (technical) considerations to calculate company scores and
rankings in the benchmark.
Which of the two options best incorporates company contributions to food systems transformation, ensuring
a fair and meaningful comparison across the food value chain?
19
Draft indicators for the Food and Agriculture Benchmark
The following sections describe each indicator within the four different measurement areas. The indicators
follow a standard format.
• Topic: a short descriptor of the issue.
• Indicator: sets out the topic-specific outcomes expected of the company.
• Rationale: sets out the reason why the topic is included in the benchmark and why it is crucial for food
systems transformation and the SDGs.
• Elements: sets out what companies will be assessed against for the indicator.
• Sources: sists the key existing initiatives that the indicator aligns with or builds upon.
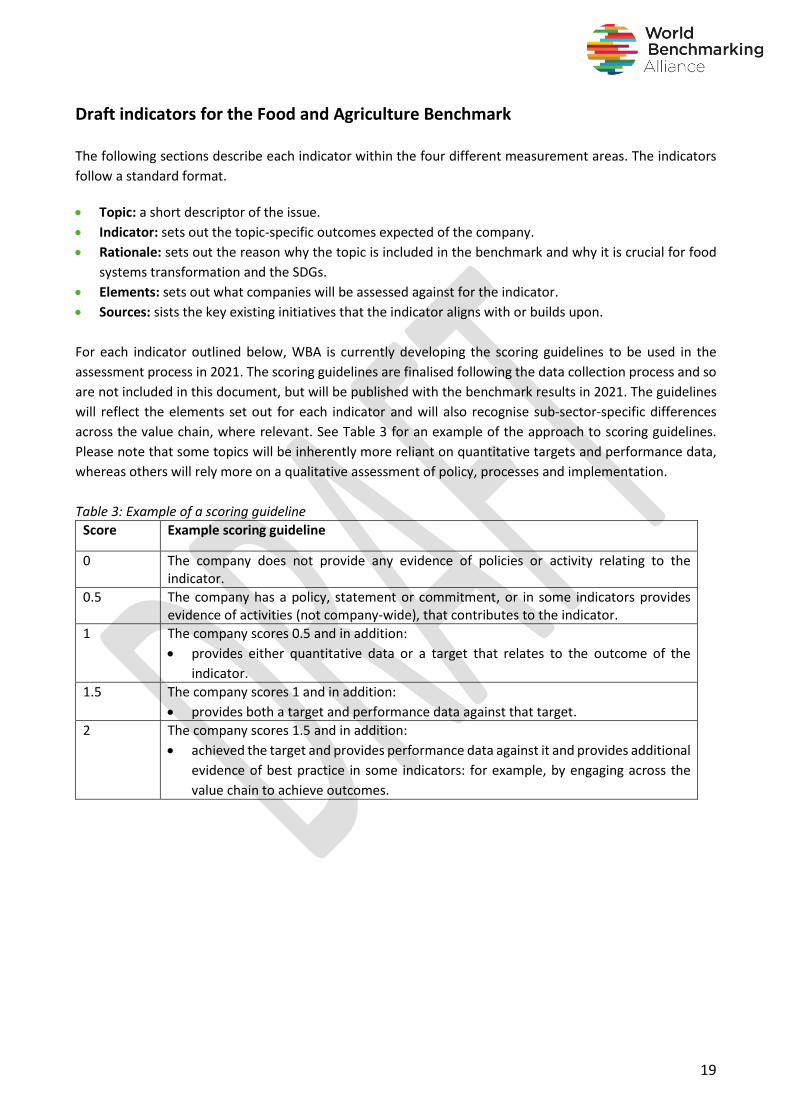
For each indicator outlined below, WBA is currently developing the scoring guidelines to be used in the
assessment process in 2021. The scoring guidelines are finalised following the data collection process and so
are not included in this document, but will be published with the benchmark results in 2021. The guidelines
will reflect the elements set out for each indicator and will also recognise sub-sector-specific differences
across the value chain, where relevant. See Table 3 for an example of the approach to scoring guidelines.
Please note that some topics will be inherently more reliant on quantitative targets and performance data,
whereas others will rely more on a qualitative assessment of policy, processes and implementation.
Table 3: Example of a scoring guideline Score Example scoring guideline
0 The company does not provide any evidence of policies or activity relating to the indicator.
0.5 The company has a policy, statement or commitment, or in some indicators provides evidence of activities (not company-wide), that contributes to the indicator.
1 The company scores 0.5 and in addition:
• provides either quantitative data or a target that relates to the outcome of the
indicator.
1.5 The company scores 1 and in addition:
• provides both a target and performance data against that target.
2 The company scores 1.5 and in addition:
• achieved the target and provides performance data against it and provides additional
evidence of best practice in some indicators: for example, by engaging across the
value chain to achieve outcomes.
20
A Governance and strategy This measurement area focuses on the integration of sustainable development objectives and targets into
companies’ core strategy, business model and governance structure. The objective of the area is to capture
companies’ overall commitment to sustainable development, including climate change/environmental
issues, food and nutrition security, and social issues. This includes assessing how the company’s highest
governing board can be held responsible and accountable for its progress on targets, as well as its stakeholder
engagement activities and how outcomes are included in its business strategy review.
A1. Sustainable development strategy
• Indicator: The company has sustainable development objectives and targets embedded in its strategy
and business model.
• Rationale: A corporate strategy that integrates sustainable development targets helps the company to
deliver on key SDGs and facilitates its ability to adapt and change through forward planning, increasing
its resilience, managing risks, and protecting workers, the company and society at large.
• Elements:
o The company has a long-term strategy to contribute positively to sustainable development and
achieving the SDGs.
o It sets realistic but ambitious objectives and targets that cover climate change/environmental
issues, food and nutrition, security and social issues.
o The company periodically reviews the strategy and objectives to ensure they remain fit for the
changing contexts and reports performance against the objectives.
• Sources: GRI 102 (2016), SDG Impact Standards for Enterprises (2020), SDGD Recommendations (2020).
A2. Governance and accountability for sustainable development
• Indicator: The company has a governance system that includes board/highest-level responsibility and
accountability for its sustainable development targets. Board members have sustainable development
objectives and incentives to reward the effective delivery of relevant company strategies and initiatives.
• Rationale: A board governance structure that links sustainable development goals and targets to roles
and remuneration is important to ensure the accountability of the company in relation to its contribution
to sustainable development targets.
• Elements:
o The company assigns decision-making and oversight responsibility to the highest governance
body for sustainable development topics.
o The company links performance criteria in remuneration policies for the members at the highest
level of its governance body to its objectives for sustainable development topics.
• Sources: GRI 102 (2016), SDG Impact Standards for Enterprises (2020), SDGD Recommendations (2020),
World Economic Forum’s Toward Common Metrics and Consistent Reporting of Sustainable Value
Creation (2020).
A3. Stakeholder engagement
• Indicator: The company engages with stakeholders on sustainable development issues and incorporates
outcomes of these activities in its strategy and operations.
• Rationale: Stakeholders may raise concerns that could influence medium- or long-term financial or
operating performance or create acute short-term financial impacts through the loss of a licence to
operate, reputational damage, changes in customer demand and/or disruptions to business viability.
Regularly engaging with stakeholders (for example, local communities, governments, academia and
21
non-government organisations (NGOs)) contributes to the company’s understanding of diverse and
frequently opposing perspectives, potentially drives innovation, and helps to shape robust and inclusive
approaches. Companies are expected to proactively engage in multi-stakeholder dialogues and initiatives
relating to stewardship challenges in the industry. Complaints, disputes or significant adverse impacts
raised by stakeholders are to be addressed and resolved. Engagement processes are expected to produce
a clear output or action and an acknowledgement of how stakeholder inputs are used.
• Elements: o The company describes the process for identifying relevant stakeholder groups, including the
communities it impacts, civil society, governments, and workers and employees, and how it
engages with these groups.
o The company discloses the process of stakeholder engagement and reports on how it integrates
the outcomes of stakeholder engagement and the identification of sustainable risk and
opportunities into its long-term value creation approach.
• Sources: GRI 102 (2016), SASB (2018), SDG Impact Standards for Enterprises (2020), SDGD
Recommendations (2020), World Economic Forum’s Toward Common Metrics and Consistent Reporting
of Sustainable Value Creation (2020).
B Environment Food production is already a key contributor to climate change, deforestation, biodiversity loss and
freshwater depletion, with almost half of global food production relying on crossing the Earth’s
environmental boundaries1. Without dedicated measures, these impacts could increase by 60% to 90% by
20502. The private sector is the largest player in food production and is, therefore, well positioned to shift
industry practices towards a sustainable food system. Virtually all industries along the food and agriculture
value chain directly or indirectly impact the environment in a number of different ways. In line with the UN
Food Systems Summit 2021’s Action Track 3 – Boost nature-positive production, this measurement area
addresses the key issues of sustainable food production.
B1. Scope 1 and 2 greenhouse gas emissions
• Indicator: The company reduces its Scope 1 and 2 greenhouse gas (GHG) emissions, in line with a 1.5ºC
trajectory.
• Rationale: Around a quarter of global GHG emissions are caused by land clearing, crop production and
fertilisation, with animal-based foods contributing 75% to those figures3. Without significant adjustments
in our agricultural practices, GHG emissions from agriculture are likely to increase 15–20% by 20504
(SDGs 7 and 13).
• Elements:
o The company has a target to reduce Scope 1 and 2 emissions5 against a baseline year and
regularly discloses performance against the target.
o The company aligns its target with a 1.5ºC trajectory or net zero.
Consultation question
G1 Do you have feedback on the Governance and strategy indicators?
22
• Sources: CDP Climate Change (2020), Food Foundation – Plating Up Progress (2020), GHG Protocol
Agricultural Guidance (2014), GRI, SASB (2018), SBTi (n.d.), SBTN Draft Interim Guidance (2020).
B2. Scope 3 greenhouse gas emissions
• Indicator: The company reduces its Scope 3 GHG emissions, in line with a 1.5ºC trajectory.
• Rationale: Currently, the global food system accounts for 21–37% of total net anthropogenic GHG
emissions6: 17% directly from agricultural activities and an additional 7–14% from land use changes7,
making Scope 3 emissions a major concern for the food industry. Reducing emissions to necessary levels
will be nearly impossible without addressing Scope 3 emissions (SDGs 7 and 13).
• Elements:
o The company engages with its supply chain to quantify Scope 3 emissions8.
o The company has a target to reduce Scope 3 emissions against a baseline year and regularly
discloses performance against the target.
o It aligns the target with a 1.5ºC trajectory or net zero.
• Sources: CDP Climate Change (2020), Food Foundation – Plating Up Progress (2020), GHG Protocol
Agricultural Guidance (2014), GRI, SASB (2018), SBTi (n.d.), SBTN Draft Interim Guidance (2020).
B3. Protection of terrestrial natural ecosystems
• Indicator: The company demonstrates that it is achieving conversion-free operations and supply chains
for its high-risk commodities.
• Rationale: Food systems are the leading drivers of biodiversity loss and ecosystem conversion.
Agricultural expansion has caused more than 70% of tropical deforestation globally, as forests are cleared
to make way for land to grow crops or raise cattle9. This commodity-driven tropical deforestation is
responsible for 5% of global GHG emissions10 (SDGs 12, 13 and 15).
• Elements:
o The company has deforestation/conversion-free (DCF)11 targets for all of the relevant high-risk
commodities12 that it either produces or purchases, and regularly discloses performance against
its targets. For example, it reports the proportion of commodity volume (for each forest risk
commodity) that can be shown to be deforestation or conversion free.
o The company meets the targets by demonstrating that the relevant commodities are 100%
conversion-free13.
• Sources: AFI Core Principles (2020), CDP Forests (2020), Coller FAIRR Protein Producer Index
Methodology (2020), Forest500/Global Canopy (2019), KnowTheChain (2020), SBTN Interim Guidance
(2020), ZSL SPOTT (2019).
Consultation question
E1 Company contributions to reducing GHG emissions has been separated into two indicators (4 and 5),
separating Scope 1 and 2 from Scope 3 emissions, to effectively assess progress in reducing emissions from
agriculture (see rationale). It allows for assessing downstream companies’ (food and beverage manufacturers
and processors, food retailers, restaurants and food service) progress on reducing Scope 3 emissions and
upstream companies’ (agricultural inputs, agricultural products and commodities, animal proteins) progress on
reducing Scope 1 and 2 emissions, ensuring applicability across the value chain.
Does this approach provide an effective way to track the entire value chain’s contribution to reducing
agricultural emissions?
23
B4. Sustainable fishing and aquaculture
• Indicator: The company demonstrates sustainable fishing and aquaculture practices and sourcing,
including for aquaculture feed inputs. • Rationale: To safeguard fish populations and marine biodiversity, companies need to contribute to
sustainably managed marine aquatic resources. According to the FAO, in 2017 about a third of the global
fish stocks were overfished, while nearly 60% were fully exploited14 (SDGs 12 and 14).
• Elements:
Companies with significant operations involving seafood in the animal proteins sector:
o The company commits to sustainable fishing and aquaculture operations.
o The company has a target for the percentage of its portfolio that comes from sustainable fishing
and aquaculture practices; for example, by referring to certification standards, the Global
Sustainable Seafood Initiative’s benchmarked standards, Fishery/Aquaculture Improvement
Projects or the management status defined by the FAO.
o It regularly discloses performance against the targets.
Companies with significant operations involving commodity trading and animal feed in the following
sectors: agricultural products and commodities, food and beverage manufacturers and processors,
food retailers, and restaurant and food service:
o The company commits to sourcing from sustainable seafood and aquaculture operations,
including its feed ingredients.
o The company has a sourcing target for the percentage of its portfolio that is from sustainable
fishing and aquaculture operations, including feed ingredients, and it regularly discloses
performance against the targets.
• Sources: Coller FAIRR Protein Producer Index Methodology (2020), Food Foundation – Plating Up
Progress (2020), SBTN Draft Interim Guidance (2020), WBA’s Seafood Stewardship Index (2019).
B5. Soil health and agrobiodiversity
• Indicator: The company adopts sustainable production and sourcing practices that improve soil health
and increase agrobiodiversity.
• Rationale: Global food production is the single largest driver of environmental degradation and
biodiversity loss15. Current unsustainable agricultural practices have led to the degradation of around
one-third of the world’s soil and caused significant negative impacts on biodiversity and soil health16.
Sustainable agricultural practices increase agrobiodiversity, boost total productivity and the nutritional
status of diets, and increase resilience, while reducing the need for water, synthetic fertilisers and other
costly inputs15 (SDGs 2, 12, 13 and 15).
• Elements:
Companies with significant operations in the following sectors: agricultural inputs, agricultural products
and commodities and animal proteins:
o The company commits to improving soil health and increasing agrobiodiversity.
o The company has a target to increase the percentage of production from sustainable practices
that improve soil health and increase agrobiodiversity, and regularly discloses performance
against the target.
o The company has quantifiable data on its impact on soil health, such as the increase in soil
carbon, reduction of land affected by erosion, and agrobiodiversity, such as the increase in the
variety of plants, animals and microorganisms.
24
Companies with significant operations in the following sectors: food and beverage manufacturers and
processors, food retailers, and restaurant and food service:
o The company commits to improving soil health and increasing agrobiodiversity as part of its
responsible sourcing strategy.
o The company has a target for the percentage of food to be produced under sustainable
production practices that improve soil health and increase agrobiodiversity, such as organic,
regenerative, circular or agroecological practices, and regularly discloses performance against
the target.
• Sources: Agrobiodiversity Index (2018), FAO (2014), SBTN Draft Interim Guidance (2020).
B6. Fertiliser and pesticides use
• Indicator: The company demonstrates that it is optimising the use of organic and inorganic fertilisers and
pesticides.
• Rationale: Production of synthetic fertilisers has increased from about 20 million tons in 1950 to nearly
190 million tons today – about a third are nitrogen-based17. Synthetic nutrients such as fertilisers and
pesticides lead to multiple forms of pollution (in land, water and air); for example, eutrophication and
risks to human health18. (SDGs 2, 6 and 12).
• Elements:
Companies with significant operations in the following sectors: agricultural inputs, agricultural products
and commodities and animal proteins:
o The company commits to reducing the use of harmful pesticides such as World Health
Organisation (WHO) Class 1A and 1B pesticides and to minimising the use of inorganic fertilisers.
o The company reports on the reduction in use of harmful pesticides and inorganic fertilisers.
o The company has a target to replace harmful pesticides and inorganic fertilisers with alternatives,
such as integrated pest management (IPM) approaches and organic fertilisers, respectively.
o It regularly discloses performance against the target.
Companies with significant operations in the following sectors: food and beverage manufacturers and
processors, food retailers and restaurants and food service:
o The company has a responsible sourcing strategy to reduce the use of harmful pesticides such as
WHO Class 1A and 1B pesticides and to minimise the use of inorganic fertilisers in its supply chain.
o The company has a target for the percentage of food it buys that is produced under recognised
environmental schemes that replace harmful pesticides and inorganic fertilisers with
alternatives; for example, organic, LEAF or other recognised certifications and schemes.
o It regularly discloses performance against the target.
• Sources: GlobalGAP (n.d.), ProTerra (2019), RSPO (2020), SBTN Draft Interim Guidance (2020), ZSL SPOTT
(2019).
Consultation question
E2 While it is widely acknowledged that soil health and agrobiodiversity are crucial for transforming food systems, a robust consensus on frameworks and metrics is still emerging. How should companies (both upstream and downstream) quantify improvements in soil health and agrobiodiversity in their reporting?
25
B7. Water use
• Indicator: The company reduces its water withdrawal across its operations and supply chains.
• Rationale: Agricultural systems alone account for 70% of all freshwater withdrawals worldwide, and up
to 95% in some developing countries19. With approximately one-third of all irrigated crops grown in areas
of high water stress around the world, reducing water withdrawal is a key priority for the food and
agriculture sector20 (SDGs 6, 14 and 15).
• Elements:
Companies with significant operations in the following sectors: agricultural inputs, agricultural products
and commodities and animal proteins:
o The company has targets to reduce water withdrawal across its own operations and regularly
discloses performance against the targets.
o The company is aware of its dependency on water-stressed areas across the value chain and
discloses data such as percentage of withdrawals from water-stressed areas.
o The company specifically discloses withdrawals from water-stressed areas across its own
operations. If the company sources products produced in water-stressed areas, it has a specific
target for engaging with the suppliers of those products; for example, to identify the percentage
of suppliers with a sustainable water management programme, and reports against the target.
Companies with significant operations in the following sectors: food and beverage manufacturers and
processors, food retailers and restaurants and food service:
o The company has a target to reduce water withdrawal across its own operations and regularly
discloses performance against the targets.
o The company engages with suppliers to reduce water withdrawal in the supply chain.
o It has a target for engaging with suppliers operating in water-stressed areas and regularly
discloses performance against the target.
• Sources: CDP Water Security (2020), Food Foundation – Plating Up Progress (2020), SBTN Interim
Guidance (2020), WRI Aqueduct Water Risk Atlas (n.d.), WWF Water Risk Filter (n.d.).
B8. Food loss and waste
• Indicator: The company reduces food loss and waste, in line with the global goal to halve food loss and
waste by 2030.
• Rationale: Almost a third of all food produced, valued at nearly US$1 trillion, is either lost or wasted
every year21. SDG target 12.322 sets the global target to halve food loss and waste by 2030. This level of
Consultation questions
E3 While it is widely acknowledged that the use of fertilisers and pesticides have a critical role in food systems transformation, a consensus on the best certifications and schemes for downstream sectors (food and beverage manufacturers and processors, food retailers, restaurants and food service) to use is less clear. Which certifications and schemes are most relevant for businesses in these sub-sectors that want to undertake corporate action in relation to sustainable use of fertilisers and pesticides?
E4 While this indicator prioritises minimising fertiliser use to avoid the negative impacts of excessive fertiliser
use, it also assesses the replacement of inorganic with organic fertilisers.
To what extent is the shift from inorganic to organic fertilisers crucial for food systems transformation?
26
inefficiency has significant environmental and social impacts. It exacerbates food insecurity, translates
into about a quarter of all water used by agriculture, and is responsible for an estimated 8% of global
greenhouse gas emissions23 (SDGs 2 and 12).
• Elements:
o The company has a target to reduce food loss and waste across its own operations and regularly
discloses performance against the target.
o The company engages and collaborates with value chain partners to help suppliers and
customers to reduce food loss and waste.
• Sources: B-LAB UNGC (n.d.), FLW Standard (2017), Food Foundation – Plating Up Progress (2020),
Champions 12.3 (n.d.), WRAP (n.d.)
B9. Plastic use and packaging waste
• Indicator: The company reduces its plastic use and transitions to sustainable forms of packaging.
• Rationale: Plastics are major contributors to polluting natural ecosystems, with associated toxins and
microparticles disrupting soils, waterways, oceans and human food chains24 (SDGs 12 and 14).
• Elements:
o The company has a target to transition to sustainable packaging25 by reducing plastic use and
increasing the recyclability and compostability of packaging, and regularly discloses performance
against the target such as percentage of sustainable packaging.
o The company works with its value chain partners to reduce single-use plastics in packaging and
supports them to use sustainable packaging.
• Sources: B-LAB UNGC (n.d.), Food Foundation – Plating Up Progress (2020), SASB (2018).
B10. Animal welfare
• Indicator: The company is committed to improving farm animal welfare.
• Rationale: More than 70 billion animals are farmed for food annually, with two-thirds in conditions that
mean they cannot move freely or live naturally. By 2050, livestock production is projected to double
compared to 200026 (SDGs 3, 12, 14 and 15).
• Elements:
Companies with significant operations in the animal proteins sector:
o The company has an animal welfare policy applicable to all its species27 and products.
o The company has targets to address key welfare issues and regularly discloses performance
against the targets.
o The company has targets for the percentage of animal-derived products to be audited to meet
higher welfare standards and discloses performance against all its targets.
Companies with significant operations in the following sectors: food and beverage manufacturers and
processors, food retailers and restaurants and food service:
o The company has an animal welfare policy applicable to all species28 and products its sources.
o The company has targets to address key welfare issues with suppliers.
o The company has targets for the percentage of animal-derived products in its supply chain that
are audited to meet higher welfare standards and discloses performance against its targets.
• Sources: BBFAW (2019), CIWF (n.d.), Coller FAIRR Protein Producer Index Methodology (2020), Food
Foundation – Plating Up Progress (2020), GRI, SASB (2018).
27
B11. Antibiotics use and growth-promoting substances
• Indicator: The company reduces the routine use of antibiotics for farm animals and specifically prohibits
the use of prophylactic antibiotics and growth-promoting substances.
• Rationale: Antibiotic use is prevalent in the global food and agriculture sector, with around 75% of
antibiotics in the United States used on farm animals alone, and is projected to increase by 22% by 203029.
Antimicrobial resistance is a significant public health threat and governments across the world are calling
for a decrease in the use of antibiotics in livestock production (SDGs 3, 12, 14 and 15).
• Elements:
Companies with significant operations in the animal proteins sector:
o The company has a policy on prophylactic use of antibiotics and growth-promoting substances
that applies to all its species and products.
o The company regularly discloses data for its overall use of antibiotics and provides evidence of
zero use of prophylactic antibiotics and growth-promoting substances.
Companies with significant operations in the following sectors: food and beverage manufacturers and
processors, food retailers and restaurants and food service:
o The company has a policy on prophylactic use of antibiotics and growth-promoting substances
that applies to all species30 and products its sources.
o The company has targets to address prophylactic use of antibiotics and growth-promoting
substances with suppliers.
o The company has targets for the percentage of overall use of antibiotics in its supply chain and
provides evidence of zero use of prophylactic antibiotics and growth-promoting substances.
• Sources: BBFAW (2019), CIWF (n.d.), Coller FAIRR Protein Producer Index Methodology (2020), Food
Foundation – Plating Up Progress (2020), GRI, .SASB (2018).
C Nutrition Globally, one in nine people are hungry or undernourished while one in three adults is overweight or obese21.
The UN Food Systems Summit 2021 has defined the need to ensure access to safe and nutritious food for all
(Action Track 1) and a shift to sustainable consumption patterns (Action Track 2). In line with these actions
tracks, the nutrition measurement area includes key changes needed to achieve healthy and sustainable
diets. Industries in the food and agriculture system impact this shift in different ways and forms.
Consultation question
E6 Should this indicator assess companies that do not source, produce or sell animal-based products? If so, in what way?
Consultation question
E5 Should this indicator assess companies that do not source, produce or sell animal-based products? If
so, what is the company’s role and how should we assess it?
28
C1. Availability of healthy foods
• Indicator: The company commits to, and delivers on, proportionally increasing sales and production of
healthy foods.
• Rationale: Poor diet is the leading cause of mortality and morbidity worldwide, with 30% of deaths
throughout the world being diet-related31. This is putting an intolerable strain on the health system. The
resulting global malnutrition crisis includes undernutrition (people who are underweight and/or deficient
in micronutrients) and diet-related non-communicable diseases (mainly people who are overweight or
obese, or have diabetes, cardiovascular disease or and cancer)21 (SDGs 2 and 3).
• Elements:
Companies with significant operations in the following sectors: agricultural inputs, agricultural products
and commodities and animal proteins:
o The company commits to improving the overall healthiness or nutritional quality of foods and
products through for example (bio)fortification, improved production practices or a portfolio
diversification activities, and regularly discloses performance against targets.
Companies with significant operations in the following sectors: food and beverage manufacturers and
processors, food retailers and restaurants and food service:
o The company commits to improving the nutritional quality of products and menus.
o The company has targets to provide more healthy foods across all product categories and
ingredients, and regularly discloses performance against targets, such as sales-weighted
performance data. Focus areas for healthy and nutritious foods could include reducing salt, sugar
and fat content, increasing the amount of fruit, vegetables, nuts and wholegrains or the number
of products that address nutrient deficiencies (such as protein deficiency).
o The company is transparent about its definition of healthy foods, linking it to robust
(inter)national guidelines, and how it quantifies ‘healthy’ (for example, by using internationally
recognised nutrient profiling systems and in menus, for example by maximum calorie limit,
maximum amount of salt, sugar and fat, and the minimum portion of vegetables).
Consultation question
N1 While it is acknowledged that healthy food starts at the farm level – and hence all companies across the value chain have a role to play – the food and beverage and retail industries hold the greatest level of responsibility in terms of food safety and product diversification as well as the most effective means to influence consumer behaviour. Although it is our aim to capture business responsibilities for nutrition from farm to fork, expectations in relation to business are currently more clearly defined for consumer-facing companies.
We welcome feedback on how to best capture business responsibilities for nutrition for non–consumer
facing companies, in particular. If they have a role to play, how can we assess them in a way that is fair
and as consistent as possible across the system?

29
• Sources: ATNI Global Index (2020), ATNI/Share Action UK Supermarkets Spotlight (2020), Food
Foundation – Plating Up Progress (2020), GAIN/SBN Survey results (2020), GRI G4 Food Processing (n.d.).
C2. Accessibility and affordability of healthy foods
• Indicator: The company addresses food insecurity by improving the accessibility and affordability of
healthy food for vulnerable groups.
• Rationale: Approximately 26% of the global population experiences moderate to severe levels of food
insecurity and lacks regular access to nutritious and healthy food32, particularly people in low-income
communities and countries17. Research has shown that a healthy and sustainable diet is not affordable
for at least 1.58 billion people18, and cheaper food is often prioritised by families with less disposable
income who are forced to compromise on nutrition33. The Covid-19 pandemic has also exposed the
significant risk of food insecurity for vulnerable groups (SDGs 2, 3, 5, 9, 10 and 11).
• Elements:
o The company commits to address food insecurity by improving the accessibility and affordability
of healthy products for vulnerable groups34.
o The company has strategic commercial activities designed to improve accessibility and
affordability, such as pricing strategies for vulnerable groups, product accessibility strategies for
healthy food in regions with vulnerable groups, or collaborates with value chain partners to
improve accessibility and affordability.
o The company has targets35 to measure how its activities improve the accessibility and
affordability of healthy foods and discloses performance against the targets.
• Sources: ATNI Global Index (2020), ATNI/Share Action UK Supermarkets Spotlight (2020), GRI G4 Food
Processing (n.d.).
C3. Availability of sustainable protein
• Indicator: The company is transitioning to a diversified protein portfolio, in line with sustainability and
health considerations36.
Consultation questions
N3 How best can this indicator ensure it assesses the activities of companies that are not selling food
directly to consumers?
N4 Currently, the indicator focuses on the company’s commercial activities, rather than its
non-commercial or philanthropic activities. Should non-commercial activities be acknowledged, to
broaden the applicability of the indicator to other sub-sectors?
Consultation question
N2 It is unclear how all companies across the value chain can directly influence the indicator for the
availability of healthy foods.
How should companies that do not sell food products directly to consumers, such as the agricultural input
sector, be assessed on their nutrition commitments and activities?
30
• Rationale: While proteins are an essential part of the human diet, the animal protein sector is a
significant contributor to climate change and deforestation37, and red meat consumption is associated
with a number of health risks such as diabetes and cardiovascular disease38. A shift towards eating more
plant-based foods and less meat could reduce food-related GHG emissions by 29–70% as well as mortality
by 6–10% by 205039 (SDGs 2, 3 and 13).
We acknowledge that nutrient deficiencies, including protein deficiencies, exist in some regions of the
world and these need to be addressed. Addressing nutrient deficiencies, including protein deficiencies, is
covered in the indicator for the availability of healthy foods.
• Elements:
Companies with significant operations involving animal feed in the agricultural products and
commodities sector:
o The company provides evidence of animal feed diversification by using novel feedstocks, such as
algae or insects, or food by-products (products unfit for human consumption and other forms of
food waste).
o The company provides evidence of diversifying its products away from animal feed and towards
products that are intended for direct human consumption.
o The company has a target for diversifying feed input or extending its range of products for direct
human consumption and discloses performance against the target.
Companies with significant operations in the following sectors: animal proteins, food and beverage
manufacturers and processors, food retailers and restaurants and food service:
o The company provides evidence of protein diversification activities or commitments to
promoting these, such as research and development, acquisitions, reformulation, product
expansion, marketing or product placement.
o The company has a target for protein diversification that includes replacing a proportion of its
meat-based proteins with plant-based and fish/seafood and other alternatives, such as cell-
based meat.
• Sources: FAIRR’s Appetite for disruption: A Second Serving (2020), Coller FAIRR Protein Producer Index
Methodology (2020), Food Foundation – Plating Up Progress (2020), Forum for the Future’s The Future
of Food: Are Food Businesses on Track to Deliver a Sustainable Protein System by 2040 (2019).
C4. Clear and transparent labelling
• Indicator: The company provides nutrition information through clear, intuitive and accurate labelling.
• Rationale: Information about food can positively or negatively influence consumer preferences,
purchasing behaviour and consumption patterns21. Intuitive package labelling40 (meaning it’s visible,
Consultation questions
N5 This indicator relates to the shift towards more sustainable forms of protein in people’s diets, rather than
addressing protein deficiencies, which is included under nutrient deficiency in the indicator for the
availability of healthy foods.
Is this distinction sufficiently clear?
N6 Can this indicator assess how companies that are not selling animal-based protein or animal feed can
contribute to protein diversification? If so, in what way?
31
accurate and easy to understand) helps consumers to make healthier food choices and incentivises
suppliers to deliver healthy food (SDGs 2, 3 and 12).
• Elements: Companies with significant operations in the following sectors: food and beverage manufacturers and processors and food retailers:
o The company commits to complying with national regulations regarding labelling or to providing
nutrition information that complies with relevant Codex Alimentarius guidelines41 on key
relevant nutrients42 and portion- or serving-based information43.
o The company commits to making nutrition information available to consumers in a clear, intuitive
and accurate way by providing indicators of how healthy the product is; for example, by using
the Health Star Rating System44, Nutri-Score45, healthy logos, warning labels or similar in front-
of-pack information.
o The company discloses the percentage of products for which it has rolled out back-of-pack and/or
front-of-pack labelling. Companies with significant operations in the following sectors: restaurants and food service:
o The company commits to making nutrition information46 easily visible and intuitive for all
customers. o The company discloses the percentage of menus for which it has rolled out nutrition information.
• Sources: ATNI Global Index (2020), ATNI/Share Action UK Supermarkets Spotlight (2020), Food
Foundation – Plating Up Progress (2020), GAIN/SBN Survey results (2020), GRI 417 Marketing and
Labelling (2016).
C5. Responsible marketing
• Indicator: The company’s marketing strategies prioritise healthy, nutritious and sustainable47 foods,
especially when marketing to children.
• Rationale: Marketing activities can significantly influence consumer and customer choice. Through
responsible marketing of food and beverages, and products and services, companies can help drive
behaviour change21 (SDGs 2, 3 and 12).
• Elements: Companies with significant operations in the following sectors: agricultural inputs, agricultural products and commodities and animal proteins:
o The company has a marketing policy that facilitates greater production and consumption of
healthy foods across the value chain and provides evidence of marketing activities that support
the policies. o The company has a target for increasing the marketing budget spent on products and services
that facilitate greater production and consumption of healthy foods across the value chain.
Consultation questions
N7 This indicator is about consumer behaviour and a company’s role in enabling consumer decision-making that leads to healthier, more nutritious and sustainable choices. Currently, it is intended for assessing processed and composite foods rather than single ingredient foods. Should all foods be included under this indicator? N8 Can this indicator assess how the labelling activities of companies that are not selling directly to consumers can influence healthy food choices? If so, in what way?
32
Companies with significant operations in the following sectors: food and beverage manufacturers and processors, food retailers and restaurants and food service:
o The company has a responsible marketing policy that applies to all media and complies with the
core principles of International Chamber of Commerce (ICC) Advertising and Marketing
Communications48 and/or other independent standards relevant to the industry. It also provides
evidence of marketing activities that support these policies. o The company also has a responsible marketing policy that is specifically tailored to children and
teens49,50 across all media channels and in compliance international guidelines51. It provides
evidence of marketing activities that support these commitments. Activities can include healthy
checkouts, marketing that focuses on healthier products and must include children and teens.
o The company has a target for increasing the marketing budget spent on promoting healthy foods.
• Sources: ATNI Global Index (2020), ATNI/Share Action UK Supermarkets Spotlight (2020), GAIN/SBN
Survey results (2020), B-Lab UNGC SDG Action Manager (n.d.), CFS–FAO Principles for Responsible
Investment in Agriculture and Food Systems (n.d.), FAIRR’s Appetite for disruption: A second Serving
(2020), Food Foundation – Plating Up Progress (2020), GRI G4 Food Processing (n.d.), SASB Restaurant
Standard (2018).
C6. Workforce nutrition
• Indicator: The company has a workforce nutrition programme that prioritises making healthy food the
standard in the workplace.
• Rationale: Approximately 58% of the world’s population will spend one-third of their time at work during
their adult life, so employers have a responsibility to help tackle malnutrition52. Companies therefore can
promote nutrition at work53 through a set of interventions to improve awareness, access and supply of
healthy foods (SDGs 2, 3 and 5).
• Elements: o The company has a workforce nutrition programme that includes providing healthy food54 at
work, nutrition education, nutrition-focused health checks and breastfeeding support.
o The company demonstrates that the majority of food offerings at work are healthy.
• Sources: ATNI Global Index (2020), CDC Worksite Health Scorecard (2019), GAIN/CGF Workforce
Nutrition Alliance Scorecard (2020), SUN’s Addressing Workforce Nutrition Commitments (2019).
C7. Food safety
• Indicator: The company ensures safe food for consumers.
• Rationale: Every year, an estimated 600 million people – almost 10% of the global population – fall ill
after eating contaminated food and 420,000 die55. Unsafe food creates a vicious cycle of disease and
malnutrition, and particularly affects infants, young children, the elderly and sick (SDGs 2, 3 and 12).
• Elements:
o The company complies with national regulations and/or the Codex Alimentarius guidelines on
General Principles of Food Hygiene: Good Hygiene Practices, and the Hazard Analysis and Critical
Control Point (HACCP) System.
Consultation question
N9 Can this indicator assess how the marketing activities of companies that are not selling directly to consumers can influence healthy food choices? If so, in what way?
33
o The company has implemented an effective food safety system through certification to a
GFSI-recognised food safety scheme/certification programme.
o The company supports food suppliers to work towards certification to a GFSI-recognised food
safety scheme/certification programme.
o The company discloses the percentage of its own operations and those of its food suppliers that
are certified to a GFSI-recognised food safety scheme/certification programme.
• Sources: GFSI Benchmarking requirements (2020), FAO – Assuring Food Safety and Quality: Guidelines
for Strengthening National Food Control Systems (2003), FAO SAFA Tool (2014), SASB Processed Foods
Standard (2018), GAIN/SBN Survey results (2020), GRI G4 Food Processing (n.d.), Coller FAIRR Protein
Producer Index Methodology (2020).
D Social inclusion The private sector can have a transformational impact on peoples’ lives, both as a creator of jobs and a
producer of goods and services that people use. At the same time, the private sector is expected to integrate
a responsible approach to social issues into its business activities. In the food and agriculture system, issues
and concerns around decent livelihoods for all actors along the food value chain and land rights, for example,
also come into play. Each industry along the value chain has a social responsibility to ensure it upholds social
inclusion throughout its operations and supply chains. In line with the UN Food Systems Summit 2021’s
Action Track 4, this measurement area focuses on corporate action to advance equitable livelihoods.
Integration of core social indicators into the benchmark
WBA’s social transformation aims to incentivise companies to meet societal expectations of responsible
business conduct so that companies leave no one behind. By respecting human rights, providing decent work
and acting ethically, companies can support the SDG transformations, address inequalities and contribute to
a sustainable future for all. A key part of this is embedding the ‘leave no one behind’ principle in the system
transformation methodologies.
To do so, WBA will integrate a set of core social indicators into all WBA system transformation methodologies
to assess whether companies are demonstrating a sufficient commitment to responsible conduct. These
indicators will be used to assess companies, regardless of the sector in which they operate, based on publicly
available information, to drive transparency about responsible business conduct. They will be supplemented
by transformation-specific social indicators that are relevant to the sectors being assessed.
The following sections set out the core social indicators and the transformation-specific social indicators
against which all companies in this benchmark will be assessed.
Core social indicators
WBA consulted extensively on its core social indicator methodology during 2020. We are currently finalising
it and will publish the final methodology in January 2021. The draft core social topics are:
34
D1. Commitment to respect human rights D2. Commitment to respect the human rights of workers D3. Identifying human rights risks and impacts D4. Assessing human rights risks and impacts D5. Integrating and acting on human rights risks and impacts D6. Engagement with affected and potentially affected stakeholders D7. Grievance mechanisms for workers D8. Grievance mechanisms for external individuals and communities D9. Health and safety fundamentals D10. Living wage fundamentals D11. Working hours fundamentals D12. Collective bargaining fundamentals
D13. Workforce diversity disclosure fundamentals D14. Gender equality and women’s empowerment fundamentals D15. Personal data protection fundamentals D16. Responsible tax fundamentals D17. Anti-bribery and anti-corruption fundamentals D18. Responsible lobbying and political engagement fundamentals.
Transformation-specific social indicators
The transformation-specific social indicators build on these fundamentals and assess critical issues and
salient risks in the food and agricultural sector.
D19. Child labour56 • Indicator: The company eliminates and prevents child labour in its own operations and supply chain.
• Rationale: Worldwide, 70% of child labour is found in the agriculture sector – one of the most dangerous
in terms of work-related fatalities and disease57. The principle behind the effective abolition of child
labour is to stop all work by children that jeopardises their education and development58 (SDG targets
8.7 and 8.8).
• Elements:
o The company indicates that it does not use child labour and will verify the age of job
applicants and workers in its own operations and supply chain.
o The company provides evidence of a monitoring and verification process for its own
operations and supply chain. Where a case of child labour is found in its operations, the
company describes a transition programme for the child from employment to education. If
it finds a case in the supply chain, the company describes how it works with suppliers to
eliminate child labour and improve working conditions for younger workers.
o The company provides an analysis of trends demonstrating progress towards eliminating
child labour.
• Sources: CHRB (2020), GRI 403 (2018), ILO (1973), KnowTheChain (2020), UNGP (n.d.), UN Guiding
Principles (2017), World Development Indicators (n.d.).
35
D20. Forced labour
• Indicator: The company eliminates and prevents forced labour in its own operations and supply chain.
• Rationale: Agriculture is a high-risk sector for forced labour and human trafficking. In many
countries, agricultural workers are unskilled, temporary, often not unionised and do not know their
rights59. When coupled with threats and intimidation tactics, workers’ wages can be kept extremely low
(SDGs 8 and 10).
• Elements: o The company indicates that it does not use forced labour in its own operations and supply chain. o The company protects workers’ freedom of movement and right to collective bargaining
and requires its suppliers to adhere to the same standard. Where a case of forced labour is found, the company describes how it identifies this practice in its operations, or how it works with its suppliers to eliminate forced labour.
o The company provides an analysis of trends demonstrating progress towards eliminating forced labour.
• Sources: CHRB (2020), GRI 103 (2016), ILO (1930), KnowTheChain (2020), UNGP (n.d.), UN Guiding
Principles (2017), World Development Indicators (n.d.).
D21. Living wage
• Indicator: The company pays a living wage for all its workers and requires its suppliers to do so.
• Rationale: Two-thirds of the global population living in extreme poverty (living on less than US$1.90 per
day) are agricultural workers and their dependants60. Farm, factory and plantation workers are among
the most vulnerable, often lacking a sustainable livelihood61. They are disproportionately exposed to
income insecurity as rural employment is typically informal, seasonal and underpaid. The prevalence of
informal work, estimated to be 90% in the agriculture sector62, can threaten income security and working
conditions because of a lack of social protections (SDGs 1, 2, 3, 5, 8 and 10).
• Elements: o The company commits to paying a living wage across its operations and includes living wage
requirements in its contractual arrangements with suppliers. o The company describes how it determines a living wage for the regions where it operates. o The company provides evidence that it pays a living wage for all workers across its operations
and supply chain.
• Sources: CHRB (2020), FAO (2020), FAO SAFA Tool (2014), Future Fit Foundation (2020), OECD–ETI
(n.d.), Oxfam and RSPO (2020), Social Transformation: Draft methodology (2020), SSI (2019), ZSL SPOTT
(2019).
Consultation question
S1 ‘Child labour’ in this indicator is defined as work by people aged under 18 (children) that is not permitted. This is different to ‘child work’, which is defined as work by people under 18 (children) that is permitted. Child work is carried out by ‘young workers’. A child is anyone under the age of 18, as defined by the Convention on the Rights of the Child. ILO Convention C138 – Minimum Age for Admission to Employment (1973) specifies that a child aged under 18 can work if it is above the age for finishing compulsory schooling, and is not younger than 15 (or 14 in specific circumstances in developing countries) and as long as the work is not ‘hazardous’. This indicator assesses the prevention of child labour; safe working conditions for young workers (child work) are assessed in the health and safety indicator. Is this distinction sufficiently clear?
36
D22. Health and safety
• Indicator: The company respects the health and safety of workers and requires its suppliers to do so.
• Rationale: Almost 60% of the 1.3 billion agricultural workers are in developing countries63. Of these
workers, almost half are women. In addition, about 59% of all children aged 5–17 who are engaged in
hazardous work are in the agriculture sector64. Considering that the sector is one of the most dangerous
in terms of rates of work-related fatalities, non-fatal accidents and occupational diseases, special
attention must be paid to the health and safety of these workers (SDGs 3, 6, 8 and 16).
• Elements:
o The company commits to respecting the health and safety of its workers and expects the same of
its suppliers.
o The company discloses quantitative information on health and safety, such as injury and fatality
rates, for workers in its own operations and supply chain, and it specifically discloses information
on vulnerable groups65.
• Sources: CHRB (2020), ETI (n.d.), Coller FAIRR Protein Producer Index Methodology (2020), FAO SAFA
Tool (2014), FSC (2015), Future Fit Foundation (2020), GRI 403 (2018), RSB (2017), SASB (2018), Social
Transformation: Draft methodology (2020), ZSL SPOTT (2019).
D23. Farmer productivity and resilience
• Indicator: The company supports the resilience, productivity and access to markets of farmers and
fishers, especially for small-scale producers.
• Rationale: More than 80% of small-scale farmers operate in local and domestic food markets66. Climate
change is increasingly impacting agricultural productivity, which is particularly detrimental for small-scale
producers that can’t access productive resources67. Moreover, small-scale producers are offered fewer
opportunities to access markets68. Approximately 116 million people in developing countries depend on
commercial capture fisheries value chains for their livelihoods, of which more than 90% are involved in
small-scale fisheries.69 Small-scale fisheries benefit significantly from the resources, technology,
knowledge and training opportunities that multinational companies can provide. (SDGs 5, 7, 8, 9, 10, 11,
12, 13 and 16).
• Elements:
o The company commits to supporting farmers, fishers and small-scale producers and provides
evidence of activities such as programme(s), training and finance that support them.
o The company discloses the impact of its support activities, such as increased yields or
productivity, percentage of farmers or fishers reached, or percentage of products coming from
small-scale producers.
o The company provides evidence of taking a holistic, systems-level, multi-stakeholder approach
in its support for farmers and fishers and, in particular, small-scale producers.
• Sources: WBA’s Access to Seeds Index (2019), CHRB (2020), FAO SAFA Tool (2014), Forest500/Global
Canopy (2019), ILO Convention No. 160 (1985), RSPO (2020), WBCSD (2019), ZSL SPOTT (2019).
Consultation question
S2 While it is widely acknowledged that companies can contribute to smallholder farmers having a decent livelihood, a robust consensus on frameworks and metrics is still emerging. How should companies – agricultural producers as well as consumer-facing companies – demonstrate their support for (smallholder) farmer resilience, productivity and access to markets?
37
D24. Land rights
• Indicator: The company identifies and protects legitimate tenure rights holders when
acquiring, leasing or using land, paying particular attention to vulnerable rights holders.
• Rationale: Only 10% of the land managed by indigenous peoples and communities is formally recognised
by governments70. Women are particularly exposed because they comprise only 10–20% of all
landholders, but make up half of the agricultural workforce71. This can lead to rights violations and
precarious livelihoods for many of the most vulnerable (SDGs 10, 11, 12 and 16).
• Elements:
o The company commits to securing the rights of legitimate tenure rights holders.
o The company identifies legitimate rights holders by involving relevant local stakeholders and
following internationally recognised standards like Free, Prior and Informed Consent or
International Finance Corporation’s Performance Standards.
o The company provides a grievance mechanism that is accessible by external individuals and
communities. The company describes its process for providing prompt and adequate
remediation when legitimate rights holders are negatively affected.
o The company ensures that its supply chain adheres to the same standard by codifying it in a
supplier code of conduct.
• Sources: CHRB (2020), Forest500/Global Canopy (2019), Interlaken Group and Resources Initiative
(2019), OECD–FAO (2020), RSPO (2020), ZSL SPOTT (2019).
38
Annexes
Annex 1: Indicator glossary
• Where we say the company ‘commits to’, this means having a publicly available statement, policy or
strategy with a clear commitment to act on the topic.
• Where we say the company ‘has a target’, this means a target that is time-bound and set against a
baseline. Best practice would be a target that relates to all geographies, operations and relevant
commodities.
Annex 2: WBA guiding principles
WBA developed a set of principles to guide its work and reflect its values and mission (see Figure 9 ). These
principles were formed in collaboration with global stakeholders throughout the consultation phase and
were refined using input and feedback from roundtable consultations, online surveys and expert meetings.
The principles are divided into three categories: operational principles that explain how WBA functions;
benchmark development principles that address how the benchmarks are designed; and content principles
that cover what the benchmarks assess. Currently, the guiding principles reflect the outcomes and findings
from WBA’s global consultation phase. However, the world is rapidly changing, and additional insights and
perspectives are likely to emerge over time. Consequently, these principles may evolve – in consultation with
stakeholders – to reflect new findings and realities.
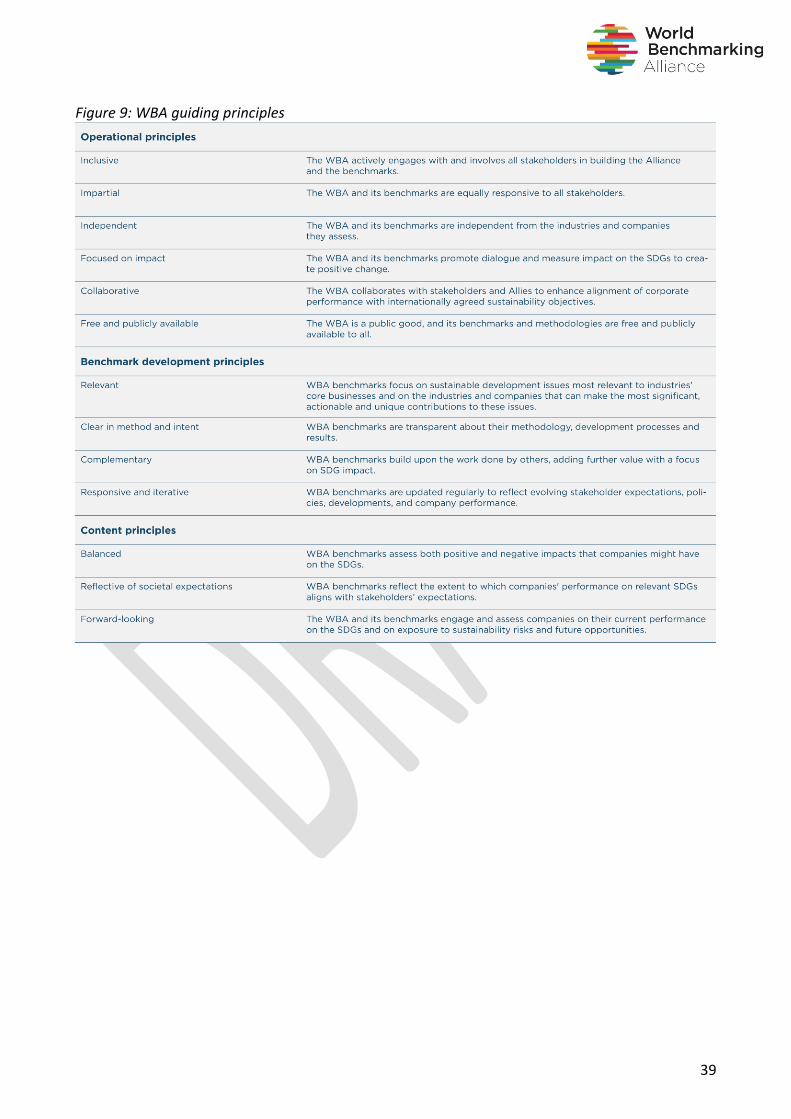
39
Figure 9: WBA guiding principles
40
Annex 3: Definitions and references
1 Stockholm Resilience Centre (2020) "How to feed the world without crossing planetary boundaries". Available at: https://www.stockholmresilience.org/research/research-news/2020-01-22-how-to-feed-the-world-without-crossing-planetary-boundaries.html. [Accessed December 2020]
2 Potsdam Institute for Climate Impact Research (2018) "Sustainable and healthy food to feed the world in 2050: Nature study". Available at: https://www.pik-potsdam.de/en/news/latest-news/sustainable-and-healthy-food-to-feed-the-world-in-2050-nature-study. [Accessed December 2020]
3 Intergovernmental Science-Policy Platform on Biodiversity and Ecosystem Services (2019) "Global assessment report on biodiversity and ecosystem services of the Intergovernmental Science-Policy Platform on Biodiversity and Ecosystem Services". Available at: https://ipbes.net/global-assessment. [Accessed June 2020]
4 World Economic Forum (2020) "Incentivizing Food Systems Transformation". Available at: http://www3.weforum.org/docs/WEF_Incentivizing_Food_Systems_Transformation.pdf. [Accessed June 2020]
5 According to the Greenhouse Gas Protocol, Scope 1 emissions are direct emissions from owned or controlled sources. Scope 2 emissions are indirect emissions from the generation of purchased energy.
6 Intergovernmental Panel on Climate Change (IPCC) (2019) "Climate Change and Land: an IPCC special report on climate change, desertification, land degradation, sustainable land management, food security, and greenhouse gas fluxes in terrestrial ecosystems". Available at: https://www.ipcc.ch/srccl/. [Accessed June 2020]
7 Organisation for Economic Co-operation and Development (OECD) (2016) "Agriculture and Climate Change: Towards Sustainable, Productive and Climate-Friendly Agricultural Systems". Available at: https://www.oecd.org/agriculture/ministerial/background/notes/4_background_note.pdf. [Accessed June 2020]
8 According to the Greenhouse Gas Protocol, Scope 3 emissions are all indirect emissions (not included in scope 2) that occur in the value chain of the reporting company, including both upstream and downstream emissions.
9 Food and Agriculture Organization of the United Nations (FAO) (2020) “The State of the World's Forests”. Available at: http://www.fao.org/state-of-forests/en/ [Accessed December 2020]
10 Pendrill, F., Persson, U.M., Godar, J., Kastner, T., Moran, D., Schmidt, S. and Wood, R. (2019) “Agricultural and forestry trade drives large share of tropical deforestation emissions”. Global Environmental Change 56:1-10. https://doi.org/10.1016/j.gloenvcha.2019.03.002. [Accessed December 2020]
11 Conversion- free as defined by the Accountability Framework Initiative
12 Key high-risk commodities: beef, palm oil, soy, cocoa, coffee
13 The Accountability Framework Initiative identifies approaches companies can use to demonstrate conversion-free supply chains.
14 Food and Agriculture Organization of the United Nations (FAO) (2020) “The State of World Fisheries and Aquaculture 2020” Available at: http://www.fao.org/state-of-fisheries-aquaculture [Accessed December 2020]
15 Bioversity International (2020) "The Agrobiodiversity Index" [online]. Available at: https://www.bioversityinternational.org/abd-index/ [Accessed December 2020] 16 The Economics of Ecosystems and Biodiversity (2018) "Measuring what Matters in Agriculture and Food Systems". Available at: http://teebweb.org/agrifood/wp-content/uploads/2018/10/ Layout_synthesis_sept.pdf [Accessed June 2020]
17 The Food Trust, PolicyLink (2010) “The Grocery Gap - Who Has Access to Healthy Food and Why It Matters”. Available at http://thefoodtrust.org/uploads/media_items/grocerygap.original.pdf. [Accessed June 2020].
18 The Lancet Global Health (2019) “Affordability of the EAT–Lancet reference diet: a global analysis”. Available at https://www.thelancet.com/journals/langlo/article/PIIS2214-109X(19)30447-4/fulltext. [Accessed February 2020].
19 Food and Agriculture Organization of the United Nations (FAO) (2010) "Water at a Glance: the relationship between water, agriculture, food security and poverty". Available at: http://www.fao.org/3/ap505e/ap505e.pdf [Accessed June 2020]
20 World Resources Institute (2019) “Water could limit our ability to feed the world”[online]. Available at: https://www.wri.org/blog/2019/11/water-could-limit-our-ability-feed-world-these-9-graphics-explain-why [Accessed November 2020]
21 Global Nutrition Report (2020) “2020 Global Nutrition Report: Action on equity to end malnutrition” Bristol, UK. Available at https://globalnutritionreport.org/reports/2020-global-nutrition-report/. [Accessed June 2020].
22 SDG Target 12.3: By 2030, halve per capita global food waste at the retail and consumer levels and reduce food losses along production and supply chains, including post-harvest losses. For the purpose of meeting SDG Target 12.3, there is consensus on the definition of food loss and waste, which is described in Guidance on Interpreting Sustainable Development Goal Target 12.3 by Champions 12.3 (a coalition of leaders from around the world.) This target has been adopted by many companies around the
41
world, often through voluntary agreements such as Courtauld 2025 in the United Kingdom, a partnership by The Consumer Goods Council of South Africa (CGCSA), The Consumer Good Forum’s Coalition of Action on Food Waste, and 10x20x30.
23 Food and Agriculture Organization of the United Nations (FAO) (2015) “Food Wastage Footprint and Climate Change”. Available at: http://www.fao.org/3/a-bb144e.pdf [Accessed November 2020]
24 Barilla Centre for Food and Nutrition (2019) "Fixing the Business of Food – The Food Industry and the SDG Challenge". Available at: https://www.barillacfn.com/m/publications/fixing-thebusiness-of-food-report.pdf. [Accessed June 2020] 25 Sustainable forms of packaging include, but are not limited to, reusable, recyclable and compostable packaging. 26 World Animal Protection "Animals in farming: supporting 70 billion animals" [online]. Available at: https://www.worldanimalprotection.org/our-work/animals-farming-supporting-70-billion-animals.[Accessed June 2020]
27 Key Species: Laying Hens; Broiler Chickens; Pigs (Sows and Meat Pigs); Dairy Cows and Calves; Beef Cattle; Aquaculture/ farmed fish
28 Key Species: Laying Hens; Broiler Chickens; Pigs (Sows and Meat Pigs); Dairy Cows and Calves; Beef Cattle; Aquaculture/ farmed fish
29 Farm Animal Investment Risk & Return Initiative (FAIRR) (2017) “Responding to Resistance”. Available at: https://www.fairr.org/article/responding-to-resistance/ [Accessed December 2020].
30 Key Species: Laying Hens; Broiler Chickens; Pigs (Sows and Meat Pigs); Dairy Cows and Calves; Beef Cattle; Aquaculture/ farmed fish
31 Food Systems Dialogues (2019) “The Food Systems Dialogues Emerging Themes 2018 –19”. Available at https://foodsystemsdialogues.org/wp-content/u
32 Food and Agriculture Organization of the United Nations (FAO) (2019) “2019 The State of Food Security and Nutrition in the World – Safeguarding against Economic Slowdowns and Down-turns”. Available at http://www.fao.org/3/ca5162en/ca5162en.pdf
33 United Nations Children's Fund (UNICEF) (2019) “The State of the World’s Children 2019. Children, Food and Nutrition: Growing well in a changing world”. New York. Available at https://www.unicef.org/me-dia/60806/file/SOWC-2019.pdf.
34 Vulnerable groups include vulnerable and marginalised populations across countries as well as within countries and markets. Vulnerability to a higher risk of malnutrition (undernutrition, nutrient deficiencies and overweight, obesity and diet-related diseases) compared to the general population can vary by geography, income or other socio-economic factors as well as by age and life stage. Depending on the form of malnutrition, vulnerable groups can include infants, children, women of reproductive age, the elderly and/or low-income or marginalized households
35 Targets in line with ATNI Methodology 2021, p. 51; 54.
36 Sustainability and health considerations describes for example the balance between animal and alternative, including plant-based proteins as recommended in the EAT Lancet reference diet and other sustainable dietary guidelines.
37 World Business Council for Sustainable Development (WBCSD) (2020) “Protein Pathways Accelerating sustainable food system transformation through business innovation”. Available at https://www.wbcsd.org/Programs/Food-and-Nature/Food-Land-Use/Resources/Prioritizing-collective-business-action-on-and-beyond-prot
38 The Lancet Commissions (2019) “Food in the Anthropocene: the EAT–Lancet Commission on healthy diets from sustainable food systems”. Available at https://www.thelancet.com/pdfs/journals/lancet/PIIS0140-6736(18)31788-4.pdf?utm_campaign=tleat19&utm_source=HubPage.
39 Springmann, M., Godfray, H.C.J., Rayner, M. and Scarborough, P. (2016) “Analysis and valuation of the health and climate change cobenefits of dietary change”. Proceedings of the National Academy of Sciences, 113(15), pp.4146-4151.
40 Labelling is defined by the Codex Alimentarius as follows: “Labelling includes any written, printed or graphic matter that is present on the label, accompanies the food, or is displayed near the food, including that for the purpose of promoting its sale or disposal.” (Codex general standard for the labelling of prepackaged foods, Codex Stan 1-1985)
41 Relevant Codex Alimentarius Standards listed by GAIN.
42 i.e. energy value, protein, total carbohydrates, total sugars, total fat, saturated fat, sodium
43 Article 3.4 of Codex Alimentarius CAC/GL 2-1985
44 http://www.healthstarrating.gov.au/internet/healthstarrating/publishing.nsf/Content/home
45 https://www.santepubliquefrance.fr/determinants-de-sante/nutrition-et-activite-physique/articles/nutri-score
46 At a minimum calories, salt, sugar, fat content
47 Healthy, nutritious and sustainable foods and drinks in this measurement area are classified as:
• not high in fats, salt and sugar (processed foods)
• fruits, vegetables, wholegrain (high-fiber foods), nuts and seeds (non-processed foods)
• plant-based proteins and animal-based proteins that can demonstrate lower environmental impact (sustainable proteins)

42
48 In line with ATNI Global Index 2020 Methodology: ICC Framework for Responsible Food and Beverage Marketing Communications (2019), sets forth how general principles of the ICC Advertising and Marketing Communications Code (2018), which governs all marketing communications, and includes separate sections on sales promotion, sponsorship, direct marketing, digital interactive marketing and environmental marketing, is applied in the context of food and beverage marketing communications.
49 In line with ATNI Global Index 2020 Methodology (2019) the following definitions apply: Category “children” is used to refer to individuals aged 12 years and under, whereas “teens” means those individuals aged 13-17 years, in line with the definition provided by the ICC Advertising and Marketing Communications Code (2018) (p. 8).
50 The following documents form the basis for the assessment of responsible marketing to children and teens:
• World Health Organization (WHO) ‘Set of recommendations on the marketing of foods and non-alcoholic beverages to children’ (2010)
• UNICEF ‘A Child Rights-Based Approach to Food Marketing: A Guide for Policy Makers’ (2018)
• ICC Framework for Responsible Food and Beverage Marketing Communications (2019)
51 For example: ICC Advertising and Marketing Communications Code, CFBAI, WHO Regional Office for Europe Nutrient Profile model, WHO Nutrient Profile model for the Western Pacific Regional Office.
52 Nutrition Connect (2020) “Providing healthier meals for a thriving workforce: A practical guide for businesses”. Available at https://nutritionconnect.org/nutrition-at-work. [Accessed June 2020].
53 Workforce nutrition programmes are a set of interventions that work through the existing structures of the workplace to address fundamental aspects of health amongst employees and/or supply chain workers (Consumer Goods Forum website, Workforce Nutrition Alliance page, https://www.theconsumergoodsforum.com/health-wellness/healthier-lives/key-projects/employee-health-and-wellbeing/workforce-nutrition-alliance/ Retrieved 25 August 2020.)
54 In line with the Workforce Nutrition Alliance Scorecard, internally set criteria for what constitutes “healthy food”, are developed in partnership with a nutritionist or registered dietitian. These internally set criteria apply to the organization (employer), or caterer / food provider depending on where food is sourced from.
55 World Health Organization (WHO) (2020) “Food Safety Key Facts”. Available at https://www.who.int/news-room/fact-sheets/detail/food-safety.
56 Child labour and child work - A “child” is anyone under the age of 18 as defined by the Convention on the Rights of the Child (CRC). A child can “work” at an earlier age than 18 as specified in ILO Convention 138 Minimum Age for Admission to Employment (1973) – i.e. if the age is above the age for finishing compulsory schooling, is in any case not less than 15 years of age (and at 14 years of age in specific circumstances in developing countries) and as long as it is not “hazardous work.” “Child labour” is work by people under 18 (“children”) that is not permitted. “Child work” is work by people under 18 (“children”) that is permitted. Child work is carried out by “young workers.”
57 International Labour Organization (ILO) (2017) “Ending child labour by 2025: A review of policies and programmes”. Available at: https://www.ilo.org/ipec/Informationresources/WCMS_IPEC_PUB_29875/lang--en/index.htm
58 International Labour Organization (ILO) “Information System of International Labour Standards: C138 – Minimum Age Convention, 1973 (no. 138)”, Available at: https://www.ilo.org/dyn/normlex/en/f?p=NORMLEXPUB:12100:0::NO::P12100_ILO_CODE:C138#:~:text=The%20minimum%20 age%20for%20admission%20to%20any%20type%20of%20employment,2
59 International Labour Organization (ILO) (2015) “Farm workers walk a fine line between exploitation and forced labour”. Available at: https://iloblog.org/2015/03/25/farm-workers-walk-fine-line-between-exploitation-and-forced-labor/
60 The Food and Land Use Coalition (2019) “Growing Better: Ten Critical Transitions to Transform Food and Land Use”. Available at: https://www.foodandlandusecoalition.org/ wp-content/uploads/2019/09/FOLU-GrowingBetter-GlobalReport.pdf. [Accessed June 2020].
61 Fairtrade International “Key Issues: Workers’ Rights” [online]. Available at: https://www.fairtrade.net/issue/workers-rights. [Accessed June 2020].
62 International Labour Organization (ILO) (2018) “Informal Economy: More than 60 per cent of the world’s employed population are in the informal economy”. Available at: https://ilo.org/global/about-the-ilo/newsroom/news/WCMS_627189/lang--en/index.htm#:~:text=More%20than%2060%20per%20cent%20of%20the%20world's%20employed%20population,in%20emerging%20and%20developing%20countries.&text=Informal%20employment%20is%20a%20greate). [Accessed June 2020].
63 International Labour Organization (ILO) (2000) “Safety and Health in Agriculture”. Available at: https://www.ilo.org/wcmsp5/groups/public/---ed_protect/---protrav/---safework/documents/publication/wcms_110193.pdf
64 Food and Agriculture Organization of the United Nations (FAO) (2019) “Child labour in agriculture: the demand side”. Available at http://www.fao.org/3/ca2975en/ca2975en.pdf. [Accessed June 2020].
65 Vulnerable groups in the food and agriculture field are particularly at risk for occupational injury and illness, including migrant and temporary labourers, women and young farmers.
43
66 Committee on World Food Security (2015) “Connecting Smallholders to Markets”. Available at http://www.fao.org/3/a-bq853e.pdf. [Accessed June 2020].
67 Food and Agriculture Organization of the United Nations (FAO) (2009) “Climate Change Impact on Agriculture and Costs of Adaptation”. Available at : http://www.fao.org/fileadmin/user_upload/rome2007/docs/Impact_on_Agriculture_and_Costs_of_Adaptation.pdf
68 Food and Agriculture Organization of the United Nations (FAO (n.d.) “Connecting Smallholders to Markets”. Available at: http://www.fao.org/3/a-bq853e.pdf 69 World Bank, Hidden Harvest - The Global Contribution of Capture Fisheries (2012). World Bank, Washington report no. 66469-GLB. http://documents1.worldbank.org/curated/en/515701468152718292/pdf/664690ESW0P1210120HiddenHarvest0web.pdf
70 World Resources Institute (2017) “By the numbers: indigenous and community land rights” [online]. Available at: https://www.wri.org/blog/2017/03/numbers-indigenous-and-community-land-rights. [Accessed June 2020]
71 Food and Agriculture Organization of the United Nations (FAO) (2020) “The female face of farming”. Available at: http://www.fao.org/gender/resources/infographics/the-female-face-of-farming/ en/. [Accessed June 2020].

44
The World Benchmarking Alliance is funded by the following organisations:
45
COPYRIGHT This work is the product of the World Benchmarking Alliance. Our work is licensed under the Creative Commons Attribution-NonCommercial-NoDerivatives 4.0 International License. To view a copy of this license, visit www.creativecommons.org/licenses/by-nc-nd/4.0/ World Benchmarking Alliance Rhijnspoorplein 10-38, 1018 TX Amsterdam, The Netherlands [email protected] www.worldbenchmarkingalliance.org