Embed Size (px)
Citation preview
Prefatory Note
The attached document represents the most complete and accurate version available based on original copies culled from the files of the FOMC Secretariat at the Board of Governors of the Federal Reserve System. This electronic document was created through a comprehensive digitization process which included identifying the best-preserved paper copies, scanning those copies,1 and then making the scanned versions text-searchable.2 Though a stringent quality assurance process was employed, some imperfections may remain.
Please note that this document may contain occasional gaps in the text. These gaps are the result of a redaction process that removed information obtained on a confidential basis. All redacted passages are exempt from disclosure under applicable provisions of the Freedom of Information Act.
1 In some cases, original copies needed to be photocopied before being scanned into electronic format. All scanned images were deskewed (to remove the effects of printer- and scanner-introduced tilting) and lightly cleaned (to remove dark spots caused by staple holes, hole punches, and other blemishes caused after initial printing). 2 A two-step process was used. An advanced optimal character recognition computer program (OCR) first created electronic text from the document image. Where the OCR results were inconclusive, staff checked and corrected the text as necessary. Please note that the numbers and text in charts and tables were not reliably recognized by the OCR process and were not checked or corrected by staff.
CONFIDENTIAL (FR)
March 15, 1978
SUMMARY AND OUTLOOK
By the StaffBoard of Governors
of the Federal Reserve System
SUMMARY AND OUTLOOK
I - 1
DOMESTIC NONFINANCIAL DEVELOPMENTS
Summary. Economic activity apparently strengthened somewhat
in February despite continuance of severe weather and the coal strike.
Employment rose considerably and the unemployment rate edged down. In-
dustrial production and factory hours recovered somewhat from their
depressed January levels, and retail sales posted a fractional gain.
At the same time, the pace of inflation increased, mainly in response
to sharply higher prices for agricultural products and foods.
Industrial production is estimated to have increased half a
per cent last month, recouping much of the January decline. Automobile
assemblies increased to an 8.2 million annual rate, recovering about
one-third of the January decline, while most other product and industrial
groupings registered moderate increases. Winter storms continued to
damp growth of production in February and the coal strike appears to have
had only small indirect effects.
Nonfarm payroll employment rose 350,000 between mid-January
and mid-February, with one-third of the advance in manufacturing. The
100-day old coal strike appears to have had little secondary impact on
employment, at least through early March, but curtailments of working
hours to conserve electricity appear to be limiting production in the
most affected 11-State area. The gain in employment, with little
change in the labor force, was sufficient to bring a further decline in
the unemployment rate to 6.1 per cent, its lowest level since October
1974 and 1-1/2 percentage points below February 1977.
I - 2
Total retail sales increased a bit in February but still
appeared depressed by the continuing severe weather. Excluding autos
and building materials retail sales were up 2.2 per cent, recovering
about two-thirds of the January decline. Unit sales of new domestic-
type autos picked up somewhat last month, rising 500,000 to an 8.5
million annual rate, and rose further to a 9.3 unit rate early in
March. So far this year, however, the average sales pace has been well
below the 9.1 million units sold in 1977.
Indicators of business investment spending continue to suggest
moderate growth in 1978. The February survey of anticipated outlays
for plant and equipment showed planned spending for 1978 to be 10.9
per cent above last year, or about 2 percentage points less than the
1977 rise. The 1978 increase now anticipated is larger than that
indicated by the November survey because of a shortfall of spending
late last year. Among other investment indicators, new orders for
nondefense capital goods fell about half as much in January as they
had risen in December, while nonresidential construction contracts rose
somewhat further to a level well above earlier levels. Total contracts
and orders were down over the month but the level was still above
the fourth quarter average. The book value of manufacturers' in-
ventories rose at a $9 billion annual rate in January as shipments
declined in part because of bad weather.
State and local governments continue to follow conservative
spending policies; employment has risen only moderately in recent months
and construction activity, which was hampered by bad weather in January,
has shown little growth in the last year. Because of this conservative
approach to program expansion, many States are experiencing large opera-
tional surpluses, and there is now a strong likelihood of significant
tax relief in a number of States. At the Federal level, spending con-
tinues to fall below the path deemed by OMB to be consistent with the
FY 1978 budget and the Administration has revised down its spending
estimate for the fiscal year from $462 to $454 billion.
Wholesale prices for finished goods rose sharply in February--
by 1.1 per cent--about twice as much as the recent monthly average. The
acceleration was concentrated in foods. Price increases for nonfood
finished goods continued rising at a relatively moderate rate, 0.4 per
cent. Reflecting the recent run-up in food prices and the initial
impact of large minimum wage and payroll tax increases, the Consumer
Price Index rose 0.8 per cent in January--about twice the average
monthly rise during the second half of last year.
Outlook. Incoming data since the last FOMC meeting have not
changed the staff's assessment of economic expansion through mid-1979,
but the current quarter now appears somewhat weaker. Real GNP growth
during the first quarter of 1978 is estimated at about a 3-1/2 per cent
annual rate--down from the 4-1/2 per cent indicated last month. Given
current information on the value of retail sales, real personal consump-
tion outlays during the quarter are unlikely to change much from the
advanced fourth quarter level. Furthermore, construction interruptions,
I -4
presumably weather-related, appear to have been more widespread than
believed earlier; State and local government spending as well as private
construction outlays were substantially reduced early in the quarter.
However, manufacturing employment and industrial production showed
significant increases in February indicating faster inventory accumula-
tion for the quarter than we had anticipated earlier.
Growth in the second and third quarters of 1978 is projected
to be a little higher than indicated last month due to a stronger
rebound now expected for final sales as the weather improves.
The staff continues to assume that the indirect effects of the
coal strike will be minimal, as current coal shipments, remaining in-
ventories, shifts to other fuels and purchases of electricity appear
likely to be sufficient to avert serious production disruptions. How-
ever, continuation of the coal strike well into March means inventories
of basic fuels are likely to run down nearly $8 billion (annual rate)--
considerably more than anticipated in the February Greenbook.
Our tax and monetary policy assumptions are basically unchanged
this month. The projection continues to incorporate the effects of a
$25 billion tax cut--two-thirds to individuals--effective October 1, 1978.
For monetary policy, M-1 growth is assumed to average 5-1/4 per cent
through 1979-QII, with short-term interest rates rising during the remainder
of this year, particularly during the spring months. Federal unified
outlays in fiscal 1978, however, were reduced $3-1/2 billion to $455
billion, reflecting recent weakness in spending and the Administration's
I - 5
outlay re-estimates. Because financial transactions account for part of
the downward revision, the impact on real activity is estimated to be small.
small. Over the entire six quarter projection period, real output
growth is projected to average 4-1/2 per cent, annual rate, about the
same as indicated in February's Greenbook. Through mid-1979, real
business fixed investment is expected to grow at a 6 per cent annual
rate--somewhat stronger than suggested by the Commerce Department Survey
of planned expenditures but still less than the 1977 increase. Real
consumption is also expected to rise less than in 1977, partly because of
slower income growth and rising debt burdens. Real residential construc-
tion expenditures are projected to begin to decline in the third quarter of
1978 as tighter mortgage markets dampen housing starts and sales.
Economic growth in the 4-1/2 per cent zone is expected to generate
a further large increase in employment. However, with labor force growth
also expected to be rapid, the unemployment rate is projected to decline
only moderately to about 5.7 per cent by mid-1979. Gains in productivity
still appear likely to average 2-1/2 per cent (annual rate) and in
hourly compensation 9 per cent (annual rate); thus, increases in unit
labor costs would average about 6-1/2 per cent. Although projected
domestic price increases have been scaled up slightly--reflecting both
the recent further decline of the dollar in foreign exchange markets and
somewhat larger rises in food prices early this year--the underlying rate
of inflation is still expected to be about in line with the rise in unit
labor costs.
Details of the staff projections are shown in detail in the
tables that follow.
I -6
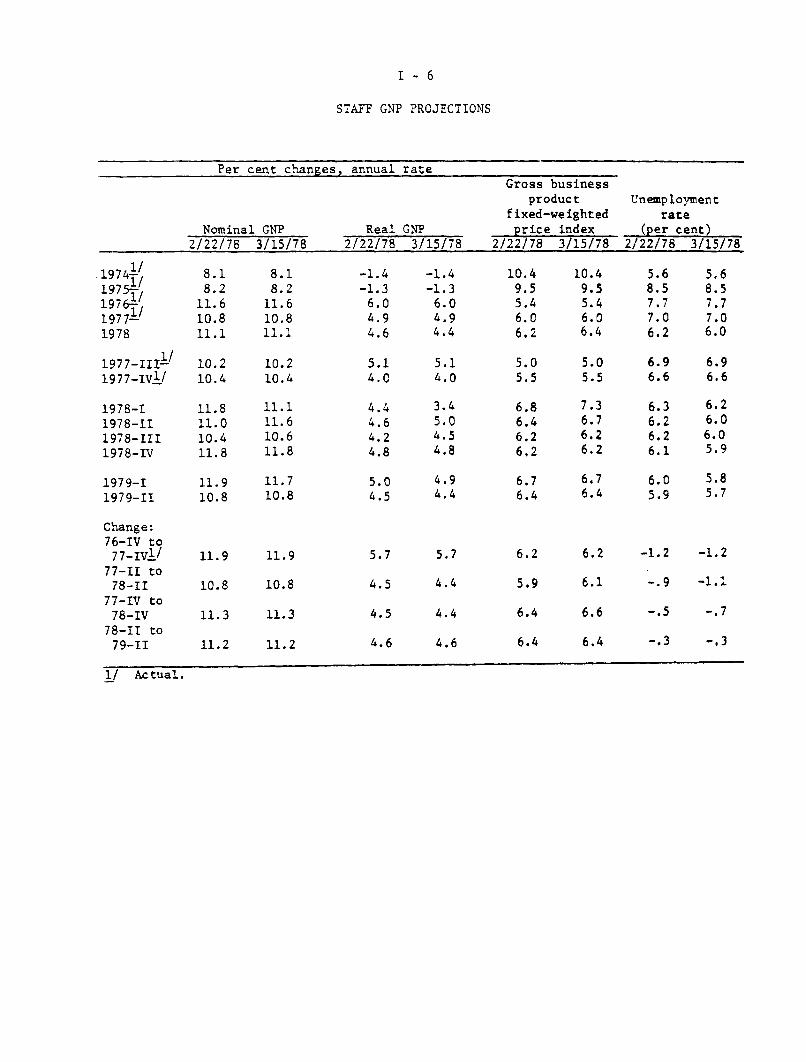
STAFF GNP PROJECTIONS
Per cent changes, annual rateGross business
product Unemploymentfixed-weighted rate
Nominal GNP Real GNP price index (per cent)2/22/78 3/15/78 2/22/78 3/15/78 2/22/78 3/15/78 2/22/78 3/15/78
8.18.2
11.610.811.1
10.210.4
11.811.010.411.8
8.18.2
11.610.811.1
10.210.4
11.111.610.611.8
111974-1
1/1975--197 6
19771/1978
1977-III-/
1977-IV1/
1978-I1978-111978-III1978-IV
1979-I1979-11
Change:76-IV to77-IV1 l77-11 to78-11
77-IV to78-IV78-II to79-11
-1.4-1.36.04.94.6
5.04.5
5.7
4.5
4.5
4.6
-1.4-1.36.04.94.4
10.49.55.46.06.2
10.49.55.46.06.4
6.9 6.96.6 6.6
6.26.06.05.9
6.0 5.85.9 5.7
-1.2 -1.2
-.9 -1.1
-. 5 -. 7
-.3 -.3
1/ Actual.
11.9 11.710.8 10.8
11.9 11.9
10.8 10.8
11.3 11.3
11.2 11.2
CONFIDENTIAL - FRCLASS II FOMC
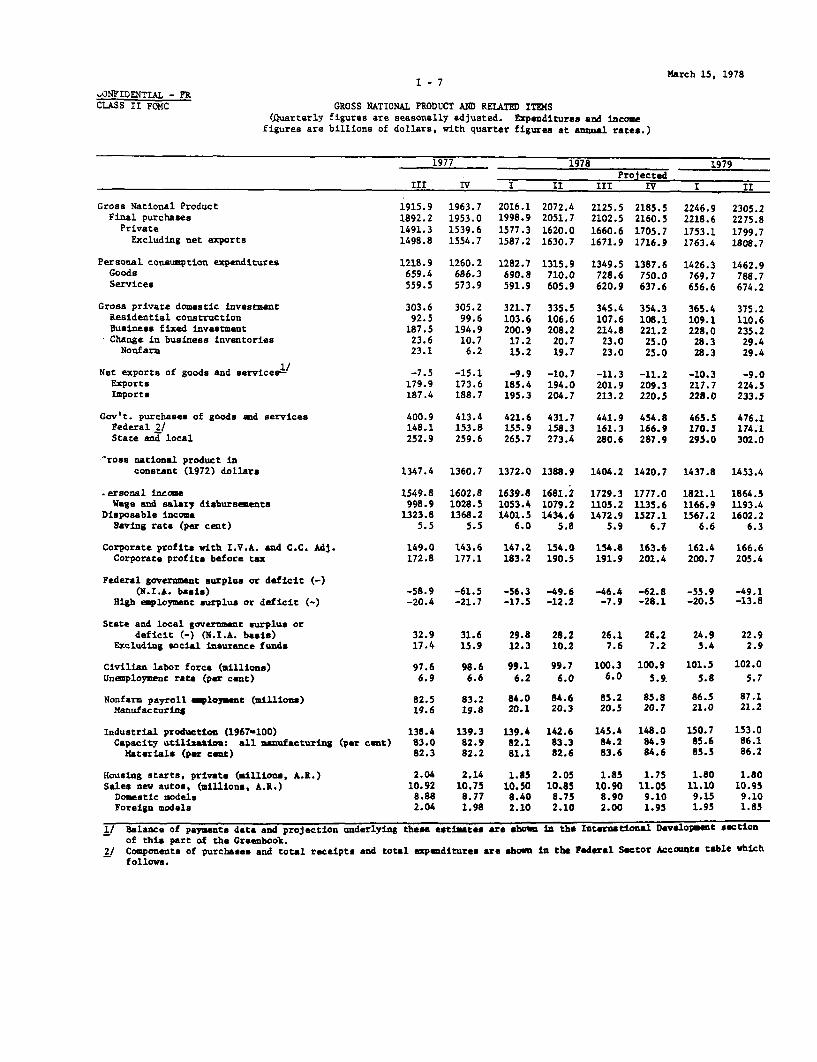
I - 7
GROSS NATIONAL PRODUCT AND RELATED ITEMS(Quarterly figures are seasonally adjusted. Expenditures and income
figures are billions of dollars, with quarter figures at annual rates.)
March 15, 1978
1977 1978 1979Projected
III IV I II III IV I II
Gross National ProductFinal purchasesPrivate
Excluding net exports
Personal consumption expendituresGoodsServices
Gross private domestic investmentResidential constructionBusiness fixed investmentChange in business inventoriesNonfarm
Net exports of goods and services1ExportsImports
Gov't. purchases of goods and servicesFederal 2/State and local
1915.91892.21491.31498.8
1218.9659.4559.5
303.692.5187.523.623.1
1963.71953.01539.61554.7
1260.2686.3573.9
305.299.6
194.910.76.2
2016.11998.91577.31587.2
2072.42051.71620.01630.7
1282.7 1315.9690.8 710.0591.9 605.9
321.7103.6200.917.215.2
335.5106.6208.220.719.7
2125.52102.51660.61671.9
1349.5728.6620.9
345.4107.6214.823.023.0
2185.52160.51705.71716.9
1387.6750.0637.6
354.3108.1221.2
25.025.0
2246.92218.6
1753.11763.4
1426.3769.7656.6
365.4109.1228.0
28.328.3
2305.22275.81799.71808.7
1462.9788.7674.2
375.2110.6235.229.429.4
-7.5 -15.1 -9.9 -10.7 -11.3 -11.2 -10.3 -9.0179.9 173.6 185.4 194.0 201.9 209.3 217.7 224.5187.4 188.7 195.3 204.7 213.2 220.5 228.0 233.5
400.9 413.4 421.6 431.7 441.9 454.8148.1 153.8 155.9 158.3 161.3 166.9252.9 259.6 265.7 273.4 280.6 287.9
465.5170.5295.0
Gross national product inconstant (1972) dollars 1347.4 1360.7 1372.0 1388.9 1404.2 1420.7
476.1174.1302.0
1437.8 1453.4
ersonal incomeWage and salary disbursements
Disposable incomeSaving rate (per cent)
Corporate profits with I.V.A. and C.C. Adj.Corporate profits before tax
Federal government surplus or deficit (-)(N.I.A. basis)
High employment surplus or deficit (-)
State and local government surplus ordeficit (-) (N.I.A. basis)
Excluding social insurance funds
Civilian labor force (millions)Unemployment rate (per cent)
Nonfarm payroll employment (millions)Manufacturing
Industrial production (1967-100)Capacity utilization: all manufacturing (per cent)
Materials (per cent)
Housing starts, private (millions, A.R.)Sales new autos, (millions, A.R.)
Domestic modelsForeign models
1549.8998.9
1323.85.5
1602.81028.51368.2
5.5
1639.81053.41401.5
6.0
1681.21079.21434.6
5.8
1729.31105.21472.9
5.9
1777.01135.61527.1
6.7
1821.11166.91567.2
6.6
1864.51193.41602.2
6.3
149.0 143.6 147.2 154.0 154.8 163.6 162.4 166.6172.8 177.1 183.2 190.5 191.9 201.4 200.7 205.4
-58.9 -61.5 -56.3 -49.6 -46.4 -62.8 -55.9 -49.1-20.4 -21.7 -17.5 -12.2 -7.9 -28.1 -20.5 -13.8
32.9 31.6 29.8 28.2 26.1 26.2 24.9 22.917.4 15.9 12.3 10.2 7.6 7.2 5.4 2.9
97.6 98.6 99.1 99.7 100.3 100.96.9 6.6 6.2 6.0 6.0 5.9
101.55.8
102.0
5.7
82.5 83.2 84.0 84.6 85.2 85.8 86.5 87.1
19.6 19.8 20.1 20.3 20.5 20.7 21.0 21.2
138.483.082.3
2.0410.928.882.04
139.3 139.4 142.682.9 82.1 83.382.2 81.1 82.6
2.1410.75
8.771.98
1.8510.508.402.10
2.0510.858.752.10
145.4 148.0 150.784.2 84.9 85.683.6 84.6 85.5
1.8510.908.902.00
1.7511.059.101.95
1.8011.109.151.95
153.086.186.2
1.8010.959.101.85
1/ Balance of payments data and projection underlying these estimates are shown in the International Development sectionof this part of the Greenbook.
2/ Components of purchases and total receipts and total expenditures are shown in the Federal Sector Accounts table whichfollows.
CONFIDENTIAL - FRCLASS II FOMC
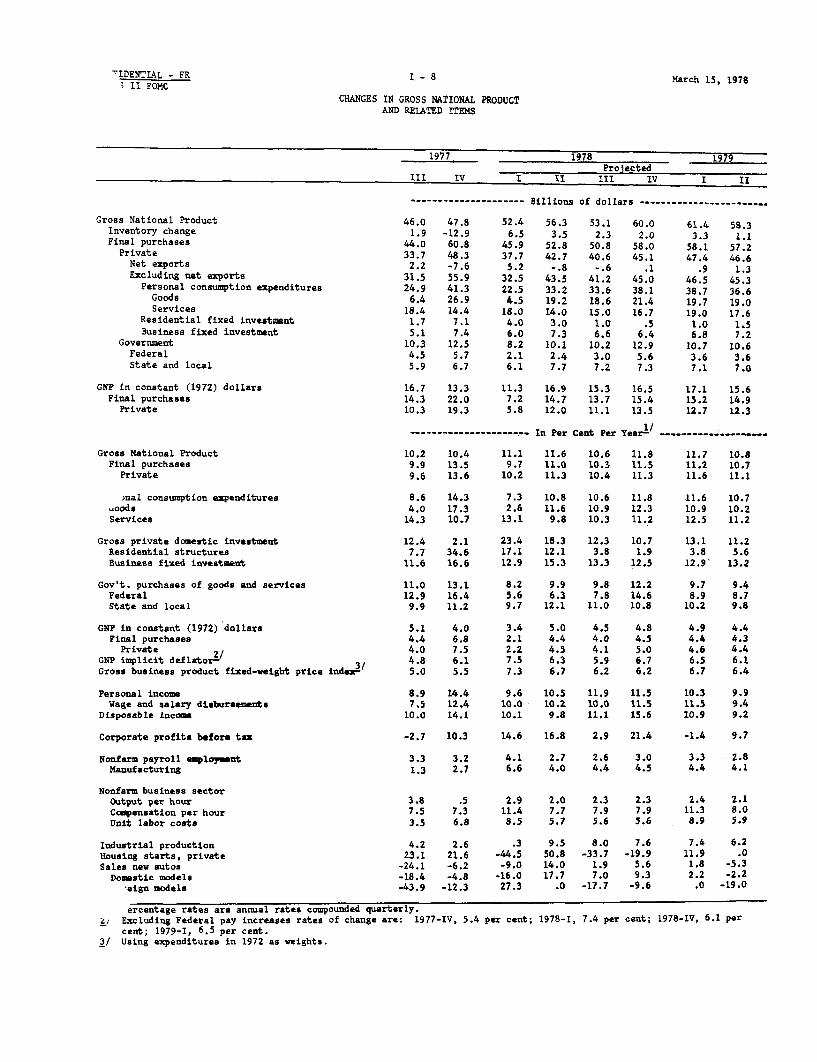
I-8 March 15, 1978
CHANGES IN GROSS NATIONAL PRODUCTAND RELATED ITEMS
1977 1978 1979Projected
III IV I II III IV I II
--------------------- Billions of dollars --------------...........
Gross National ProductInventory changeFinal purchases
PrivateNet exportsExcluding net exports
Personal consumption expendituresGoodsServices
Residential fixed investmentBusiness fixed investment
GovernmentFederalState and local
GNP in constant (1972) dollarsFinal purchases
Private
46.0 47.81.9 -12.9
44.0 60.833.7 48.32.2 -7.6
31.5 55.924.9 41.36.4 26.9
18.4 14.41.7 7.15.1 7.4
10.3 12.54.5 5.75.9 6.7
16.7 13.314.3 22.010.3 19.3
52.4 56.3 53.1 60.06.5 3.5 2.3 2.0
45.9 52.8 50.8 58.037.7 42.7 40.6 45.15.2 -. 8 -. 6 .1
32.5 43.5 41.2 45.022.5 33.2 33.6 38.14.5 19.2 18.6 21.4
18.0 14.0 15.0 16.74.0 3.0 1.0 .56.0 7.3 6.6 6.48.2 10.1 10.2 12.92.1 2.4 3.0 5.66.1 7.7 7.2 7.3
11.3 16.9 15.3 16.57.2 14.7 13.7 15.45.8 12.0 11.1 13.5
--------------------- In Per Cent Per Year- -------- --......
Gross National ProductFinal purchases
Private
Personal consumption expendituresGoodsServices
Gross private domestic investmentResidential structuresBusiness fixed investment
Gov't. purchases of goods and servicesFederalState and local
GNP in constant (1972) dollarsFinal purchases
Private 2/GNP implicit deflator2/Gross business product fixed-weight price index3/
Personal incomeWage and salary disbursements
Disposable income
Corporate profits before tax
Nonfarm payroll employmentManufacturing
Nonfarm business sectorOutput per hourCompensation per hourUnit labor costs
Industrial productionHousing starts, privateSales new autos
Domestic modelsForeign models
10.2 10.49.9 13.59.6 13.6
8.6 14.34.0 17.3
14.3 10.7
11.1 11.6 10.6 11.89.7 11.0 10.3 11.5
10.2 11.3 10.4 11.3
7.3 10.8 10.6 11.82.6 11.6 10.9 12.3
13.1 9.8 10.3 11.2
12.4 2.1 23.4 18.3 12.3 10.77.7 34.6 17.1 12.1 3.8 1.9
11.6 16.6 12.9 15.3 13.3 12.5
11.0 13.1 8.2 9.9 9.8 12.212.9 16.4 5.6 6.3 7.8 14.69.9 11.2 9.7 12.1 11.0 10.8
5.1 4.0 3.4 5.0 4.5 4.84.4 6.8 2.1 4.4 4.0 4.54.0 7.5 2.2 4.5 4.1 5.04.8 6.1 7.5 6.3 5.9 6.75.0 5.5 7.3 6.7 6.2 6.2
8.9 14.4 9.6 10.5 11.9 11.57.5 12.4 10.0 10.2 10.0 11.5
10.0 14.1 10.1 9.8 11.1 15.6
11.7 10.811.2 10.711.6 11.1
11.6 10.710.9 10.212.5 11.2
13.1 11.23.8 5.6
12.9 13.2
9.7 9.48.9 8.7
10.2 9.8
4.9 4.44.4 4.34.6 4.46.5 6.16.7 6.4
10.3 9.911.5 9.410.9 9.2
-2.7 10.3 14.6 16.8 2.9 21.4 -1.4 9.7
3.3 3.2 4.1 2.7 2,6 3.0 3.3 2.81.3 2.7 6.6 4.0 4.4 4.5 4.4 4.1
2.9 2.011.4 7.78.5 5.7
4.2 2.623.1 21.6
-24.1 -6.2-18.4 -4.8-43.9 -12.3
2.3 2.3 2.4 2.17.9 7.9 11.3 8.05.6 5.6 8.9 5.9
.3 9.5 8.0 7.6-44.5 50.8 -33.7 -19.9-9.0 14.0 1.9 5.6
-16.0 17.7 7.0 9.327.3 .0 -17.7 -9.6
7.4 6.211.9 .01.8 -5.32.2 -2.2
.0 -19.0
61.4 58.33.3 1.1
58.1 57.247.4 46.6
.9 1.346.5 45.338.7 36.619.7 19.019.0 17.61.0 1.56.8 7.2
10.7 10.63.6 3.67.1 7.0
17.1 15.615.2 14.912.7 12.3
ercentage rates are annual rates compounded quarterly.2/ Excluding Federal pay increases rates of change are: 1977-IV, 5.4 per cent; 1978-1, 7.4 per cent; 1978-IV, 6.1 per
cent; 1979-I, 6.5 per cent.3/ Using expenditures in 1972 as weights.
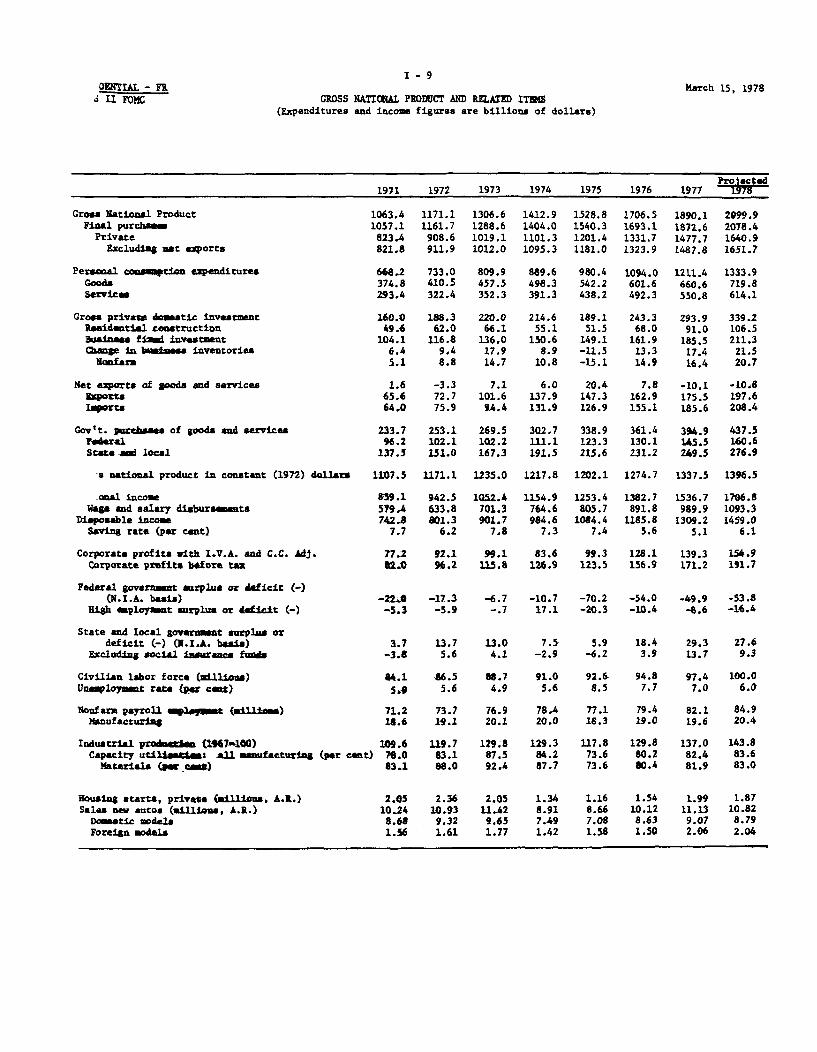
CONFIDENTIAL - FRCLASS II FOMC
I-9
GROSS NATIONAL PRODUCT AND RELATED ITEMS(Expenditures and income figures are billions of dollars)
March 15, 1978
Gross National Product 1Final purchases 1
PrivateExcluding net exports
Personal cosumption expendituresGoodsServices
Gross private domestic investmentResidential constructionBusiness fixed investmentChange in business inventories
Nonfarm
Net exports of goods and servicesExportsImports
Gov't. purchases of goods and servicesFederalState and local
Gross national product in constant (1972) dollars
Personal incomeWage and salary disbursements
Disposable incomeSaving rate (per cent)
Corporate profits with I.V.A. and C.C. Adj.Corporate profits before tax
Federal government surplus or deficit (-)(N.I.A. basis)
High employment surplus or deficit (-)
State and local government surplus ordeficit (-) (N.I.A. basis)
Excluding social insurance funds
Civilian labor force (millions)Unemployment rate (per cent)
Nonfarm payroll employment (millions)Manufacturing
Industrial production (1977=100)Capacity utilization all manufacturing (per cent)
Materials (per cent)
Housing starts, private (millions, A.R.)Sales new autos (millions, A.R.)
Domestic modelsForeign models
1971
.063.4057.1823.4821.8
668.2374.8293,4
160.049.6
104.16.45.1
1.665.664.0
233.796.2
137.5
1107.5
859.1579.4742.8
7.7
77.281.0
1972
1171.11161.7908.6911.9
733.0410.5322.4
188.362.0116.89.48.8
-3.372.775.9
253.1102.1151.0
1171.1
942.5633.8801.36.2
92.196.2
1973
1306.61288.61019.11012.0
809.9457.5352.3
220.066.1
136.017.914.7
7.1101.69A.4
269.5102.2167.3
1235.0
1052.4701.3901.77.8
99.1115.8
1974
1412.91404.01101.31095.3
889.6498.3391.3
214.655.1
150.68.9
10.8
6.0137.9131.9
302.7111.1191.5
1217.8
1154.9764.6984.6
7.3
83.6126.9
1975
1528.81540.31201.41181.0
980.4542.2438.2
189.151.5
149.1-11.5-15.1
20.4147.3126.9
338.9123.3215.6
1202.1
1253.4805.7
1084.47.4
99.3123.5
1976
1706.51693.11331.71323.9
1094.0601.6492.3
243.368.0
161.913.314.9
7.8162.9155.1
361.4130.1231.2
1274.7
1382.7891.8
1185.85.6
128.1156.9
Proiected1978
2099.92078.41640.91651.7
1333.9719.8614.1
339.2106.5211.3
21.520.7
-10.8197.6208.4
437.5160.6276.9
1396.5
1706.81093.31459.0
6.1
154.9191.7
-22A -17.3 -6.7 -10.7 -70.2 -54.0 -49.9 -53.8-5.3 -5.9 -. 7 17.1 -20.3 -10.4 -8.6 -16.4
3.7-3.8
84.15,4
71.218.6
109.678.083.1
2.0510.248.681.56
13.75.6
86.55.6
73.719.1
119.783.188.0
2.3610.939.321.61
13.04.1
88.74.9
76.920.1
129.887.592.4
2.0511.429.651.77
7.5-2.9
91.05.6
78.420.0
129.384.287.7
5.9-6.2
92.68.5
77.118.3
117.873.673.6
18.43.9
94.87.7
79.419.0
129.880.280.4
1.34 1.16 1.548.91 8.66 10.127.49 7.08 8.631.42 1.58 1.50
29.313.7
97.47.0
82.119.6
137.082.481.9
1.9911.139.072.06
27.69.3
100.06.0
84.920.4
143.883.683.0
1.8710.828.792.04
1977
1890.11872.61477.71487.8
1211.4660.6550.8
293.991.0
185.517.416.4
-10.1175.5185.6
394.9145.5249.5
1337.5
1536.7989.9
1309.25.1
139.3171.2

March 15, 1978
I - 10CONFIDENTIAL - FRCLASS II FOMC CHANGES IN GROSS NATIONAL PRODUCT
AND RELATED ITEMS
Projected1971 1972 1973 1974 1975 1976 1977 1978
------------------------ Billions of Dollars -------------------
Gross National ProductInventory changeFinal purchases
PrivateNet exportsExcluding net exportsPersonal consumption expenditures
GoodsServices
Residential fixed investmentBusiness fixed investment
GovernmentFederalState and local
GNP in constant (1972) dollarsFinal purchases
Private
Gross National ProductFinal purchases
Private
Personal consumption expendituresGoods
Services
Gross private domestic investmentResidential structuresBusiness fixed investment
Gov't. purchases of goods and servicesFederalState and local
GNP in constant (1972) dollarsFinal purchases
PrivateGNP implicit deflatorGross business product fixed-weighted index1/
Personal incomeWage and salary disbursements
Disposable income
Corporate profits before tax
Nonfarm payroll employmentManufacturing
Nonfarm business sectorOutput per hourCompensation per hourUnit labor costs
Industrial productionHousing startsSales new autos
Domestic modelsForeign models
81.0 107.7 135.5 106.3 115.9 177.7 183.6 209.82.6 3.0 8.5 -9.0 -20.4 24.8 4.1 4.1
78.5 104.6 126.9 115.4 136.3 152.8 179.5 205.863.7 85.2 110.5 82.2 100.1 130.3 146.0 163.2-2.3 -4.9 10.4 -1.1 14.4 -12.6 -17.9 -. 766.0 90.1 100.1 83.3 85.7 142.9 163.9 163.949.4 64.8 76.9 79.7 90.8 113.6 117.4 122.525.2 35.7 47.0 40.8 43.9 59.4 59.0 59.224.3 29.0 29.9 39.0 46.9 54.1 58.5 63.313.0 12.4 4.1 -11.0 -3.6 16.5 23.0 15.53.6 12.7 19.2 14.6 -1.5 12.8 23.6 25.8
14.8 19.4 16.4 33.2 36.2 22.5 33.5 42.6.6 5.9 .1 8.9 12.2 6.8 15.4 15.1
14.3 13.5 16.3 24.2 24.1 15.6 18.3 27.4
32.2 63.6 63.9 -17.2 -15.7 72.6 62.8 59.029.9 60.8 56.8 -8.6 2.1 54.2 59.9 56.730.7 57.1 57.4 -13.8 -3.2 52.8 53.3 45.8
-------------------- In Per Cent Per Year ----------------------
8.2 10.1 11.6 8.18.0 9.9 10.9 8.98.4 10.3 12.2 8.1
8.2 11.6 10.8 11.19.7 9.9 10.6 11.09.1 10.8 11.0 11.0
8.0 9.7 10.5 9.8 10.2 11.6 10.7 10.17.2 9.5 '11.4 8.9 8.8 11.0 9.8 9.09.0 9.9 9.3 11.1 12.0 12.4 11.9 11.5
13.6 17.7 16.8 -2.5 -11.9 28.7 20.8 15.435.5 25.1 6.6 -16.7 -6.5 32.2 33.7 17.03.6 12.3 16.4 10.8 -1.0 8.6 14.5 13.9
6.8 8.3 6.5 12.3 12.0.6 6.1 .1 8.7 11.0
11.6 9.8 10.8 14.5 12.6
6.6 9.3 10.85.5 11.8 10.47.2 7.9 11.0
5.5 -1.4 -1.34.9 -.7 .26.3 -1.4 -. 35.8 9.7 9.65.7 10.4 9.5
4.9 4.44.7 4.35.3 4.35.6 6.46.0 6.4
9.7 11.7 9.7 8.5 10.3 11.1 11.19.4 10.7 9.0 5.4 10.7 11.0 10.47.9 12.5 9.2 10.1 9.4 0. 4 1.4
14.7 17.3 20.4 9.6 -2.7 27.0 9.1 12.0
.4 3.5 4.3 2.0 -1.7 3.1 3.4 3.3-4.0 2.8 5.1 -.1 -8.5 3.3 3.2 4.3
1.7 -2.9 1.67.8 9.4 9.66.0 12.7 7.9
2.1 2.18.7 8.56.4 6.3
1.7 9.2 8.4 -. 4 -8.9 10.2 5.5 5.043.1 14.9 -13.2 -34.6 -13.3 32.5 29.2 -5.921.9 6.8 -4.7 -14.5 -2.8 16.9 9.9 -2.821.9 7.4 3.5 -22.4 -5.5 21.9 5.1 -3.121.8 3.1 9.7 -19.9 11.4 -5.1 37.2 -.8
fsing expenditures in 1972 as weights.
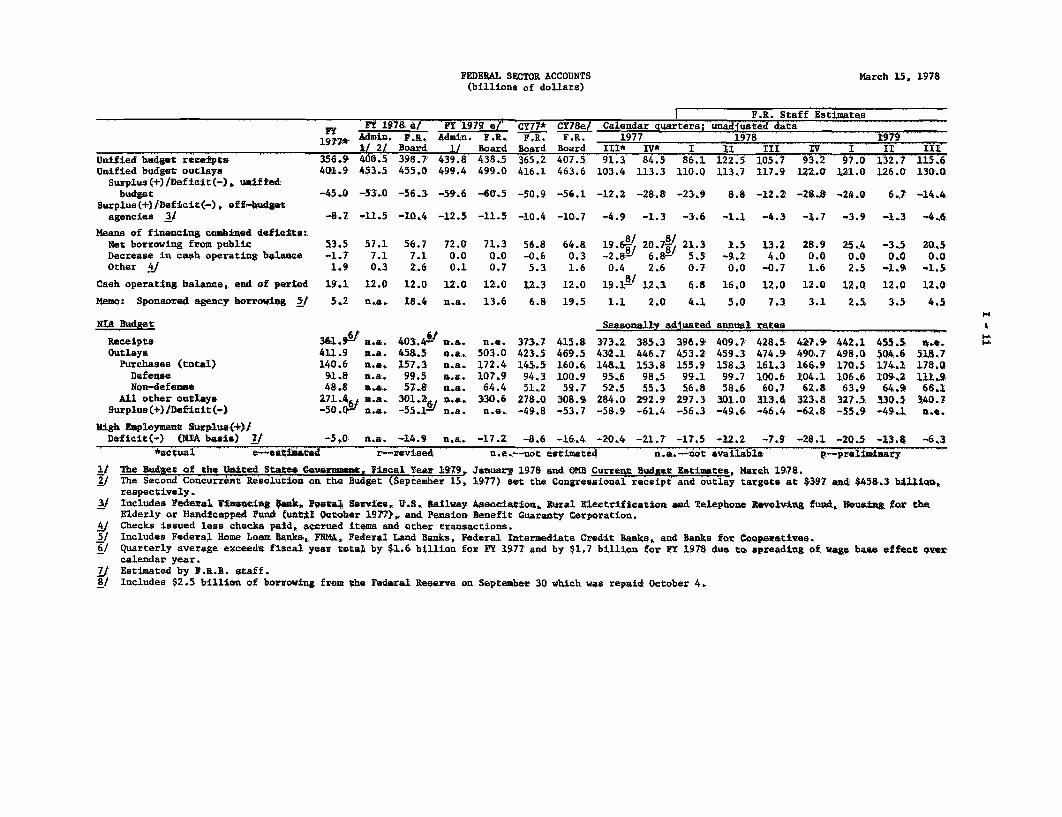
FEDERAL SECTOR ACCOUNTS(billions of dollars)
March 15, 1978
Unified budget receiptsUnified budget outlays
Surplus (+)/Deficit (-) unifiedbudget
Surplus(+)/Deficit(-) off-budgetagencies 3/
Means of financing combined deficits:Net borrowing from publicDecrease in cash operating balanceOther 4/
Cash operating balance, end of period
y FY 1978 A/w 197t e/1977* Admin. F.R.,19 2/ Board
356.9 400.5 398.7403.9 453.5 455.0
FT 1979 e/'Admin. F.R.
1/ Board439.8 438.5499.4 499.0
CY77*FJ.R.
Board365.2416.1
t F.R. Staff EstimatesCY78e/ Calendar quartera; unadjusted data
F.R. 1977 1978Board III* IV* I 11 II407.5 91.3 84.5 86.1 122.5 105.7463.6 103.4 113.3 110.0 113.7 117.9 1
IV93.222.0O
I97.0
121.0
1979II
132.7126.0
III115.6130.0
-45.0 -53.0 -56.3 -59.6 -60.5 -50.9 -56.1 -12.2 -28.8 -23.9 8.8 -12.2 -28.8 -24.0 6.7 -14.4
-8.7 -11.5 -10.4 -12.5 -11.5 -10.4 -10.7 -4.9 -1.3 -3.6 -1.1 -4.3 -1.7 -3.9 -1.3 -4.6
53.5 57.1-1.7 7.11.9 0.3
56.7 72.0 71.3 56.8 64.8 19.6, 20.7, 21.37.1 0.0 0.0 -0.6 0.3 -2. ; -' 6.8-' 5.52.6 0.1 0.7 5.3 1.6 0.4 2.6 0.7
1.5 13.2 28.9 25.4 -3.5 20.5-9.2 4.0 0.0 0.0 0.0 0.0
0.0 -0.7 1.6 2.5 -1.9 -1.5
19.1 12.0 12.0 12.0 12.0 12.3 12.0 19.1-8 12.3 6.8 16.0 12.0 12.0 12.0 12.0 12.0
Memo: Sponsored agency borrowing 5/ 5.2 n.a. 18.4 n.a. 13.6 6.8 19.5 1.1 2.0 4.1 5.0 7.3 3.1 2.5 3.5 4.5
NIA Budget
ReceiptsOutlays
Purchases (total)DefenseNon-defense
All other outlaysSurplus(+) /Deficit(-)
High Employment Surplus(+)/Deficit(-) (WA basis) 7/
'actua-L
Seasonally adjusted annual rates
361,9 6 a.a.411.9 n.a.140.6 n.a.
91,8 n.a.48.8 n.e.
271.4,( .a-50.0' n.a.
403.4 n.a.458.5 n.a.157.3 n.a.99.5 n.a.57.8 n.a.
301.26, n.a.-55.1-' n.a.
n.e.503.0172.4107.9
64.4330.6n.e.
373.7423.5145.5
94.351.2
278.0-49.8
415.8469.5160.6100.959.7
308.9-53.7
373.2432.1148.195.652.5
284.0-58.9
385.3446.7153.8
98.555.3
292.9-61.4
396.9453.2155.999.156.8
297.3-56.3
409.7,459.3158.399.758.6
301.0-49.6
428.5474.9161.3100.6
60.7313.6-46.4
-5,0 n.a. -14.9 n.a. -17.2 -8.6 -16.4 -20.4 -21.7 -17.5 -12.2 -7.9e-eastmaea r--revised n.e.--not estimated n.a.--not available
427.8490.7166.9104.162.8
323.8-62.8
442.1498,0170.5106.663.9
327.5-55.9
455.55Q4.6174.1109.2
64.9330.5-49.1
-28.1 -20.5 -13.8
518.7178.0111.S66.1
340.7n.e.
-6.3p-prelminary
The Budget of the Uitced States Gevernaent. aiscal Year 1979, January 1978 and OMB Current Budget Estimates, March 1978.The Second Concurrent Resolutio on the Budget (September 15, 1977) set the Congressional receipt and outlay targets at $397 and $458.3 billion,respectively.Includes Federal Financing Bank, Posta4 Service, U.S. Railway Association, Rural Electrification and Telephone Revolving fund, Housig for theElderly or Handicapped Fund (untl October 1977,, and Pension Benefit Guaranty Corporation.Checks issued less checks paid, accrued items and other transactions.Includes Federal Home Loan Banks, FNMA, Federal Land Banks, Federal Intermediate Credit Banks, and Banks for Cooperativea.Quarterly average exceeds fiscal year total by $1.6 billion for FY 1977 and by $1.7 billion for FY 1978 due to, spreading of wage base effect overcalendar year.Estimated by F.R.B. staff.Includes $2.5 billion of borrowing from the Federal Reserve on September 30 which was repaid October 4.
-
-_L~L i. ( . I --n-jlL~ -~~---. - :- -- .. .;-i.il- -.~-. -.- I~.__ _~ .. ~..__ .._. __ I
I - 12 - 13
Comments on the Fiscal Policy Outlook
According to recent Treasury data, Federal spending during
January and February appears to have been about $2 billion below earlier
agency estimates. The Office of Management and Budget now expects spending
to increase less than anticipated earlier, and as a result has lowered its
estimate of the fiscal year 1978 outlays from $462 to $453-1/2 billion.
The Administration's revisions were spread through most of the budget's
functional categories but adjustments were particularly large in defense,
energy (petroleum storage), interest, construction grants and financial
transactions, especially for the Export-Import Bank and for the foreign
military sales trust fund.
Since the staff had anticipated about two-thirds of the overall
shortfall, our current outlay revision was much less than the Administra-
tion's. However, the staff's current outlay forecast of $455 billion is
about $1-1/2 billion above the Administration's most recent estimate,
mainly because we expect outlays for farm aid and interest1/ to be higher
than currently budgeted. The staff's receipts projection is essentially
unchanged from last month at $398-1/2 billion.
The staff now anticipates that the combined deficit (unified
plus off-budget) in the current fiscal year will be around $66-1/2 billion.
The Treasury has already raised $35 billion during this fiscal year,
1/ The revised budget assumes a constant 6.4 per cent bill rate forfiscal years 1978 and 1979.
I - 14
including $14-1/2 billion since January 1, 1978. Another $8 to $10 billion
in additional new financing is expected in the market before the April 15
tax date. During the remainder of the second quarter, seasonally high
tax receipts should enable the Treasury to pay down around $8 to $10 billion
of marketable debt.
Fiscal year 1979 outlays now are projected at $499 billion,
about in line with the Administration's latest estimate. Our spending
forecast, however, continues to differ somewhat in composition from that
of the Administration. As in the current fiscal year, the staff expects
that fiscal year 1979 outlays for interest and for farm price supports
will be higher than currently budgeted. On the other hand, spending for
a number of grant and transfer programs appears likely to be below Ad-
ministration estimates. The staff continues to assume passage of a
$25 billion reduction (net) in personal and corporate taxes. Although
our tax assumptions remain unchanged, the fiscal year 1979 receipts fore-
cast has been revised upward $3 billion to $438-1/2 billion, mainly due
to reestimates of tax refunds.
The full employment budget, which attempts to measure changes
in discretionary fiscal policy, continues to show a large $20 billion
increase in the deficit for the fourth quarter of 1978, reflecting the
implementation of the assumed tax cut.
I-15
DOMESTIC FINANCIAL DEVELOPMENTS
There has been no notable change in the structure of interest
rates during the past few weeks, except for some decline in yields on
shorter-dated Treasury bills associated with strong demand from foreign
official institutions. Major factors affecting the public's expec-
tations about monetary policy have tended to offset one another-
slower expansion of the economy and the monetary aggregates on one side,
and pressure on the dollar and sharply rising price indexes on the other.
M-1 declined at a 4 per cent annual rate in February. Apart
from the possible impacts of lagging tax refunds and imperfect seasonal
adjustment, the February drop appears to reflect the slackening of
economic expansion associated with the severe winter weather and
the coal strike. M-2 and M-3 also decelerated last month, reflecting
the drop in M-1 and slow growth in interest-bearing deposits subject
to Federal rate ceilings. The strong competition from higher-yielding
market instruments was evidenced by another large increase in the
assets of money market mutual funds and by a substantial volume of
noncompetitive tenders in Treasury bill auctions.
Under these circumstances, depositary institutions have added
further to their money market liabilities and other indebtedness in
order to meet customers' demands for credit. Large time deposits
at commercial banks increased $6 billion in February, and nondeposit
funds also rose markedly. The outstanding indebtedness of savings and
loan associations to Home Loan Banks increased rapidly in February and
in early March.
I - 16
Bank credit expanded at a 10 per cent annual rate in
February. Business loan growth remained rapid; expansion of consumer
and mortgage loans is estimated to have slowed slightly, extending
the trend of the past half year. In addition, banks added substantially
to their holdings of Treasury securities--the first gain in 8 months.
This probably was a transitory phenomenon, reflecting heavier than
usual Federal financing during the month.
Outstanding commercial paper of nonfinancial firms declined
in February, and total borrowing by such businesses at banks and
in the commercial paper market continued at about its average pace
since mid-1977. Public bond offerings remained at a relatively low
level, and underwriters report that private placement activity has
abated somewhat since year-end.
Net mortgage lending and outstanding commitments at S&L's
declined appreciably in January. Inclement weather may have played
a major part, but cash flow pressures appear to have prompted a
firming in S&L lending policies since last fall. Origination of FHA/VA
mortgages slowed in February, owing in considerable measure to the
large discounts prevailing on such loans; a 1/4 percentage point
increase at the end of the month in FHA/VA home mortgage ceilings
to 8-3/4 per cent still left significant discounts. Reflecting
the relatively attractive prices on commitments they had obtained
earlier from FNMA, mortgage bankers stepped up their deliveries
of FHA/VA mortgages to FNMA last month, while sharply decreasing
their issuance of GNMA pass-throughs.
I-17
State and local bond issuance in February was somewhat less
than in the preceding month, and municipal yields remained exceptionally
low relative to rates on taxable securities. Treasury credit demands
have continued sizable--although a bit below the staff's earlier
expectations, because of lagging Federal outlays. Sponsored credit
agency borrowing--primarily FHLB and FNMA--was heavy in February in
both short- and long-term security markets.
Outlook. Private demands for credit appear to have eased
somewhat in the current quarter, partly as a consequence of the transi-
tory effects of the weather and the coal strike. If economic activity
picks up as expected during the spring, it is likely that credit
demands will begin to press harder on available supplies--assuming
growth of the monetary aggregates within the ranges set by the FOMC.
In the nonfinancial corporate sector, the gap between
capital expenditures and internal funds generated is projected to
widen in the second quarter. Firms may increase their issuance of
bonds, as well as expand their borrowing through commercial mortgages;
the strong cash flows of life insurance companies and pension funds
should enable them to supply a large proportion of these funds.
Business borrowing at banks is expected to remain strong, and this,
in conjunction with continued demands for residential mortgage
and consumer credit, is likely to exert further pressure on bank
liquidity positions.
I-18
Household demand for instalment credit may grow somewhat over
the near-term as consumer spending strengthens again. In the home
mortgage market, demands for credit should continue strong, but
borrowers are likely to encounter rising interest rates and increasingly
stringent nonprice terms as thrift institutions attempt to bring their
lending commitments into a more comfortable alignment with their cash
flow. Further reduction of liquid asset holdings--perhaps facilitated
by a cut in FHLBB requirements--and continued heavy use of FHLB advances
should permit S&L's to limit the decline in their lending. FNMA's net
mortgage acquisitions may increase; outstanding standby purchase
commitments have grown considerably of late. Reflecting their
sizable lending, the FHLB System and FNMA will remain heavy borrowers
in the months ahead.
The aggregate budgetary surplus of State and local governments
is expected to diminish in the second quarter. The staff expects
this to be reflected primarily in reduced liquid asset accumulation;
bond issuance probably will remain around its recent more moderate
level, while short-term borrowing will rise seasonally, led by the
$4 billion New York State spring financing operation.
Treasury financing demands, however, are likely to place
less pressure on credit markets in the months immediately ahead
than in the early part of the year. The Federal budget will
swing into seasonal surplus in the second quarter, and although
a moderate amount of new cash may be raised through regular
coupon financings, this borrowing will be more than offset by a pay-
down of cash management bills maturing shortly after the mid-April
income tax date.
I - 19
INTERNATIONAL DEVELOPMENTS
Summary. During the last three weeks several currencies
came under strong pressure in the exchange markets and actions were
taken by the U.S., German, Swiss and Japanese authorities to counter
these pressures.
, the trade-weighted value of the do lar
against major currencies rose slightly. The Japanese yen was in very
strong demand in the period
. On March 15 the Japanese authorities
announced several measures intended to stem capital inflows. Earlier
in the period the Swiss franc fell back sharply after tightening of
measures to discourage capital inflows.
On March 13 the U.S. and German authorities announced agree-
ment on measures to provide support for the dollar. These measures
included a doubling of the swap line with the Bundesbank to $4 billion,
and arrangements to use SDR 600 million (about $740 million) to acquire
deutschemarks, if necessary, together with an indication of greater
agreement on economic policies. Apparently more decisive actions were
expected by the market and the immediate reaction was negative. Additiona
intervention for account of the System and the Treasury brought net
U.S. sales of German marks for the period to $567 million equivalent.
Exchange market activity in the week of March 13 included some
strengthening of the French and Italian currencies in response to
political developments in those countries.
I-20
The U.S. trade deficit for January continued to be very large
at about a $37 billion annual rate on the international transactions
basis. The interpretation of recent trade data has been complicated by
the effects of a two-month dock strike ending November 20 and a change
of the method for compiling these data. Nevertheless, it appears that
U.S. exports continued through January to show no upward momentum,
while imports continued to rise in line with U.S. economic activity.
Data reported on private banking transactions in January show
a rise in net outflows - probably largely reflecting seasonal factors.
Foreign lending by U.S. banks' domestic offices and foreign branches
decelerated somewhat in the fourth quarter of 1977. The slowdown of
ending during 1977 affected claims on most areas, and was noteworthy
for two of the largest borrowers, Brazil and Mexico, whose external
accounts have improved markedly.
Some signs of economic resurgence appeared in Germany and
Japan in the fourth quarter of last year and early this year. So far, output
growth remains generally sluggish in the other major foreign industria
countries. Inflation rates have continued the downtrend generally
established in 1977, but rates of increase in consumer prices remain
relatively high in most countries. Large current-account imbalances
remain; while some countries have continued to reduce their deficits,
Japan's current account in January again recorded a strong surplus.

I - 21
Among major foreign countries trade developments last year were
characterized by a cutback in import volumes while exports continued
to grow, but at a reduced pace.
Outlook. Current projections of the U.S. trade and current
account balances through the middle of next year are not much changed
from those of a month ago -- the trade deficit for 1978 is estimated
at $33 billion and the current account deficit at $21 billion, both
up slightly from 1977. The trade and current account deficits are
projected to level off midway-through 1978. This projection reflects
steady growth of the U.S. economy while activity abroad is expected
to expand at higher rates than in 1977 and it also allows for the
considerable depreciation of the do lar since last September. However,
should the unexpectedly high rates of trade deficit recorded recently
persist for another month or two, with little pick-up in exports in
response to gains in economic activity abroad a significant change in
the outlook for the international accounts would be indicated.
Reviewing exchange market developments in recent weeks, the
staff has become increasingly impressed by the degree of market pessimism
about the dollar. However, the staff does not anticipate a further
substantial change in the average value of the dollar a year from now,
though it does expect some further depreciation against a few strong
currencies.
CONFIDENTIAL (FR)CLASS II FOMC
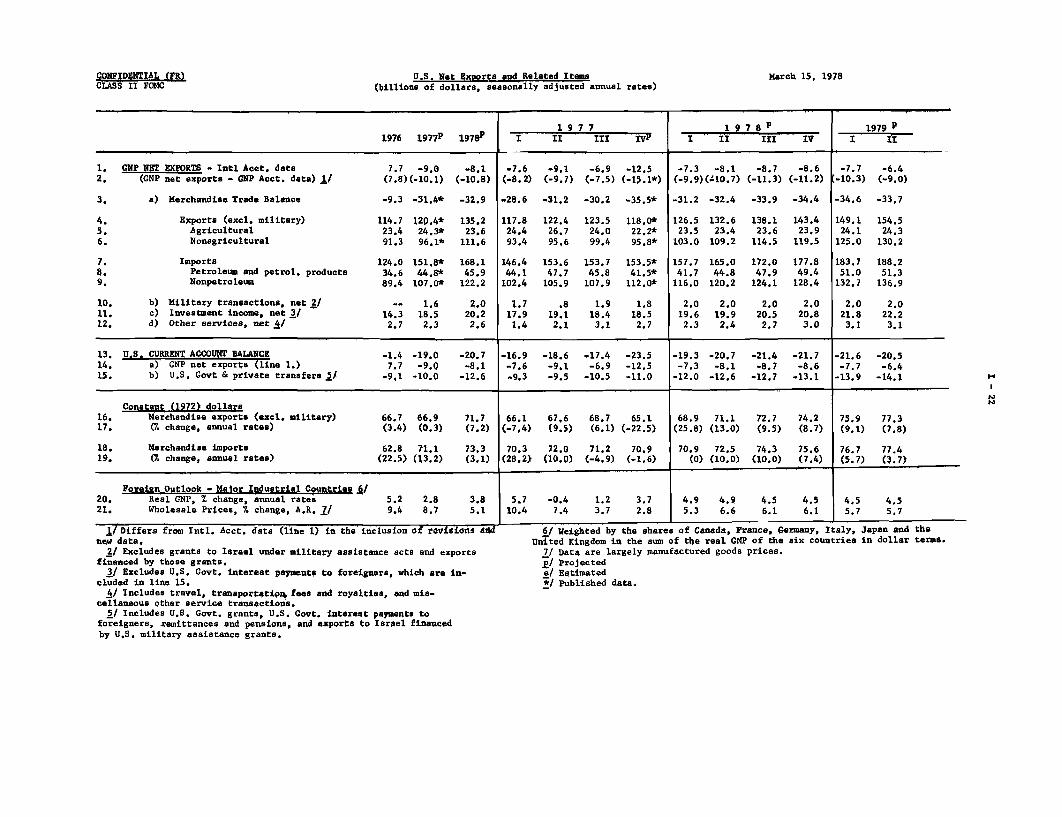
U.S. Net Exports and Related Items(billions of dollars, seasonally adjusted annual rates)
March 15, 1978
1. GNP NET EXPORTS - Intl Acct. data2. (GNP net exports - GNP Acct. data) 1/3. a) Merchandise Trade Balance
4. Exports (excl. military)5. Agricultural6. Nonagricultural
7. Imports8. Petroleum and petrol. products9. Nonpetroleum
10. b) Military transactions, net 2/11. c) Investment income, net 3/12. d) Other services, net 4/
1976 1 9 77 P 1 9 7 8P
7.
-.
,-.
7.7 -9.0 -8.1(7.8)(-10.1) (-10.8)
-9.3 -31.4* -32.9
114.7 120.4* 135.223.4 24.3* 23.691.3 96.1* 111.6
124.0 151.8* 168.134.6 44.8* 45.989.4 107.0* 122.2
- 1.6 2.0
14.3 18.5 20.22.7 2.3 2.6
1977I II III IVP
-7.6 -9.1-12. -7.
-7.6 -9.1(-8.2) (-9.7)
28.6 -31,2
117.8 122.424,4 26.793.4 95.6
146.4 153.644.1 47.7102.4 105.9
1.7 .817.9 19.11.4 2,1
-6.9(-7.5)
-30.2
123.524,099.4
153.745.8
107.9
1.918.43.1
-12.5(-15.1*)
-35.5*
118.0*22.2*95.8*
153.5*41.5*
112.0*
1.818.52.7
1978I II III IV
-7.3 -8.1(-9.9)(-10.7)
-31.2 -32.4
126.5 132.623.5 23.4
103.0 109.2
157.7 165.041.7 44.8116.0 120.2
2.0 2.019.6 19.92.3 2.4
-8.7(-11.3)
-33.9
138.123.6114.5
172.047.9
124.1
2.020.52.7
-8.6(-11.2)
-34.4
143.423.9
119.5
177.849.4
128.4
2.020.8
3.0
1979 p
I II
-7.7(-10.3)
-34.6
149.124.1125.0
183.751.0
132.7
2.021.8
3.1
-6.4(-9.0)
-33,7
154.524.3
130.2
188.251.3
136.9
2.022.23.1
13, US. CURRENT ACCOUNT BALANCE -1.4 -19.0 -20.7 -16.9 -18.6 -17.4 -23.5 -19.3 -20.7 -21.4 -21.7 -21.6 -20.514. a) GNP net exports (line 1.) 7.7 -9.0 -8.1 -7.6 -9.1 -6.9 -12.5 -7.3 -8.1 -8.7 -8.6 -7.7 -6.415. b) U.S. Govt & private transfers 5/ -9,1 '10.0 -12.6 -9.3 -9.5 -10.5 -11.0 -12.0 -12.6 -12.7 -13.1 -13.9 -14.1
Constant (1972) dollars16. Merchandise exports (excl. military) 66.7 66.9 71.7 66.1 67,6 68.7 65.1 68.9 71.1 72.7 74.2 75.9 77.317. (7. change, annual rates) (3.4) (0.3) (7.2) (-7,4) (9.5) (6.1) (-22.5) (25.8) (13.0) (9.5) (8.7) (9.1) (7.8)
18. Merchandise imports 62.8 71.1 73.3 70.3 72.0 71.2 70.9 70.9 72.5 74.3 75.6 76.7 77.419. (% change, annual rates) (22.5) (13.2) (3.1) (28,2) (10.0) (-4,9) (-1,6) (0) (10.0) (10.0) (7.4) (5.7) (3.7)
Foreign Outlook - Maor Industrial Countries 6/20. Real GNP, % change, annual rates21, Wholesale Prices, % change, A,R. ./
5.2 2.8 3.89.4 8.7 5.1
/ Differs from Intl. Acct. data (line 1) in the inclusion Of revisidos addnew data.
2/ Excludes grants to Israel under military assistance acts and exportsfinanced by those grants.3/ Excludes U.S. Govt. interest payments to foreigners, which are in-
cluded in line 15.A/ Includes travel, transportatip~ fees and royalties, and mis-
cellaneous other service transactions.2/ Includes U.S. Govt. grants, U,S. Govt. interest payments to
foreigners, remittances and pensions, and exports to Israel financedby U.S. military assistance grants.
5.7 -0.4 1.2 3.710.4 7.4 3.7 2.8
4.9 4.9 4.5 4.55.3 6.6 6.1 6.1
4.5 4,55.7 5.7
6/ Weighted by the shares of Canada, France, Germany, Italy, Japan and the
United Kingdom in the sum of the real GNP of the six countries in dollar terms.7/ Data are largely manufactured goods prices.1/ Projectede/ Estimated*/ Published data.
- -- -