Embed Size (px)
Citation preview

MOVEMENT OF A FLUORESCENT LIPID LABEL
FROM A LABELED ERYTHROCYTE MEMBRANE TO AN
UNLABELED ERYTHROCYTE MEMBRANE
FOLLOWING ELECTRIC-FIELD-INDUCED FUSION
ARTHUR E. SOWERSAmerican Red Cross Laboratories, Bethesda, Maryland 20814
ABSTRACT A short burst of electric field pulses was used to induce nearly simultaneous fusion among 50% or more of apopulation composed of unlabeled erythrocytes and erythrocytes labeled with the fluorescent lipid analogue DiI(1,1',-dihexadecyl-3,3,3",3'-tetra-methylindo carbocyanine perchlorate). Fusion products that ended in an hourglassshape were selected for analysis. The net movement of the label from the labeled membrane to the adjacent unlabeledmembrane in each of the hourglass-shaped fusion products was recorded by micrography at various known times afterthe fusion took place, but before equilibrium was achieved. The lateral concentration gradients were measured bydensitometry and compared with predictions based on Huang's model (Huang, H.-W., 1973, J. Theor. Biol., 40:11-17)for lateral diffusion on a spherical membrane. The average lateral diffusion coefficients, 3.8 and 8.1 x 10⁻⁹ cm2/s in pH7.4 isotonic phosphate buffer at 23-25°C and 35-370C, respectively, compare very favorably with the results of threepublished photobleaching studies of the lateral diffusion of DiI in erythrocyte membranes. While the fusion approach to
measuring lateral diffusion is not new, it has not enjoyed widespread use because of the uncertainty in the degree offusion synchrony and low fusion yield. This study shows that the use of pulsed electric fields to induce synchronousfusion is a promising approach to overcome both of these drawbacks and yield results comparable to those obtainable bythe photobleaching approach.
INTRODUCTION
The lateral diffusion coefficient for membrane componentshas been previously measured by following the movementof labeled components from labeled membranes to unla-beled membranes after the two membranes are fused(1-4). This approach has been recently given the acronymFRAF, for Fluorescence Redistribution After Fusion (4).In these studies, fusion was induced by creating chemical(polyethylene glycol in references 2, 4) or biological (Sen-dai virus in references 1, 2, 3) conditions favorable forfusion to occur. However, the low frequency of fusionrequires a search of many membranes to locate a few fusedmembranes. Also, since discovery of these fused mem-branes is likely to occur at a significant amount of timeafter the fusion event, there will be an appreciable amountof uncertainty in the estimation of how far into the pastfusion took place, even if back extrapolation is used. Therecent discovery that both a high-fusion yield and fusioncan be induced in many membranes simultaneously, ornearly simultaneously, in a given preparation by electricfield pulses (for reviews see references 5, 6) offers a wayaround these two problems.
This paper describes the principles, the required experi-mental setup, and the procedure we followed in using
BIOPHYS. J. Biophysical Society * 0006-3495/85/04/519/07Volume 47 April 1985 519-525
electric field induced fusion in the FRAF approach tomeasure the lateral-diffusion coefficient for DiI in humanerythrocyte membranes in isotonic phosphate buffer (pH7.4). Portions of this work have been reported in prelimi-nary form (7).
METHODS
Human whole blood collected in plastic bags containing a citrate-phosphate-dextrose-adenine mixture was obtained from the Washington,DC American Red Cross Regional Blood Services. Packed red cells wereobtained by centrifugation at 300 g for 10 min. Packed red cells wereresuspended and were washed at least once in isotonic sodium phosphatebuffer (pH 7.4), at 0-40C. Red cells were labeled with the fluorescent dyeDiI(C- 16) as follows: Pelleted red cells were resuspended at the rate of 0.5ml per 4.45 ml of labeling buffer (100 mM sucrose, 20 mM sodiumphosphate, pH 7.4). A quantity (50,sl) of DiI in ethanol (3.5 mg/ml) wasadded to the red cell suspension and incubated at 370C for 30 min(labeling was much less extensive and less homogeneous if higherphosphate concentrations were used). Red cells were then pelleted andwashed two times in isotonic pH 7.4 buffer at room temperature(23-250C). DiI was obtained from Molecular Probes (Junction City,OR). All other chemicals were obtained from Sigma Chemical Co. (St.Louis, MO).
Working red cell suspensions were made by diluting labeled andunlabeled pellets with 15-20 vol of isotonic phosphate buffer (pH 7.4).Working labeled membrane suspensions were mixed with working unla-beled membrane suspensions in the ratio of - 1:7, and added to the fusion
$1.00 519

chamber (Fig. 1) from one of the two sides to result in the filling of thechamber by capillary wicking. An extra quantity of the mixed membranesuspension was added to both sides to make reservoir pools. The fusionchamber was then inverted and fastened to the fusion slide frame (Fig. 1)with tape.
Wire (no. 22 gauge tinned-copper) electrodes were immersed to adepth of - 1 mm in each reservoir pool. The remaining components of theoverall setup were as follows. The fusion slide, which carried the fusionchamber, was then placed on the stage of laboratory microscope (model16; Carl Zeiss, Inc., Thornwood, NY) equipped with a 35mm camerahaving a motor-driven film advance controlled by a Zeiss MC 63 shuttercontrol, a 100 W Zeiss epifluorescence illuminator, a Zeiss FITC filterset, and an oil lOOx plan achro 1.24 NA objective lens (Carl Zeiss, Inc.).After a wait of 2-3 min to allow red cells to fall and pack close enough totouch each other in a nearly continuous monolayer of cells, fusion wasinduced by applying a train of pulses from a very simple circuit (Fig. 1)composed of a mercury-wetted relay pulser which alternately cycled acapacitor, C2, betwen a charging circuit (involving a series connectionwith a (DC) electrophoresis-type power supply) and a discharging circuitinvolving a series connection with the fusion chamber electrodes. Sinceadjustment of the concentration of red cells in the suspension led todifferent final cell densities in the cell monolayer formed after red cellsedimentation, the ratio of hourglass-shaped doublet fusion products topolysphere fusion products could be controlled. The circuit was made toalternate between these two circuits by driving the relay coil with acurrent from the 60 Hz alternating current (AC) lines. The length, width,and height of the fusion chamber were -2.0, 1.5, and 0.075 mmrespectively. Separate experiments (Sowers, A. E., manuscript acceptedfor publication) with a storage screen oscilloscope showed optimum ornearly optimum fusion efficiency with a capacitor (C2) value (0.01 ,uf)such that the decay half time of the pulses, the major critical variable inelectric field-induced fusion in these membranes, which were delivered tothe conductive suspension was -0.3-0.6 ms. Between 700-1,000 Vapplied to the input terminals of this circuit was found to be the voltagerange needed to give optimum fusion.A delay timer controlled the time interval during which the train of
pulses was delivered to the membranes and medium. Simultaneous withthis train of pulses was a note from an audio beeper. A cassette deckrecorded the audio note that signaled the interval during which pulseswere applied (and fusion occurred) and, after various time intervals,recorded the camera shutter noises. Simultaneous fusion and significantfusion yields were apparent with a pulse train composed of -40-60 pulses.During playback of the cassette recorder human reaction time wasestimated to contribute less than about +0.5 s error. Thus the interval, t,between the moment of fusion and the moment each micrograph wasmade, could be accurately determined. The associated time constant, Tc,for the gradient in each micrograph is also needed to calculate the lateraldiffusion coefficient. This was accomplished as follows.
Micrographs were made with 1/4 or 1/2 s exposures on 35 mm colorfilm (VR-000, Kodak Laboratory and Specialty Chemicals, Rochester,NY), processed with the Unicolor K2 chemistry kit for the Kodak C-22process according to instructions. Black and white positive images (Fig. 2)were printed on Kodak commercial film (4127) or Kodak royal pan(4141) (Kodak Laboratory and Specialty Chemicals) from the colornegative images on the developed VR-I000 film, and scanned along a linepassing through both poles of the image of the hourglass-shaped fusionproducts (Fig. 3) using a one-dimensional gel scanner (Quick ScanR + D, Helena Laboratories, Beaumont, TX) in the percent transmissionmode (separate tests were made to ensure that all exposures were made onthe linear portion of the characteristic curves of the emulsions used).Upon fusion, membranes became quickly converted from the two-membrane two-sphere configuration to a single membrane with thehourglass configuration (Fig. 2). To avoid the need for an overlapcorrection for the resolution profile of the lens, and a trigonometriccorrection for the fluorescence intensity of a point on a luminous planewith angles of incidence that would change markedly along a scan linefrom one pole to the other pole of the hourglass-shaped fusion product,
DC700-1p0 V
FIGURE 1 Fusion chamber, fusion slide, and circuit for inducing pulses:(a) Fusion slide composed of fusion chamber and fusion slide frame.Fusion chamber is bounded on upper and lower sides by a 22 x 22 mmcoverslip, CS, and microslide, MS, (2.0 mm wide, 10 mm long, and 1.0mm thick) cut from a standard 25 x 75 x I mm glass microscope slide.The chamber is bounded on the two sides by single sheets of parafilm- 2 x 2 mm and with edges separated from each other by -1.5 mm toform a rectangular space 2.0 mm long, 1.5 mm wide, and -0.075 mmhigh. The parafilm holds the CS to the MS after brief compression in adry-mounting press set for 650C. Wire electrodes (No. 22 gauge, tinnedcopper), W, are bent and positioned until immersed -1.0 mm into eachfluid reservoir (see text) on each side of the fusion chamber. The fusionchamber is turned upside down and fastened to the fusion slide frame withtape, T, to make the complete fusion slide. The fusion slide frame is madefrom two 5 x 75 mm and two 5 x 25 mm strips cut from a standardmicroscope slide with a diamond scribe and cemented together with epoxycement, E. (b) Circuit used to generate a train of exponentially decayingpulses for inducing fusion. Line switch connects power to the delay-to-activate relay and primary of step-down transformer, T, having a 12.6V secondary. After a delay of 0.7-1.0 s the delay relay removes powerfrom the transformer. Diodes, D, rectify the transformer secondaryalternating current to pulsating direct current, which is either filtered byC, (100 gf ), and fed to the audio note generating device (beeper) or fed,unfiltered, to the coil of the mercury-wetted relay, Y (Clare HGSM 5009or equivalent; General Instrument Corp., Clare Div., Chicago, IL), whichdrives the armature (arrow) from the resting position on the right contactto the left contact on each pulse. This causes capacitor C2 to dischargethrough the membrane and membrane-containing medium load in thefusion chamber. After the relay pulse, the armature returns to the restingposition, which allows the capacitor to be recharged through a resistor(103 Q2) that prevents an excessive current from passing through the relaycontacts.
BIOPHYSICAL JOURNAL VOLUME 47 1985520

two locations on the scans of the positive images on film were chosen forfluorescence intensity measurement where the membrane was perpendic-ular to the optical axis. These locations were on the two equatorialmeridians that coincided with the maximum diameter of each bulb of thehourglass (Fig. 3 a). The height of the scan line (HL) at the chosen pointof the originally labeled membrane and the height of the scan line (Hu) atthe chosen point on the originally unlabeled membrane were recorded.Since the gradient predicted by Huang (8) is always symmetrical aboutthe midpoint of the gradient, comparing either HL or HU to the center ofthe gradient, HM, is equivalent. Furthermore, use of either is valid forcomparison with Huang's model as long as the equilibrium concentrationsin the measured membrane or the model membrane are normalized toeach other. The equilibrium concentration was set to 1.0 in the computerprogram used to reproduce Huang's model and measures of HL werenormalized to this by using measures of HL and HU and calculating HL(norm) = 2HL/(HL + HU). Comparison of the normalized concentration,HL (norm), for the measured membrane with Huang's model requiredthat an analogous point that was equivalent to the measured location onthe hourglass-shaped membrane be located on the model. This wasaccomplished by considering that at any given time the concentration atany location on the hourglass membrane (Fig. 3 b) should be, to a firstapproximation, comparable to an analogous location of the model, (Fig.3) at a comparable proportional circumferential distance from either ofthe two respective poles.
Averages of measurements of the total pole-to-pole membrane fusionproduct length, S, and lumen diameters, L, and the locations on thehourglass-shaped membranes were HL and HU were measured (Fig. 3)indicated that the concentration at 0 = 600, 1 20°C, i.e., C ( +0.5, ATC), onHuang's model (Fig. 4, reference 8) would correspond to the locationswhere HL and Hu, respectively, were measured on the hourglass-shapedfusion product membrane. Plots from Huang's model of the relativeconcentration decreases at 0 = 600 on the originally labeled side and of therelative concentration increase at 0 = 1200 on the originally unlabeled sideare shown in Fig. 4 as a function of the number, A, of the time constants,Tc, (i.e., the product A * Tc after release. Values of t and values of Aassociated with the value of HL (norm) for each micrographed membranewere plotted with t on the ordinate and A on the abscissa so that the slopeof a regression line for all points would represent the average timeconstant, T,, for the relaxation process. A Marquardt-Levenberg least-square fit (using a reiterative process forcing a fit through the origin) wasobtained using the VAX RS/1 (Digital Equipment Corp., Marlboro,MA) software package. Since peak-to-peak noise on the measuredgradients was on the order of 10% of the full scale values, gradients wereanalyzed only if the corresponding value for A was >0.15 or <2.0 (Fig.4).
All gradients and measurements of the lumen diameter, L, and thepole-to-pole length, S, of each hourglass fusion product were made fromsequences of micrographs having 8 < t < 71 s after the initiation of thepulse train that induced fusion. Sequences contained 2 to 5 (mode = 4)micrographs of the same field of membranes that showed a progression inthe lateral diffusion of the label from the originally labled side to theoriginally unlabeled side of the fused membranes. The average radius, R,for the equivalent sphere of Huang's model was calculated from averagemeasurements of S, L, and the location of HL (Fig. 3). The lateraldiffusion coefficient was calculated from the equation D = R2/2T,. Toobtain measurements at 35-370C, the microscope stage was surroundedby a plastic tent into which warmed air was pumped and circulated. Thetemperature was monitored with a dial gauge.
RESULTS
Fluorescent discocytes and echinocytes were observed toconvert to spherical shapes during the interval in which thetrain of fusion-inducing pulses were applied to the mem-branes in the fusion chamber. Observation of the sameprocess in phase optics or brightfield optics revealed that
hemoglobin was often lost from the cytoplasmic compart-ment and gained in the background (Sowers, A. E.,manuscript accepted for publication). This is consistentwith other reports of electric field induced pores andincreases in permeability (see references 5, 6 for review).
Gradients and physical dimensions S and L from a totalof 70 membrane micrographs made over time intervals of8 < t < 71 s for 23-250C and from a total of 16 membranesover time intervals of 7 < t < 16 s for 35-370C were
analyzed. Fig. 5 shows that a distinct and significant lumenappeared before the first micrograph was made of eachhourglass fusion-product membranes. Thus, for mostfusion events, substantial progress was made in achievingthe final geometry in a time interval which is compara-tively short (i.e., <8 s), compared to the entire interval (upto 71 s) over which micrographs of the lateral diffusionprocess were made. The average pole-to-pole length, S, ofthe fusion product membranes was 13.4 ,um. The averagelumen diameter, L, was 5.6 ,tm. The average radius, R, ofthe single equivalent sphere was 5.06 Am. The values of Aand t associated with each membrane micrograph were
plotted and a reiterative straight-line fit through the originwere made for both the 23-250C (Fig. 6) and the 35-370C(not shown) data. The time constants, based on the slopethrough the origins were 33.3 and 15.8 s, respectively.
DISCUSSION
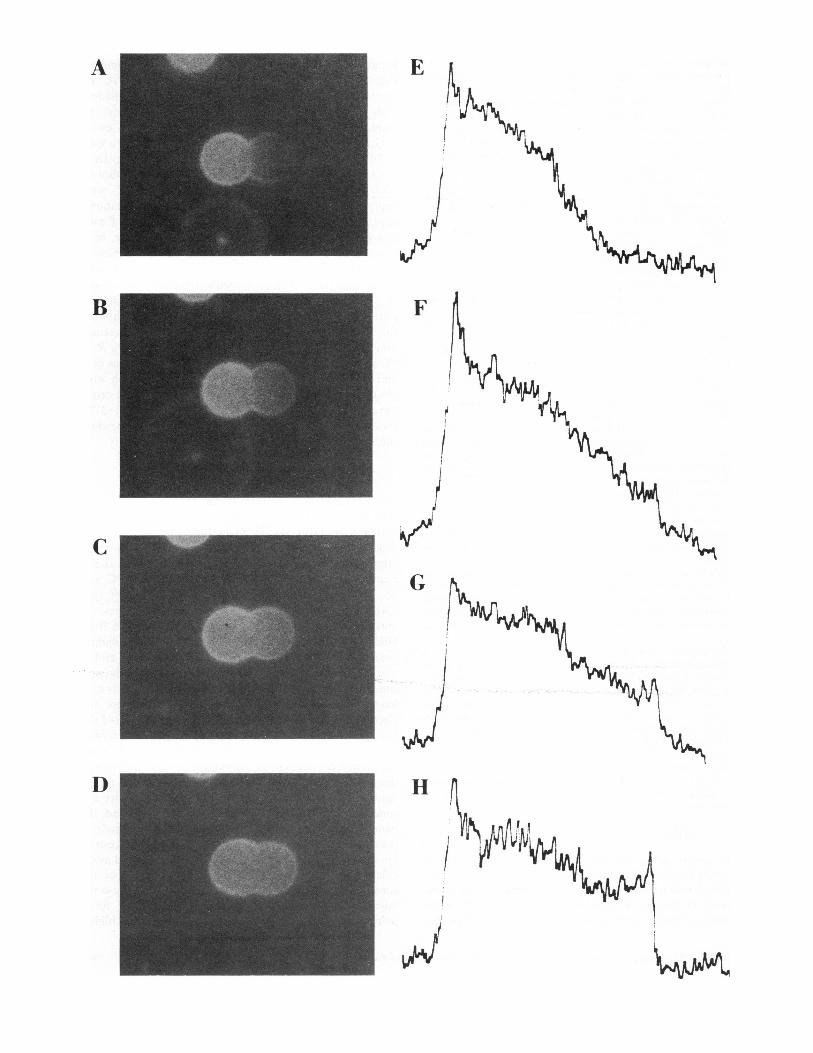
Our average value (Table I) for the lateral diffusioncoefficient for DiI in human erythrocyte membranesagrees very favorably in magnitude, and temperaturedependence with comparable average values from threeother laboratories (9, 10, 11). The lateral diffusion coeffi-cient, D = 3.8 and 8.1 x 10⁻⁹ cm2/s at 23-250C and35-370C, respectively in isotonic phosphate buffer (pH7.4). Densitometer scans frequently yielded values formeasured HL that were higher than those expected fromHuang's model (note in Fig. 2 e, f, and g, the slightlygreater height of the curves at the midpoint, and a
markedly greater height at the left and right edges as
compared to the neighborhoods of these points). This mayhave come about for two reasons. First, because thecircumferential groove geometry at the constriction of thehourglass fusion product causes a slightly greater intensityto be recorded at the center of the gradient for the samereason that the edges of the membrane are slightly brighterthan the center-the membrane is more parallel to theoptical axis at these points and thus a greater effective dyeconcentration is detected per unit solid angle. Second, theplane of the constriction in the hourglass fusion product,being perpendicular to the gradient, may also restrictlateral diffusion. Hence, comparatively more labeled mole-cules will pile up on the originally labeled side of theconstriction in the vicinity of the constriction because thelabeled molecules approach necessarily smaller areasbefore they reach the constriction. This results in higher
SOWERS Movement of a Fluorescent Lipid Label after Electric-Field-induced Fusion 521
A E
i
B F
It
c~~~~~~~~~~~~~~~~~~~~
G
D H
| | 1<8,~~~~~~~~~~~~~~~~~~~~~~~~~~~~~~
-S4

a.
Line
b '
C 0 0120020
Pole o P l
of Originally of OriginallParticle-Rich + 1 o5R / Particle-PoorHemisphere \ Hemisphere
FIGURE 3 Determining the location on Huang's model that corresponds to location on hourglass-shaped fusion product membranes wherefluorescence was measured. (a) Relative dimensions, in numbers, of an average fusion product were derived from actual measurements ofdimensions S and L. The location on photographically recorded images where optical density was measured was four-tenths of the distancetoward the pole from the plane of the lumen. (b) Angle A, was calculated from the relative dimensions of the average fusion product accordingto = arctan [(L/2)/0.4] = arctan (0.45/0.4) = 480. Circumferential distance, CM, from the pole to the location on the average fusionproduct where the optical density measurement was made is thus a proportion of the total circumferential distance, CT, from the pole to theplane of the lumen. The proportion is 900/(1800 480) = 0.68. Using the average fusion product relative dimensions it can be shown that if thearea of two unfused spheres with radius Ru is conserved on fusion then the radius Rf of each component sphere in the hourglass fusion productwill be Rf = 1.09 R,. (c) The location on Huang's model for diffusion on a spherical membrane that corresponds to the location where opticaldensity measurements were made will thus be at 0 = 0.68 (900 ) = 600. Also, X = R cos (600 ) = 0.5 R, and corresponds to the convention inHuang's model (Fig. 4, reference 8). It can be shown from the relative dimensions of the average fusion product that the radius of a spherehaving the area of two fused spheres, each with radius Rf, are related according to R = 1.29 Rf.
SOWERS Movement ofa Fluorescent Lipid Label after Electric-Field-induced Fusion
FIGURE 2 Sequence of micrographs (A-D) of fluorescence moving from an originally labeled membrane (left) to an originally unlabeledmembrane (right) after fusion and sequence of corresponding concentration gradients (E-H) associated with the micrographs. Concentrationgradients were generated from the linear transmission of light (in arbitrary units) through the positive image on film from a rectangular lightsource scanned as shown in Fig. 3 a. time, t (s), after fusion; (A, E), 9; (B, F), 18; (C, G), 30; (D, H), 48.
523

I RELATIVE CONCENTRATION IOriginally Origina
Labeled Side Unlabeled
2.0
allyd Side
7--1.01.9 _
1.81-
1.7 1-
1.61-
1.51
1.41-
1.3 -
1.2 1-
1.1
1.06.07 0.1 0.2 0.3 0.4 0.5 1.0 2.0 3.0
0.9
0.8 -
0.7
0.6
0.5
0.40.0 0.5 1.0 1.5 2.0 2.5
A
FIGURE 6 Plots of t against A for 23-250C data. Straight line is a
0.2reiterative fit through the origin (see Methods). Solid line corresponds toa time constant T = 33.3 s.
0.1
I I I a I9 eA U.u
A
FIGURE 4 Plot of change in concentration at location x = 0.5 = (cos60"), on Huang's model (Fig. 4, reference 8) as a function of the numberA.
8.01-
7.0 F
6.0
5.0
4.01-
3.0
2.01-
1.01-
I I I Iu.u R
0 10 20 30 40 50 60 70
t(seconds)
FIGURE 5 Lumen diameter, L, as function of time, t, after fusion forsequences of micrographs of individual fusion product membranesselected to illustrate wide variability in rates of increases.
dye concentrations, which in turn lower the gradient andtherefore, also, the rate of lateral diffusion.The greatest source of error enters the data of this
overall method as scatter at the stages that include therecording of the fluorescence images on film and themeasurement of the corresponding gradients from thoseimages with the gel scanner. An anomalous drift some-times shows up in the background in the curves from thegel scanner, but it is not particularly apparent by visualinspection of the film sheets bearing the positive images.Inherent film grain and emulsion heterogeneity also con-tribute to the background noise. A few fusion events havebeen seen that lead first to irregularly shaped hourglassfusion products, which rapidly become normal in time butmay contribute some unsymmetrical lateral concentrationgradients to the data pool.Two important distinctions exist between the fusion
approach and the conventional photobleaching approach tomeasuring lateral diffusion coefficients. First, the conven-tional photobleaching study involves the examination offluorescence recovery inside a small spot area usuallymuch smaller than the membrane, whereas in the fusionapproach, the gradient extends over the entire length of the
TABLE ILATERAL DIFFUSION COEFFICIENTS FOR Dil IN
HUMAN ERYTHROCYTE MEMBRANES
Value (x 109)Reference
(23-25°C) (35-37°C)
cm2s3.8 8.1 This study3* 5* 91.7 2.1 108.4 21.0 1 1
*Discoid ghost membranes.
BIOPHYSICAL JOURNAL VOLUME 47 1985
-C(+0.5. ATC) ,
E
-i
I I I I I I
524

membrane. Second, the bleaching event takes place rapidlyand in a local area. The bleaching event is assumed tocause a significant change in the fluorescence of a largefraction of the labels without causing a change in themolecular structure of the labeled molecules which mayeither cause a change in mobility or effectively add a newspecies of diffusing molecule. The fusion approach does notdepend on bleaching but, rather, is aided by the absence ofit. This leaves only the question of whether the labeledmolecule is a good model for lateral mobility of theunlabeled molecules in the host membrane. Ideally, thelateral diffusion coefficient should be independent of themethod of measurement. Indeed, this appears to be thecase when comparing our results with previously publishedphotobleaching data.
Beyond the obviously greater simplicity of the instru-mentation, the fusion appraoch to measuring lateral diffu-sion has some potential advantages when compared withconventional photobleaching. First, the fusion approachcan more easily accommodate membrane systems in sus-pension-photobleaching usually depends on membranesimmobilized on a substratum. Second, membranes that areclose in size (e.g., mitochondrial inner membranes, plate-lets, vesicles, mycoplasmas, etc.) to the smallest photo-bleaching spot sizes available may be more easily studiedusing the fusion approach than by using the photobleach-ing approach if a labeled membrane and one or moreunlabeled membranes are fused together to make longerdiffusion gradients. Third, the fusion approach is poten-tially applicable to the measurement of the lateral diffu-sion of intramembrane particles from an intramembraneparticle-rich membrane to an intramembrane particle-poormembrane using freeze-fracture electron microscopy. Thelast approach would eliminate the need for any exogenousor foreign molecule to be introduced into the membraneunder study.The expert technical assistance of Ms. Veena Kapoor and Mr. Christo-pher 0. Conway is greatly appreciated.
Contribution No. 621 from the American Red Cross Laboratories.Supported in part by Biomedical Research Grant No. 5 SO RR05737.
Received for publication 20 April 1984 and in final form 29 October1984.
Note Added in Proof: Koppel, D. E. (1984, Biophys J. 46:837-840) hasdeveloped a method by which our estimate of the lateral diffusioncoefficient can be corrected so as to make an allowance for the doubletgeometry of our fusion products.
REFERENCES
1. Frye, L. D., and M. Edidin. 1970. The rapid intermixing of cellsurface antigens after formation of mouse-human heterokaryons.J. Cell. Sci. 7:319-335.
2. Edidin, M., and T. Wei. 1977. Diffusion rates of cell surface antigensof mouse-human heterokaryons. I. Analysis of the population. J.Cell. Biol. 75:475-482.
3. Fowler, V., and D. Branton. 1977. Lateral mobility of humanerythrocyte integral membrane proteins. Nature (Lond.). 286:23-26.
4. Schindler, M., D. E. Koppel, and M. P. Sheetz. 1980. Modulation ofmembrane protein lateral mobility of polyphosphates and poly-amines. Proc. Natl. Acad. Sci. USA. 77:1457-1461.
5. Zimmerman, U. 1982. Electric field-mediated fusion and relatedelectrical phenomena. Biochim. Biophys. Acta. 694:227-277.
6. Zimmerman, U., and J. Vienken. 1982. Electric field-induced cell-to-cell fusion. J. Membr. Biol. 67:165-182.
7. Sowers, A. E. 1984. The lateral diffusion of Dil from a labeledmembrane to an unlabeled membrane following electric fieldinduced fusion: A new quantitative technique. Biophys. J. 45(2, Pt.2):331a. (Abstr.)
8. Huang, H.-W. 1973. Mobility and diffusion in the plane of cellmembrane. J. Theor. Biol. 40:11-17.
9. Kapitza, H.-G., and E. Sackmann. 1980. Local measurement oflateral motion in erythrocyte membranes by photobleaching tech-nique. Biochim. Biophys. Acta. 595:56-64.
10. Thompson, N. L., and D. Axelrod. 1980. Reduced lateral mobility ofa fluorescent lipid probe in cholesterol-depleted erythrocyte mem-brane. Biochim. Biophys. Acta. 597:155-165.
11. Bloom, J. A., and W. W. Webb. 1983. Lipid diffusibility in the intacterythrocyte membrane. Biophys. J. 42:295-305.
SOWERS Movement ofa Fluorescent Lipid Label after Electric-Field-induced Fusion 525