Embed Size (px)
Citation preview

ENERGY IN FINLAND 2015
FOLLOW US – NEWS NOTIFICATIONS, SOCIAL MEDIA”
STATISTICS FINLAND− Produces statistics on a variety of areas in society− Promotes the use of statistical data− Supports decision-making based on facts− Creates preconditions for research GUIDANCE AND INFORMATION SERVICE+358 29 551 [email protected] www.stat.fi
“
ISSN 2242−9085 (pdf)ISBN 978−952−244−534−6 (pdf)ISSN 1457−0491 (print)ISBN 978−952−244−525−4 (print)Product number 3055
Communication and Information Services Statistics Finlandtel. +358 29 551 2220www.stat.fi
Publication orders: Edita Publishing Oytel. +358 20 450 05www.editapublishing.fi
Energy_in_Finland_2015.indd 1 2.6.2015 12:43:02

2 Finland in brief
Area
Situated in northern Europe with an area of 338,432 km2 of which 72% forest, 10% water, 8% cultivated land.
Population
5.5 million, with average density of 18 persons per square kilometre. More than two-thirds of the population reside in the southern third of the country.
Average temperatures in 2014
Town Latitude January July
Helsinki 60° –5.9°C 20.1°CSodankylä 67° –15.1°C 18.3°C
Economy
In 2014* GDP totalled € 204.0 bil., i.e. € 37,351/capita. In 2013* services were 70.4%, secondary production 26.8% and primary production 2.9% of the GDP.
Structure of industry, Value added gross in production in 2013*
bil. € %
Total industry 35.3 100Mining and quarrying 0.7 2Forest industry 3.9 11Chemical industry 4.8 14Metal industry 14.7 42 Basic metals and metal prod. 3.9 11 Electrical and electronics ind. 4.6 13 Other metal industry 6.3 18Other manufacturing ind. 5.4 15Energy supply 4.1 12Water supply and waste management 1.6 5
Municipalities with high electricity consumption 2013
Tornio
Oulu
Jämsä
Tampere
RaumaImatra
LappeenrantaKouvola
PorvooHelsinki
>500,000
>100,000
>30,000
<30,000
> 3 TWh> 2 TWh> 1.5 TWh
Arctic CirclePopulation
Kokkola
Vantaa
Espoo
Kemi
Turku
Pori
Joensuu
Productive forestland is the most valuable natural resource of Finland. The indigenous energy resources in the country are hydro power, wood and peat. Finland also has some rich deposits of metallic ores from which copper, zinc, and nickel are extracted.
Total energy consumption in 2014*
1,340 PJ (32.0 Mtoe)245.0 GJ/capita (5.9 toe/capita)
Electricity consumption in 2014*83.3 TWh 15,261 kWh/capita
Back to Content

3Contents
The data in this pocketbook are based on the Preliminary Energy Statistics 2014 figures.
Inquiries: Jonna Hakala +358 29 551 1000 [email protected] http://www.stat.fi/energia
Cover photograph: www.shutterstock.com/OliverSved Cover design: Irene Koumolou, Statistics Finland Layout: Hilkka Lehtonen, Statistics Finland Printed by: Edita Prima Oy, Helsinki 2015
© 2015 Statistics FinlandQuoting is encouraged provided Statistics Finland is acknowledged as the source.
Contents
Finland in brief . . . . . . . . . . . . . . . . . . . . . . . . . . . . . . . . . . . 2Total energy consumption . . . . . . . . . . . . . . . . . . . . . . . . . . 4Renewable energy sources . . . . . . . . . . . . . . . . . . . . . . . . . 8Electricity . . . . . . . . . . . . . . . . . . . . . . . . . . . . . . . . . . . . . . . 10Heating . . . . . . . . . . . . . . . . . . . . . . . . . . . . . . . . . . . . . . . . 15Industry . . . . . . . . . . . . . . . . . . . . . . . . . . . . . . . . . . . . . . . . 18Enterprises . . . . . . . . . . . . . . . . . . . . . . . . . . . . . . . . . . . . . 19Greenhouse gases . . . . . . . . . . . . . . . . . . . . . . . . . . . . . . . 20Imports and exports . . . . . . . . . . . . . . . . . . . . . . . . . . . . . . 22International energy statistics . . . . . . . . . . . . . . . . . . . . . . . 25Networks information . . . . . . . . . . . . . . . . . . . . . . . . . . . . . 35Net heat contents and conversion factors . . . . . . . . . . . . . . 36Notes and explanations . . . . . . . . . . . . . . . . . . . . . . . . . . . . 38

4 Total energy consumption
Total energy consumption by energy source 2014*
Oil 23%
Coal 10%
Natural gas 7%
Net imports of electricity5%Nuclear energy 18%
Hydro and wind power
4%
Others 3%
Wood fuels 25%
Peat 5%
Total energy consumption in 2014* was 1 340 PJ.
Total energy consumption by energy source 1970–2014*
PJ
0200
400
600
800
1 000
1 200
1 400
1 600
1970 1975 1980 1985 1990 1995 2000 2005 2014*
Net imports of electricityOthersPeatWood fuelsHydro and wind powerNuclear energyNatural gasCoalOil
Back to Content
5Total energy consumption
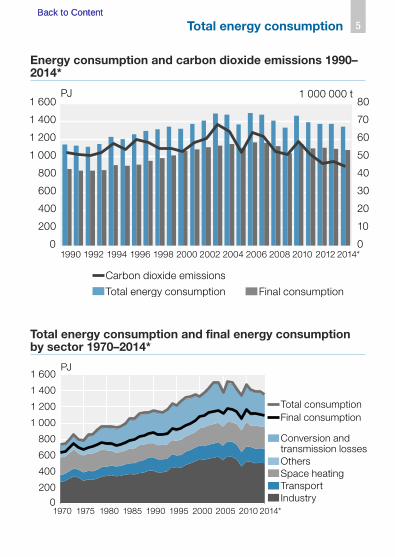
Energy consumption and carbon dioxide emissions 1990–2014*
PJ 1 000 000 t
Total energy consumption Final consumption
Carbon dioxide emissions
0
10
20
30
40
50
60
70
80
0
200
400
600
800
1 000
1 200
1 400
1 600
1990 1992 1994 1996 1998 2000 2002 2004 2006 2008 2010 2012 2014*
Total energy consumption and final energy consumption by sector 1970–2014*
PJ
Conversion andtransmission losses
0
200
400
600
800
1 000
1 200
1 400
1 600
1970 1975 1980 1985 1990 1995 2000 2005 2010 2014*
OthersSpace heatingTransportIndustry
Final consumptionTotal consumption
Back to ContentBack to Content
6 Total energy consumption
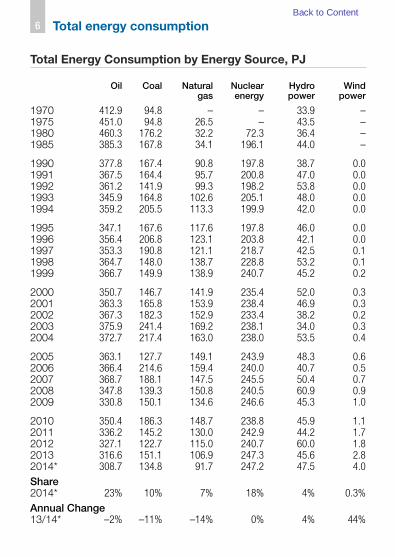
Total Energy Consumption by Energy Source, PJ
Oil Coal Natural gas
Nuclear energy
Hydro power
Wind power
Wood fuels
Peat Others Net imports of electricity
Total
1970 412.9 94.8 – – 33.9 – 170.1 0.9 6.0 1.9 720.5 19701975 451.0 94.8 26.5 – 43.5 – 130.7 1.7 7.2 14.4 769.8 19751980 460.3 176.2 32.2 72.3 36.4 – 142.1 17.1 6.0 4.4 946.9 19801985 385.3 167.8 34.1 196.1 44.0 – 151.3 41.1 9.1 17.0 1 045.8 1985
1990 377.8 167.4 90.8 197.8 38.7 0.0 167.2 53.3 9.8 38.7 1 141.4 19901991 367.5 164.4 95.7 200.8 47.0 0.0 158.6 56.0 8.9 25.9 1 124.7 19911992 361.2 141.9 99.3 198.2 53.8 0.0 161.2 58.7 9.6 29.6 1 113.5 19921993 345.9 164.8 102.6 205.1 48.0 0.0 180.5 64.5 8.7 27.1 1 147.3 19931994 359.2 205.5 113.3 199.9 42.0 0.0 201.8 73.7 8.9 21.9 1 226.2 1994
1995 347.1 167.6 117.6 197.8 46.0 0.0 207.5 79.4 9.8 30.3 1 203.2 19951996 356.4 206.8 123.1 203.8 42.1 0.0 212.8 87.5 9.9 13.2 1 255.6 19961997 353.3 190.8 121.1 218.7 42.5 0.1 237.2 88.0 12.1 27.6 1 291.1 19971998 364.7 148.0 138.7 228.8 53.2 0.1 247.6 80.7 13.8 33.5 1 309.2 19981999 366.7 149.9 138.9 240.7 45.2 0.2 272.8 71.8 14.6 40.0 1 340.7 1999
2000 350.7 146.7 141.9 235.4 52.0 0.3 267.9 62.5 15.4 42.8 1 315.6 20002001 363.3 165.8 153.9 238.4 46.9 0.3 261.5 86.9 17.2 35.9 1 369.8 20012002 367.3 182.3 152.9 233.4 38.2 0.2 282.7 91.6 17.9 42.9 1 409.5 20022003 375.9 241.4 169.2 238.1 34.0 0.3 287.8 101.2 20.0 17.5 1 485.4 20032004 372.7 217.4 163.0 238.0 53.5 0.4 302.0 89.7 21.7 17.5 1 475.9 2004
2005 363.1 127.7 149.1 243.9 48.3 0.6 280.9 69.1 23.5 61.3 1 367.6 20052006 366.4 214.6 159.4 240.0 40.7 0.5 315.1 93.8 23.1 41.0 1 494.8 20062007 368.7 188.1 147.5 245.5 50.4 0.7 302.3 102.5 25.5 45.2 1 476.2 20072008 347.8 139.3 150.8 240.5 60.9 0.9 308.1 81.6 30.4 46.0 1 406.3 20082009 330.8 150.1 134.6 246.6 45.3 1.0 272.3 72.0 32.6 43.5 1 328.7 2009
2010 350.4 186.3 148.7 238.8 45.9 1.1 323.9 94.5 35.9 37.8 1 463.3 20102011 336.2 145.2 130.0 242.9 44.2 1.7 318.6 84.9 36.7 49.9 1 390.4 20112012 327.1 122.7 115.0 240.7 60.0 1.8 332.3 65.0 45.2 62.8 1 372.4 20122013 316.6 151.1 106.9 247.3 45.6 2.8 338.7 56.9 50.6 56.6 1 373.2 20132014* 308.7 134.8 91.7 247.2 47.5 4.0 333.2 62.3 46.1 64.7 1 340.1 2014*Share Share2014* 23% 10% 7% 18% 4% 0.3% 25% 5% 3% 5% 100% 2014*Annual Change Annual Change13/14* –2% –11% –14% 0% 4% 44% –2% 9% –9% 14% –2% 13/14*
Back to Content
7Total energy consumption
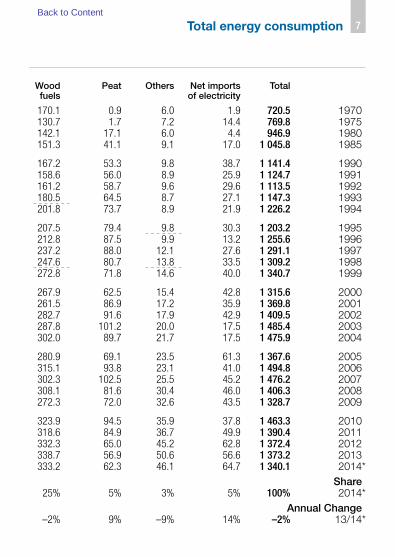
Total Energy Consumption by Energy Source, PJ
Oil Coal Natural gas
Nuclear energy
Hydro power
Wind power
Wood fuels
Peat Others Net imports of electricity
Total
1970 412.9 94.8 – – 33.9 – 170.1 0.9 6.0 1.9 720.5 19701975 451.0 94.8 26.5 – 43.5 – 130.7 1.7 7.2 14.4 769.8 19751980 460.3 176.2 32.2 72.3 36.4 – 142.1 17.1 6.0 4.4 946.9 19801985 385.3 167.8 34.1 196.1 44.0 – 151.3 41.1 9.1 17.0 1 045.8 1985
1990 377.8 167.4 90.8 197.8 38.7 0.0 167.2 53.3 9.8 38.7 1 141.4 19901991 367.5 164.4 95.7 200.8 47.0 0.0 158.6 56.0 8.9 25.9 1 124.7 19911992 361.2 141.9 99.3 198.2 53.8 0.0 161.2 58.7 9.6 29.6 1 113.5 19921993 345.9 164.8 102.6 205.1 48.0 0.0 180.5 64.5 8.7 27.1 1 147.3 19931994 359.2 205.5 113.3 199.9 42.0 0.0 201.8 73.7 8.9 21.9 1 226.2 1994
1995 347.1 167.6 117.6 197.8 46.0 0.0 207.5 79.4 9.8 30.3 1 203.2 19951996 356.4 206.8 123.1 203.8 42.1 0.0 212.8 87.5 9.9 13.2 1 255.6 19961997 353.3 190.8 121.1 218.7 42.5 0.1 237.2 88.0 12.1 27.6 1 291.1 19971998 364.7 148.0 138.7 228.8 53.2 0.1 247.6 80.7 13.8 33.5 1 309.2 19981999 366.7 149.9 138.9 240.7 45.2 0.2 272.8 71.8 14.6 40.0 1 340.7 1999
2000 350.7 146.7 141.9 235.4 52.0 0.3 267.9 62.5 15.4 42.8 1 315.6 20002001 363.3 165.8 153.9 238.4 46.9 0.3 261.5 86.9 17.2 35.9 1 369.8 20012002 367.3 182.3 152.9 233.4 38.2 0.2 282.7 91.6 17.9 42.9 1 409.5 20022003 375.9 241.4 169.2 238.1 34.0 0.3 287.8 101.2 20.0 17.5 1 485.4 20032004 372.7 217.4 163.0 238.0 53.5 0.4 302.0 89.7 21.7 17.5 1 475.9 2004
2005 363.1 127.7 149.1 243.9 48.3 0.6 280.9 69.1 23.5 61.3 1 367.6 20052006 366.4 214.6 159.4 240.0 40.7 0.5 315.1 93.8 23.1 41.0 1 494.8 20062007 368.7 188.1 147.5 245.5 50.4 0.7 302.3 102.5 25.5 45.2 1 476.2 20072008 347.8 139.3 150.8 240.5 60.9 0.9 308.1 81.6 30.4 46.0 1 406.3 20082009 330.8 150.1 134.6 246.6 45.3 1.0 272.3 72.0 32.6 43.5 1 328.7 2009
2010 350.4 186.3 148.7 238.8 45.9 1.1 323.9 94.5 35.9 37.8 1 463.3 20102011 336.2 145.2 130.0 242.9 44.2 1.7 318.6 84.9 36.7 49.9 1 390.4 20112012 327.1 122.7 115.0 240.7 60.0 1.8 332.3 65.0 45.2 62.8 1 372.4 20122013 316.6 151.1 106.9 247.3 45.6 2.8 338.7 56.9 50.6 56.6 1 373.2 20132014* 308.7 134.8 91.7 247.2 47.5 4.0 333.2 62.3 46.1 64.7 1 340.1 2014*Share Share2014* 23% 10% 7% 18% 4% 0.3% 25% 5% 3% 5% 100% 2014*Annual Change Annual Change13/14* –2% –11% –14% 0% 4% 44% –2% 9% –9% 14% –2% 13/14*
Back to Content
8 Renewable energy sources
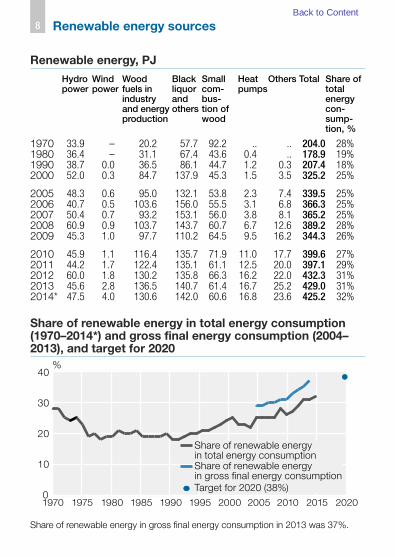
Renewable energy, PJ
Hydro power
Wind power
Wood fuels in industry and energy production
Black liquor and others
Small com- bus-tion of wood
Heat pumps
Others Total Share of total energy con-sump- tion, %
1970 33.9 – 20.2 57.7 92.2 .. .. 204.0 28%1980 36.4 – 31.1 67.4 43.6 0.4 .. 178.9 19%1990 38.7 0.0 36.5 86.1 44.7 1.2 0.3 207.4 18%2000 52.0 0.3 84.7 137.9 45.3 1.5 3.5 325.2 25%
2005 48.3 0.6 95.0 132.1 53.8 2.3 7.4 339.5 25%2006 40.7 0.5 103.6 156.0 55.5 3.1 6.8 366.3 25%2007 50.4 0.7 93.2 153.1 56.0 3.8 8.1 365.2 25%2008 60.9 0.9 103.7 143.7 60.7 6.7 12.6 389.2 28%2009 45.3 1.0 97.7 110.2 64.5 9.5 16.2 344.3 26%
2010 45.9 1.1 116.4 135.7 71.9 11.0 17.7 399.6 27%2011 44.2 1.7 122.4 135.1 61.1 12.5 20.0 397.1 29%2012 60.0 1.8 130.2 135.8 66.3 16.2 22.0 432.3 31%2013 45.6 2.8 136.5 140.7 61.4 16.7 25.2 429.0 31%2014* 47.5 4.0 130.6 142.0 60.6 16.8 23.6 425.2 32%
Share of renewable energy in total energy consumption (1970–2014*) and gross final energy consumption (2004–2013), and target for 2020
20202015201020052000199519901985198019751970
%
Share of renewable energy in total energy consumptionShare of renewable energy in gross final energy consumptionTarget for 2020 (38%)
0
10
20
30
40
Share of renewable energy in gross final energy consumption in 2013 was 37%.
Back to Content
9Renewable energy sources
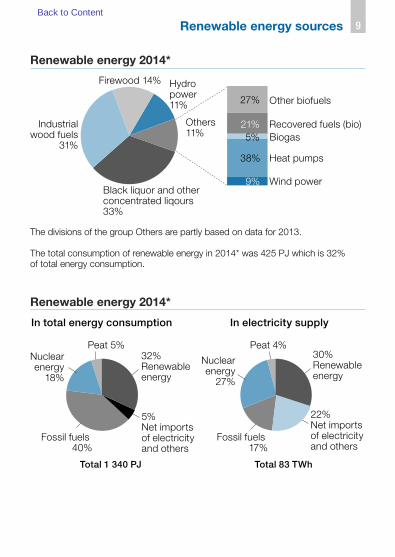
Renewable energy 2014*
Other biofuels
Recovered fuels (bio)Biogas
Heat pumps
Wind power9%
38%
5%21%
27%
Black liquor and other concentrated liqours33%
Others11%
Hydro power11%
Firewood 14%
Industrialwood fuels
31%
The divisions of the group Others are partly based on data for 2013. The total consumption of renewable energy in 2014* was 425 PJ which is 32% of total energy consumption.
Renewable energy 2014*
5%Net imports of electricityand others
Fossil fuels 40%
Nuclearenergy
18%
Peat 5%32%Renewableenergy
22%Net imports of electricityand others
Fossil fuels 17%
Nuclearenergy
27%
Peat 4%30%Renewableenergy
In total energy consumption In electricity supply
Total 1 340 PJ Total 83 TWh
Back to Content
10 Electricity
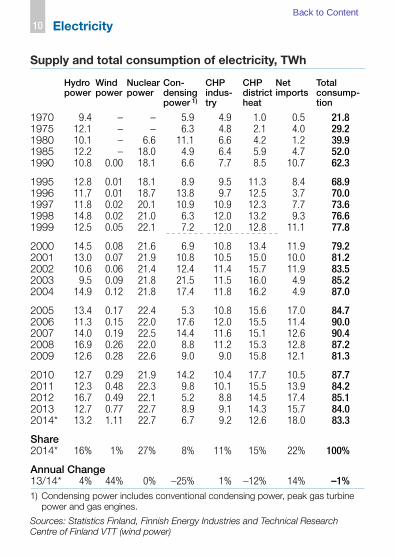
Supply and total consumption of electricity, TWh
Hydro power
Wind power
Nuclear power
Con- densing power 1)
CHP indus-try
CHP district heat
Net imports
Total consump-tion
1970 9.4 – – 5.9 4.9 1.0 0.5 21.81975 12.1 – – 6.3 4.8 2.1 4.0 29.21980 10.1 – 6.6 11.1 6.6 4.2 1.2 39.91985 12.2 – 18.0 4.9 6.4 5.9 4.7 52.01990 10.8 0.00 18.1 6.6 7.7 8.5 10.7 62.3
1995 12.8 0.01 18.1 8.9 9.5 11.3 8.4 68.91996 11.7 0.01 18.7 13.8 9.7 12.5 3.7 70.01997 11.8 0.02 20.1 10.9 10.9 12.3 7.7 73.61998 14.8 0.02 21.0 6.3 12.0 13.2 9.3 76.61999 12.5 0.05 22.1 7.2 12.0 12.8 11.1 77.8
2000 14.5 0.08 21.6 6.9 10.8 13.4 11.9 79.22001 13.0 0.07 21.9 10.8 10.5 15.0 10.0 81.22002 10.6 0.06 21.4 12.4 11.4 15.7 11.9 83.52003 9.5 0.09 21.8 21.5 11.5 16.0 4.9 85.22004 14.9 0.12 21.8 17.4 11.8 16.2 4.9 87.0
2005 13.4 0.17 22.4 5.3 10.8 15.6 17.0 84.72006 11.3 0.15 22.0 17.6 12.0 15.5 11.4 90.02007 14.0 0.19 22.5 14.4 11.6 15.1 12.6 90.42008 16.9 0.26 22.0 8.8 11.2 15.3 12.8 87.22009 12.6 0.28 22.6 9.0 9.0 15.8 12.1 81.3
2010 12.7 0.29 21.9 14.2 10.4 17.7 10.5 87.72011 12.3 0.48 22.3 9.8 10.1 15.5 13.9 84.22012 16.7 0.49 22.1 5.2 8.8 14.5 17.4 85.12013 12.7 0.77 22.7 8.9 9.1 14.3 15.7 84.02014* 13.2 1.11 22.7 6.7 9.2 12.6 18.0 83.3
Share2014* 16% 1% 27% 8% 11% 15% 22% 100%
Annual Change13/14* 4% 44% 0% –25% 1% –12% 14% –1%1) Condensing power includes conventional condensing power, peak gas turbine
power and gas engines.
Sources: Statistics Finland, Finnish Energy Industries and Technical Research Centre of Finland VTT (wind power)
Back to Content
11Electricity
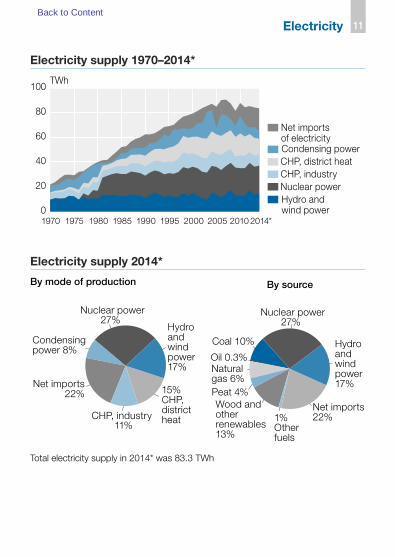
Electricity supply 1970–2014*
2014*2010200520001995199019851980197519700
20
40
60
80
100TWh
Net imports of electricityCondensing powerCHP, district heatCHP, industryNuclear powerHydro and wind power
Electricity supply 2014*
By source
Nuclear power27%
By mode of production
Hydro andwind power 17%
Nuclear power27%
Condensingpower 8%
Net imports22%
CHP, industry11%
15%CHP, district heat
Coal 10%
Oil 0.3%Natural gas 6%Peat 4%Wood and otherrenewables13%
1%Otherfuels
Net imports 22%
Hydroandwind power 17%
Total electricity supply in 2014* was 83.3 TWh
Back to Content
12 Electricity
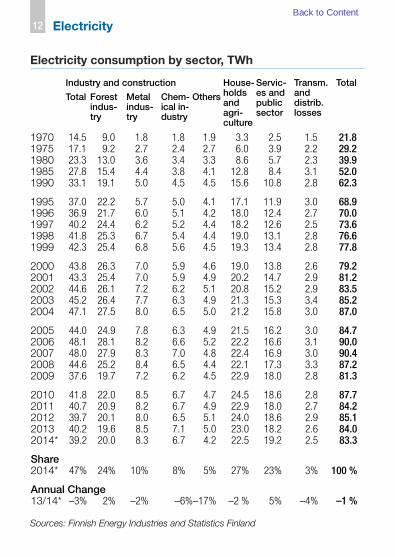
Electricity consumption by sector, TWh
Industry and construction House-holds and agri- culture
Servic-es andpublic sector
Transm. and distrib. losses
Total
Total Forest indus-try
Metal indus-try
Chem-ical in-dustry
Others
1970 14.5 9.0 1.8 1.8 1.9 3.3 2.5 1.5 21.81975 17.1 9.2 2.7 2.4 2.7 6.0 3.9 2.2 29.21980 23.3 13.0 3.6 3.4 3.3 8.6 5.7 2.3 39.91985 27.8 15.4 4.4 3.8 4.1 12.8 8.4 3.1 52.01990 33.1 19.1 5.0 4.5 4.5 15.6 10.8 2.8 62.3
1995 37.0 22.2 5.7 5.0 4.1 17.1 11.9 3.0 68.91996 36.9 21.7 6.0 5.1 4.2 18.0 12.4 2.7 70.01997 40.2 24.4 6.2 5.2 4.4 18.2 12.6 2.5 73.61998 41.8 25.3 6.7 5.4 4.4 19.0 13.1 2.8 76.61999 42.3 25.4 6.8 5.6 4.5 19.3 13.4 2.8 77.8
2000 43.8 26.3 7.0 5.9 4.6 19.0 13.8 2.6 79.22001 43.3 25.4 7.0 5.9 4.9 20.2 14.7 2.9 81.22002 44.6 26.1 7.2 6.2 5.1 20.8 15.2 2.9 83.52003 45.2 26.4 7.7 6.3 4.9 21.3 15.3 3.4 85.22004 47.1 27.5 8.0 6.5 5.0 21.2 15.8 3.0 87.0
2005 44.0 24.9 7.8 6.3 4.9 21.5 16.2 3.0 84.72006 48.1 28.1 8.2 6.6 5.2 22.2 16.6 3.1 90.02007 48.0 27.9 8.3 7.0 4.8 22.4 16.9 3.0 90.42008 44.6 25.2 8.4 6.5 4.4 22.1 17.3 3.3 87.22009 37.6 19.7 7.2 6.2 4.5 22.9 18.0 2.8 81.3
2010 41.8 22.0 8.5 6.7 4.7 24.5 18.6 2.8 87.72011 40.7 20.9 8.2 6.7 4.9 22.9 18.0 2.7 84.22012 39.7 20.1 8.0 6.5 5.1 24.0 18.6 2.9 85.12013 40.2 19.6 8.5 7.1 5.0 23.0 18.2 2.6 84.02014* 39.2 20.0 8.3 6.7 4.2 22.5 19.2 2.5 83.3
Share2014* 47% 24% 10% 8% 5% 27% 23% 3% 100 %
Annual Change13/14* –3% 2% –2% –6%–17% –2 % 5% –4% –1 %
Sources: Finnish Energy Industries and Statistics Finland
Back to Content

13Electricity
Electricity consumption by sector 2014*
Forest industry
Metal industry
Chemical industry
Other industries
51%
21%
17%
11%
Services and public sector 23%
Householdsand agriculture27%
Industry and construction 47%
Losses 3%
Electricity consumption by sector 1970–2014*
2014*201020052000199519901985198019751970
Transmission and distribution lossesServices and public sectorHouseholds and agricultureOther industries and constructionChemical industryMetal industryForest industry0
20
40
60
80
100TWh
Back to Content

14 Electricity
Energy sources in electricity generation, PJ
Hydro power
Nuclear energy
Hard coal
Oil Natural gas
Peat Other fuels
Net imports of electr.
Total CO2 emis-sions (Mt)
1970 33.9 – 41.8 32.1 – .. 17.9 1.9 127.6 .. 1980 36.4 72.3 102.7 26.8 12.6 .. 29.2 4.4 284.4 141990 38.7 197.8 61.3 9.7 24.8 17.2 29.1 38.7 417.3 112000 52.3 235.4 55.4 3.3 43.2 21.5 50.3 42.8 504.2 12
2005 48.9 243.9 37.6 3.2 47.1 25.4 60.8 61.3 528.2 112006 41.3 240.0 119.8 3.3 58.3 43.0 68.8 41.0 615.4 212007 51.0 245.5 97.1 3.0 45.2 46.3 62.4 45.2 595.8 192008 61.8 240.5 54.1 3.8 47.4 31.5 66.5 46.0 551.7 132009 46.3 246.6 74.3 3.3 40.9 24.5 50.9 43.5 530.2 13
2010 46.9 238.8 103.2 2.8 46.9 38.5 66.1 37.8 581.0 182011 46.0 243.0 72.7 2.3 41.7 33.9 58.3 49.9 547.9 132012 61.8 240.7 41.8 2.2 27.8 19.2 64.4 62.8 520.7 92013 48.4 247.3 72.4 1.7 27.9 17.5 69.8 56.6 541.6 112014* 51.5 247.1 56.6 1.5 22.5 18.0 63.0 64.7 524.9 9Wind power is included in hydro power.
Sources: Statistics Finland, Finnish Energy Industries and Technical Research Centre of Finland VTT (wind power)
Imports and exports of electricity 1990–2014*
2014*20102005200019951990
ExportImport Net imports
TWh
0
5
10
15
20
25
–5
–10
Source: Finnish Energy Industries
Back to Content

15Heating
Production and consumption of district heat, TWh
Net production of district heat
Net-work and meas-uring losses
Consumption of district heat
Heat only plants
CHP plants
Total Residen-tial build-ings
Industrial buildings
Other consum-ers
Total
1970 2.0 2.8 4.8 0.3 .. 0.6 .. 4.51975 3.3 5.0 8.2 0.6 4.7 0.9 2.0 7.71980 5.2 9.4 14.6 1.3 7.8 1.4 4.1 13.31985 10.7 13.1 23.8 2.2 12.6 2.1 7.0 21.7
1990 7.0 17.1 24.1 1.9 12.5 2.0 7.7 22.31991 7.2 18.3 25.5 2.0 13.0 2.1 8.4 23.51992 7.2 18.4 25.6 2.0 13.1 2.1 8.4 23.61993 7.4 19.3 26.7 2.0 13.9 2.3 8.5 24.61994 7.2 20.5 27.6 2.3 14.0 2.4 8.9 25.3
1995 7.2 20.6 27.8 2.4 14.3 2.7 8.4 25.41996 8.0 22.1 30.0 2.5 15.3 2.9 9.4 27.61997 6.8 22.9 29.7 2.6 15.1 2.9 9.1 27.11998 7.9 23.4 31.3 2.7 15.6 3.0 9.9 28.51999 8.2 22.1 30.4 2.6 15.4 3.0 9.5 27.8
2000 7.5 21.7 29.2 2.9 14.9 2.6 8.8 26.32001 7.3 24.7 32.0 2.8 16.2 2.9 10.1 29.22002 8.2 25.3 33.5 3.5 16.6 3.0 10.4 30.02003 8.5 26.5 35.0 3.8 17.6 3.0 10.6 31.22004 8.1 26.1 34.2 3.9 17.0 2.9 10.3 30.3
2005 8.5 25.1 33.5 3.8 16.6 3.0 10.2 29.82006 8.9 25.7 34.7 4.0 17.1 3.1 10.5 30.72007 9.4 25.1 34.5 3.7 17.3 3.1 10.4 30.82008 9.8 25.1 34.9 4.0 17.2 3.0 10.6 30.92009 10.8 26.5 37.3 3.7 18.3 3.3 12.0 33.6
2010 12.1 29.1 41.2 4.1 20.2 3.7 13.2 37.12011 10.1 25.9 36.0 3.6 17.6 3.3 11.5 32.42012 13.1 26.3 39.5 4.2 19.4 3.5 12.4 35.32013 10.7 26.1 36.8 3.6 18.3 3.2 11.7 33.22014* 8.9 25.6 34.5 3.2 .. .. .. 31.3
Sources: Statistics Finland, Finnish Energy Industries/District heating and since 1995 also Association of Finnish Local and Regional Authorities.
Back to Content

16 Heating
Production of district heat 1970–2014*
TWh
2014*2010200520001995199019851980197519700
10
20
30
40
50
Heat only plantsCombined heat and power (CHP) plants
Fuel consumption in production of district heat 2013–2014*
Others
Oil
Coal
Wood fuels
Peat
Natural gas
0 10 20 30 40 50 PJ
2014*2013
Sources: Statistics Finland, Finnish Energy Industries
Back to Content

17Heating
Consumption of energy for heating residential, commercial and public buildings 1970–2013
TJ
201320052000199519901985198019751970
Heating degree dayPeat and otherNatural gasHeat pumps etcElectricityOilWoodDistrict heating
01 000
2 000
3 000
4 000
5 000
6 000
7 000
50 000
100 000
150 000
200 000
250 000
300 000
350 000
0
ºC vrk
Energy consumption in households 2013
Space and water heating 82%
Other electrical equipment 9%
Saunas 5%Lighting 3%Cooking 1%
Back to Content

18 Industry
Electricity consumption by branch of industry 1970–2013
2013200520001995199019851980197519700
10
20
30
40
50
OtherFood, beverages and tobaccoChemicalMetalWood and paper
TWh
Fuel consumption in industry 2013
Wood fuel51%
Oil 18%
13%Natural gas
11% Coal
3% Peat
4% Recovered fuels and reaction heat of industry
Total fuel consumption in industry in 2013 was 379 PJ.
Back to Content
19Enterprises
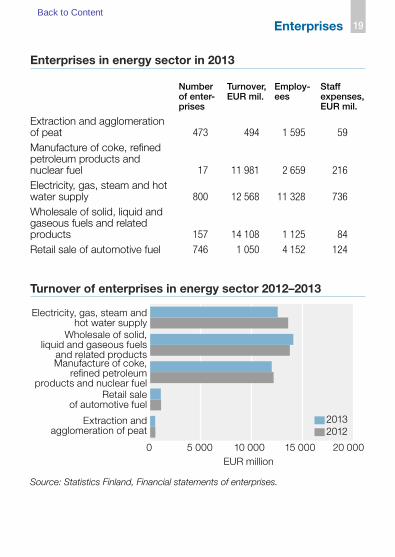
Enterprises in energy sector in 2013
Number of enter-prises
Turnover, EUR mil.
Employ-ees
Staff expenses, EUR mil.
Extraction and agglomeration of peat 473 494 1 595 59
Manufacture of coke, refined petroleum products and nuclear fuel 17 11 981 2 659 216
Electricity, gas, steam and hot water supply 800 12 568 11 328 736
Wholesale of solid, liquid and gaseous fuels and related products 157 14 108 1 125 84
Retail sale of automotive fuel 746 1 050 4 152 124
Turnover of enterprises in energy sector 2012–2013
0 5 000 10 000 15 000 20 000
Extraction and agglomeration of peat
Retail sale of automotive fuel
Manufacture of coke, refined petroleum
products and nuclear fuel
Wholesale of solid, liquid and gaseous fuels
and related products
Electricity, gas, steam and hot water supply
20132012
EUR million
Source: Statistics Finland, Financial statements of enterprises.
Back to Content
20 Greenhouse gases
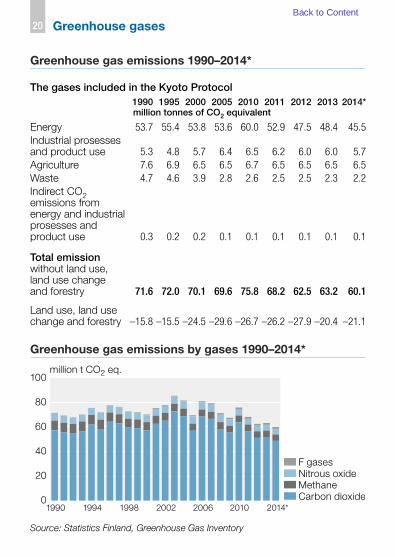
Greenhouse gas emissions 1990–2014*
The gases included in the Kyoto Protocol1990 1995 2000 2005 2010 2011 2012 2013 2014* million tonnes of CO2 equivalent
Energy 53.7 55.4 53.8 53.6 60.0 52.9 47.5 48.4 45.5Industrial prosesses and product use 5.3 4.8 5.7 6.4 6.5 6.2 6.0 6.0 5.7Agriculture 7.6 6.9 6.5 6.5 6.7 6.5 6.5 6.5 6.5Waste 4.7 4.6 3.9 2.8 2.6 2.5 2.5 2.3 2.2Indirect CO2 emissions from energy and industrial prosesses and product use 0.3 0.2 0.2 0.1 0.1 0.1 0.1 0.1 0.1
Total emission without land use, land use change and forestry 71.6 72.0 70.1 69.6 75.8 68.2 62.5 63.2 60.1
Land use, land use change and forestry –15.8 –15.5 –24.5 –29.6 –26.7 –26.2 –27.9 –20.4 –21.1
Greenhouse gas emissions by gases 1990–2014*
2014*2010200620021998199419900
20
40
60
80
100
F gasesNitrous oxideMethaneCarbon dioxide
million t CO2 eq.
Source: Statistics Finland, Greenhouse Gas Inventory
Back to Content
21Greenhouse gases
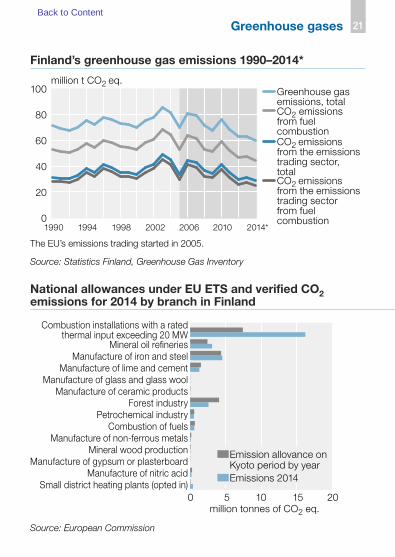
Finland’s greenhouse gas emissions 1990–2014*
0
20
40
60
80
100
CO2 emissions from the emissions trading sector from fuel combustion
CO2 emissions from the emissions trading sector,total
CO2 emissions from fuel combustion
Greenhouse gas emissions, total
2014*201020062002199819941990
million t CO2 eq.
The EU’s emissions trading started in 2005.
Source: Statistics Finland, Greenhouse Gas Inventory
National allowances under EU ETS and verified CO2 emissions for 2014 by branch in Finland
0 5 10 15 20Small district heating plants (opted in)
Manufacture of nitric acidManufacture of gypsum or plasterboard
Mineral wood productionManufacture of non-ferrous metals
Combustion of fuelsPetrochemical industry
Forest industryManufacture of ceramic products
Manufacture of glass and glass woolManufacture of lime and cement
Manufacture of iron and steelMineral oil refineries
Combustion installations with a rated thermal input exceeding 20 MW
Emissions 2014
Emission allovance on Kyoto period by year
million tonnes of CO2 eq.
Source: European Commission
Back to Content

22 Imports and exports
Value of energy imports 2014*
Other petroleum products31%
6% Natural gas
6% Electricity
4% Hard coal and coke1)1% Other fuels 1% Nuclear fuel
Crude oi l and NGL52%
1) includes coking coal
Total imports of energy products were 10 604 million euros in 2014*. That was 18.4% of total imports to Finland.
Value of energy exports 2014*
Middle distillates41%
36%Motor gasoline 19%
Other petroleum products
2% Electricity2% Other fuels0.2% Wood fuels0.1% Peat
Total exports of energy products were 5 231 million euros in 2014*. That was 9.4% of total exports from Finland.
Source: Finnish Customs/Foreign Trade Statistics
Back to Content
23Imports and exports
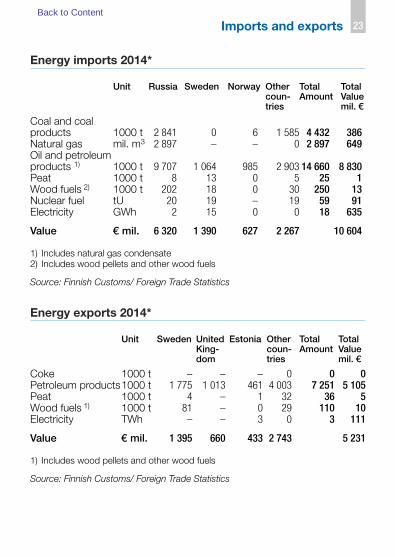
Energy imports 2014*
Unit Russia Sweden Norway Other coun-tries
Total Amount
TotalValue mil. €
Coal and coal products 1000 t 2 841 0 6 1 585 4 432 386Natural gas mil. m3 2 897 – – 0 2 897 649Oil and petroleum products 1) 1000 t 9 707 1 064 985 2 903 14 660 8 830Peat 1000 t 8 13 0 5 25 1Wood fuels 2) 1000 t 202 18 0 30 250 13Nuclear fuel tU 20 19 – 19 59 91Electricity GWh 2 15 0 0 18 635
Value € mil. 6 320 1 390 627 2 267 10 604
1) Includes natural gas condensate 2) Includes wood pellets and other wood fuels
Source: Finnish Customs/ Foreign Trade Statistics
Energy exports 2014*
Unit Sweden United King-dom
Estonia Other coun-tries
Total Amount
TotalValue mil. €
Coke 1000 t – – – 0 0 0Petroleum products1000 t 1 775 1 013 461 4 003 7 251 5 105Peat 1000 t 4 – 1 32 36 5Wood fuels 1) 1000 t 81 – 0 29 110 10Electricity TWh – – 3 0 3 111
Value € mil. 1 395 660 433 2 743 5 231
1) Includes wood pellets and other wood fuels
Source: Finnish Customs/ Foreign Trade Statistics
Back to Content
24 Imports and exports
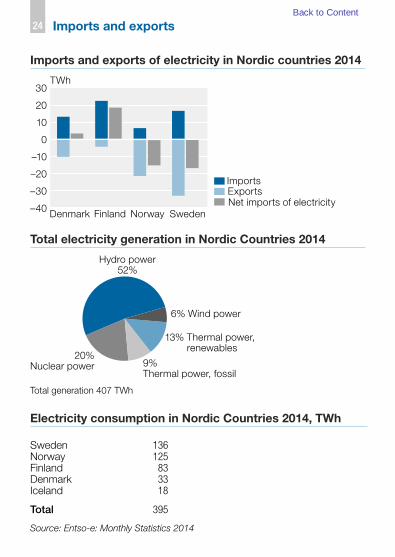
Imports and exports of electricity in Nordic countries 2014
TWh
SwedenNorwayFinlandDenmark–40
–30
–20
–10
0
10
20
30
ImportsExportsNet imports of electricity
Electricity consumption in Nordic Countries 2014, TWh
Sweden 136Norway 125Finland 83Denmark 33Iceland 18
Total 395
Source: Entso-e: Monthly Statistics 2014
Total electricity generation in Nordic Countries 2014
20%Nuclear power 9%
Thermal power, fossil
13% Thermal power, renewables
6% Wind power
Hydro power52%
Total generation 407 TWh
Back to Content

25International energy statistics
Electricity generation in Nordic Countries 2014
Iceland
Norway
Finland
Denmark
Sweden
Hydro powerNuclear powerThermal power, fossilThermal power, renewablesWind power
18 TWh
142 TWh
151 TWh
31 TWh
65 TWh
48%
43%9%
2%20%35%
25%17%
42%41%
8%7%2%
72%
28%
96%
2%2%
Source: Entso-e: Monthly Statistics 2014
Back to Content

26 International energy statistics
Electricity spot prices of the nordic power exchange NordPool by price area, €/MWh
Year Month Oslo Stockholm Helsinki Copenhagen Tallinn System
2014 1 33.18 32.84 40.23 31.05 40.98 33.602 30.14 30.14 34.16 30.08 34.79 30.233 26.44 26.53 31.21 26.79 31.57 26.744 23.52 27.17 31.53 28.73 31.64 25.525 19.28 35.11 36.62 35.29 36.85 26.306 18.95 31.47 35.43 32.73 35.81 25.197 26.77 29.76 36.81 31.06 44.17 28.528 29.77 34.54 38.38 34.53 39.10 32.079 33.16 36.46 38.33 37.65 42.97 34.91
10 27.57 31.27 36.72 32.19 40.22 30.6111 28.04 30.15 35.41 32.63 35.41 29.8712 31.17 31.47 37.13 32.99 37.42 31.67
Development of spot prices on Nord Pool
0
20
40
60
80
100
201420132012201120102009 200820072006200520042003200220012000
Price area FinlandSystem price
EUR/MWh
0
20
40
60
80
100
The system price is the price calculated on the basis of all bids and offers at the Power Exchange, in which possbile restrictions caused by the electricity transmission capacity are not taken into account.
Source: Nord Pool
Back to Content
27International energy statistics
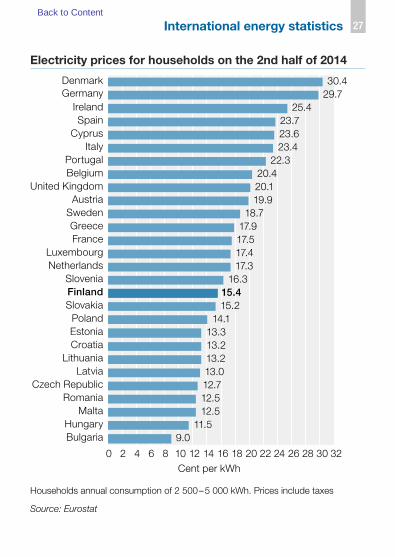
Electricity prices for households on the 2nd half of 2014
Cent per kWh
9.011.5
12.512.512.713.013.213.213.3
14.115.215.4
16.317.317.417.517.9
18.719.920.120.4
22.323.423.623.7
25.429.730.4
0 2 4 6 8 10 12 14 16 18 20 22 24 26 28 30 32
BulgariaHungary
MaltaRomania
Czech RepublicLatvia
LithuaniaCroatiaEstoniaPoland
SlovakiaFinlandSlovenia
NetherlandsLuxembourg
FranceGreece
SwedenAustria
United KingdomBelgiumPortugal
ItalyCyprus
SpainIreland
GermanyDenmark
Households annual consumption of 2 500 – 5 000 kWh. Prices include taxes
Source: Eurostat
Back to Content
28 International energy statistics
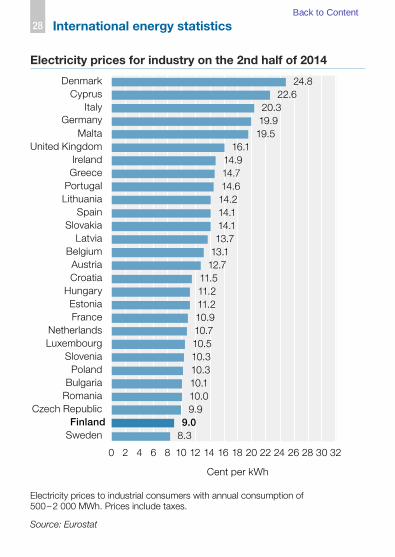
Electricity prices for industry on the 2nd half of 2014
8.39.0
9.910.010.110.310.310.510.710.911.211.211.5
12.713.113.714.114.114.214.614.714.9
16.119.519.920.3
22.624.8
0 2 4 6 8 10 12 14 16 18 20 22 24 26 28 30 32
SwedenFinland
Czech RepublicRomaniaBulgariaPoland
SloveniaLuxembourgNetherlands
FranceEstonia
HungaryCroatiaAustria
BelgiumLatvia
SlovakiaSpain
LithuaniaPortugalGreeceIreland
United KingdomMalta
GermanyItaly
CyprusDenmark
Cent per kWh
Electricity prices to industrial consumers with annual consumption of 500 – 2 000 MWh. Prices include taxes.
Source: Eurostat
Back to Content
29International energy statistics
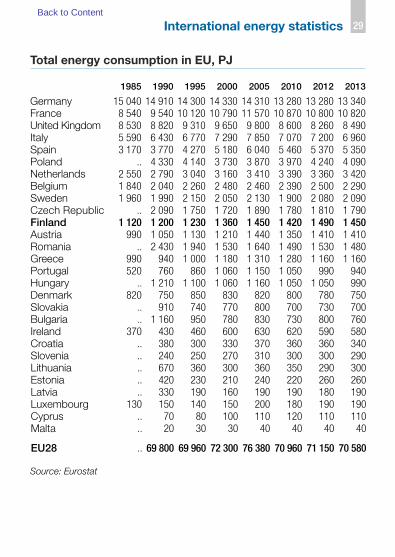
Total energy consumption in EU, PJ
1985 1990 1995 2000 2005 2010 2012 2013
Germany 15 040 14 910 14 300 14 330 14 310 13 280 13 280 13 340France 8 540 9 540 10 120 10 790 11 570 10 870 10 800 10 820United Kingdom 8 530 8 820 9 310 9 650 9 800 8 600 8 260 8 490Italy 5 590 6 430 6 770 7 290 7 850 7 070 7 200 6 960Spain 3 170 3 770 4 270 5 180 6 040 5 460 5 370 5 350Poland .. 4 330 4 140 3 730 3 870 3 970 4 240 4 090Netherlands 2 550 2 790 3 040 3 160 3 410 3 390 3 360 3 420Belgium 1 840 2 040 2 260 2 480 2 460 2 390 2 500 2 290Sweden 1 960 1 990 2 150 2 050 2 130 1 900 2 080 2 090Czech Republic .. 2 090 1 750 1 720 1 890 1 780 1 810 1 790Finland 1 120 1 200 1 230 1 360 1 450 1 420 1 490 1 450Austria 990 1 050 1 130 1 210 1 440 1 350 1 410 1 410Romania .. 2 430 1 940 1 530 1 640 1 490 1 530 1 480Greece 990 940 1 000 1 180 1 310 1 280 1 160 1 160Portugal 520 760 860 1 060 1 150 1 050 990 940Hungary .. 1 210 1 100 1 060 1 160 1 050 1 050 990Denmark 820 750 850 830 820 800 780 750Slovakia .. 910 740 770 800 700 730 700Bulgaria .. 1 160 950 780 830 730 800 760Ireland 370 430 460 600 630 620 590 580Croatia .. 380 300 330 370 360 360 340Slovenia .. 240 250 270 310 300 300 290Lithuania .. 670 360 300 360 350 290 300Estonia .. 420 230 210 240 220 260 260Latvia .. 330 190 160 190 190 180 190Luxembourg 130 150 140 150 200 180 190 190Cyprus .. 70 80 100 110 120 110 110Malta .. 20 30 30 40 40 40 40
EU28 .. 69 800 69 960 72 300 76 380 70 960 71 150 70 580
Source: Eurostat
Back to Content
30 International energy statistics
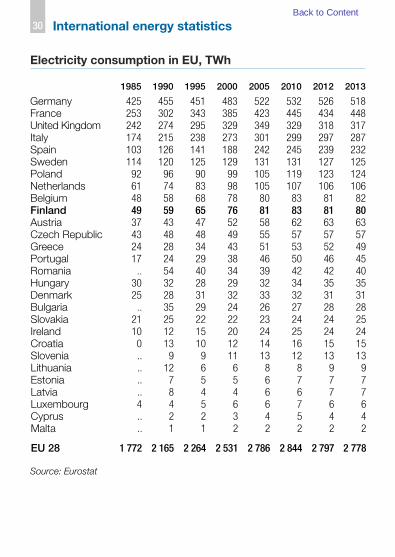
Electricity consumption in EU, TWh
1985 1990 1995 2000 2005 2010 2012 2013
Germany 425 455 451 483 522 532 526 518France 253 302 343 385 423 445 434 448United Kingdom 242 274 295 329 349 329 318 317Italy 174 215 238 273 301 299 297 287Spain 103 126 141 188 242 245 239 232Sweden 114 120 125 129 131 131 127 125Poland 92 96 90 99 105 119 123 124Netherlands 61 74 83 98 105 107 106 106Belgium 48 58 68 78 80 83 81 82Finland 49 59 65 76 81 83 81 80Austria 37 43 47 52 58 62 63 63Czech Republic 43 48 48 49 55 57 57 57Greece 24 28 34 43 51 53 52 49Portugal 17 24 29 38 46 50 46 45Romania .. 54 40 34 39 42 42 40Hungary 30 32 28 29 32 34 35 35Denmark 25 28 31 32 33 32 31 31Bulgaria .. 35 29 24 26 27 28 28Slovakia 21 25 22 22 23 24 24 25Ireland 10 12 15 20 24 25 24 24Croatia 0 13 10 12 14 16 15 15Slovenia .. 9 9 11 13 12 13 13Lithuania .. 12 6 6 8 8 9 9Estonia .. 7 5 5 6 7 7 7Latvia .. 8 4 4 6 6 7 7Luxembourg 4 4 5 6 6 7 6 6Cyprus .. 2 2 3 4 5 4 4Malta .. 1 1 2 2 2 2 2
EU 28 1 772 2 165 2 264 2 531 2 786 2 844 2 797 2 778
Source: Eurostat
Back to Content
31International energy statistics
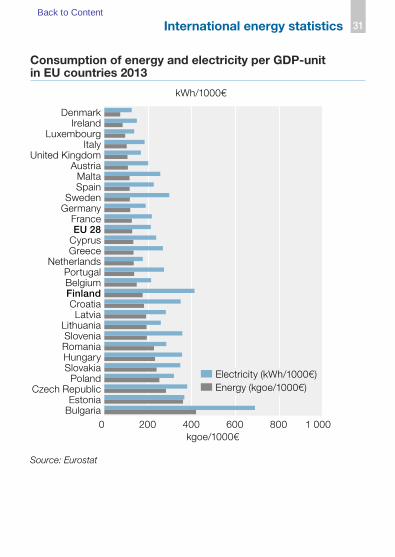
Consumption of energy and electricity per GDP-unit in EU countries 2013
0 200 400 600 800 1 000BulgariaEstonia
Czech RepublicPoland
SlovakiaHungaryRomaniaSlovenia
LithuaniaLatvia
CroatiaFinlandBelgiumPortugal
NetherlandsGreeceCyprusEU 28France
GermanySweden
SpainMalta
AustriaUnited Kingdom
ItalyLuxembourg
IrelandDenmark
Energy (kgoe/1000€)Electricity (kWh/1000€)
kgoe/1000€
kWh/1000€
Source: Eurostat
Back to Content

32 International energy statistics
Share of renewable energy in gross final energy consump-tion in 2013, and the target for 2020
0 10 20 30 40 50 60Malta
LuxembourgBelgiumCyprus
HungaryCzech Republic
NetherlandsSlovakia
United KingdomPolandIreland
BulgariaItaly
GermanyGreeceEU 28Spain
CroatiaFrance
LithuaniaRomaniaSloveniaEstonia
DenmarkPortugal
AustriaFinland
LatviaSweden
Target for 20202013
%
This indicator is calculated on the basis of data covered by Regulation (EC) No 1099/2008 on energy statistics. Reporting countries provide additional information on renewable source not covered by the Regulation. This indicator may be considered an estimate of the indicator described in Directive 2009/28/EC because statistical systems in some countries are not yet fully developed to meet all the requirements of this Directive.
Source: Eurostat
Back to Content
33International energy statistics
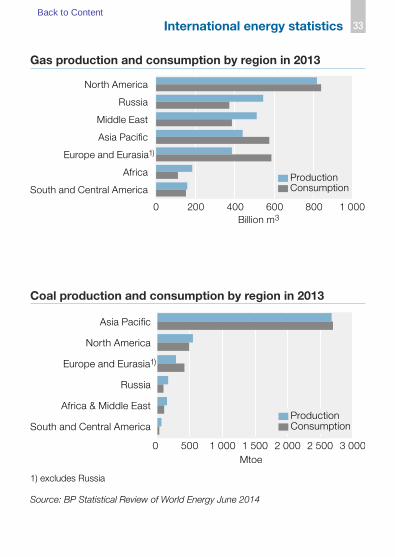
Gas production and consumption by region in 2013
Billion m30 200 400 600 800 1 000
South and Central America
Africa
Europe and Eurasia1)
Asia Pacific
Middle East
Russia
North America
ConsumptionProduction
Coal production and consumption by region in 2013
0 500 1 000 1 500 2 000 2 500 3 000
South and Central America
Africa & Middle East
Russia
Europe and Eurasia1)
North America
Asia Pacific
ConsumptionProduction
Mtoe
1) excludes Russia
Source: BP Statistical Review of World Energy June 2014
Back to Content
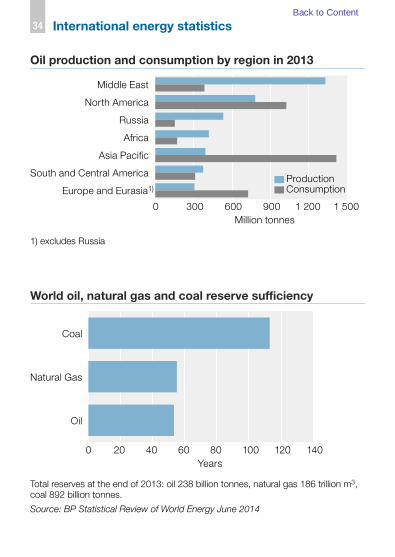
34 International energy statistics
Oil production and consumption by region in 2013
Million tonnes0 300 600 900 1 200 1 500
Europe and Eurasia1)
South and Central America
Asia Pacific
Africa
Russia
North America
Middle East
ConsumptionProduction
1) excludes Russia
World oil, natural gas and coal reserve sufficiency
0 20 40 60 80 100 120 140
Oil
Natural Gas
Coal
Years
Total reserves at the end of 2013: oil 238 billion tonnes, natural gas 186 trillion m3, coal 892 billion tonnes.
Source: BP Statistical Review of World Energy June 2014
Back to Content

35Networks information
Electricity network information
1990 2000 2012 2013 2014*
Transformer substations, numberHigh voltage substations 715 591 984 885 883Distribution substations 114 019 124 851 133 138 134 395 133 512
Lengths of low voltage lines (0.4 kV–1 kV), kmOverhead lines 162 076 158 576 148 769 145 268 141 971Cables (inc. sea cable) 45 705 63 327 89 235 92 843 97 924Cabling rate 22 % 29 % 37 % 39 % 41 %
Lengths of medium voltage lines (over 1 kV–70 kV), kmOverhead lines 122 329 121 754 121 191 119 807 117 927Cables (inc. sea cable) 10 586 12 116 17 005 20 406 23 161Cabling rate 8 % 9 % 12 % 15 % 16 %
Lengths of high voltage lines (110 kV–400 kV), km110 kV 14 000 15 050 15 754 16 017 16 136220 kV 2 471 2 510 2 568 2 331 2 225400 kV 3 164 3 926 4 586 5 083 5 191
Source: Energy Authority
Energy statistics by Statistics Finland
Energy table serviceThe Energy table service provides information on the energy industry as an extensive compilation of Excel tables and statistical graphs. The service is in Finnish, English or Swedish, and is updated annually. The Energy online service is available at http://pxweb2.stat.fi/Sahkoiset_julkaisut/energia2014/.
Energy in FinlandStatistical pocketbook on energy statistics.
Homepage of the Energy topic www.stat.fi/energy (www.tilastokeskus.fi/energia)The updated statistics, latest tables and figures on– consumption of hard coal– energy consumption in households– energy prices– energy supply and consumption– energy in manufacturing– production of electricity and heat
Back to Content

36 Net heat contents and conversion factors
Net heat contents and densities of energy sources
Fuels Unit Net heat content DensityGJ MWh t/m3
Crude oil t 41.8 11.6 0.86Heavy fuel oil t 40.4 11.2 0.99Light fuel oil t 43.0 11.9 0.84Diesel fuel t 43.2 12.0 0.84Kerosenes t 43.3 12.0 0.80Other kerosines t 43.1 12.0 0.81Naphtha t 44.3 12.3 0.70Motor gasolines t 41.9 11.6 0.75Aviation gasolines t 43.7 12.1 0.71LPG t 46.3 12.9 0.51Refinery gases t 50.0 13.9Hard coal t 25.0 6.9Coke t 29.3 8.1Natural gas 1 000 m3 (0°C) 36.0 10.0Blast furnace gas 1 000 m3 3.8 1.1Coke oven gas 1 000 m3 16.7 4.6Black liquor t (dry matter) 11.5 3.2Wood pellets t 15–18Bark t 5–11Sawdust t 6–10Forest residue chips t 6–11Whole tree chips t 7–11Chips loose m3 3.3 0.9Milled peat t 10.1 2.8 0.32Sod peat t 12.3 3.4 0.38
Back to Content
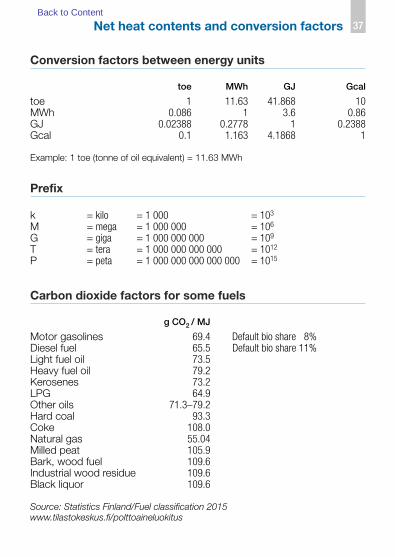
37Net heat contents and conversion factors
Conversion factors between energy units
toe MWh GJ Gcal
toe 1 11.63 41.868 10MWh 0.086 1 3.6 0.86GJ 0.02388 0.2778 1 0.2388Gcal 0.1 1.163 4.1868 1
Example: 1 toe (tonne of oil equivalent) = 11.63 MWh
Prefix
k = kilo = 1 000 = 103
M = mega = 1 000 000 = 106
G = giga = 1 000 000 000 = 109
T = tera = 1 000 000 000 000 = 1012
P = peta = 1 000 000 000 000 000 = 1015
Carbon dioxide factors for some fuels
g CO2 / MJ
Motor gasolines 69.4 Default bio share 8% Diesel fuel 65.5 Default bio share 11%Light fuel oil 73.5Heavy fuel oil 79.2Kerosenes 73.2LPG 64.9Other oils 71.3–79.2Hard coal 93.3Coke 108.0Natural gas 55.04Milled peat 105.9Bark, wood fuel 109.6Industrial wood residue 109.6Black liquor 109.6
Source: Statistics Finland/Fuel classification 2015 www.tilastokeskus.fi/polttoaineluokitus
Back to Content

38 Notes and explanations
Note
Hydro power, wind power and imported electricity have been made commensurate with fuels according to directly obtained electricity (at the efficiency ratio of 100 per cent) and nuclear power at the efficiency ratio of 33 per cent.
Calculation method for heating energy
Net heating energy for buildings was calculated by subtracting boiler losses from fuels according to the following default efficiencies:
Small combustion of wood 55%Peat 60%Coal 60%Heavy fuel oil 83%Light fuel oil 78%Natural gas 90%District heating 100%Electric heating 100%
Source: Technical Research Centre of Finland (VTT) and Tampere University of Technology
Back to Content

39Notes and explanations
Explanation of symbols
.. Data not available– Magnitude zero0 Magnitude less than half of unit employed* Preliminary
Break in the time series
Back to Content
ENERGY IN FINLAND 2015
FOLLOW US – NEWS NOTIFICATIONS, SOCIAL MEDIA”
STATISTICS FINLAND− Produces statistics on a variety of areas in society− Promotes the use of statistical data− Supports decision-making based on facts− Creates preconditions for research GUIDANCE AND INFORMATION SERVICE+358 29 551 [email protected] www.stat.fi
“
ISSN 2242−9085 (pdf)ISBN 978−952−244−534−6 (pdf)ISSN 1457−0491 (print)ISBN 978−952−244−525−4 (print)Product number 3055
Communication and Information Services Statistics Finlandtel. +358 29 551 2220www.stat.fi
Publication orders: Edita Publishing Oytel. +358 20 450 05www.editapublishing.fi
Energy_in_Finland_2015.indd 1 2.6.2015 12:43:02