Embed Size (px)
Citation preview

PHILOSOPHICAL MAGAZINE B, 1999, VOL. 79, NO. 5, 729±751
Foams out of stable equilibrium: cell elongation and sideswapping
F. Elias²³, C. Flament²³, J. A. Glazier§, F. Granerk ¶and Y. Jiang§²²
² Laboratoire des Milieux DeÂsordonneÂs et HeÂteÂrogeÁnes (case 78), Universite Paris6 and Unite Mixte de Recherche associeÂe au CNRS 7603, 4 place Jussieu,
75252 Paris Cedex 05, France³ Universite Paris 7, Denis Diderot, Unite de Formation et de Recherche de
Physique (case 70.08), 2 place Jussieu, 75051 Paris Cedex 05, France§Department of Physics, 316 Nieuwland, University of Notre-Dame,
Notre-Dame, Indiana 46556-5670, USAk Unite Mixte de Recherche associeÂe au CNRS 5588 et UniversiteÂ
Grenoble IÐJoseph Fourier, Laboratoire de SpectromeÂtrie Physique, BP 87,38402 Saint Martin d’HeÁres, France
[Received 5 October 1998 and accepted 8 December 1998]
AbstractThe evolution of a liquid foam usually mixes quasi-equilibrium topological
and geometrical features in an intricate way. We take advantage of specialproperties of ferro¯uid froths and of constrained area evolution simulations, todistinguish the e�ects of side swapping (T1 processes) from other rearrangementsin the froth. Cell elongation characterizes the froth and its deviation frommechanical equilibrium as robustly as the usually measured total wall length,that is surface energy.
§1. IntroductionThree-dimensional (3D) liquid foams, that is a small volume fraction of liquid
forming a continuous network and separating ¯uid-®lled cells (Kraynik 1988), havean intriguing characteristic. Two a priori unrelated quantities are correlated (Glazier1993): ®rstly the Gaussian curvature of a cell’s walls, related to its number of neigh-bours, that is its topology, and secondly the mean curvature of its walls, related to itsinternal pressure via Laplace’s law, which governs the dynamical evolution of itsvolume. These quantities are equivalent only for a sphere; the correlation means thatcells in a soap froth are nearly round, which is not true in arbitrary cellular patterns.How can we understand this correlation?
For simplicity, we shall consider only a liquid foam with ®xed cell number andvolumes (in a coarsening foam, we would consider only time scales much shorter thanthe characteristic time for cell volume variation). Such foam relaxes in a ®nite timetowards an equilibrated pattern, corresponding to a local minimum of surface
Philosophical Magazine B ISSN 0141±8637 print/ISSN 1463±6417 online Ñ 1999 Taylor & Francis Ltdhttp://www.tandf.co.uk/JNLS/phb.htm
http://www.taylorandfrancis.com/JNLS/phb.htm
¶ Author for correspondence: Email: [email protected].²² Present address: T-CNLS, MS B258, Los Alamos National Laboratory, New Mexico
87545, USA.
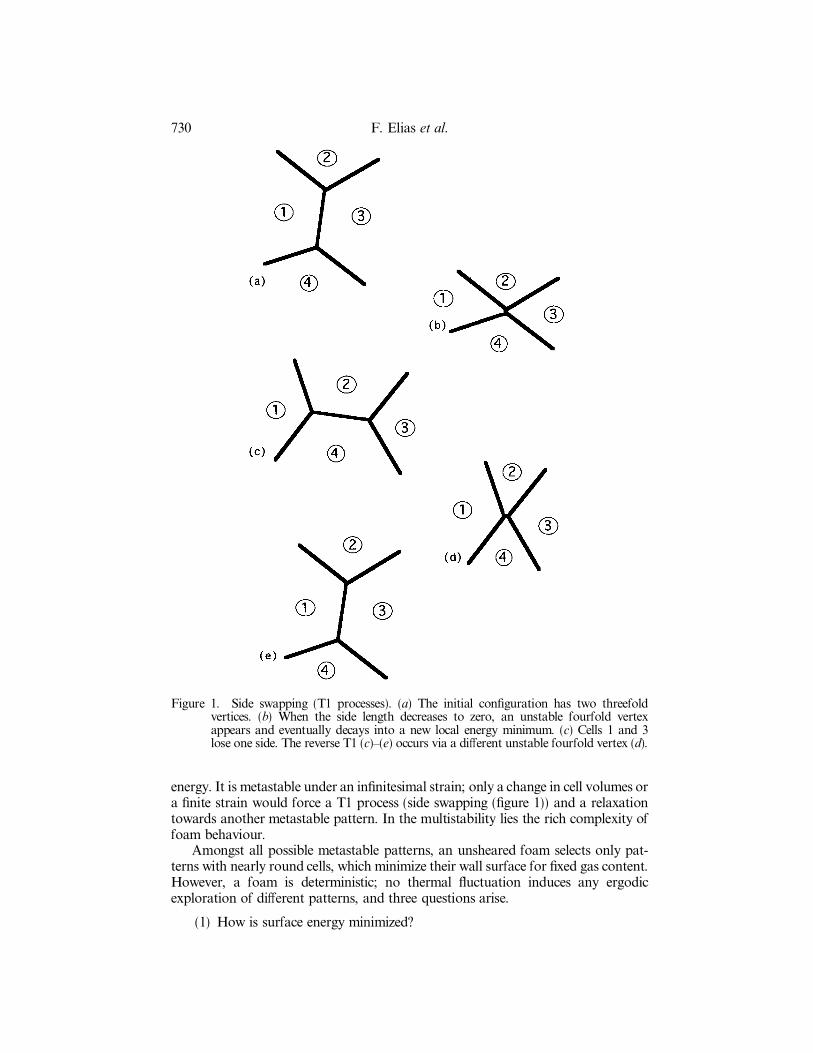
energy. It is metastable under an in®nitesimal strain; only a change in cell volumes ora ®nite strain would force a T1 process (side swapping (®gure 1)) and a relaxationtowards another metastable pattern. In the multistability lies the rich complexity offoam behaviour.
Amongst all possible metastable patterns, an unsheared foam selects only pat-terns with nearly round cells, which minimize their wall surface for ®xed gas content.However, a foam is deterministic; no thermal ¯uctuation induces any ergodicexploration of di�erent patterns, and three questions arise.
(1) How is surface energy minimized?
730 F. Elias et al.
Figure 1. Side swapping (T1 processes). (a) The initial con®guration has two threefoldvertices. (b) When the side length decreases to zero, an unstable fourfold vertexappears and eventually decays into a new local energy minimum. (c) Cells 1 and 3lose one side. The reverse T1 (c)±(e) occurs via a di�erent unstable fourfold vertex (d).

(2) Does this minimization ultimately reach the lowest energy level, for ®xed cellnumber and volumes, that is the global energy minimum (possibly degen-erate) corresponding to at least one truly stable pattern?
(3) If not, what is the di�erence between the energy of a selected pattern and thetrue global energy minimum?
The present study uses two-dimensional (2D) liquid froths, where the selectionproblem is the same as in three dimensions, but much easier to study in experiment,simulation and theory (Glazier 1989). In two dimensions, it is tedious but easy todetermine whether a pattern is in (metastable) equilibrium. For given cell areas,check whether all vertices are threefold and walls meet at 120ë; also check thatpressure di�erence across walls are transitive; that is, on any closed path, the cur-vatures of the walls we cross sum to zero, according to the Young±Laplace law.However, if we look at a picture of a froth, can we tell at once whether it is in aglobal energy minimum? Here, the answer is not easy. Conventional measurementsof a soap froth (boundary lengths, topological and area distributions, their correla-tions, and the second moments of these distributions) do not help. While cell elonga-tion has often been used to describe qualitatively the deviations from regularpatterns, nobody has precisely addressed the relation between cell elongation andfroth evolution.
In this paper, we provide an easy quantitative test, to answer questions (1)±(3)for any given picture of a 2D cellular pattern. We take advantage of special proper-ties of ferro¯uid froths and of constrained area evolution simulations to study thee�ects of individual T1s, both natural and arti®cial. We de®ne and then measure theelongation of cells; we claim that it marks the deviation from the global energyminimum.
§2. MethodsIn this section, we describe experiments with magnetic ¯uids and simulations
with the Potts model. We chose foams with conserved areas to distinguish coarseningfrom T1 events. These model systems enabled us to observe single T1s in detail andeven to force them.
2.1. Experiment2D ferro¯uid froths have been described in detail elsewhere (Elias et al. 1997).
Immiscible oil and water are placed between two horizontal Plexiglas plates.Magnetic colloidal particles are stably incorporated into the aqueous phase, sothat when an external magnetic ®eld H is applied perpendicular to the plates, mag-netic dipole±dipole repulsion tends to stretch the aqueous phase. This stretchingcompetes with the surface tension of the oil±water interface induced by van derWaals attraction, resulting in long-lasting 2D foams (®gure 2(2)). These foams con-sist of domains of oil separated by aqueous walls. After a period of equilibration, thepattern reaches a static equilibrium in which cells neither grow nor shrink at the ®xedcontrol parameter H. The equilibrium thickness of the ferro¯uid walls decreases withincreasing H (Elias et al. 1998b). The volume of ferro¯uid is ®xed; the total equili-brium length of the boundaries, and consequently the equilibrium number of cells inthe foam, increase with increasing H.
The foam nucleates with H of the order of 10kA m-1 - 120G. If H laterdecreases, some cells must disappear and wall breakage allows the foam to coarsen
Foams out of stable equilibrium 731

(®gure 2(3)). In the limit of zero external ®eld, the pattern turns into a single ferro-¯uid drop surrounded by oil.
On the other hand, in the absence of cell nucleation, if H increases, the patterndisequilibrates (Elias et al. 1998a)². Since the oil wets the Plexiglas better than thewater, a thin ®lm of oil actually connects the cells and makes a (slow) time evolutionpossible. Cells which have fewer than six sides grow, whereas cells which have morethan six sides shrink, and six-sided cells do not evolve. This growth law resemblesvon Neumann’s law for two dimensions coarsening soap froths, but with reverseddependence on topology, and without cell disappearance. Before they become toosmall, the seven-sided cells lose one side through a T1 and stop shrinking. The ®ve-sided cells grow and their neighbours stretch, as shown in ®gure 2(1).
732 F. Elias et al.
Figure 2. Images of a 10cm 10cm froth (ferro¯uid fraction u = 0.13) . The patternevolution is dominated by the external magnetic ®eld H perpendicular to theplane of the image. The foam was nucleated at H = 11.19kA m-1. Decreasing the®eld decreases the total wall length of the foam, analogous to increasing time insoap froths. (1) H = 11.19kA m-1; (2) H = 9.15kA m-1; (3) H = 7.50kA m-1; (4)H = 6.27kA m-1. See other examples in the paper by Elias et al. (1997).
² A rapid increase in H yields a dynamical elongation of cell walls, resulting in a transientundulation instability.
Ferro¯uid froths are ideal archetypes to study T1s for the following reasons.First, cell areas remain constant at ®xed H, as discussed above.Second, ferro¯uid foams are easy to observe. Walls are visible with high contrast.
Cells are large, typically 1 cm. Vertex movement is slow, so that T1s can be con-veniently observed on a scale of few seconds, but allow observation of many indi-vidual events within minutes. We turn to simulations when we need statistics onmany cells.
Third, in ferro¯uid froths, the external magnetic ®eld plays the role that timeplays in soap froth. This control parameter can be easily tuned, ramped, stabilized orreversed; the froth evolves accordingly (Elias et al. 1997). Thus, instead of simplywatching the time evolution of the froth, we can control it.
Fourth, instead of simply waiting for spontaneous T1s, we can arti®cially forcethem (Elias et al. 1997, 1998b). A piece of magnetic metal, say a needle, placed overthe experimental sample, channels the ®eld lines and locally increases the external®eld. Magnetic ¯uid drains and accumulates in this higher-®eld region. Placing aneedle near a vertex displaces the vertex towards the needle. Movements of up to acell size, that is a centimetre, are possible. Removing the needle relaxes the vertexposition and sometimes causes a T1 (see §4.2).
2.2. SimulationsSimulations of T1s in froth under shear using the extended large-Q Potts model
have been presented elsewhere (Jiang et al. 1998). The great advantage of the large-QPotts model is its simplicity (Glazier et al. 1990). The model is `realistic’ in that theposition and di�usion of the boundaries determine the dynamics, as they do in realfoams and concentrated emulsions. The large-Q Potts model partitions space intodomains of lattice sites. Each domain (cell) corresponds to a `spin’ value si while thedomain boundaries (cell walls) are links between di�erent spins. Thus unlike thesituation in magnetic materials, each spin value merely acts as a label for a particularcell. The surface energy resides on the boundaries only. Cells have geometric proper-ties as well as surface properties. Simulations using the large-Q Potts model on low-anisotropy lattices reproduce accurately the time evolution of 2D soap foams (Holmet al. 1991).
Since the present study focuses on shear-driven topological rearrangements, weprohibit foam coarsening by applying an area constraint on individual cells, that isdeviation from the target areas contributes to a bulk energy and is unfavourable.This constraint also eliminates cell disappearance (T2 processes). The total energy ofthe froth thus consists of a surface energy and an elastic bulk energy. We extendedthe Potts Hamiltonian HP to apply shear strain:
HP =neighbouring sites i,j
Jij ( 1 - dsi,sj ) +cell n
( an - An)2 +
site ig( yi, t) Dxi,
where Jij and si are the coupling strength and spin respectively; an and An are thearea of the nth cell and its corresponding area under zero applied strain respectively.The last term corresponds to applying shear, with g the strain ®eld and Dxi thedisplacement of the spin in the direction of the strain.
The evolution of the froth follows Monte Carlo dynamics. At each Monte Carlostep (MCS), the following procedure is performed N times, where N is the totalnumber of boundary lattice sites. A site is randomly chosen from the domain bound-ary sites (cell walls), and the spin at the site is reassigned to the spin value of one of
Foams out of stable equilibrium 733

its neighbours; the probability P of accepting the reassignment depends on theenergy change DHP caused by the spin ¯ip:
P =1 (DHP < 0) ,
exp -DHP
T(DHP > 0) .
The shear term biases P in the direction of increasing ( g < 0) or decreasing( g > 0) xi. Since in the Potts model the speed of cell wall migration is proportionalto P, this term e�ectively enforces a velocity v, that is applies a strain rate to thefoam. The strain is proportional to a time integral of v, and g is related to theamplitude of strain.
We can freely adjust the range of the strain to apply either boundary strain(applied to the boundary of the froth only) or bulk strain (strain amplitude varyinglinearly through the froth). In this model, we keep a record of the number of sides foreach cell. Since cell disappearance is prohibited, a change in cell topology indicates aT1.
2.3. Comparison between experiments and simulationsIn the Potts model simulations, when a single cell is stretched and released, its
largest diameter decreases as exp ( - t/ ¿) as it rounds. We de®ne ¿ as the relaxationtime scale, which is of the order of 10MCSs with the simulation parameters that weused (Jiang et al. 1998). In experiments, the typical time scale of the order of 1 s isdue to surface viscous drag and geometric con®nement by other cells. In practicalapplications to coarsening foams, the time scale ¿ of foam deformation and relaxa-tion is often much faster than di�usion of the ®lling ¯uid; so neglecting coarsening isreasonable. For instance, in experiments, the cell area is not actually conserved, butits variation rate about 10- 2 mm2 s- 1 is so slow that it is negligible.
In simulations, the area constraint is almost always satis®ed, that is the deviationof each cell’s area from its target value contributes a negligible energy, less than onethousandth of the surface energy. In comparison with simulations or classical experi-ments with soap froths, our ferro¯uid foams have an additional energy, di�cult toquantify, due to magnetic dipolar repulsions between ferro¯uid walls; since it appar-ently did not a�ect the results presented below, we did not take it into account in thesimulations, although we could. This choice is validated a posteriori by the agree-ment between experiment and simulation.
Note that both the experimental and the numerical foams have a rather mono-dispersed distribution of sizes and side numbers, and remain monodispersed owingto the cell area conservation.
§3. Analysis of cell elongation
3.1. De®nitionsElongation, the qualitative notion that a cell is not circular, can be quanti®ed in
di�erent ways, with varying advantages and disadvantages (®gure 3).The classical de®nition is the ratio of the largest cell diameter to the smallest cell
diameter, because it considers only two diameters, it is insensitive to details of theshape and oversensitive to noise.
The eccentricity of the cell, de®ned as the ratio of the largest principal moment ofinertia to the smallest principal moments of inertia, is robust. However, it does not
734 F. Elias et al.

suit our purpose because it has the same value for, say, a regular hexagon withstraight or concave walls (see ®gure 3). It is thus insensitive to the fact that theconcavity increases the wall length and decreases the cell area. Moreover, trials onexperimental and simulated foams showed that the eccentricity does not re¯ect theexpert’s intuition, in the sense that the measured eccentricity sometimes increaseswhile intuitively we see that the cell’s irregularity decreases.
The variance s of the side length distribution, hereafter referred to as the `sidevariance’, is de®ned for polygonal cells, with n neighbours and n sides having lengthsf lig . The variance s = h l2i i - h lii
2 of these n sides is zero when all sides have the samelength and increases when the side lengths di�er. This quantity has the advantage ofkeeping track of individual side lengths, a short side which meets two longer sides ateach of its ends is likely to side swap. A limitation is that measuring a variance isalways more noisy than measuring an average. There is a more serious drawback;consider a hexagon with equal side lengths, some walls concave and some convex in
Foams out of stable equilibrium 735
Figure 3. Examples of hexagons with di�erent elongations. (a) Regular hexagon: the ratioof the largest diameter to the smallest diameter is two; the inertia matrix is isotropicand thus has zero eccentricity; the variance of the side length is zero; P/ A1/ 2 =( P/ A1/ 2) 6 = 3.72. (b) Stretched hexagon: these four quantities have strictly increased.(c) Curved walls: same ratio of the largest diameter to the smallest diameter as in (b),larger eccentricity and P/ A1/ 2, zero side length variance.

order to meet at 120ë (®gure 3(c)). Such a hexagon can be arbitrarily elongated, but sremains zero. The total variance sL of the side length distribution characterizes thewhole froth. Equivalently, we can study the average and variance of the di�erence dliof a side’s length between two successive images.
The dimensionless perimeter-to-area ratio P/ A1/ 2 of each cell measures the wallenergy of a cell if its area remains constant. P/ A1/ 2 reaches its minimum value2p1/ 2 3.55 for a circle and increases as the cell side number decreases, as wallsbecome concave or as the cell elongates. An elliptical cell of given area and smalleccentricity e 1 has axes a and b such that b2 = a2( 1 - e2) , a perimeterP p[2a2( 2 - e2) ]1/ 2 and an area A pa2( 1 - e2) 1/ 2, so that the ratio P/ A1/ 2 goesas 2p1/ 2( 1 + e4/ 16) + O( e6) .
Other similar analyses do not pertain to our problem. For instance, A/ P has thedimension of a length; the correlation between A/ P and the cell size is a statisticalmeasurement of a whole foam but does not yield a scale-independent analysis of asingle cell’s shape. We could have normalized P/ A1/ 2 by the P/ A1/ 2 value for aregular n-sided polygon ( P/ A1/ 2) n = 2[n tan ( p/ n) ]1/ 2, but this normalization is dis-continuous when n changes, precisely during the T1 events that we wish to study.
3.2. Actual measurementsIn practice, P/ A1/ 2 is almost always greater than or equal to the P/ A1/ 2 value for
a regular hexagon ( P/ A1/ 2) 6 = 3.72. Measuring the deviation of P/ A1/ 2 from 3.72 isthus a good compromise between physical meaning and robustness to noise, at lowcomputational cost. We also keep track of the individual side lengths f lig anddescribe the topology by the cell side number n. As statistical measures of thewhole foam we use sL and h P/ A1/ 2i .
Simulated foams are dry, so that the side length is unambiguous. The residualanisotropy of the underlying weighted next-nearest-neighbour square lattice intro-duces an error of between 0 and 8% according to the orientation of the wall portionconsidered with respect to the lattice. The error in perimeter is thus a few per cent. Ina foam more polydispersed than ours, with smaller cells and thus larger artefacts dueto the pixelization, the ratio P/ A1/ 2 could still be robustly determined, because of theHough transformation (Ballard 1981).
For experimental image analysis, we used software adapted from NIH-Image(Cardoso 1997). The image is ®rst thresholded into black and white pixels to de®necell boundaries. A cell perimeter is then measured as the sum of the distance betweenboundary pixels. For the same image, the measures of perimeter determined with thissoftware, and with the method used in the simulation, di�er by a few per cent. Theimage is then skeletized, by eroding the walls to a thickness of one pixel, and cellsides are de®ned on the resulting polygonal cells. The size of the vertices is alsoreduced to one pixel, so that the measure of the side length becomes unambiguous.For an n-sided cell, the measured sum of its n side lengths is highly correlated(R > 0.99) with, but n pixels more than, the perimeter measured as above.
§4. Results
4.1. E�ect of magnetic ®eld on the elongation of cellsDecreasing the external magnetic ®eld H leads to coarsening. We analysed a
series of 21 successive images for the same foam at decreasing H and constantferro¯uid fraction; for instance the series at ferro¯uid fraction u = 0.13 from
736 F. Elias et al.

which ®gure 2 has been extracted. The cell elongation decreases during coarsening.The variance of the cell side length and cell perimeter-to-area ratio correlate (®gure4); the latter is least noisy and conforms better to visual intuition than does the cellside length or cell eccentricity. These three quantities decrease during natural foamevolution. The wall thickness increases, and the foam becomes wetter. As expected,skeletization arti®cially increases sL . In very wet foams, small sides or even fourfoldvertices can appear. However, the values of P/ A1/ 2 and the results presented in thenext section are correct for both dry and wet foams (®gure 4). T1s spontaneouslyoccur and reduce the cell elongation.
We also increased H after nucleating the foam. As explained above, the walllengths increase and cells elongate to increase their perimeter-to-area ratio. Hereagain, T1s spontaneously occur and reduce the cell elongation.
4.2. Natural and arti®cial T1 processesFrom the same series of pictures of coarsening we extracted successive pictures
between which a T1 had occurred, that is each time that one side length reached zeroduring the natural evolution of the foam. Detailed measurements of wall lengthbefore and after a T1 show that the process signi®cantly changes roughly 15±20walls, depending on the image. Figure 5 (b) shows the change in individual walllengths. Small walls grow and long walls shrink, which con®rms that a T1 decreasesthe average elongation of cells. Simulations display the same behaviour. Both experi-ments and simulations (®gure 6) show that the perturbation of the elongation
Foams out of stable equilibrium 737
Figure 4. Elongation of cells during froth coarsening, (see ®gure 2). The variance of cell sidelength (d ), and cell perimeter-to-area ratio (h ) have been averaged over all cells ofthe foam. Each point is an average over four di�erent foams, made with the sameferro¯uid fraction u = 0.13.

extends over a range of roughly three cell diameters. Nevertheless, the averages ofthe side length variation over a wall shell surrounding the disappearing wall (®gure6 (a)) show that the averaged elongation decreases only in the group of four cellsinvolved in the T1.
738 F. Elias et al.
Figure 5. Each dot represents the variation in length of a wall between two images, plottedagainst the initial length, expressed in millimetres. (a) No side length varies more than5mm between two images at ®elds H = 9.8kA m-1 and H = 9.0kA m-1 without a T1between them. (b) 18 side lengths vary signi®cantly between two images at ®eldsH = 11.2kA m-1 and H = 10.6kA m-1, with one T1 between them; they belong tothe 19 cells closest to the T1. Amongst these sides, the shorter sides tend to increase inlength while the longer sides tend to shrink, thus reducing the average cell elongation;the straight line is a linear ®t through these side changes. (c) Between two imagesseparated by an arti®cial T1 (see ®gure 7), 24 side lengths alter signi®cantly, but withno correlation to their original length.

Given the cell areas, does the selected con®guration correspond to the minimumpossible energy? Watching a foam does not provide the answer.
Experimentally, we selected a side (®gure 7 (a)) and placed a metallic pin above it,locally attracting magnetic ¯uid to create an articial unstable fourfold vertex (®gure1). After removing the pin, this fourfold vertex spontaneously decayed into one ofthe two con®gurations with two threefold vertices. It returned to the initial con®g-uration if it had a lower energy. In a minority of cases, it induced an arti®cial T1(®gure 7 (b)) if the initial, naturally selected con®guration had a higher energy thanthe arti®cially induced con®guration.
These `arti®cial T1s’ did not always decrease the average cell elongation, as in®gure 7 (a)±(c) and in ®gure 5 (c). The variation in wall length and the initial walllength were uncorrelated. Of course, more elongated cells were much easier to sideswap. Comparing the images before and after an arti®cial T1, we observed thatvertices up to the third neighbours around the T1 moved (®gure 7 (d)); deformationpropagated over a ®nite range.
These motions were due only to the T1. We checked as follows that they were notdue to any possible time evolution of the froth. By placing a pin above the newlycreated side, we made it collapse into a fourfold vertex; then, moving the pin to andfro, we could attract more magnetic ¯uid and recreate the side which had disap-peared (®gure 7 (c)). After this `reverse T1’, all vertices reverted to their originalpositions and both images were identical (®gure 7 (e)). The correspondence is prob-ably not a coincidence but rather shows that the initial pattern was nearly equili-brated (a local energy minimum).
4.3. T1 and perimeter-to-area ratioA detailed analysis of the perimeter-to-area ratio supports and re®nes the pre-
ceding results regarding the decreasing cell elongation induced by a T1.That a T1 is a short-range process is apparent in (®gure 8 (c)). In typical images,
the two cells which lose a side always have one of the largest P/ A1/ 2 values before theT1, and become signi®cantly rounder after the T1 (®gure 8 (a) and (b)). In fact, the
Foams out of stable equilibrium 739
Figure 5.

sum of the P/ A1/ 2 values of the other cells shows no signi®cant variation. Detailedstudy as a function of cell distance (not shown) con®rms that the T1 perturbs P/ A1/ 2
over a range of three cell diameters (i.e. up to the sixth shell, as de®ned in ®gure 8 (c)).A simulation of a sheared foam is instructive. Starting with a (metastable) equi-
librated foam, we apply a steadily increasing bulk shear (Jiang et al. 1998). After aninitial transient, we see that, on average, P/ A1/ 2 increases steadily. The rate andamplitude of the shear are chosen to produce isolated T1s (®gure 9 (b)), and we canexamine the four cells around the T1. During the T1, the cell which has the largestP/ A1/ 2 loses one side and its P/ A1/ 2 decreases strongly (®gure 9(e)). The other cell
740 F. Elias et al.
(a)
(b)
Figure 6. (a) The average side length variation and (b) its standard deviation are measuredfor each cell wall of a foam before and after a natural T1 process, in an experiment (d )and in a simulation (h ). To show the range over which the perturbation due to the T1extends, the variation for each wall is then averaged over each wall shell, de®ned asfollows. Shell 1 is the disappearing or created wall. Walls of shell 2 touch shell 1, wallsof shell 3 touch shell 2, and so on. The shells are therefore roughly circular and centredon the disappearing wall. The last a�ected shell is shell 6 or 7, that is walls which areseparated from the T1 by roughly three cell diameters.

which loses one side also sees its P/ A1/ 2 decrease for a few MCSs and then resumesthe average growth. The cells which gain one side barely change P/ A1/ 2. Averagingover these four cells clearly emphasizes that the T1 transiently reduces the meanvalue of P/ A1/ 2 (®gure 9 (d)), during a time characteristic of the froth relaxationtowards (metastable) equilibrium. The relaxation of the froth after the shearhas ceased is similar: when a cell loses one side, its elongation decreases strongly(®gure 9 ( f )).²
The same e�ects are experimentally observed in a series of four successive T1s(®gure 10). The average P/ A1/ 2 steadily decreases through each T1, while the P/ A1/ 2
Foams out of stable equilibrium 741
Figure 7. (a), (b) A T1 process is arti®cially forced in a ferro¯uid froth, (see §2.1); (b), (c)then the inverse T1 is forced, to return to the original pattern (c). (d) Superposition ofthe images (b) after (appears dark) and (a) before (appears grey) the ®rst T1. (e)Superposition of the images (c) after and (a) before both T1s. The images are in-distinguishable.
² Arti®cial T1s could also in principle be simulated in a (metastable) equilibrated foam.Running the simulations at a high temperature, the foam explores other states around thelocal energy minimum. As soon as a fourfold vertex is detected, the foam is quenched bysetting the temperature to zero, and the fourfold vertex decays into two threefold vertices.
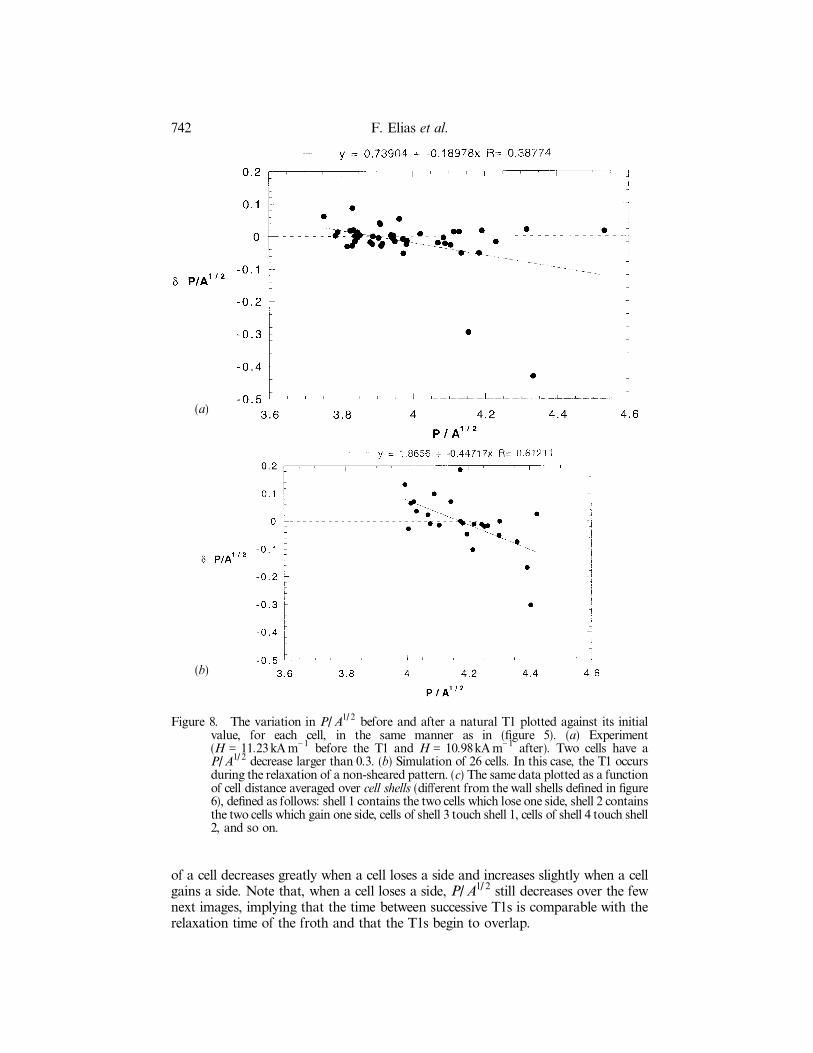
of a cell decreases greatly when a cell loses a side and increases slightly when a cellgains a side. Note that, when a cell loses a side, P/ A1/ 2 still decreases over the fewnext images, implying that the time between successive T1s is comparable with therelaxation time of the froth and that the T1s begin to overlap.
742 F. Elias et al.
(a)
(b)
Figure 8. The variation in P/ A1/ 2 before and after a natural T1 plotted against its initialvalue, for each cell, in the same manner as in (®gure 5). (a) Experiment(H = 11.23kA m-1 before the T1 and H = 10.98kA m-1 after). Two cells have aP/ A1/ 2 decrease larger than 0.3. (b) Simulation of 26 cells. In this case, the T1 occursduring the relaxation of a non-sheared pattern. (c) The same data plotted as a functionof cell distance averaged over cell shells (di�erent from the wall shells de®ned in ®gure6), de®ned as follows: shell 1 contains the two cells which lose one side, shell 2 containsthe two cells which gain one side, cells of shell 3 touch shell 1, cells of shell 4 touch shell2, and so on.

Foams out of stable equilibrium 743
8 (c)
(a)
1
3
4
2
(b)
1
2
4
3
Figure 9. Simulation of a sheared froth: the shear increases the average elongation, until a T1process relaxes it. (a), (b), (c) Snapshots of a single T1 under bulk shear. The strain ratelinearly depends on the vertical position, schematically illustrated beside (a). Greylevels indicate cell side numbers. (a) 550MCSs, (b) 750MCSs, (c) 950MCSs. Cells1, 2, 3 and 4 elongate under shear. A T1 process (b) reduces the elongation of cells 2and 4 when they each lose a side. (d) The elongation, P/ A1/ 2, averaged over 26 cells(h ) steadily increases under shear. The average elongation over only the four cellsinvolved in the T1 (n) decreases when the T1 occurs (vertical line). (e) Details, cell bycell. Before the T1, the four cell elongations increase under shear like the average.After the T1, the two cells which lose one side (+ , s) decrease P/ A1/ 2. The two cellswhich gain one side (h , n) do not change P/ A1/ 2. ( f ) Same behaviour during a T1(vertical line) when the froth relaxes after the shear has been suppressed at t = 0 MCS.

744 F. Elias et al.
(c)
1
2
4
3
0 200 400 600 800 1000 1200 1400 1600 1800 2000
4
4.2
4.4
4.6
4.8
5
5.2
Time (MCS)
P/s
qrt
(A)
T1 clustermean
9 (d )
9 (e)

§5. Mechanical properties: an open problem
5.1. Probability of a T1Given a certain perturbation of vertex positions, can we predict where and when
T1s will occur? A weaker version of this question is: can we statistically predict theprobability of T1 occurrence, that is the number of T1s occurring in a su�cientlylarge froth? The answer determines the foam’s elasticity and time evolution due todi�usion-driven cell area changes; it should depend on the topological and geome-trical disorder of the foam, that is the variances of cell topology and side length. Wenow discuss the e�ect of a vertex displacement over a distance ¢, either smaller orlarger than a typical cell side length.
5.2. E�ect of a small vertex displacementBy displacing a vertex over a distance ¢ smaller than the typical cell size, we
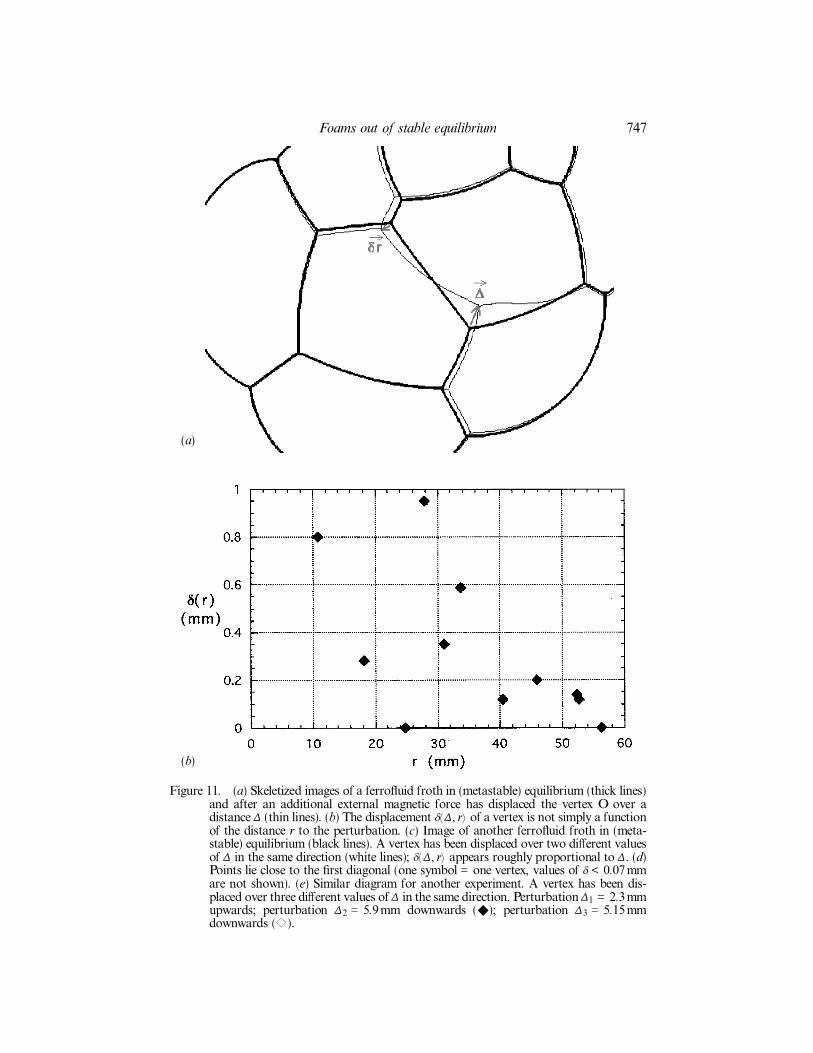
can determine the response function of the foam. We characterize it bymeasuring the displacement d( ¢, r) of another vertex, at a distance r from the per-turbation. d( ¢, r) depends only on the intrinsic properties of the foam at the timeconsidered.
In experiments (®gure 11) and simulations (M. Asipauskas, private communica-tion), an arti®cial vertex displacement over a small ¢ induced displacements of theneighbouring vertices over a range of three typical cell diameters, the same range asfor T1s (§4.2). The response function of the foam is elastic and linear, for eachvertex, d is proportional to ¢ (®gure 11). However, d is not a simple power law inr and is not even a single-valued function of r. Moreover, the induced displacementshave widely distributed orientations and strongly depend on quantities which varysimultaneously: the relative orientations of the walls and the displacement ¢, and thecell areas and pressures.
Foams out of stable equilibrium 745
9 ( f )

5.3. E�ect of a large vertex displacementA T1 results in an e�ective vertex displacement ¢ of two vertices. ¢ can be
de®ned as half the size of the newly created side and is comparable with an averageside length. What is the response function d( ¢, r) of the foam to this ®nite value of ¢?
746 F. Elias et al.
(a)
(b)
Figure 10. (a) A foam where elongated cells have been arti®cially nucleated and then spon-taneously relaxed through four T1 processes causally related in a chain reaction. Sincethe typical time scale of a T1 is about 1s, well separated images were captured betweeneach T1; the white arrows indicates each new side. (b) The plots show P/ A1/ 2 for twoindividual cells, indicating where they gained (+1) or lost (-1) a side, as well as theaverage h P/ A1/ 2i over the whole foam (j).
Foams out of stable equilibrium 747
(a)
(b)
Figure 11. (a) Skeletized images of a ferro¯uid froth in (metastable) equilibrium (thick lines)and after an additional external magnetic force has displaced the vertex O over adistance ¢ (thin lines). (b) The displacement d( ¢, r) of a vertex is not simply a functionof the distance r to the perturbation. (c) Image of another ferro¯uid froth in (meta-stable) equilibrium (black lines). A vertex has been displaced over two di�erent valuesof ¢ in the same direction (white lines); d( ¢, r) appears roughly proportional to ¢. (d)Points lie close to the ®rst diagonal (one symbol = one vertex, values of d < 0.07mmare not shown). (e) Similar diagram for another experiment. A vertex has been dis-placed over three di�erent values of ¢ in the same direction. Perturbation ¢1 = 2.3mmupwards; perturbation ¢2 = 5.9mm downwards (r); perturbation ¢3 = 5.15mmdownwards (e).

As in §5.2, a T1 does not induce a quadrupolar displacement ®eld, which would beexpected in a homogeneous isotropic medium. Since a small displacement of a vertexcan trigger a T1, which in turn can create a large displacement of neighbouringvertices, the question is now: under what conditions does an initial vertex displace-ment trigger an avalanche of T1s?
748 F. Elias et al.
11 (c)
11 (d )

A hand-waving argument hints at an answer, which depends on the topologicaland geometrical disorder of the foam and remains to be quantitatively studied:
(1) Consider ®rst a perfect regular hexagonal lattice, with all sides of length L .Only when a vertex is moved over ¢ > L can it trigger a T1. In turn, it willcreate a displacement of order L , its neighbourswill be even less displaced andthere will be no avalanche. In that sense, the regular lattice is not `excitable’.
(2) The same holds for a foam with almost uniform cell areas, close to thishexagonal con®guration, that is monodispersed in side lengths and sidenumbers. Only a few cells lie within the range of the perturbation inducedby a T1, only a small proportion of which can undergo another T1.
(3) A foam with a very broad area distribution satis®es the condition fortriggering an avalanche; within a small enough distance r from the T1, liesu�cient sides of small enough length L that d( ¢, r) > L . If one of the largestcells side swaps, an avalanche might a�ect many neighbouring small cells.Such an avalanche remains con®ned to a small fraction of the entire foam.Its e�ect on the foam’s mechanical properties is weak.
(4) Only a foam with a monodispersed distribution of cell areas but a verydispersed distribution of cell side lengths constitutes a more interesting`excitable medium’ (®gure 10). Here an avalanche can propagate over thewhole foam, until all cells are rounder and have a low P/ A1/ 2, signi®cantlya�ecting its mechanical properties.
§6. Conclusion and discussionTaking advantage of ferro¯uid foams, in which side-swapping (T1) processes are
very easy to isolate, observe, force and reverse, we have obtained the following results.
(1) For given cell areas, a foam relaxes towards an equilibrated pattern, and itssurface energy reaches a local minimum. This energy minimization is deter-ministic.
Foams out of stable equilibrium 749
11 (e)

(2) The energy minimum is not always the global minimum (lowest energy)compatible with the cell areas. The naturally selected pattern is metastable,but not necessarily stable.
(3) Estimating the di�erence between the foam energy and its global minimumvalue is di�cult. In ferro¯uid foams and simulations, the total wall lengthvariation during relaxation is less than 1% , even when a T1 occurs, and it isthus sensitive to pixelization. Only during the relaxation of an (arti®cial)foam very far from its global energy minimum, such as in (®gure 10), couldwe measure a signi®cant variation in the total wall length. Moreover, theglobal minimum value itself is usually not known.
(4) On the other hand, in a metastable pattern, the cell elongation correlateswith the deviation from the global energy minimum. The dimensionlessperimeter-to-area ratio P/ A1/ 2 is easily measured for a single image, withoutprior knowledge of the foam’s past or future evolution. It is a good measureof cell elongation. Its minimum value is known; the theoretical lower boundis 3.55 and in practice it seldom falls below 3.72. As such, it is a convenienttool for visualizing stress ®elds.
(5) Natural T1s, which correlate with the geometry and not the topology ofthe foam, decrease cell elongation. The cell which has the highest P/ A1/ 2
is likely to lose a side and decrease its P/ A1/ 2, while cells which gain sideswill slightly increase their P/ A1/ 2 values. This result is not an artefact due tothe variation with n in the P/ A1/ 2 value for a regular n-sided polygon:( P/ A1/ 2) n = 2[n tan ( p/ n) ]1/ 2. In fact, since ( P/ A1/ 2) n decreases with in-creasing n, the normalized value ( P/ A1/ 2) / ( P/ A1/ 2) n shows an even largervariation than P/ A1/ 2 does. It would be instructive to investigate thecorrelations between the elongations of the side-swapping cells and oftheir neighbours.
(6) That arti®cial T1s do not decrease cell elongation suggests a causal relationbetween elongation and natural T1s.
(7) Natural T1s, arti®cial T1s and reverse T1s induce non-local but short-rangeperturbations.
(8) T1s a�ect the geometry, not only of the cells which side swap, but also ofabout a dozen of their neighbours. P/ A1/ 2, the side length variance s andvertex displacements vary for cells within three typical cell diameters of theT1.
(9) When displacing a vertex over a small distance ¢, the displacement d( ¢, r) ofanother vertex, at a distance r from the perturbation, is linear in ¢ andreversible. Predictions of d( ¢, r) could rely on the analytical minimizationof energy for the positions of two vertices while all their neighbours are kept®xed. Since experiments prove that the perturbation has a ®nite range, aniteration by letting every possible vertex pair move should eventually con-verge. Simulations could help to identify the role of disorder and boundaryconditions.
Understanding the spontaneous decrease of 2D cell elongation through T1smight determine whether, starting from an arbitrary initial froth, the distributionof cells’ elongation relaxes until it reaches a (possibly universal) predictable distribu-tion. By generalizing the de®nition of elongation as surface/(volume)2/ 3, this studymight be extended to 3D cells.
750 F. Elias et al.

Note added: Since we submitted this paper, a paper by Szeto et al. (1998) hasrecently been published. It shows that non-zero correlations exist between cells up tothe third shell at least. This agrees with our ®ndings.
ACKNOWLEDGEMENTS
We would like to thank Sophie Neveu for providing us with the magnetic ¯uid,Marius Asipauskas for his participation in simulations, Jean-Claude Bacri for hisfriendly support, Olivier Cardoso for the image analysis, and Norbert Kern forcritical reading of the manuscript. J. A. G and Y. J. acknowledge support fromthe American Chemical Society/Petroleum Research Fund and National ScienceFoundation/National Young Investigator Award DMR-92-57011.
ReferencesBallard D., 1981, Pattern Recognition, 12, 2.Cardoso, O., 1997, NIH-Image.²Elias, F., Drikis, I., Cebers, A., Flament, C., and Bacri, J.-C., 1998a, Eur. Phys. J. B, 3,
203.Elias, F., Flament, C., Bacri, J.-C., Cardoso, O., and Graner, F., 1997, Phys. Rev. E, 56,
3310.Elias,F., Flament,C., Bacri, J.-C., and Graner,F., 1998b, in Foams and Emulsions, edited
by J. F. Sadoc and N. Rivier (Deventer: Kluwer).Glazier, J. A., 1989a, PhD Thesis, The University of Chicago; Phys. Rev. Lett., 70, 2170.Glazier, J. A., Anderson, M. P., and Grest, G. S., 1990, Phil. Mag. B, 62, 615.Holm, E., Glazier, J. A., Srolovitz, D. J., and Grest, G. S., 1991, Phys. Rev. A, 43, 2262.Jiang, Y., Swart, P. J., Saxena, A., Asipauskas, M., and Glazier, J. A., 1998,
(submitted).Kraynik, A. M., 1988, Ann. Rev. Fluid Mech., 20, 325.Szeto, K., Aste, T., and TamW., 1998, Phys. Rev. E, 58, 2656.
Foams out of stable equilibrium 751
² A user module has been added to this freeware for the analysis of cellular patterns, andis available at http://www.lps.ens.fr/ cardoso/. NIH-Image is freeware. O. Cardoso(Laboratoire de Physique Statistique Ecole752e Normale SupeÂrieure de Paris) modi®ed thisfreeware in 1997 and put it on the web.