Embed Size (px)
Citation preview

MSc Program "Building Science & Technology"
Foam Structures: A Comparative Structural Efficiency Analysis Based on the Building Case "Watercube"
A master's thesis submitted for the degree of “Master of Science”
Supervisor: Arch.Dipl.-Ing.Dr.techn. Margit Pfeiffer-Rudy Department of Structural Design and Timber Engineering
Nilufer Senses
Vienna, June 2007
0527085

Affidavit
I, Nilufer Senses, hereby declare
1. That I am the sole author of the present Master Thesis <Foam Structures: A Comparative Structural Efficiency Analysis Based on the Building Case "Watercube"> and that I have not used any source or tool other than those referenced or any other illicit aid or tool, and
2. That I have not prior to this date submitted this Master Thesis as an examination paper in any form in Austria or abroad.
Vienna, June 2007 _______________________________
Signature

Acknowledgement With my deepest gratitude, I want to thank my supervisor Arch.Dipl.-Ing.Dr.techn. Margit
Pfeiffer-Rudy whose help, stimulating support and encouragement helped and guided me in
all the step of this thesis.
I have furthermore to thank Dipl.-Ing. Stephan Jaksch for his stimulating help and support.
July 12, 2007

Abstract
Foam structure in macro-scale has arisen as a new type of large span building structure
recently which is a product of cooperation of advanced structural design, radical architectural
design approach, and computer and software technology, and efficiency of foam structure
became an important question to answer which could help further structural improvements.
This study analyses efficiency of large span foam structure relative to conventional large span
building structures with a parametric simulation method.
Space frames are a special case of conventional large span structures one compared with foam
structures, because it satisfies criteria such as being lightweight and three-dimensional as
foam structure. Analysis is based on the comparison of base cases of foam model and space
frame model, which are developed on light of real projects the Water Cube and the Symbol
Zone of Expo’70, based on the parameters structural depth, weight and displacement, and
vertical and horizontal load cases. During the analysis structural behavior of base cases were
simulated by using a special structural behavior simulation program.
It was found that foam model is more efficient than space frame model in terms of structural
depth which is an important issue for large span building structures from both architectural
and engineering point of view. Capability of spanning large distance with significantly less
structural depth makes foam structure a preferable, new generation, steel structure for large
spans. Moreover, the development process of base case foam model demonstrated the critical
importance of geometrical design concerns of foam structure. Structural behavior simulations
were exposed that structural optimization is one of the vitally important process of structural
design of the foam structure.
Keywords: Foam, foam theory, foam structure, space frame, geometrical optimization, structural optimization, structural behavior simulation
Table of Contents 1 Introduction 7
1.1 Foam Theory 8 1.1.1 Foam Types 9 1.1.2 History of The Foam Theory 12 1.1.3 Weaire-Phelan Model 16
1.2 Natural Foams 19 1.3 Artificial Foams 20
1.3.1 Organic Foams 20 1.3.2 Metal Foams 20 1.3.3 Polymer Foams 21 1.3.4 Ceramic, Glass and Artificial Liquid Foams 22
2 Case Studies 23
2.1 The Water Cube 23 2.1.1 Context 23 2.1.2 Strategy 26 2.1.3 Description of the Project 28 2.1.4 Load-Bearing System 29 2.1.5 Cladding and Greenhouse Effect 32 2.1.6 Structural Optimization and Seismic Design 33
2.2 Expo’70 “The Symbol Zone” 36 2.2.1 Context 36 2.2.2 Strategy 37 2.2.3 Description of the Project 39 2.2.4 Load-Bearing System 40
3 Development of Simulation Model Cases 43
3.1 Definition of Parameters 43 3.2 Foam Structure 45
3.2.1 Weaire-Phelan Bubbles 45 3.2.2 Overall Structure 47 3.2.3 Simplifying and Developing the Base Case Foam Model 48
3.3 Space Frame Structure 54 3.3.1 Overall structure 54 3.3.2 Developing the Base Case Space Frame Model 55
1

4 Comparative Study 57
4.1 Large Span Building Structures: Space Frame vs. Foam Structure 57 4.2 Parametric Comparative Efficiency Analysis 60 4.3 Simulations of Structural Behavior 63
4.3.1 Context 63 4.3.2 Strategy 64 4.3.3 Base Case Foam Model Simulation Results 65 4.3.4 Base Case Space Frame Model Simulation Results 68
4.4 Discussion 72 5 Conclusions and Prospects 75
Bibliography 77
Appendix 79
2
Table of Figures Figure 1: Computer simulation of two-dimensional wet foam...................................................9 Figure 2: Computer simulation of two-dimensional dry foam.................................................10 Figure 3: Transformation of the three-dimensional wet foam by decreasing liquid fraction...10 Figure 4: Closed cell foam (a) and opened cell foam (b) .........................................................11 Figure 5: Polystrene foam (left) and aluminium foam (right), various shapes of cells............12 Figure 6: Joseph Antoine Ferdinand Plateau and the illustration of Plateau Rule: Three
bubbles meet at angle of 120° ..........................................................................................13 Figure 7: Sir William Thomson (Lord Kelvin) and Kelvin bubble..........................................13 Figure 8: Orientation of Kelvin foam.......................................................................................14 Figure 9: Picture of string of Kelvin bubble captured by Weaire and Phelan..........................15 Figure 10: Transformation of the Kelvin bubble into Williams bubble ...................................15 Figure 11: Williams bubble and orientation of bubbles ...........................................................16 Figure 12: Weaire-Phelan bubbles: 14-faced polyhedron (blue) and 12-faced polyhedron
(yellow).............................................................................................................................17 Figure 13: Orientation of Weaire-Phelan bubbles...................................................................17 Figure 14: Experimental observation of the Weaire-Phelan bubble matched by it’s 3D
computer based model ......................................................................................................18 Figure 15: Packing types of foam models ................................................................................19 Figure 16: Natural solid foams: (a) sponge, (b) cancellous bone.............................................19 Figure 17: Cork is an anisotropic natural foam and its anisotropy is shown in two different
directions ..........................................................................................................................19 Figure 18: Perspective and façade view of the Water Cube.....................................................23 Figure 19: Perspective view of the Water Cube.......................................................................24 Figure 20: Bubble High Rise concept project ..........................................................................24 Figure 21: Rapid prototype models of the Water Cube structure.............................................25 Figure 22: Inner perspective views of the Water Cube ............................................................25
3
Figure 23: Floor plan at ± 0.00 and bird’s eye view of the Water Cube ..................................28 Figure 24: Top, front, and perspective view of the Water Cube structure module: bubble
cluster ...............................................................................................................................28 Figure 25: (a) outer web frame, (b) foam structure, (c) inner web frame, (d) the Water Cube
structure ............................................................................................................................29 Figure 26: Perspective views of structural system: outer and inner frame and inner structure29 Figure 27: The Water Cube structure: Red represents inner web, blue represents outer web
and green is foam structure...............................................................................................30 Figure 28: Picture of roof nodes during the assembly of the structure.....................................30 Figure 29: Simplified model of web joints and foam structure joints ......................................31 Figure 30: Reinforcement substructure of the Water Cube......................................................31 Figure 31: ETFE cushions ........................................................................................................32 Figure 32: ETFE cladding of the Water Cube..........................................................................33 Figure 33: The analysis of the bending stress of a palm stem. Each color represents different
bending stresses at different cross-sections......................................................................34 Figure 34: Asia Seismic Hazard Map......................................................................................35 Figure 35: Bird’s eye view of Expo’70 “The Symbol Zone”...................................................36 Figure 36: The roof structure of the Symbol Zone supported on six columns.........................39 Figure 37: Expo site and Festival Plaza, Tower of the Sun in 1970.........................................39 Figure 38: Expo site and Expo’70 Festival Plaza area+ Tower of the Sun today ....................40 Figure 39: The recursive unit of the structure: Half-octahedron and the entire structure ........40 Figure 40: Space grid structure and it’s half-octahedron repeating units.................................41 Figure 41: The lattice structural constitution of columns.........................................................41 Figure 42: Ball joint of space grid structure of the “Symbol Zone” and detailed explanation of
the joint .............................................................................................................................42 Figure 43: Translucent cladding of the roof: Polyester film cushions .....................................42 Figure 44: Results of simulation is represented on the left hand site of animator window of
BUILD..............................................................................................................................44
4

Figure 45: Weaire-Phelan bubble cluster and sliced cluster which are modeled in Surface Evolver .............................................................................................................................46
Figure 46: Weaire-Phelan bubbles and bubble cluster .............................................................47 Figure 47: Schematic illustration of geometry modeling process of the Water Cube..............47 Figure 48: Dimension of the base case foam model.................................................................49 Figure 49: Comparison of bubble densities of the Water Cube and base case foam model ....50 Figure 50: Solid bubble prism and it’s simplified representation during the base case structure
modeling ...........................................................................................................................50 Figure 51: Horizontal slicing planes and their representation in simplified model..................51 Figure 52: Deletion of the squares which are not in the horizontal borders.............................51 Figure 53: Deletion of the squares which are not in vertical borders.......................................51 Figure 54: Left: Replacing bubble clusters with squares. Right: Slicing bubbles with vertical
and horizontal planes ........................................................................................................52 Figure 55: The model consists of sliced solid bubbles.............................................................52 Figure 56: Converting solid bubbles to wire frame bubbles ....................................................53 Figure 57: Load-bearing system model of base case foam model in AutoCad........................53 Figure 58: Dimensions of the load-bearing system model of base case foam model ..............53 Figure 59: The clear spans in longitudinal direction ................................................................54 Figure 60: Clear spans across its width ....................................................................................54 Figure 61: Load-bearing system model of the largest span of Expo’70 the Symbol Zone roof
structure ............................................................................................................................55 Figure 62: One row of half-octahedron space frame units are added in longitudinal direction56 Figure 63: Load-bearing system model of the base case space frame model...........................56 Figure 64: The steps of the development of the base case space frame model ........................57 Figure 65: Regularity of space frame vs. randomness of foam structure .................................58 Figure 66: The load-bearing system model of the BCFM with a clear span of 91 m x 78 m ..65 Figure 67: Illustration of the BCFM in BUILD Animator .......................................................66
5

Figure 68: Illustrated simulation result of the BCFM under dead load case............................67 Figure 69: Exaggerated view of deformation of the BCFM under dead load case and
simulation results..............................................................................................................67 Figure 70: The load-bearing system model of the BCSM with a clear span of 91 m x 78 ......68 Figure 71: Illustration of the BCSM in BUILD Animator .......................................................70 Figure 72: Illustrated simulation result of the BCSM under dead load case............................71 Figure 73: Exaggerated view of deformation of the BCFM under dead load case and
simulation results..............................................................................................................72 Figure 74: Illustration of the foam structure and space frame simple models in structural depth
comparison .......................................................................................................................74 List of Tables Table 1: Comparison of dry foam energy levels of demonstrated models...............................18 Table 2: Parameters of the comparative efficiency analysis of the base case foam model......61 Table 3: Simulation results of the BCFM with span of 140m x 120m under dead load case ..62 Table 4: Simulation results of BCFM with span of 91m x 78m under dead load case ............66 Table 5: Structural information and simulation results of the base case foam model..............68 Table 6: Cross-sections of members of Expo’70 the Symbol Zone and the BCSM ................69 Table 7: Simulation result of the BCSM with span of 91m x 78m under dead load case........70 Table 8: Structural information and simulation results of the BCSM......................................71 Table 9: Comparison of results of the BCFM and the BCSM simulations ..............................73
6
1 Introduction
During the twentieth century, increasing use of information technologies enhanced creativity
and productivity in many fields. The architectural design became much freer than it was in the
past in terms of form, aesthetics and functionality. This innovative path launched the demand
for and supply of new materials and structures in the construction and material industries.
Nowadays, architects, engineers and researchers focus on developing new approaches to the
architectural and structural design and on the most efficient use of materials in buildings and
structures to get desired levels of aesthetics and quality. In this sense, nature remains a great
source of inspiration, which includes the best examples of the efficient uses of materials in
super-efficient structures with aesthetically sparkling ways in living organisms and in
inorganic matter. Researches tend to understand the physics of such structures. Data are
collected and interpreted to replicate the efficiency of nature in the architectural and structural
designs.
Foam is one of the good examples of this type of adaptation. It is quite common in the nature
i.e. sponge, honeycomb, cork, cancellous bone etc., and they have wide spread uses of micro-
and macro-scales. For example, especially in the material industry, foamed constitution of the
same material has proven to be much more efficient relative to the natural one in many
respects (i.e. mechanical behavior, density and the quantity of material) to provide same
conditions. Other micro-scale applications of foam, for instance metal, polymer and ceramic
foams, have been used for many years in many branches of the industry including
construction. Crash safety material of cycling helmets is polymer foam and the system works
based on making use of the polymer foam constitution absorbing energy and the lightness of
the foamed material.
The first macro-scale example of the foam structures appeared in 2003. The structure is the
National Swimming Center of Beijing in China, which is also called “The Water Cube”. Arup
and PTW designed an enormous large span building structure. It was a radical approach to the
architectural and structural design and was inspired from the shape of bubbles in a continuous
array. Architects have been based on Weaire-Phelan Theory, which sets the most efficient
solution for the old mathematical problem on finding the shape of soap bubbles in a foam.
Unconventionally, The Water Cube respects original architectural design despite its vast span
structure. Usually, in such building structures, dimensions of structural elements connected to
the span and loads are large. The major emphasis stands on the structure rather than the
7

architectural design. In many cases, the structures also stiffened with tensile cables or cable
nets which are far from following the architectural shape and boundaries. In the Water Cube,
the structure consists of a network of steel tubular elements and it fills the space between
architectural shape boundaries. The structure itself is part of the shape, architectural
boundaries and architecture. The structure forms a unity together with architectural design as
in organic or inorganic matter where structure follows shape and stays in the boundaries.
This study concentrates especially on the latter; the macro-scale application of foam in
architecture and analyses structural efficiency with a comparative study. The first part
presents foam theory and the types of foam. The second part discusses the Water Cube and
Expo ’07, which are physical examples of the two structural types of comparative study, as
case studies. The third part presents simulation models for foam and space frame structures
and their development process. Furthermore, the fourth part compares the efficiency of these
structures in large span buildings.
1.1 Foam Theory
Soap foam has been engaging scientists’ attention since the 1870’s. As in the Encyclopedia of
Applied Physics1 a foam is a coarse dispersion of gas in liquid or solid and the main question
driving research on the soap foam is how to divide the space with minimum partitional area.
First in 1873, Belgian scientist Plateau observed soap bubbles and demonstrated the rules of
soap foam constitution. After about 10 years, Sir William Thomson (Lord Kelvin), solved the
problem of division of the space with minimum partitional area in the foam based on
Plateau’s research. After Lord Kelvin’s contribution, the problem of division of space is
called as Kelvin problem and soap bubbles became the core of involved researches.
Today, foam is an interdisciplinary subject of physics, mathematics, chemistry and
engineering science. Physics is interested in shape, orientation and physics of liquid foam
along with mechanical and material properties of solid foam. Nano-scale foam models, such
as atomic packing models of molecules and material properties of solid foams are the subjects
of chemistry.
1 Encyclopedia of Applied Physics (1997). USA:WILEY-VCH Verlag GmbH. ISBN: 3 527 29306 X
8

1.1.1 Foam Types
There is a wide range of foam types by material, constitution, behavior etc. Nevertheless, they
can be classified in two major groups as liquid and solid foams.
Liquid foams are created by air dispersion in a liquid. The properties of liquid content
determine stability of the foam. Stable foams cannot be made by pure liquids. Additional
substances, such as natural or synthetic soaps or proteins, are used as foam promoters to
provide the stability of the foam. 2 There are two sub-types of liquid foams i.e. two-
dimensional and three-dimensional foams, that are distinguished as wet and dry foams within
each sub-category.
The two-dimensional foam could be made by squeezing the three-dimensional liquid foam
between two glass plates. Honeycomb is the best example of the two-dimensional foams in
the nature (Weaire and Hutzler, 1999). Two-dimensional liquid foams can be either in a wet
or dry foam form. The two-dimensional wet foam consists of two-dimensional circular
bubbles. Because of the high liquid fraction, this two-dimensional foam is called wet foam.
When the liquid fraction of wet foam increases, the shapes of the foam bubbles approach to
circle.
Figure 1: Computer simulation of two-dimensional wet foam
liquid fraction Фl=0.12
The two-dimensional dry foam is derived from two-dimensional wet foam by reducing the
liquid fraction of the foam. Two-dimensional dry foam simply consists of polygons with arch
edges 2 The New Encyclopedia Britannica (1985). Chicago,USA: Encyclopedia Britannica,Inc. ISBN:0 85229 423 9
9

and different variations of polygons could be observed. Every three edges of the foam meet in
a vertex at the Plateau 120˚ rule (see History of the Foam Theory, Weaire and Hutzler, 1999).
Figure 2: Computer simulation of two-dimensional dry foam
liquid fraction Фl=0.02
The three-dimensional foam in liquid environment comprises almost spherical bubbles and
this type of foam is called the three-dimensional wet foam. It has high liquid fraction like the
two-dimensional wet foam. When the liquid fraction of wet foam decreases to a certain level,
bubbles transform from spherical to polyhedral shape. The foam becomes a network of thin
liquid films joining together with Plateau rules. In this case, it is called the three-dimensional
dry foam (Garcia-Gonzales and Monnereau, 1999).
Figure 3: Transformation of the three-dimensional wet foam by decreasing liquid fraction
10

Solid foams are common constitutions in both nature and industry. Sponge, cancellous bone,
cork are examples of natural solid foams. Industrial foams, or artificial foams, could be made
of metal, polyurethane, ceramic or glass and they can be 100 times lighter than the equivalent
solid material.
The typical manufacturing method of solid foams is rapid solidification of liquid foam. In the
first step, the liquid is foamed with gas bubbles by using special chemical additives in the
liquid material. This step is run under controlled temperature and pressure. The second step is
solidifying the foamed material which is done by freezing the foamed liquid or through
chemical reactions or decomposition.
A partition of solid foam is called a “cell”. Because solid foams are derived from liquid ones,
the shapes of solid foam cells and liquid foam bubbles are similar. Basically, there are two
types of cell in artificial foams. In the first case, the network of edges and faces still exist in
the cells like foam bubbles and this type is called the closed cell foam. In the second case, the
foam comprises only the network of edges without cell faces. This foam is called the open cell
foam.
Figure 4: Closed cell foam (a) and opened cell foam (b)
The self-supporting constitution of opened cell foams are unlike closed cell foams but it is
similar to that of dry foams. In closed cell foams, both cell edges and faces provide stiffness
while the stiffness of opened cell foam derives only from the cell edges. Similarly, in dry
foams, surface tension causes the liquid to be dragged in to the bubble edges and faces are
covered by a thin membrane. Despite the fact that, bubbles (cells) of dry foam are closed,
stiffness mostly arises from the bubble (cell) edges. In this sense, dry foams and opened cell
foams are identical (Gibson and Ashby, 1997). On the other hand, theoretically, the edges of
11

cells in an open cell foam must meet at the Plateau rules to provide stability. In other words,
the process of manufacturing must be accomplished precisely in the right time. However,
stopping the industrial process just in the right time and providing the Plateau rules in every
vertice of the network of the solid foam is practically impossible. Therefore, the science
behind the self-supporting behavior of opened cell foams is obscure (Weaire and Hutzler,
1999).
Figure 5: Polystrene foam (left) and aluminium foam (right), various shapes of cells
The mechanical behavior of solid foams depends on the cell type and the material. The solid
foam could be elastomeric or ductile, which is capable of deforming plastically without
fracturing or brittle (Gibson and Ashby, 1997).
1.1.2 History of The Foam Theory
Finding the shape of soap bubbles with minimum partitional area in a continuous array of
soap bubbles is a mathematical problem since the late 18th century.
Belgian physicist Joseph Antoine Ferdinand Plateau can be considered as the pioneer of
research on foam. In 1873, Plateau published “Statique expérimentale et théorique des
liquides soumis aux seules forces moléculaires” as a complete summary of his research. This
work was based on the idea that foam is not ruled by chance. To demonstrate, he has observed
soap bubbles and presented fundamental geometrical principles of foams under static
conditions. These principles are named “Plateau rules” (Weaire and Hutzler, 1999).
12

Figure 6: Joseph Antoine Ferdinand Plateau and the illustration of Plateau Rule: Three bubbles meet at angle of 120° According to Plateau rules, soap bubbles, bubble clusters and soap films are supported on
wires. These wires consist of bubble edges and vertices. Each bubble comprises three soap
films and four bubble edges. Soap films meet at equal angle of 120˚ and bubble edges meet at
tetrahedral angle of 109.47˚ in the vertices. Furthermore, all of the soap films are not flat and
also the edges are not straight because it is not possible to meet only straight edges at the
equal tetrahedral angle in the vertices. These geometrical principles provide the balance
between surface tension forces of films and pressure differences of bubbles (Kraynık and
Reinelt, 1996). Plateau’s results encouraged subsequent researches about the problem of
division of space with a minimum partitonal area.
Several years after Plateau’s publishing, in 1887, Irish scientist Sir William Thomson (Lord
Kelvin), inspired from Plateau’s research, developed an ideal model of a foam (Weaire and
Hutzler, 1999). It was a significant improvement, which inspired many new researches. His
model, known as Kelvin foam, perfectly meets with Plateau’s Rules.
Figure 7: Sir William Thomson (Lord Kelvin) and Kelvin bubble
13
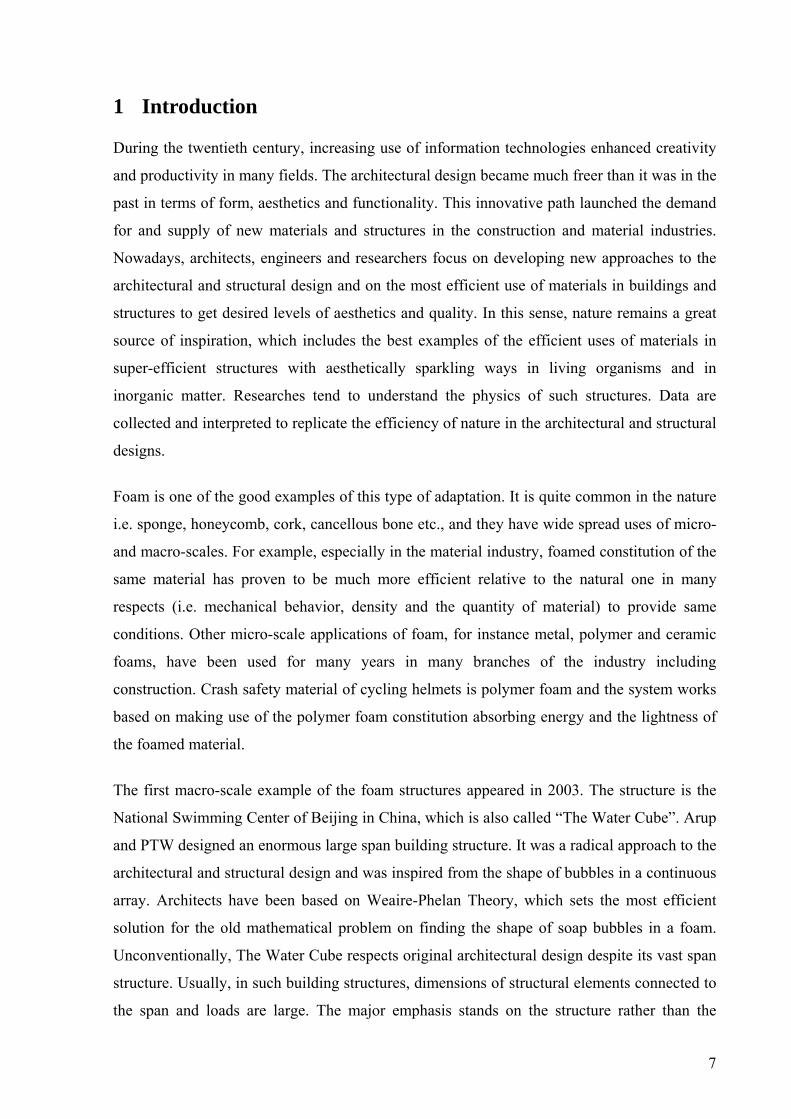
Kelvin foam comprises 14-sided polyhedral bubbles. Each polyhedral bubble consists of six
flat square faces and eight non-planer hexagonal faces and the curvature of the edges are the
same. As Plateau rules requires, bubbles meet at 120˚ angle, edges of the bubbles meet at 109,
47˚ angle and they are slightly curved in order to meet at Plateau’s Rules. Moreover, the
bubbles of foam are combined with the same orientation in which each square faces are
perpendicular to the coordinate axis (Kraynık and Reinelt, 1996; Kose, 1995).
Figure 8: Orientation of Kelvin foam
Kelvin’s ideal foam model was not scientifically verified. However, it remained as an optimal
model of the problem of division of space for years. However, in 1946, results of the
experimental research of American botanist Edwin Martzke caused doubts about Kelvin’s
model.
In Martzke’s experiment, 2000 equal volume soap bubbles were made by using a syringe, one
by one, in a cylindrical dish and it was repeated 16 times. 600 of 2000 soap bubbles, placed
around the central axis of the cylinder, were observed with binocular dissecting microscope.
Many of individual bubbles were captured and 40 drawings were made based on the
photographs. As a result, many bubbles with the shape of 12, 13, 14 and 15 sided polyhedra
and very few with the shape of 11, 16 and 17 sided polyhedra were detected. No exception of
the Plateau Rules could be observed but Martzke couldn’t find any single bubble with the
shape of the Kelvin bubble. He asserted that this is the result of the perfect ordering and
monodispersity of the Kelvin foam. And also, Martzke claimed that practically, it was not
possible to make bubbles in perfect ordering. He explained that readjustments and slipping
14
always occur and Kelvin bubble can only be observed if every equal volume bubble is put in
its exact place (Kose, 1995).
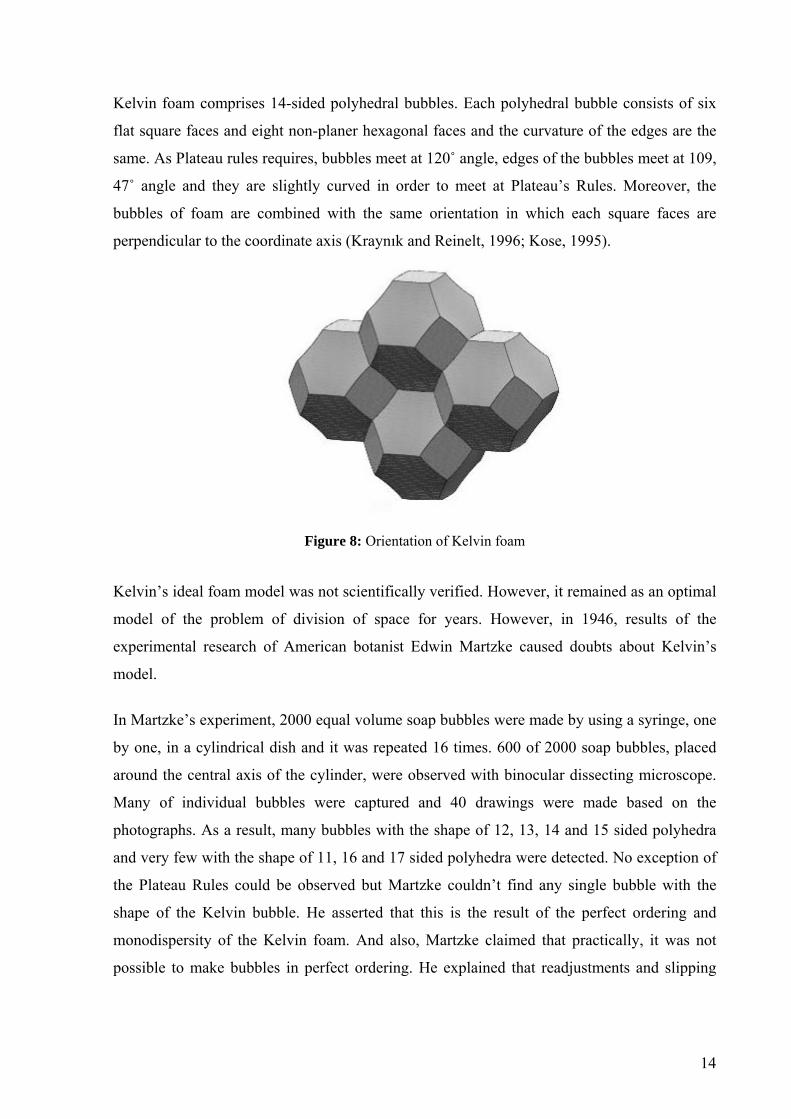
Even though the Kelvin bubble couldn’t be observed in Martzke’s experimental research, its
first photograph of Kelvin bubble was published in botanist John D. Dodd’s research about 10
years after Martzke’s experiment. Many years after, Weaire and Phelan and Darton observed
the Kelvin bubble in soap foam and found that pentagonal face is a common face in soap
foams, which does not exist in the Kelvin model.
Figure 9: Picture of string of Kelvin bubble captured by Weaire and Phelan
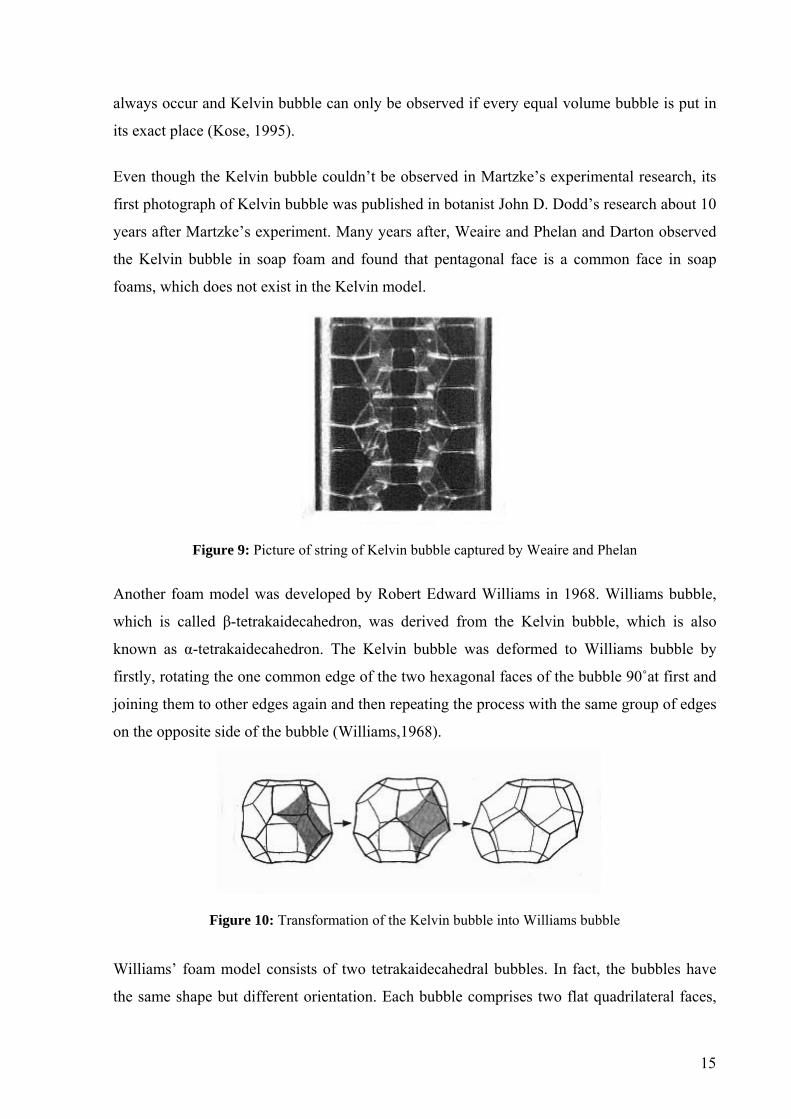
Another foam model was developed by Robert Edward Williams in 1968. Williams bubble,
which is called β-tetrakaidecahedron, was derived from the Kelvin bubble, which is also
known as α-tetrakaidecahedron. The Kelvin bubble was deformed to Williams bubble by
firstly, rotating the one common edge of the two hexagonal faces of the bubble 90˚at first and
joining them to other edges again and then repeating the process with the same group of edges
on the opposite side of the bubble (Williams,1968).
Figure 10: Transformation of the Kelvin bubble into Williams bubble
Williams’ foam model consists of two tetrakaidecahedral bubbles. In fact, the bubbles have
the same shape but different orientation. Each bubble comprises two flat quadrilateral faces,
15
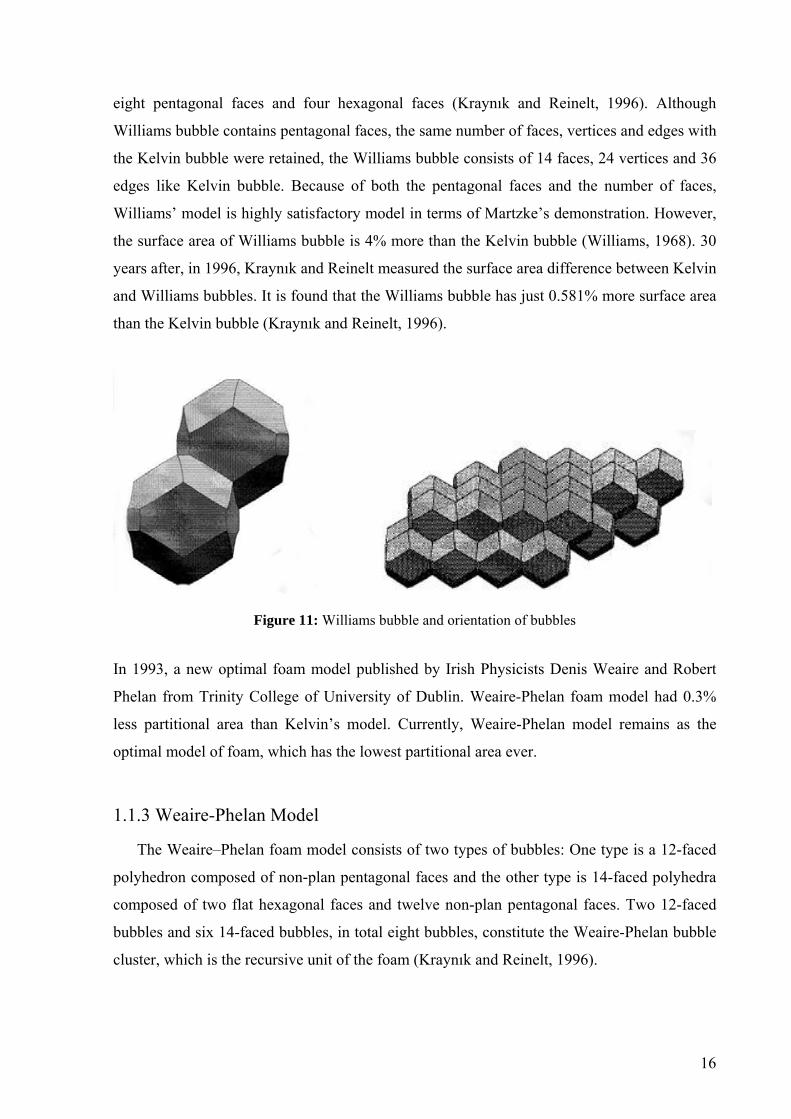
eight pentagonal faces and four hexagonal faces (Kraynık and Reinelt, 1996). Although
Williams bubble contains pentagonal faces, the same number of faces, vertices and edges with
the Kelvin bubble were retained, the Williams bubble consists of 14 faces, 24 vertices and 36
edges like Kelvin bubble. Because of both the pentagonal faces and the number of faces,
Williams’ model is highly satisfactory model in terms of Martzke’s demonstration. However,
the surface area of Williams bubble is 4% more than the Kelvin bubble (Williams, 1968). 30
years after, in 1996, Kraynık and Reinelt measured the surface area difference between Kelvin
and Williams bubbles. It is found that the Williams bubble has just 0.581% more surface area
than the Kelvin bubble (Kraynık and Reinelt, 1996).
Figure 11: Williams bubble and orientation of bubbles
In 1993, a new optimal foam model published by Irish Physicists Denis Weaire and Robert
Phelan from Trinity College of University of Dublin. Weaire-Phelan foam model had 0.3%
less partitional area than Kelvin’s model. Currently, Weaire-Phelan model remains as the
optimal model of foam, which has the lowest partitional area ever.
1.1.3 Weaire-Phelan Model The Weaire–Phelan foam model consists of two types of bubbles: One type is a 12-faced
polyhedron composed of non-plan pentagonal faces and the other type is 14-faced polyhedra
composed of two flat hexagonal faces and twelve non-plan pentagonal faces. Two 12-faced
bubbles and six 14-faced bubbles, in total eight bubbles, constitute the Weaire-Phelan bubble
cluster, which is the recursive unit of the foam (Kraynık and Reinelt, 1996).
16
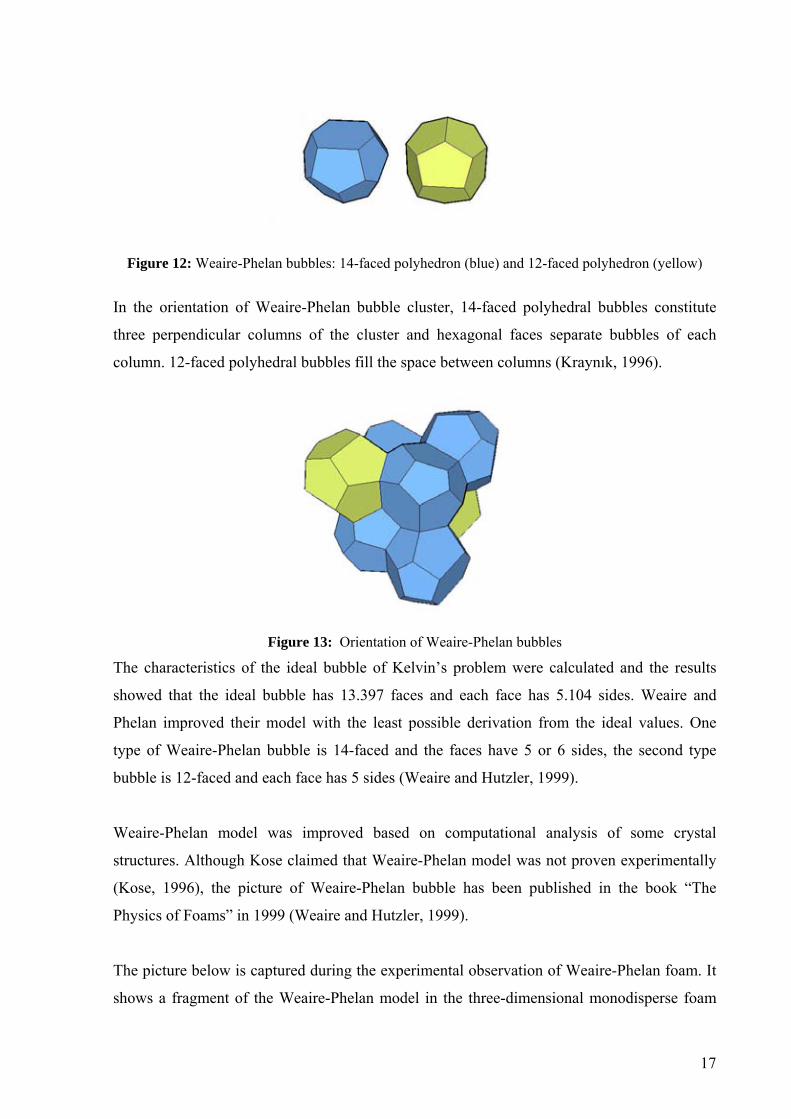
Figure 12: Weaire-Phelan bubbles: 14-faced polyhedron (blue) and 12-faced polyhedron (yellow)
In the orientation of Weaire-Phelan bubble cluster, 14-faced polyhedral bubbles constitute
three perpendicular columns of the cluster and hexagonal faces separate bubbles of each
column. 12-faced polyhedral bubbles fill the space between columns (Kraynık, 1996).
Figure 13: Orientation of Weaire-Phelan bubbles
The characteristics of the ideal bubble of Kelvin’s problem were calculated and the results
showed that the ideal bubble has 13.397 faces and each face has 5.104 sides. Weaire and
Phelan improved their model with the least possible derivation from the ideal values. One
type of Weaire-Phelan bubble is 14-faced and the faces have 5 or 6 sides, the second type
bubble is 12-faced and each face has 5 sides (Weaire and Hutzler, 1999).
Weaire-Phelan model was improved based on computational analysis of some crystal
structures. Although Kose claimed that Weaire-Phelan model was not proven experimentally
(Kose, 1996), the picture of Weaire-Phelan bubble has been published in the book “The
Physics of Foams” in 1999 (Weaire and Hutzler, 1999).
The picture below is captured during the experimental observation of Weaire-Phelan foam. It
shows a fragment of the Weaire-Phelan model in the three-dimensional monodisperse foam
17

and it has been matched by same perspective view of it’s 3D computer based model (Weaire
and Hutzler, 1999).
Figure 14: Experimental observation of the Weaire-Phelan bubble matched by it’s 3D computer based model
Energy levels of the demonstrated models of Kelvin’s problem i.e. Weaire-Phelan model
(A15), Frank-Kasper phase (C15), Kelvin model (bcc) is compared in Table 1. Dry foam
energy is given by,
Esurface=A . γsurface
where γ is the surface tension and the A the surface area. In each case, surface tension is γ=1
and volume of cells is unity (Weaire and Hutzler, 1999). Results, given in per cell, show that
Weaire-Phelan model has the lowest dry foam energy.
STRUCTURE DRY FOAM ENERGYsimple cubic 6.00000fcc 5.34539bcc 5.30628C15 5.32421A15 5.28834
Table 1: Comparison of dry foam energy levels of demonstrated models
In the above table, simple cubic, fcc and bcc denotes the three basic packing types: simple
cubic cubic packing, face centered cubic packing (fcc) and body centered cubic packing (bcc).
The Kelvin model is bcc packing.
18
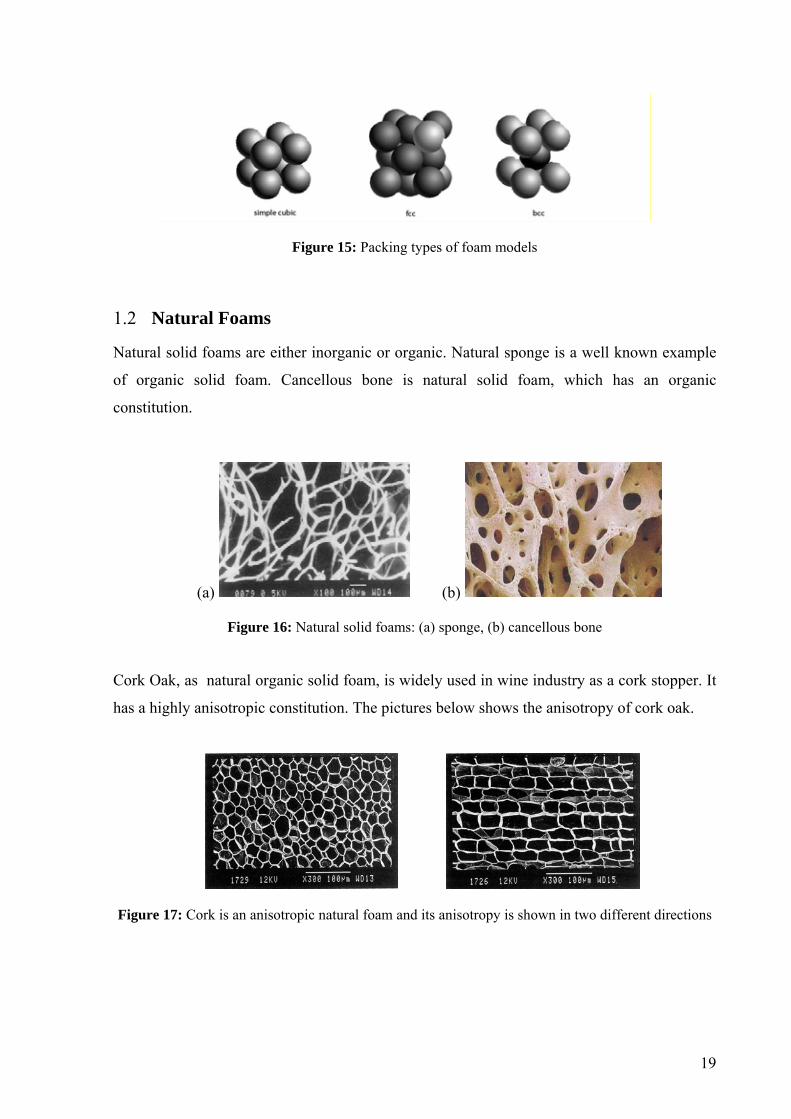
Figure 15: Packing types of foam models
1.2 Natural Foams
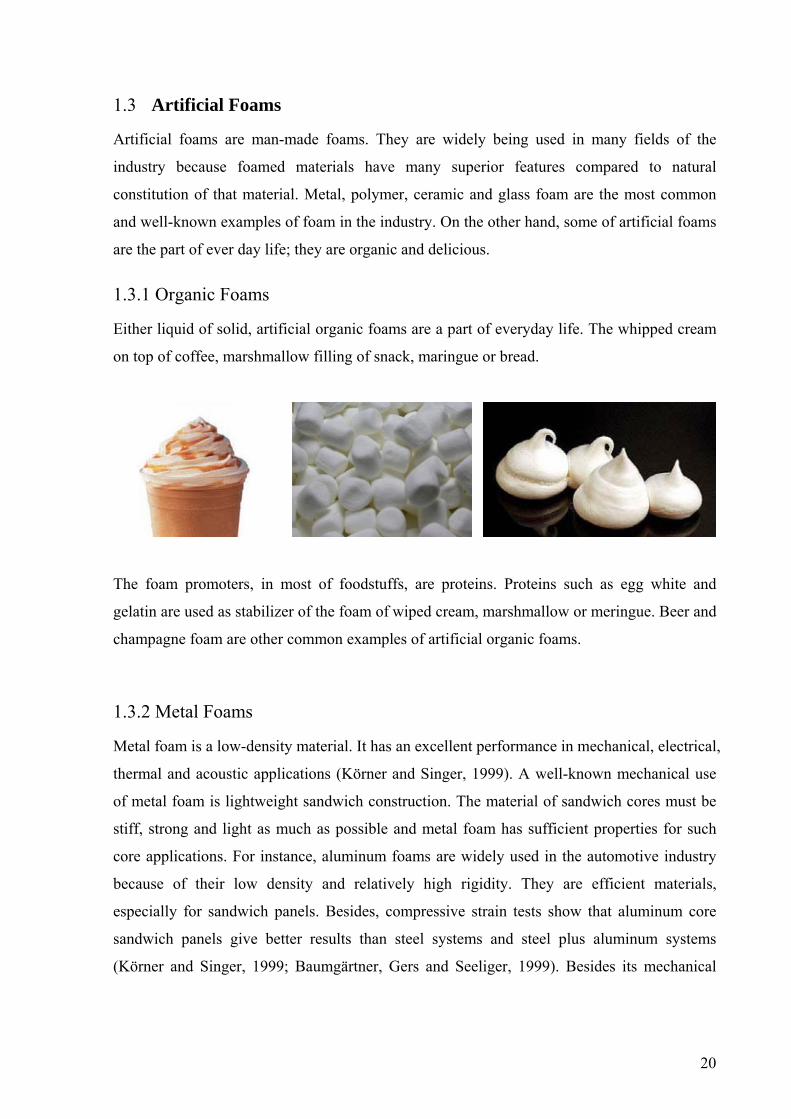
Natural solid foams are either inorganic or organic. Natural sponge is a well known example
of organic solid foam. Cancellous bone is natural solid foam, which has an organic
constitution.
(a) (b)
Figure 16: Natural solid foams: (a) sponge, (b) cancellous bone
Cork Oak, as natural organic solid foam, is widely used in wine industry as a cork stopper. It
has a highly anisotropic constitution. The pictures below shows the anisotropy of cork oak.
Figure 17: Cork is an anisotropic natural foam and its anisotropy is shown in two different directions
19
1.3 Artificial Foams
Artificial foams are man-made foams. They are widely being used in many fields of the
industry because foamed materials have many superior features compared to natural
constitution of that material. Metal, polymer, ceramic and glass foam are the most common
and well-known examples of foam in the industry. On the other hand, some of artificial foams
are the part of ever day life; they are organic and delicious.
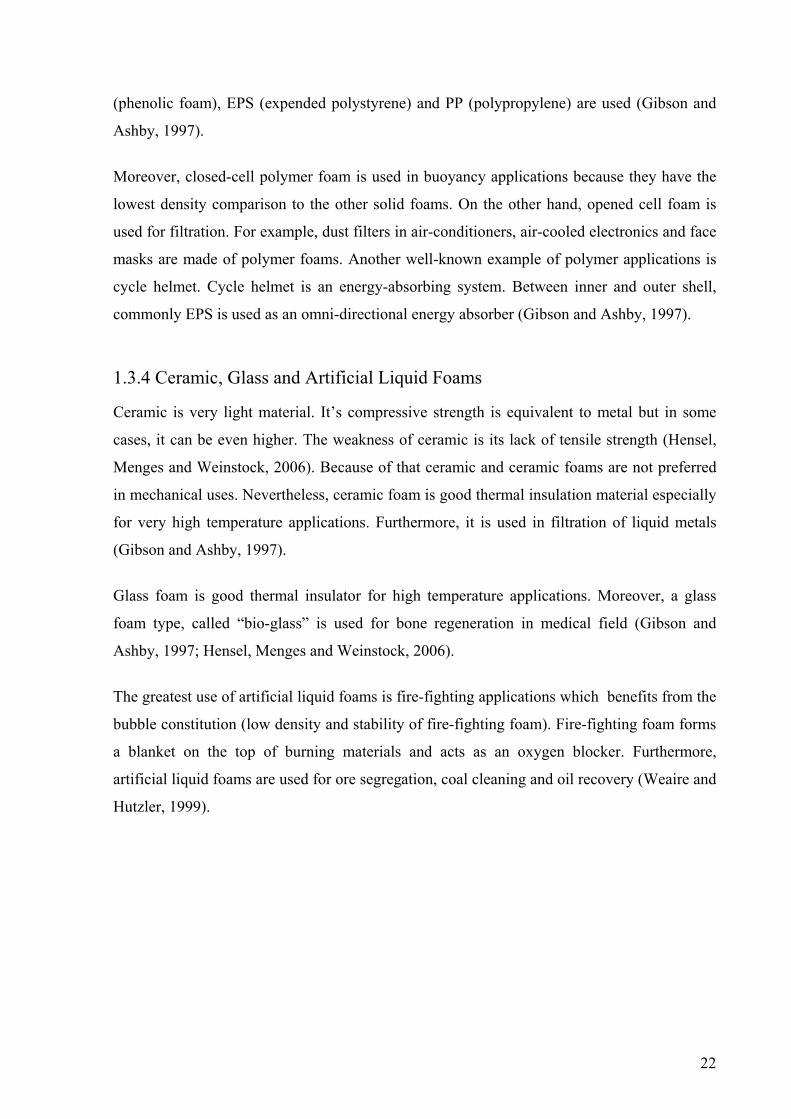
1.3.1 Organic Foams
Either liquid of solid, artificial organic foams are a part of everyday life. The whipped cream
on top of coffee, marshmallow filling of snack, maringue or bread.
The foam promoters, in most of foodstuffs, are proteins. Proteins such as egg white and
gelatin are used as stabilizer of the foam of wiped cream, marshmallow or meringue. Beer and
champagne foam are other common examples of artificial organic foams.
1.3.2 Metal Foams
Metal foam is a low-density material. It has an excellent performance in mechanical, electrical,
thermal and acoustic applications (Körner and Singer, 1999). A well-known mechanical use
of metal foam is lightweight sandwich construction. The material of sandwich cores must be
stiff, strong and light as much as possible and metal foam has sufficient properties for such
core applications. For instance, aluminum foams are widely used in the automotive industry
because of their low density and relatively high rigidity. They are efficient materials,
especially for sandwich panels. Besides, compressive strain tests show that aluminum core
sandwich panels give better results than steel systems and steel plus aluminum systems
(Körner and Singer, 1999; Baumgärtner, Gers and Seeliger, 1999). Besides its mechanical
20

properties, the aluminum foam is a good acoustic damper and thermal insulator and a good
material for high impact energy absorption and applications of buoyancy.
Solid foams are good sound absorbers. Their cellular constitution causes an energy loss in
sound waves with friction during the gas flow within cells. Therefore, metal foams are highly
efficient materials for acoustic damping applications, as well as the other artificial foams
(Körner and Singer, 1999).
Metal foams have high thermal conductivity despite their cellular constitution. Their high
thermal conductivity combined with large internal surface make metal foams efficient
materials for heat exchangers (Körner and Singer, 1999).
Consequently, metal foams possess properties of both cellular solids and metals. Hence, they
have a unique property combination. For instance, metal foams are stiff and lightweight or
stiff and highly thermal conductive. They are efficient materials especially for applications in
which more than one functions is required e.g. high stiffness and acoustic damping, high
stiffness and fire resistance, or thermal stability and acoustic damping.
1.3.3 Polymer Foams
Polymer foams are widely used in many applications of aerospace and maritime industry, as
well as the medical field. They have uniquely combined properties: lightweight, high
flexibility and mechanically strength. It is not possible to find this combination in natural
materials.
Basically, there are two types of polymers in terms of their constitution. Simple polymers are
homogenous and they have similar density and strength in every direction. Complex polymers
are not homogenous. Their production process lets different properties on the surface and in
interior. Complex polymers are suitable for multi-layered applications where each layer has
differentiated function i.e. multi-functional façade systems, which comprise a very strong
transparent film that is water-repellent and self-cleaning surface (Hensel, Menges, and
Weinstock, 2006).
Thermal conductivity of polymer foam is low which makes them good thermal insulation
materials. Insulation of refrigerators is a good example of the thermal application of polymer
foam. In the refrigerator insulation, according to the design life of the machine, mostly PHEN
21
(phenolic foam), EPS (expended polystyrene) and PP (polypropylene) are used (Gibson and
Ashby, 1997).
Moreover, closed-cell polymer foam is used in buoyancy applications because they have the
lowest density comparison to the other solid foams. On the other hand, opened cell foam is
used for filtration. For example, dust filters in air-conditioners, air-cooled electronics and face
masks are made of polymer foams. Another well-known example of polymer applications is
cycle helmet. Cycle helmet is an energy-absorbing system. Between inner and outer shell,
commonly EPS is used as an omni-directional energy absorber (Gibson and Ashby, 1997).
1.3.4 Ceramic, Glass and Artificial Liquid Foams
Ceramic is very light material. It’s compressive strength is equivalent to metal but in some
cases, it can be even higher. The weakness of ceramic is its lack of tensile strength (Hensel,
Menges and Weinstock, 2006). Because of that ceramic and ceramic foams are not preferred
in mechanical uses. Nevertheless, ceramic foam is good thermal insulation material especially
for very high temperature applications. Furthermore, it is used in filtration of liquid metals
(Gibson and Ashby, 1997).
Glass foam is good thermal insulator for high temperature applications. Moreover, a glass
foam type, called “bio-glass” is used for bone regeneration in medical field (Gibson and
Ashby, 1997; Hensel, Menges and Weinstock, 2006).
The greatest use of artificial liquid foams is fire-fighting applications which benefits from the
bubble constitution (low density and stability of fire-fighting foam). Fire-fighting foam forms
a blanket on the top of burning materials and acts as an oxygen blocker. Furthermore,
artificial liquid foams are used for ore segregation, coal cleaning and oil recovery (Weaire and
Hutzler, 1999).
22

2 Case Studies
In this part, the Water Cube and the Symbol Zone of the Expo’70, which are the two physical
examples of two structural types of comparative study, will be discussed and analyzed. Deep
understanding of foam structure of the Water Cube and space frame structure of the Symbol
Zone is aimed to be achieved with these case studies.
2.1 The Water Cube
The Water Cube is the one of the most inspiring projects of recent years. It is huge and
radically different from conventional large span building structures. Because of its foam
structure, it constitutes the point of interest of this study.
2.1.1 Context
The Water Cube rises as a monument of future buildings. It represents current technology and
gives an inspiring impression of future buildings. As a product of advanced structural
engineering and architecture along with a radical design approach, it is one of the most
significant buildings in recent years.
Figure 18: Perspective and façade view of the Water Cube
First of all, the Water Cube is the first and unique example of foam structures at extremely
large scale. There are also other projects referred with the name having a bubble or foam such
as Bubble High Rise which is a concept project for Berlin designed by SMO Architecture &
Arup London in 2002.
23

Figure 19: Perspective view of the Water Cube
But the structure of the building reminds one of two-dimensional wet foam, which consists of
circular bubbles, and it is a highly idealized structural interpretation of foam constitutions in
nature existing mostly in three dimensions as a structure of matter.
Figure 20: Bubble High Rise concept project
Secondly, the design approach of the Water Cube is radically different from the conventional
design approach. Space filling structural constitution in nature constitutes the origin of new
design approach of the Water Cube. In the conventional approach, architectural design is
mostly adopted to structural boundaries, in other words, the load-bearing structure dominates
the building especially in the design of high-rise or large span buildings. But the new design
approach of the Water Cube accepts the structure as an element of architectural design. This
approach is inspired by nature.
24

Figure 21: Rapid prototype models of the Water Cube structure
Structures in nature are part of matters that are homogenously or heterogeneously spread
within composition of the matter such as cancellous bone. The foam structure of cancellous
bone, is also the tissue of the bone; it exactly fills the space within bone boundaries instead of
grown as outer or separate support. The object itself is also the structure.
Thirdly, conventional building structures are composed of beam, column, and slab elements,
etc. All these elements have different cross-sections, dimensions and most importantly
different functions from each other. While columns are vertical load transmitters of load-
bearing system, slabs and beams are the horizontal load transmitters. But the elements of the
Water Cube structure are all the same. Unlike conventional structures, there is neither column
nor beam in the Water Cube.
Figure 22: Inner perspective views of the Water Cube
Moreover, behind the highly random appearance of the Water Cube, it is simply a recursive
structure like other space frame structures. The recursive module of the structure is a bubble
cluster which is designed based on the physical-mathematical model of the most efficient
subdivision of space into equal volume cells (what would the shape of soap bubbles in
25

continuous bubble array foam be), which is the Weaire-Phelan model. The overall structure is
composed of thousands of bubble clusters. On the other hand, beside its structural constitution, the Water Cube is also a new type of
large span building structure. With the largest clear span of 140 m x 120 m, the Water Cube
could be considered as a competitive structure of large span, compared to other large span
building structures such as the space frame. Consequently, the Water Cube is a good example of macro-scale foam structure in terms of
architectural and structural design. Furthermore, the idea of using the most efficient soap
bubble model, which is Weaire-Phelan model, as a basis for the design is a significant
approach regarding the geometric efficiency. Moreover, the structure as a space filling large
span building structure constitutes a convenient statement for comparative efficiency analysis
of foam structures because there are other large span building structures in space filling
structures category such as a space frame. The geometrical and structural constitutions of the Water Cube structure are the focus of this
case study. Understanding the structural constitution behind its random and relatively
complicated appearance and, more importantly, discovering the transition from the theoretical
foam model to the real macro-scale foam structure is the aim of this case study.
2.1.2 Strategy
The case study will be represented in two parts. The structural constitution of the Water Cube
in terms of structural dimensions, dimensions of elements, joints, load-bearing system,
cladding and other properties of the structure in the first part will be focused on. This analysis
will provide deep understanding of the Water Cube structure and it will expose many key
considerations of the transition from theoretical phase to structural phase such as the relation
between the types of joints, stability and shape of the basic recursive units. In the second part, following the same way used in modeling of the Water Cube, a new foam
structure will be modeled based on the case of Water Cube. In this way, the same transition
from the theory to structural design will be passed through and regularities and/or
irregularities, the complexity level of the Water Cube structure and assumptions of the
transition will be exposed. Furthermore, the new foam structure model will be used in the
parametric comparison analysis.
26

Location Beijing,China
Function swimming/aquatic center of Beijing Olympics 2008
Status under construction
Client
Owner
Design
Architecture
Engineering
Contractor
Begin Date
Finish Date
Construction Area
Construction Cost
Structural Type
Structural Material
Architectural Volume
Longest Clear Span Volume
National Swimming Center, Beijing "The Water Cube"
Large Span Polyhedral Space Frame
Steel
177 m x 177 m x 31 m = 971 199 m3
79 532 m2
100 M $
Technical Information
Scope
October,2007
140 m x 120 m x 31 m = 520 800 m3
End of 2003
Ove Arup&Partners Ltd.
Project Information
Beijing State-Owned Assets Management Co.Ltd.
People's Government of Beijing Municipality
Ove Arup&Partners Ltd., CSCEC Shenzhen Design Institute
PTW Architects
China State Construction&Engineering Corporation
27

2.1.3 Description of the Project
Figure 23: Floor plan at ± 0.00 and bird’s eye view of the Water Cube
The Water Cube is 177 m wide, 177 m long and 31m high. It is a large span foam structure
which is also called a polyhedral space frame. Even though, its random appearance, the Water
Cube is a recursive structure. The basic recursive unit of the structure is a bubble cluster
which is designed based on Weaire-Phelan model. A bubble cluster consists of eight bubbles.
There are two types of bubbles in the cluster, in other words, the structure is composed of the
recursive orientation of only two different bubbles.
Figure 24: Top, front, and perspective view of the Water Cube structure module: bubble cluster
28

2.1.4 Load-Bearing System
In the Water Cube structure, the same foam structure is used in both walls and the roof. The
structural system consists of bubble clusters which are made up by steel tubular members.
There is neither a column nor a beam in the entire structural system. While foam structure in
the roof transmits loads horizontally, the same foam structure in the walls transmits loads
vertically.
Largest clear span of the structure is 140 m x 120 m. Structural dept of the outer walls is 3.6
m and structural depth of the roof is 7.2 m. Basically, the structure consists of three parts
(Structural Engineer (1) 2004; Arup 2006; Architecture and Urbanism 2005):
1. Outer flat web frame
2. Inner flat web frame
3. Inner foam structure
Figure 25: (a) outer web frame, (b) foam structure, (c) inner web frame, (d) the Water Cube structure
Figure 26: Perspective views of structural system: outer and inner frame and inner structure
29

Figure 27: The Water Cube structure: Red represents inner web, blue represents outer web and green
is foam structure
The outer frame and inner frames are composed of rectangular steel hollows in many different
dimensions. The web frames provide the perfect prismatic shape of the structure and they
could be also considered as the cutting planes of foam structure (Arup 2006; Architecture and
Urbanism 2005).
Figure 28: Picture of roof nodes during the assembly of the structure
Inner structure is designed based on the Weaire-Phelan foam model. There are around 4000
bubbles in the entire structure and the width of the bubbles is about 7.5 m. Inner structure is
made up of circular steel hollows in various dimensions. Each steel circular hollow is welded
to ball-shaped node joints. Therefore, all connections of the inner structure are rigid (Arup
2006).
30
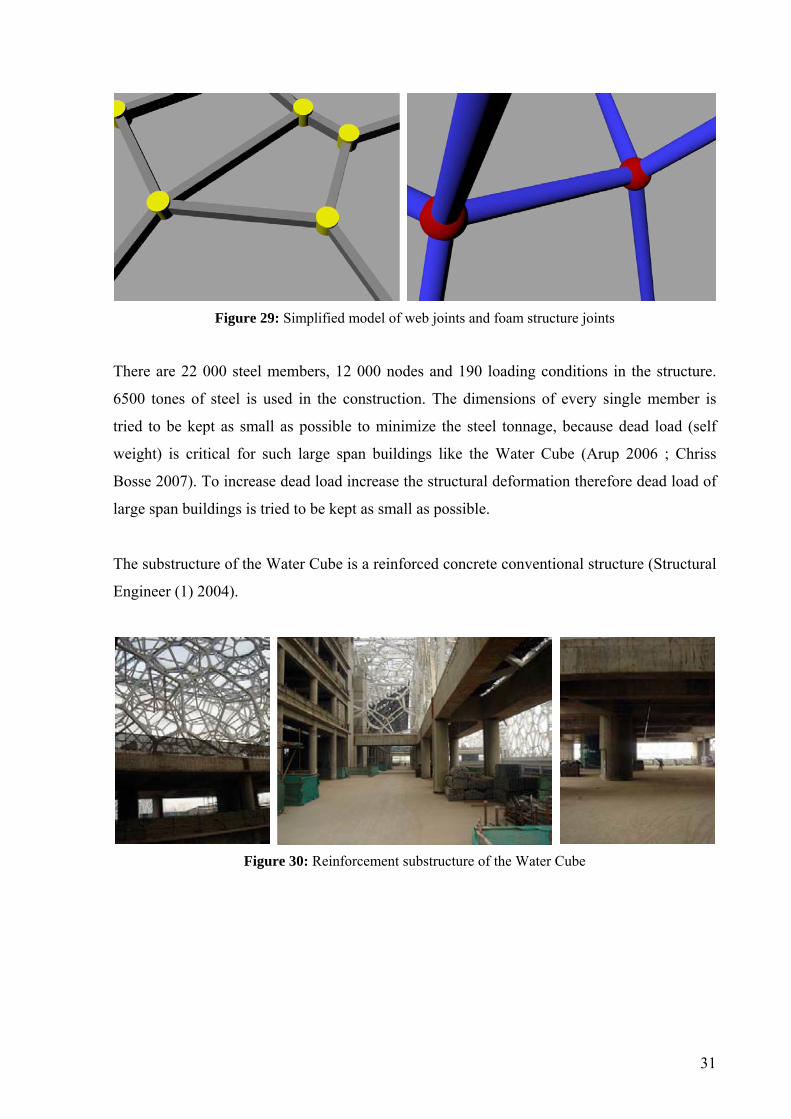
Figure 29: Simplified model of web joints and foam structure joints
There are 22 000 steel members, 12 000 nodes and 190 loading conditions in the structure.
6500 tones of steel is used in the construction. The dimensions of every single member is
tried to be kept as small as possible to minimize the steel tonnage, because dead load (self
weight) is critical for such large span buildings like the Water Cube (Arup 2006 ; Chriss
Bosse 2007). To increase dead load increase the structural deformation therefore dead load of
large span buildings is tried to be kept as small as possible.
The substructure of the Water Cube is a reinforced concrete conventional structure (Structural
Engineer (1) 2004).
Figure 30: Reinforcement substructure of the Water Cube
31

2.1.5 Cladding and Greenhouse Effect
The Water Cube is clad with ETFE foil cushions inside and outside. ETFE (Ethyl Tetra
Fluoro Ethylene) is fluorocarbon based polymer. Thickness of ETFE foil used in the Water
Cube is 2 mm and the largest area clad with ETFE is 9 m wide (Arup 2006; Structural
Engineer (1) 2004).
Compared to glass, ETFE has better insulation properties. Furthermore, ETFE foil has a light
transparency of approximately 94-97 percent of total light and a property of transmission of
83-87 percent UV lights which are better properties than glass properties (Architen 2007).
Therefore, in the Water Cube, the heating and illumination system is designed and
programmed to benefit from natural light and solar energy and in this way, for instance, 30
percent reduction in energy consumption and up to 55 percent saving in lighting energy are
achieved in the leisure pool hall. Pools and interior spaces are heated by the energy trapped by
the building which stands for 20 percent of the total solar energy falling on the building and
this energy would be equivalent to the absorbed energy if the entire roof was covered in
photovoltaic panels (Arup 2006).
Figure 31: ETFE cushions
Above all, ETFE foil weighs only 2 to 3.5 kg/m2 which is just 1% of a glass panel with an
equivalent-size. This is one of the most important reasons of choosing ETFE as cladding of
the Water Cube façade. Because in total 100 000 m2 area from inside and outside is clad with
ETFE and this is a huge area. If the façade area was clad with other alternative material such
as laminated glass, the cladding would highly increase the dead load of the structure and this
would not be an optimal and efficient structural solution for the Water cube.
32

Moreover, ETFE is tough recyclable material, its durability is more than 20 years. It is highly
resistant to the weathering effects of sunlight (Arup 2006).
Figure 32: ETFE cladding of the Water Cube
2.1.6 Structural Optimization and Seismic Design
Structural optimization means determining the structural design variables in the best possible
way to achieve the highest structural performance with given constraints. There are many
optimization types. For instance, size optimization is about sizing the structure and cross-
section area and thickness of the members are the variables of size optimization. Shape
optimization is about finding the shape of the structure which provides the highest
performance to structure. Accordingly, shape boundaries are the variables of this optimization.
And topology optimization is about the distribution of a given amount of material in specified
structural domain.
Structures in nature are great examples of optimized structures. Every structure in nature is
optimized in terms of its material, size, shape or topology. For instance, in natural structures
there is a perfect material distribution related to the stress level of that structural area. That is,
topology optimization (material distribution) achieves higher structural performance with less
material. For example, the cross-section of the stem of palm tree continuously changes along
the stem, and this creates anisotropic properties which provide different stiffness and elasticity
values along the stem’s length and hence the stem could resist dynamic and unpredictable
loads (Hensel, Menges and Weinstock, 2006).
33

Figure 33: The analysis of the bending stress of a palm stem. Each color represents different bending stresses at different cross-sections
Structural optimization is an important issue for industrial structures in order to provide high
structural performance and efficiency. Therefore, optimization process constituted significant
part of structural design process of the Water Cube. The Water Cube structure is optimized
based on the principle of minimizing the structural weight without scarifying strength. During
the optimization process, 22 000 steel members with 190 different load combinations were
checked at five points based on 13 certain equations in the Chinese Structural Code
(Structural Engineer 2006). Special software was developed by Arup which is able to carry
out optimization, structural analysis and design (Arup 2006).
Three main optimization cases were run during the structural design process of the Water
Cube. The first is “strong wall and weak roof” optimization. In this optimization the control
stress levels of wall members are lower than the control stress levels of roof members. The
second is the section type optimization and instead of using standard sections with a
longitudinal stiffener, compact sections are adapted to the structure and plastic properties of
compact sections are utilized in the seismic design process.
34

Figure 34: Asia Seismic Hazard Map
According to Global Seismic Hazard Map, Beijing is in medium-high risk seismic area. One
of the biggest earthquakes of the world in the 20th century occurred in 1976 in Tangshan Shi,
which is just about 200 km away from Beijing with the magnitude of 7.5. Therefore, fulfilling
the seismic requirements of Beijing was an important issue in the design process. Arup for the
first time in the world did inelastic-cross section buckling analysis by using a special
technique developed by themselves and the Water Cube seismic design was accomplished by
adopting the final solution of the analysis to compact sections which have plastic behavior
under level three seismic loading of Beijing. The third optimization case is hybrid
optimization of geometric constitution in which the bending stresses of the members near the
boundary of the walls and the large span roof are decreased (Fu and Gu, 2005; Arup 2006).
35

2.2 Expo’70 “The Symbol Zone”
In many resources, the Symbol Zone of the Expo’70 is given one of the good examples of
large span space frame structures. Furthermore, it has many common futures with the foam
structure of the Water Cube. The common features of the both projects; the Water Cube and
the Symbol Zone will be exposed and the deep understanding of space frame structure of the
Symbol Zone will be provided in the this case study.
2.2.1 Context
Space grid structures are three-dimensional, space-filling and large span building structures.
They are characterized by their large, column-free and two-way spanning structural span.
Other conventional large span building structures i.e. frame and truss structures are called
one-way spanning and their longitudinal span is significantly larger than the latitudinal one.
The larger span is supported by many columns and the column-free span is only in one
direction.
Figure 35: Bird’s eye view of Expo’70 “The Symbol Zone”
The structure of the Symbol Zone of Expo’70 in Osaka, Japan is pointed as a significant
application of space grid structures because of its large span, efficient structural constitution,
assembly and construction (Chilton, 2000). Large span space grid steel structure of the
Symbol Zone is also an excellent example for comparative efficiency analysis of the space-
filling foam structure due to the many reasons.
First of all, Symbol Zone structure as a space grid system is two-way spanning structure like
the Water Cube foam structure. The largest clear span of the structure which is supported on
36
only four columns is 108 m by 75.6 m and it is large enough to compared to the largest span
of the Water Cube which is 140 m by 120 m. Moreover, both structures are made up by steel
tubular members. Secondly, the structure is based on the repetition of one of the most common space grid units
of half-octahedron, which is simply a standard space frame system. At this point, it is
important to have a common and uncomplicated example of space grid systems for the
comparative efficiency analysis of the foam structure because comparison of the foam
structure, as a new one, with a standard, well-known space grid structure demonstrates more
concrete results in terms of structural efficiency than compared to a foam structure with a
special space grid system. Thirdly, the cladding of the Symbol Zone structure is polyester film membrane cushions
which are 1.5 mm and 1.25 mm thick. This is a highly lightweight material for cladding like
the ETFE, the Water Cube cladding. Polyester film membrane was the equivalent material of
ETFE in 70’s. Over the years, with technological developments, ETFE has replaced polyester
film membranes in the construction industry. Consequently, the large span space grid steel structure of Symbol Zone of Expo’70 is a
convenient and successful structural example for the comparative efficiency analysis of the
large span foam structure, though it is an old example, because of their familiarities about
span, structural members, composition and cladding.
2.2.2 Strategy
The case study will consist of two parts. In the first part, the structure will be analyzed in
terms of structural members, joints, the material, the load-bearing system, the assembly
technology and the construction method etc. starting from the basic recursive unit to the entire
structure. This analysis will help to discover the common, similar and different features of the
space-filling foam structure and the half-octahedron space grid structure. Further more, other
special features of the structure will be explored. And also the structure will be observed in
terms of structural optimization, and other design considerations. In the second part, geometrical constitution of the structure will be focused on. The
regularities or irregularities of the structure will be exposed. And the structure will be
modeled for the parametric simulation analysis. Modeling step will provide a deep
understanding of the geometric constitution of the structure.
37

Location Osaka,Japan
Function Festival Zone of the World Exposition in 1970
Status Not exist
Client
Design
Architecture
Engineering
Finish Date
Construction Area
Construction Cost
Structural Type
Structural Material
Total Structural Weight
Architectural Volume
Longest Clear Span Volume
108 m x 75.6 m x 30 m = 244 944 m3
Yoshikatsu Tsuboi
Project Information
The World Expo'70
Kenzo Tange (Design of the Festival Square)
Tomoo Fukuda, Koji Kamiya
6000 tones
Expo'70, Osaka "The Symbol Zone"
Large Span Half-Octahedronal Space Frame
Steel
291.6 m x 108 m x 30 m= 944 784 m3
~32 000 m2
Technical Information
Scope
1969
38
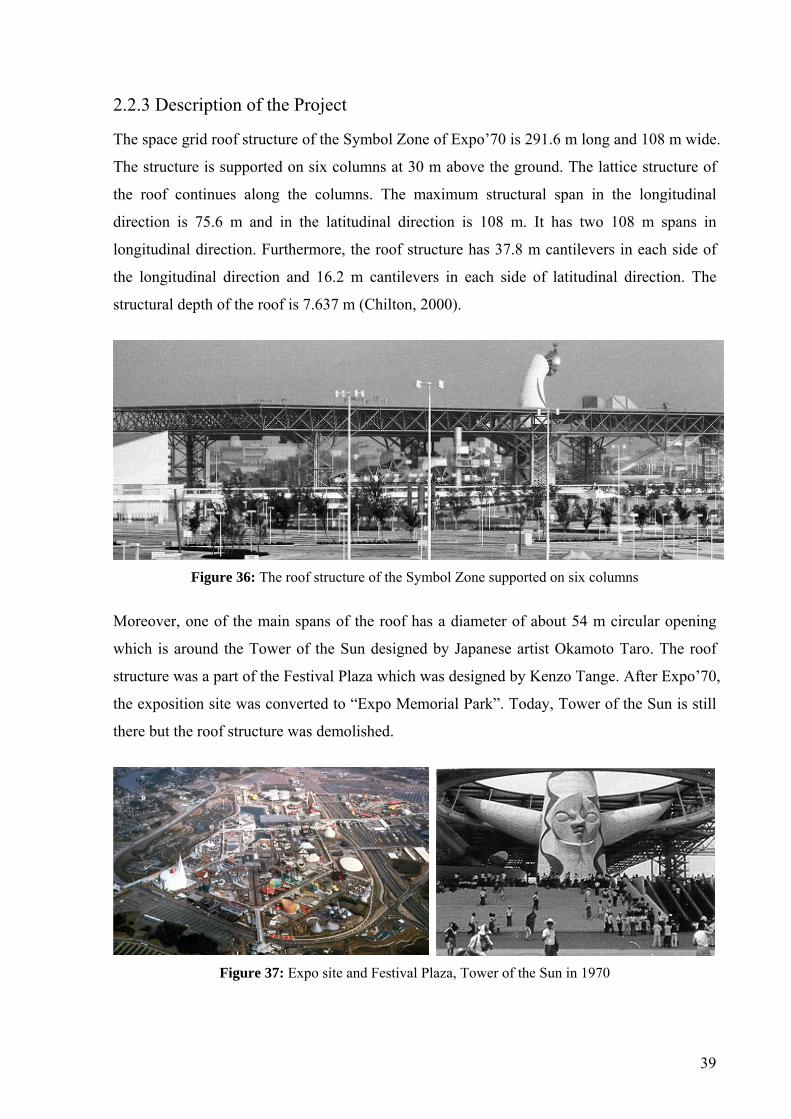
2.2.3 Description of the Project
The space grid roof structure of the Symbol Zone of Expo’70 is 291.6 m long and 108 m wide.
The structure is supported on six columns at 30 m above the ground. The lattice structure of
the roof continues along the columns. The maximum structural span in the longitudinal
direction is 75.6 m and in the latitudinal direction is 108 m. It has two 108 m spans in
longitudinal direction. Furthermore, the roof structure has 37.8 m cantilevers in each side of
the longitudinal direction and 16.2 m cantilevers in each side of latitudinal direction. The
structural depth of the roof is 7.637 m (Chilton, 2000).
Figure 36: The roof structure of the Symbol Zone supported on six columns
Moreover, one of the main spans of the roof has a diameter of about 54 m circular opening
which is around the Tower of the Sun designed by Japanese artist Okamoto Taro. The roof
structure was a part of the Festival Plaza which was designed by Kenzo Tange. After Expo’70,
the exposition site was converted to “Expo Memorial Park”. Today, Tower of the Sun is still
there but the roof structure was demolished.
Figure 37: Expo site and Festival Plaza, Tower of the Sun in 1970
39

Figure 38: Expo site and Expo’70 Festival Plaza area+ Tower of the Sun today
2.2.4 Load-Bearing System
The structural constitution is based on repetition. The basic recursive unit is the half-
octahedron constructed only by using steel circular hollows. The basis of the half-octahedron
is 10.8 m by 10.8 m square. The height of the unit 7.637 m and entire structure is composed
of one row of these units; hence, the structural dept is the same with the height of the
recursive unit. The diameter of the chords is 500 mm and the diameter of the diagonals is 350
mm. The thicknesses of the members are varied from 7.9 mm to 30 mm depending on the
forces the member has to resist (Chilton, 2000).
Figure 39: The recursive unit of the structure: Half-octahedron and the entire structure
40

Figure 40: Space grid structure and it’s half-octahedron repeating units
Lattice structure of the roof continues along the columns. There is a big tubular steel post with
the diameter of 1.8 m in the center. Chords and diagonals of the lattice structure are joined to
this post. And all the columns have the same structural constitution.
Figure 41: The lattice structural constitution of columns
Each hollow member of the roof structure has conical end pieces in the node joints. Steel
chords and diagonals are joined to the steel spherical nodes by 70-188 mm diameter high-
tensile steel bolts. The spherical nodes are cast steel members and their diameter varies from
800 mm to 1000 mm. The entire structure consists of 2272 hollow members and 639 nodes in
total (Chilton, 2000).
41
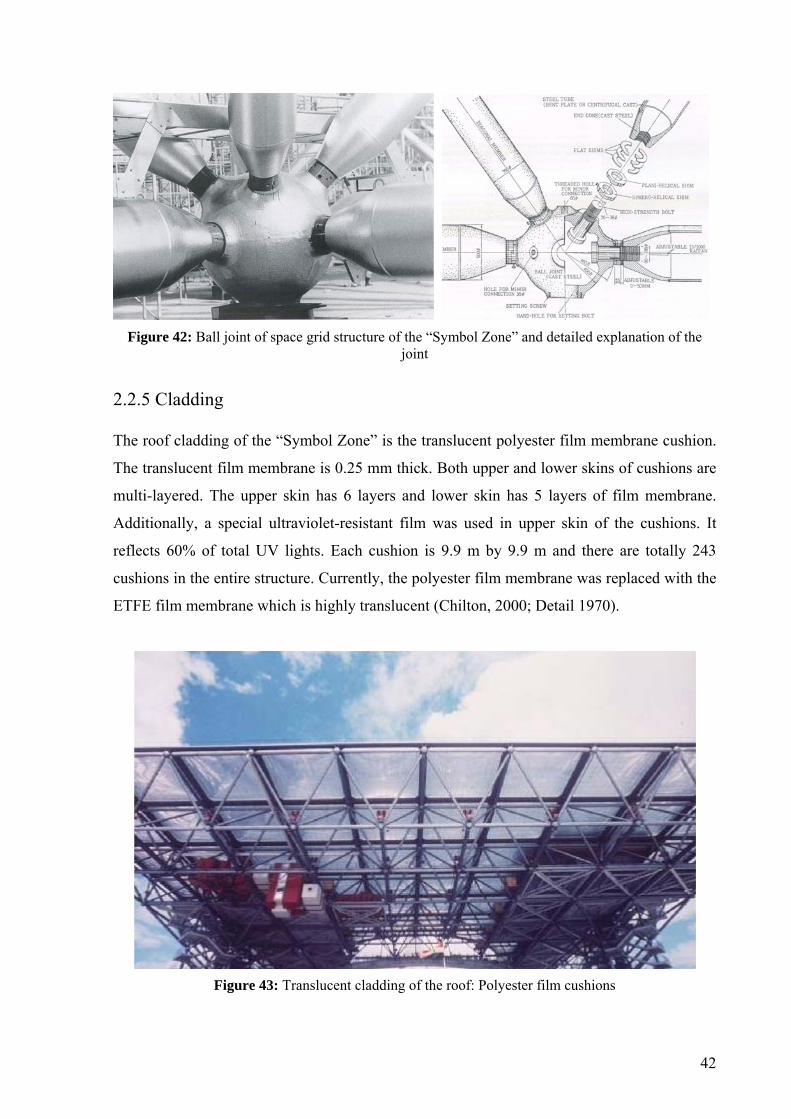
Figure 42: Ball joint of space grid structure of the “Symbol Zone” and detailed explanation of the
joint
2.2.5 Cladding
The roof cladding of the “Symbol Zone” is the translucent polyester film membrane cushion.
The translucent film membrane is 0.25 mm thick. Both upper and lower skins of cushions are
multi-layered. The upper skin has 6 layers and lower skin has 5 layers of film membrane.
Additionally, a special ultraviolet-resistant film was used in upper skin of the cushions. It
reflects 60% of total UV lights. Each cushion is 9.9 m by 9.9 m and there are totally 243
cushions in the entire structure. Currently, the polyester film membrane was replaced with the
ETFE film membrane which is highly translucent (Chilton, 2000; Detail 1970).
Figure 43: Translucent cladding of the roof: Polyester film cushions
42

3 Development of Simulation Model Cases
In this section, a comparative efficiency analysis of two base cases, namely foam and space
frame models, will be handled. Base cases will be built up in the light of structural principles
of the Water Cube and the Symbol Zone of Expo’70. The comparative efficiency analysis will
be made based on these base cases.
Before the comparative analysis, there is a two-step preliminary procedure to match base and
real cases. The first step is to model the load-bearing systems of each one of the base cases for
the simulation program. Loads of buildings are borne, distributed and transferred by load-
bearing structure. In this sense, load-bearing structure is the skeleton of a building and
columns, beams, slabs and cables are its principal members. Load- bearing system model is
the simplified representation of the physical load-bearing structure. For instance, columns or
beams are represented by lines; slabs, deep beams or membranes are represented by planes.
The second step is to choose a common clear span for efficiency comparison. Hence, the
largest clear span of the Water Cube, 140 m by 120 m is selected. In order to achieve the same
span, either some basic modeling tools will be used such as scaling and stretching or some
changes will be made i.e. adding or deleting some units.
Once adequate base case models, which have the same structural principles with the real
structures are developed, comparative efficiency analysis will be made.
3.1 Definition of Parameters
Before starting, it is convenient to define some structural terms principally used in parametric
simulation analyses of this research.
Maximum Allowable Stresses (kN/m2): These are the maximum allowable compression,
tension and shear stress values of the structural material. Each material has different
maximum allowable stresses. For instance, maximum allowable stresses of hot rolled steel are
different from cold rolled steel. In the simulation program BUILD which will be used in this
research, “fc” refers to maximum allowable stresses.
Maximum Stresses (kN/m2): These are the maximum stresses (compression, tension, shear)
occurring in the structure. In the program BUILD, “sigma” refers to maximum stresses in the
structure.
43

Results of simulations are represented as relative stress value which is the ratio of sigma/fc in
BUILD. Maximum stresses in the structure shouldn’t be greater than maximum allowable
stresses. Therefore, relative stress should be less than 1.
Sigma (occured stresses) / fc (max.allowable stresses) < 1
Figure 44: Results of simulation is represented on the left hand site of animator window of BUILD
The result of the simulation is represented with colors. In the color range on the left hand side,
each color represents a certain relative stress value. In top and bottom of the colour range,
maximum relative compression and tension stresses in the structure are given. Other colors
represent relative stress values between the maximums. And the relative stress of each
member is shown with a certain color from range on model depending on the stresses
occurred in that member. In this way, the members which have the maximum stress could be
easily detected.
Structural Loads: Forces that structure is subject to. There are many types of structural loads
such as dead load, live load, wind load, snow load, earthquake loads, thermal loads etc. Load
cases are defined as load combinations and they are used for structural analysis.
Load-Bearing Structure: All load-bearing system members of a physical building which
bear, distribute and transfer loads of building.
44

Load-Bearing System Model: Simplified representation of a load-bearing structure.
Structural Depth: The distance between upper and lower or inner and outer layers of the
member of load-bearing structure.
Dead Load (Structural Weight): Self-weight of the structure.
Structural Weight(kN)
density of structural material (kN/m3)
Volume of material used in structure (m3)
= x
Architectural Volume: The space left between structural boundaries that are used for
functions and installations of the building.
Clear Span: The clear distance between axes of vertical members of load-bearing system.
3.2 Foam Structure
The Water Cube structure seems highly random and complicated. But in fact, it is based on
the repetition of the same structural unit which is the Weaire-Phelan bubble cluster. The
cluster is composed of only two different polyhedral bubbles; hence the Water Cube random
structure consists of only two different bubbles. So, the question is “How the random
appearance could be provided?” In the modeling process, hundreds of bubble clusters are
combined based on the Weaire-Phelan model, then rotated and sliced. The rotation and slicing
provides the random appearance to the structure. But, in fact if the façade is observed
carefully, it can be seen that the structure is not random; it is still the repetition of certain
geometries but eye perceives it as a random structure at first sight.
3.2.1 Weaire-Phelan Bubbles
The Weaire-Phelan foam model is composed of two types of bubbles that are 12-faced bubble
and 14-faced bubble. 12-faced bubble consists of pentagonal faces while 14-faced bubble
consists of two hexagonal and twelve pentagonal faces. In the theory, the edges of the bubbles
are slightly curved but it is assumed that all the edges are straight in application because the
curvatures are so small as to be ignored and inconvenient for space frame structure
applications.
The Weaire-Phelan bubbles could easily be modeled with special programs such as “Surface
Evolver” which is a program for modeling liquid surfaces. Actually, the Weaire-Phelan model
exists in the program as a data file.
45

Figure 45: Weaire-Phelan bubble cluster and sliced cluster which are modeled in Surface Evolver
Another way of modeling Weaire-Phelan bubbles is using the coordinate list of the bubbles’
vertices (steel pillow 2007). The coordinates of the Weaire-Phelan bubbles are given below.
46

First of all, the bubbles were modeled as wire frames based on the coordinates given above,
and then they converted to solid bubbles. Because slicing the solid objects is easier and more
precise than slicing wire frame shapes. Secondly, two 12-faced and six 14-faced bubbles are
combined in order to have a recursive unit of the Water Cube structure which is the Weaire-
Phelan bubble cluster.
Figure 46: Weaire-Phelan bubbles and bubble cluster
3.2.2 Overall Structure
Figure 47: Schematic illustration of geometry modeling process of the Water Cube
47

The modeling process of the Water Cube structure consists of five steps. In the first step,
hundreds of bubble clusters, which are the basic recursive units of the entire structure, are
combined based on the orientation rules of the Weaire-Phelan model. Secondly, the prism
constituted by hundreds of bubble clusters is rotated around prescribed axes. Thirdly, by
slicing of the rotated prism with prescribed horizontal and vertical planes, the basic shape of
the Water cube is reached (Arup 2006). In the fourth step, the sliced prism is also sliced from
inside based on the proportions of the building. In the last step, the solid constitution of the
model is converted to a wire frame and finally the structural model of the Water cube is
achieved.
Based on the research by Weijiang Yu and Yang Zhao, the dimensions of bubbles, the axes
and angles of rotation and the position of the slicing planes are important parameters of the
geometry modeling and geometric optimization of polyhedral space frame structures. They
demonstrated geometrical optimization rules for polyhedral space frames. Moreover, they
asserted that geometric constitution of polyhedral space frame structures determines the basic
dimensions of the building (Yu and Zhao, 2005).
3.2.3 Simplifying and Developing the Base Case Foam Model
The geometric modeling process of the Water Cube is not complicated but high computer
power is needed to be able to do that. After the first trial of modeling, it has been seen that the
computer power currently possessed could not cope with this geometry modeling process.
Therefore, simplifications were to be made. Furthermore, simplifications might make the
simulation analysis less complicated.
First of all, the proportions of the Water Cube were determined. Structural depth of the roof is
referred as X. Then the proportions of the other dimension to the roof depth were determined
it gave these results:
BUILDING PART LENGHT/DEPTH ASSUMPTION 1
WALLS 3.6 m X/2ROOF 7.2 m X
177m ~25X177 m ~25X31 m ~4X140 m ~20X120 m ~16X
ARTCHITECTURAL BOUNDARIES
LARGEST CLEAR SPAN
48

Secondly, the density of the bubble
constitution of the structure was reduced in
order to achieve the new, less dense foam
structure and another simplification was done.
It was assumed that the roof is the half bubble
cluster depth; in other words, 7.2 m assumed as
1/2 bubble cluster unit (BCU).
BUILDING PART LENGHT/DEPTH ASSUMPTION 1 ASSUMPTION 2
WALLS 3.6 m X/2 1/4 BCUROOF 7.2 m X 1/2 BCU
177m ~25X 12½ BCU177 m ~25X 12½ BCU31 m ~4X 2 BCU140 m ~20X 10 BCU120 m ~16X 8 BCU
ARTCHITECTURAL BOUNDARIES
LARGEST CLEAR SPAN
Figure 48: Dimension of the base case foam model
With these simplifications, the bubble density of base case foam model was reduced around
35% compared to the Water Cube structure. The reduction could be calculated roughly this
way: There are 12 rows of red bubbles in the Water Cube structure. In the simplified base
case, there are 8. This is equal to approximately 35% reduction.
49
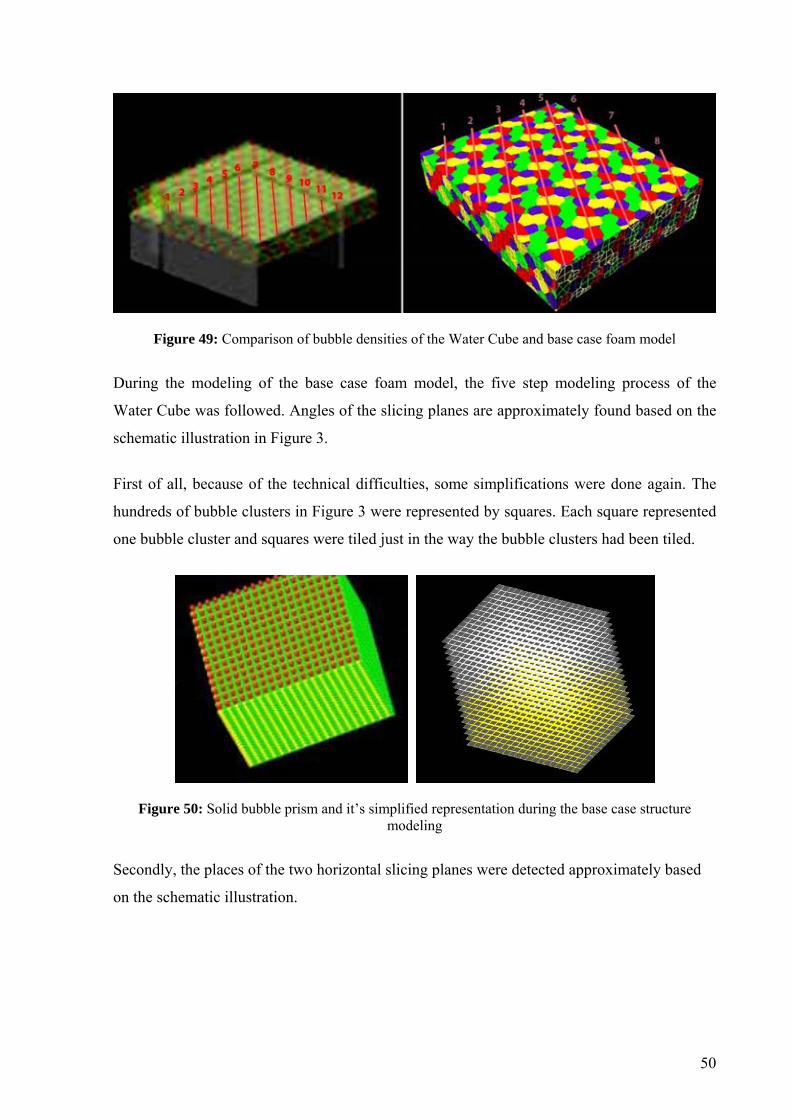
Figure 49: Comparison of bubble densities of the Water Cube and base case foam model
During the modeling of the base case foam model, the five step modeling process of the
Water Cube was followed. Angles of the slicing planes are approximately found based on the
schematic illustration in Figure 3.
First of all, because of the technical difficulties, some simplifications were done again. The
hundreds of bubble clusters in Figure 3 were represented by squares. Each square represented
one bubble cluster and squares were tiled just in the way the bubble clusters had been tiled.
Figure 50: Solid bubble prism and it’s simplified representation during the base case structure modeling
Secondly, the places of the two horizontal slicing planes were detected approximately based
on the schematic illustration.
50

Figure 51: Horizontal slicing planes and their representation in simplified model
Then the squares which are not between the horizontal slicing planes were deleted.
Figure 52: Deletion of the squares which are not in the horizontal borders
Thirdly, the vertical slicing planes were drawn and the squares which are not in the area
bordered by vertical planes were deleted.
Figure 53: Deletion of the squares which are not in vertical borders
51

And finally, each square replaced with a Weaire-Phelan bubble cluster. Afterwards, horizontal
and vertical planes were used again to slice the solid bubbles.
Figure 54: Left: Replacing bubble clusters with squares. Right: Slicing bubbles with vertical and horizontal planes
In the next step, the sliced model which has a perfect prismatic shape was sliced from inside
based on previously defined proportions. Finally, solid bubbles of the model should be
converted to wire frame bubbles which consist of only edges for the simulation process.
Therefore, each edge of the solid bubbles in the model was drawn one by one in order to
achieve the load-bearing system model (Figure 55) and the load-bearing system model was
scaled into its original dimensions which are 140 m x 120 m x 31.
Figure 55: The model consists of sliced solid bubbles
Finally, the wire frame model of the base case foam model was exported from Rhino as .dwg
file which is an AutoCad file format. When the file opened in AutoCad, it was ready to use in
the simulation program. The wire frame model is the load-bearing system model of the base
case foam model.
52

Figure 56: Converting solid bubbles to wire frame bubbles
The load-bearing system model of base case foam model in AutoCad is composed of only
splines and polylines as the simulation program required.
Figure 57: Load-bearing system model of base case foam model in AutoCad
The architectural dimensions of the base case foam model are 143.6 m x 123.6 m x 31m. The
clear span of the base case structure is 140 m by 120 m. The distance between the axes which
pass through from the middle of wall depth is assumed as the span of the structure.
Figure 58: Dimensions of the load-bearing system model of base case foam model
53
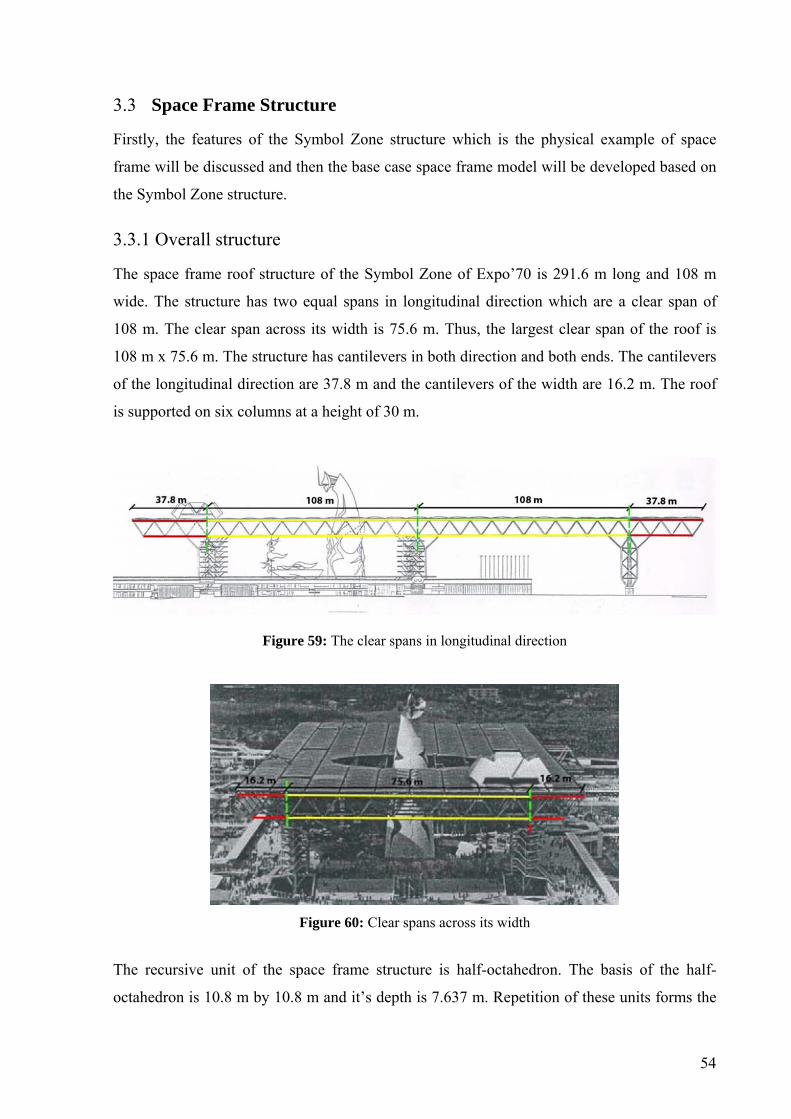
3.3 Space Frame Structure
Firstly, the features of the Symbol Zone structure which is the physical example of space
frame will be discussed and then the base case space frame model will be developed based on
the Symbol Zone structure.
3.3.1 Overall structure
The space frame roof structure of the Symbol Zone of Expo’70 is 291.6 m long and 108 m
wide. The structure has two equal spans in longitudinal direction which are a clear span of
108 m. The clear span across its width is 75.6 m. Thus, the largest clear span of the roof is
108 m x 75.6 m. The structure has cantilevers in both direction and both ends. The cantilevers
of the longitudinal direction are 37.8 m and the cantilevers of the width are 16.2 m. The roof
is supported on six columns at a height of 30 m.
Figure 59: The clear spans in longitudinal direction
Figure 60: Clear spans across its width
The recursive unit of the space frame structure is half-octahedron. The basis of the half-
octahedron is 10.8 m by 10.8 m and it’s depth is 7.637 m. Repetition of these units forms the
54

lattice structure of the roof. The lattice structure continues along the columns. Each column
has a huge, circular hollow post with a diameter of 1.8 m in the center. The posts are
surrounded by the lattice structure.
3.3.2 Developing the Base Case Space Frame Model
The largest span of the Symbol Zone is 108 m by 75.6 m. First of all, load-bearing system
model is drawn based on the exact dimensions of the members and the largest span of the
Symbol Zone structure. However, the cantilevers in both longitudinal and latitudinal
directions are ignored.
Figure 61: Load-bearing system model of the largest span of Expo’70 the Symbol Zone roof structure
In the second step, the system model is scaled in order to equalize the spans to 140 m by 120.
But the structure achieved after scaling has a span of 140 m in longitudinal direction and 98 m
in latitudinal direction because the span ratio of the Symbol Zone is different from the ratio of
required spans. Therefore, in order to achieve a model with clear spans of 140 m by 120 m,
one row of repeating unit of space frame is added to the structure along longitudinal direction
and in this way the span in latitudinal direction is expanded from 98 m to 112 m.
55
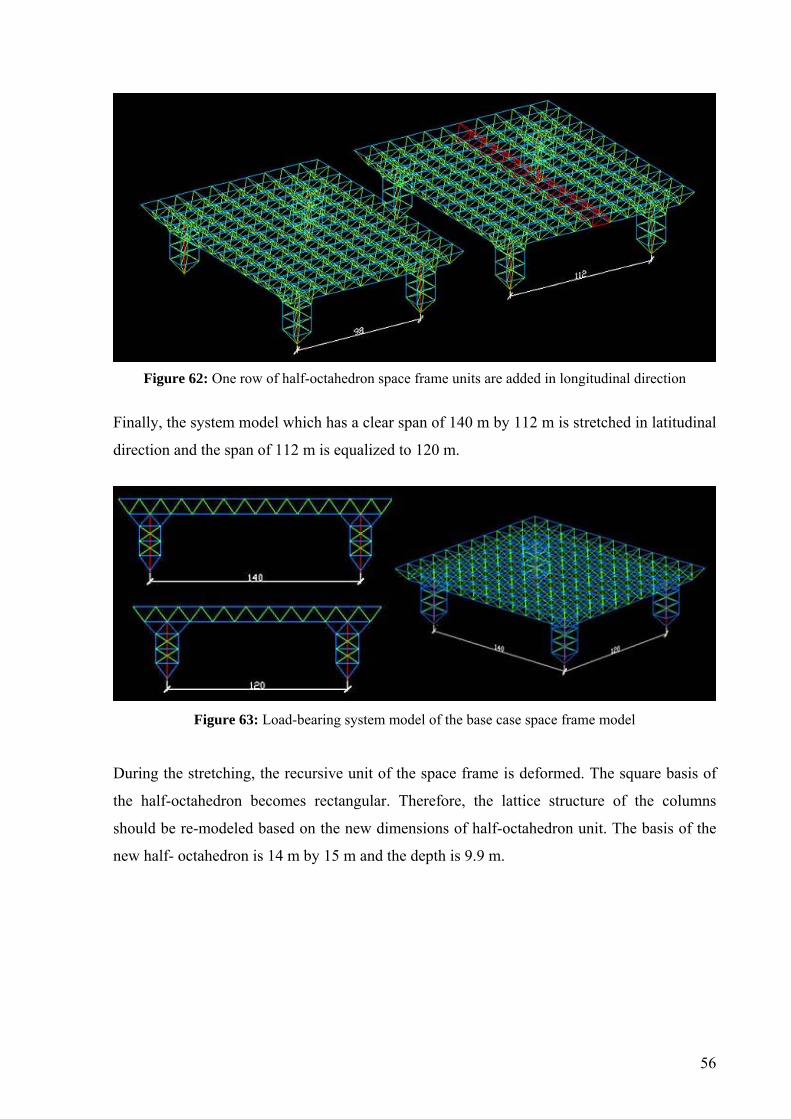
Figure 62: One row of half-octahedron space frame units are added in longitudinal direction
Finally, the system model which has a clear span of 140 m by 112 m is stretched in latitudinal
direction and the span of 112 m is equalized to 120 m.
Figure 63: Load-bearing system model of the base case space frame model
During the stretching, the recursive unit of the space frame is deformed. The square basis of
the half-octahedron becomes rectangular. Therefore, the lattice structure of the columns
should be re-modeled based on the new dimensions of half-octahedron unit. The basis of the
new half- octahedron is 14 m by 15 m and the depth is 9.9 m.
56

Figure 64: The steps of the development of the base case space frame model
Consequently, architectural dimensions of base case space frame model are 182 m x 165 m x
49 m. The clear span of the base case model is 140 m x 120 m.
4 Comparative Study
Parametric comparative efficiency analysis of foam structure will be made in this part based
on the developed structural model cases which are the base case foam model (BCFM) and the
base case space frame (BCSM) model. First of all, two large span building structures will be
discussed: space frame vs. foam structure and the common, distinguishing and competitive
features of the both structures will be exposed. Secondly, parameters of the comparative study
will be explained. In the third part, structural behavior simulations and results of base case
models will be demonstrated and finally results will be discussed.
4.1 Large Span Building Structures: Space Frame vs. Foam Structure
The space frame structure is the most convenient large span structure case for the comparative
efficiency analysis of foam structure for several reasons. First of all, there are many types of
large span building structures such as plate girders and truss systems. In fact, each structural
type is efficient for a certain range. When the span of building is greater than 100 m, the space
frame structure is considerably more efficient than other conventional large span building
structures. Moreover, the comparative efficiency analysis of the foam structure will be done in
this research with base case foam model with a span of 140 m x 120 m which is the largest
span of the Water Cube. Hence, the space frame structure is a highly efficient and convenient
structural type to compare. Secondly, the space frame and the foam structure are both light-
weight structures. Thirdly, and most importantly, the space frame structure is a three-
dimensional structure like the foam structure. Despite the fact that every structure is three
57
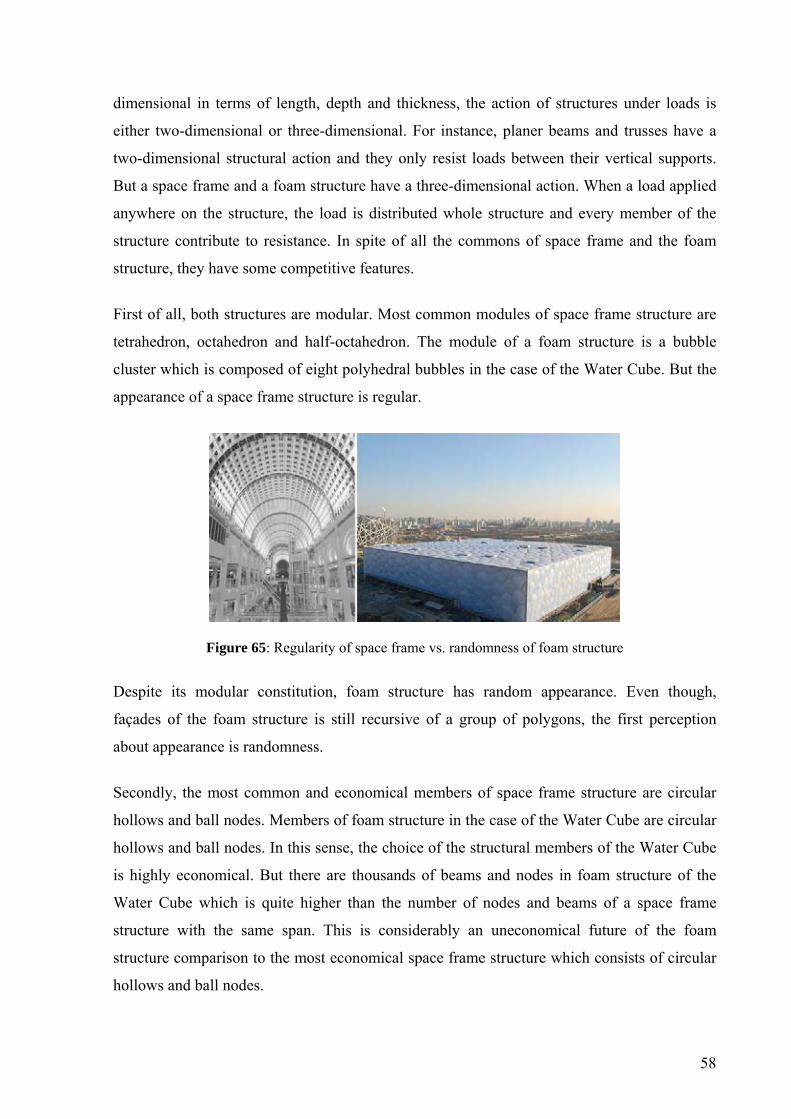
dimensional in terms of length, depth and thickness, the action of structures under loads is
either two-dimensional or three-dimensional. For instance, planer beams and trusses have a
two-dimensional structural action and they only resist loads between their vertical supports.
But a space frame and a foam structure have a three-dimensional action. When a load applied
anywhere on the structure, the load is distributed whole structure and every member of the
structure contribute to resistance. In spite of all the commons of space frame and the foam
structure, they have some competitive features.
First of all, both structures are modular. Most common modules of space frame structure are
tetrahedron, octahedron and half-octahedron. The module of a foam structure is a bubble
cluster which is composed of eight polyhedral bubbles in the case of the Water Cube. But the
appearance of a space frame structure is regular.
Figure 65: Regularity of space frame vs. randomness of foam structure
Despite its modular constitution, foam structure has random appearance. Even though,
façades of the foam structure is still recursive of a group of polygons, the first perception
about appearance is randomness.
Secondly, the most common and economical members of space frame structure are circular
hollows and ball nodes. Members of foam structure in the case of the Water Cube are circular
hollows and ball nodes. In this sense, the choice of the structural members of the Water Cube
is highly economical. But there are thousands of beams and nodes in foam structure of the
Water Cube which is quite higher than the number of nodes and beams of a space frame
structure with the same span. This is considerably an uneconomical future of the foam
structure comparison to the most economical space frame structure which consists of circular
hollows and ball nodes.
58

Thirdly, foam structure provides a very large column-free span which is 140 m by 120 m in
the Water Cube and a space frame as well. The space frame structure is supported by columns
and the place of columns could be anywhere in the space frame structure. In this sense, the
space frame allows many changes in the numbers and location of supports and in openings.
The foam structure roof is supported by foam structure walls along four sides of the building.
Actually, how many of there supporting walls are needed is a question mark. On the other
hand, the supports of the space frame structure are considerably huge. These huge columns
could cause problems in the use of space and façade in buildings. But the supports of foam
structure are walls and façade at the same time and the depth of walls is quite small compared
to the depth of the columns of the space frame structure. For instance, the depth of walls
(supports) is 3.6 m in the Water Cube, but the depth of columns of Expo’70 the Symbol Zone
space frame roof is 10.8 m.
Furthermore, the erection of a space frame is quite easy. All the prefabricated diagonals,
chords and nodes of a space frame could be assembled together at near ground level and after
the entire roof structure is completed, it could be jacked into its final position. On the other
hand, the members of a foam structure are assembled at their final in the construction of the
Water Cube.
Moreover, the most common examples of a space frame structure are the flat structures. As a
matter of fact, complex geometries such as vaults, domes and hyperbolic paraboloids could be
constructed with a space frame. The examples could be the Market hall, Eagle Center, Derby
in UK and the Anoeta Stadium, San Sebastián in Spain. The first and only example of a
macro-scale foam structure, the Water Cube, is a flat structure and it is unknown that if
complex geometries could be constructed with a foam structure.
Finally, the space filling constitution of both structures provides space which could be used
for different issues instead of structural issues. In other words, the space between chords and
diagonals of a space frame of the space between beams of foam structure could be used for
different functions. For instance, the space between the upper and lower layer of space frame
roof structure of a food-processing factory in Nottingham in UK which is 3 m depth is used as
refrigerated stores. Furthermore, the space between the outer and inner layers of the foam
structure of the inner wall is proposed to use as a restaurant space in the Water cube.
59

Moreover, open structural constitution of a space frame and the foam structure is highly
sufficient for a mechanical and electrical installation and it makes installation process easier.
Consequently, both the space frame and the foam structure are modular, lightweight and
three-dimensional large span building structures. The space frame has been being used widely
since the development of the first commercially available space frame structure which is
called MERO in 1943 in Germany. Therefore, the space frame structure has been experienced,
built and improved a lot. On the other hand, the foam structure is a new type a structure. The
first and the only example of a foam structure is the Water Cube. Possibly, in the future, the
foam structure will be improved and different buildings with different geometries will be built
with it. Even though, there has been only one example of foam structure until now, and since
it is a new type of building structure, in this research, the efficiency of a foam structure as a
large span building structure will be tried to be explained by following a certain approach and
comparing it with the most common conventional large span building structure, the space
frame.
4.2 Parametric Comparative Efficiency Analysis
This research is based on the question of “how efficient foam structure is compared to
conventional building structures.” First of all, conventional large span building structures
were explored and it was seen that the space frame is the most efficient structure for a span
lager than 100 m. Furthermore, as you may recall from section 4.1., the space frame is
lightweight and most importantly a three-dimensional structure, which means that it has three-
dimensional structural behavior, like the foam structure. The other conventional large span
building structures were eliminated because they have a two-dimensional structural behavior.
Secondly, efficiency is a term that has wide-spread use in many fields with many different
evaluation criteria. For instance, efficiency from a structural point of view could be in for
categories: material, assembly, cost or geometry efficiency. Therefore, the defining issues of
efficiency were an important step of the work. In this way, the efficiency of BCFM and
BCSM was decided to be analyzed and compared in terms of a structural displacement
because displacement is an important subject of large span structures. The increase in the span
causes an increase in the displacement. Therefore, displacement is always tried to be
minimized in the structural design of large span buildings. One way of minimizing
60

displacement is decreasing the dead load which is self-weight of the structure this means the
dead load is critical for large span buildings. Therefore, the structural weight is a part of the
analysis.
Parameters of the analysis are vertical and horizontal loads. Despite the fact that there are
many vertical and horizontal load types, in this research wind load is chosen as a horizontal
load and the snow load is chosen as a vertical load. On the other hand, the span is kept
constant. The table below shows the parameters of the comparative efficiency analysis.
WEIGHT DEPTHID1 ab Foam Structure 140m x 120m none typicalID1 ac Foam Structure 140m x 120m none extremeID1 ba Foam Structure 140m x 120m typical noneID1 ca Foam Structure 140m x 120m extreme none
ID2 ab Space Frame 140m x 120m none typicalID2 ac Space Frame 140m x 120m none extremeID2 ba Space Frame 140m x 120m typical noneID2 ca Space Frame 140m x 120m extreme none
MAXIMUM DISPLACEMENT
STRUCTURAL CASE
STRUCTURAL TYPE
SPAN (CONSTANT)
VERTICAL LOADS
HORIZONTAL LOADS
Table 2: Parameters of the comparative efficiency analysis of the base case foam model
During the simulation process, the BCFM and the BCSM will be simulated under four
different loading cases in the simulation program. Displacements and self-weights of the
models will be calculated and deformation of the models will be illustrated by the program.
Another important issue of structural efficiency, which is directly affects architectural volume,
is the depth of structure. As the span increases, the structural depth also increases, too. In
large span buildings, even a little decrease in the depth of structure could save hundreds of m3
of space in architectural volume which could be used for mechanical installations of buildings
for instance. Therefore, depth of the BCFM and the BCSM will be compared and architectural
volume of two models will be calculated.
During the simulation process, the BCFM did not full-fill the requirements of stability. The
load-bearing system model of the BCFM was performed in the simulation program many
times. Parameters of the load-bearing system model that could be changed in the simulation
program are cross-sections of structural members, joint types and the parameters of structural
material such as modulus of elasticity (E) and maximum allowable stresses (for tension,
compression and shear). Many different cross-sections were tried and default steel material
61

values in the program were changed but the stability wasn’t achieved. It is known that the
joints of foam structure all are rigid, therefore different joint types weren’t tried. Some
simulation results of the foam model with different cross-sections are given below.
B H DCircular Hollow - - 0.508 0.016
Rectangular Hollow 0.3 0.3 - 0.016Circular Hollow - - 0.508 0.016
Rectangular Hollow 0.4 0.3 - 0.016Circular Hollow - - 0.508 0.016
Rectangular Hollow 0.4 0.4 - 0.016Circular Hollow - - 0.8 0.016
Rectangular Hollow 1 1 - 0.012Circular Hollow - - 0.8 0.02
Rectangular Hollow 1 1 - 0.02Circular Hollow - - 1 0.02
Rectangular Hollow 1 1 - 0.02Circular Hollow - - 1 0.02
Rectangular Hollow 1.2 1.2 - 0.02Circular Hollow - - 1 0.02
Rectangular Hollow 1.3 1.3 - 0.02
STRUCTURAL MEMBER
71.317
RELATIVE STRESS (sigma/fc)
SIZE(m) CROSS-SECTION
TICKNESS(m)
1
2
3
4
7.483
6.360
5.267
2.147
81.248
5
6
1.530
1.483
Table 3: Simulation results of the BCFM with span of 140m x 120m under dead load case
The achieved lowest value of sigma/fc is 1.248. That means maximum allowable stresses in
the BCFM are exceeded 1.248 times by maximum stresses occurred in the foam model. And
this value was achieved with unrealistic cross-sections. Because, first of all, hollows with
around 1 meter dimensions are too big to be beam members of the lightweight structure. For
instance, a diameter of six column hollows of The Symbol Zone of Expo’70 is 1.8 m and this
hollows transfer all the loads of roof structure to the ground. On the other hand, diameters of
chords and diagonals of the Symbol Zone roof are 0.5 m and 0.35 m. Beams of foam structure
are members like chords or diagonals of space frame. Secondly, based on some drawings of
the Water Cube which are provided from Arup, the diameter of structural members should be
round 0.5 m.
In conclusion, the strength of the BCFM could not be achieved. This could happen due to two
reasons: First of all, the BCFM is not an optimized structure. It is assumed that all the beam
members of the inner-structure have the same cross-section and frame members have the
same as well. There are thousands of beam members in the BCFM. The members around the
wall-roof connection are supposed to be the strongest elements which mean that they should
62

have bigger or thicker cross-sections, because maximum stresses of the structure occur there.
Actually, by assuming that all cross-sections are the same, at the same time it is assumed that
all members are as strong as the members around wall-roof connection. So, these assumptions
caused significant increase in self-weight of theBCFM. In fact, all members are neither the
same nor as strong as the members around the corners. As a result, the BCFM definitely needs
to be optimized. Furthermore, it is known that the optimization was an important step of
structural design process of the Water Cube. A special program was developed by Arup for
the optimization process of the Water Cube in order to minimize human errors.
Secondly, the reduction of bubble density might have caused this problem. As you may recall,
during the modeling process of the base case foam structure, the bubble density was reduced
roughly 35%. The results of the simulations show that the problem could not be only about
optimization. If problem was optimization, the cross-sections of structural members should
not be so big as to be unrealistic.
Therefore, the problem about providing the strength of the foam structure seems related with
the bubble density of the structure. In order to clarify and examine the effect of bubble density
reduction, the span of base case foam structure will be reduced 35% as well, and simulations
will be repeated.
4.3 Simulations of Structural Behavior
In this section, the structural behavior of two model cases, base case foam model and base
case space frame model will be simulated by using special structural engineering program.
The scope of simulations and the path followed in analysis of results are explained below.
4.3.1 Context
Dead load is the self-weight of the structure. It is critical for large span building structures
because maximum displacement always occurs in the middle of the span. There are two main
factors which affect the displacement of the structure: the span and the dead load. The
increase in the span and the dead load causes an increase in the displacement hence large span
building structures should be light-weight. The dead load is related to size, material and cross-
sections of structural members. Therefore, minimizing the dead load as much as possible is
one of the important issues of designing large span building structures.
63

The first condition of stability and strength of structures is capability of carrying its self-
weight. When stability and strength is provided under the dead load case, the structure is
developed to resist other load cases such as earthquake loads, snow loads or occupancy loads.
Therefore, in the structural simulation program, the BCSM and the BCFM will be performed
under the dead load case in order to understand either they are stable or their deformation is in
an allowable range.
Sofistik Build is the software used for the simulation of the structures. As complexity level of
the program is not high, architects could easily handle it. The program has an AutoCad
interface and this provides the users with an easy structural modeling process. The structure
could be modeled in various drawing or modeling programs such as AutoCad, 3D Max or
Rhino as long as the file could be saved “.dwg” or “.dxf” formats. “.dwg” and “.dxf ”are the
file formats used by the program AutoCad. And at the end of the modeling process, the file
exported from AutoCad as Sofistik Build file which is basically a coordinate list of structural
members. Another way of modeling the structure in Sofistik Build is entering the coordinates
of each structural member manually. This is a long process and it is just convenient for simple
structures.
4.3.2 Strategy
First of all, the span of BCFM and BCSM will be reduced 35% by using simple scaling tools
of the modeling program. Then, the BCFM will be simulated under its dead load. If the
stability and the strength of the BCFM are provided, the simulation analysis of the BCSM
under the dead load case will be done. The important and sometimes long step of simulation
process is finding the most convenient cross-sections of structural members, if the cross-
sections are unknown. During the first simulation analysis, even though it is assumed that
there are only two different cross-sections in the BCFM, one for inner structure, one for inner
and outer frames, so much time was spent to find the most sufficient cross-sections of
members.
Secondly, structural weight will be calculated. The volume of material used in the models is
calculated automatically by BUILD; it is given in the result screen and BUILD has default
property settings for different types of structural materials such as steel, concrete or timber. In
simulations, either default settings could be used or properties of material are defined before
64

simulations. In the simulations of this research, default material setting will be used for steel
which is hot rolled steel.
Finally, the architectural volume of both models will be calculated. Structural depth will be
significantly influential in this calculation. Furthermore, other load-bearing system members
that are walls of the BCFM and columns of BCSM constitute architectural volume boundaries
of the structures.
4.3.3 Base Case Foam Model Simulation Results
The clear span of the BCFM base case was 140 m by 120 m. But it is decided to be reduced
35% because of the reasons mentioned in section 4.3.1. Therefore the span of the BCFM was
reduced simply by scaling it in to clear span of 91 m x 78 m.
Figure 66: The load-bearing system model of the BCFM with a clear span of 91 m x 78 m
The load-bearing system model of the BCFM consists only of only polylines and each
structural member is represented by a polyline. On the other hand, the BUILD file of the
BCFM consists of a list of structural members and their coordinates. But the load-bearing
system is illustrated based on coordinates and cross-sections of structural members by the
animator of BUILD. Furthermore, results of simulations are shown on this model in Animator
screen.
65
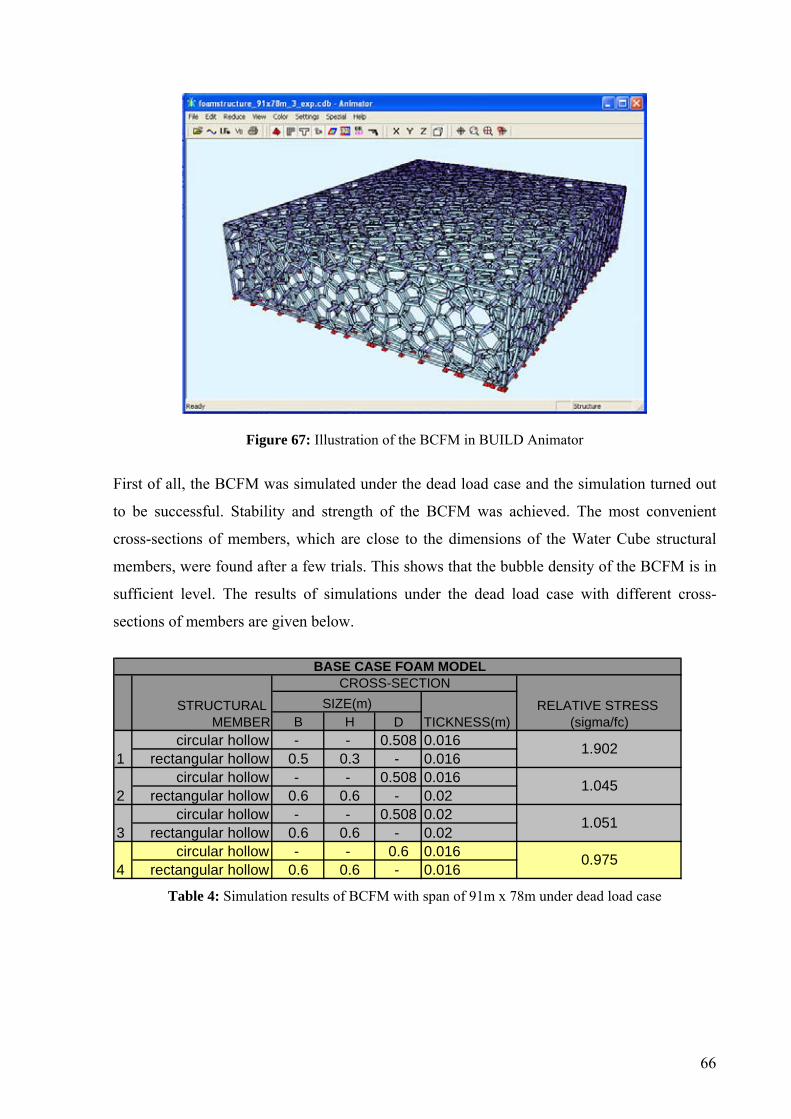
Figure 67: Illustration of the BCFM in BUILD Animator
First of all, the BCFM was simulated under the dead load case and the simulation turned out
to be successful. Stability and strength of the BCFM was achieved. The most convenient
cross-sections of members, which are close to the dimensions of the Water Cube structural
members, were found after a few trials. This shows that the bubble density of the BCFM is in
sufficient level. The results of simulations under the dead load case with different cross-
sections of members are given below.
B H Dcircular hollow - - 0.508 0.016
rectangular hollow 0.5 0.3 - 0.016circular hollow - - 0.508 0.016
rectangular hollow 0.6 0.6 - 0.02circular hollow - - 0.508 0.02
rectangular hollow 0.6 0.6 - 0.02circular hollow - - 0.6 0.016
rectangular hollow 0.6 0.6 - 0.016
RELATIVE STRESS (sigma/fc)
SIZE(m) CROSS-SECTION
TICKNESS(m)
40.975
BASE CASE FOAM MODEL
1
2
3
1.902
1.045
1.051
STRUCTURAL MEMBER
Table 4: Simulation results of BCFM with span of 91m x 78m under dead load case
66

Figure 68: Illustrated simulation result of the BCFM under dead load case
According to the result of simulation, high stresses occurred in the middle of the span. The
maximum stress is occurred in members around the edges where the roof and walls meet.
Therefore, these parts need to be strengthened which is an issue of optimization process.
Figure 69: Exaggerated view of deformation of the BCFM under dead load case and simulation
results
In the table below, all simulation results and the other structural information of the BCFM
are given.
67

~ 93.5 m x 80,5 m x 20 m 91 m x 78 m 4.68 m 0.975 0.072 m 5189 tons
BASE CASE FOAM MODELSTRUCTURAL INFORMATION SIMULATION RESULTS
STRUCTURAL WEIGHT
MAX. DISPLACEMENT
RELATIVE STRESS
ARCHITECTURAL DIMENSIONS
CLEAR SPAN
STRUCTURAL DEPTH of ROOF
Table 5: Structural information and simulation results of the base case foam model
= 51887.558 kN (1 kN = 0.1 ton)
= 5188.7558 ton ≈ 5189 tons
Structural Weight = Material Density x Total Volume of Material
= 78.5 kN/m3 x 660.988 m3
Structural material is hot rolled steel and the density of material is 78.5 kN/m3. The total
volume of the material used in the BCFM based on the calculations in the program is
660.988 m3.
Calculation of structural weight:
4.3.4 Base Case Space Frame Model Simulation Results
First of all, a clear span of base case space frame model was scaled from 140 m by 120 m into
91 m by 78 m, in this way the span was equalized to the clear span of the base case foam
model.
Figure 70: The load-bearing system model of the BCSM with a clear span of 91 m x 78
68

Diameters of each chord, diagonal and column members of Expo’70 the Symbol Zone are the
same but chords and diagonals vary in thickness. This means the Symbol Zone structure is
optimized like the Water Cube structure. But its optimization process mustn’t be complicated
as much as the Water Cube structure and it doesn’t require high computer power.
In the Symbol Zone structure, the diameter of diagonals is 350 mm, the diameter of chords is
500 mm and the diameter of posts is 1.8 m. The thickness of chords and diagonals vary from
7.9 mm to 30 mm. Therefore, an optimum thickness was used for chords and diagonals in the
simulation of the BCSM. The thickness of tubular posts is unknown therefore it was assumed
40 mm.
But before the simulations, all diameters of members should be scaled with the scaling factor
of the BCSM as well. Therefore, firstly, the scaling factor was calculated and then diameters
of all members were scaled.
While developing the BCSM, the longitudinal span of the Symbol Zone was not modified. It
was just scaled firstly from 108 m in to 140 m then from 140 m in to 91 m. That means in
short, the span was scaled from 108 m in to 91 m. And the scaling factor is ~84.26.
In the table below, the original dimensions of cross-sections of the Symbol Zone structure and
cross-section dimensions of BCSM are given.
DIAMETER (mm) THICKNESS (mm)chord 500 7.9 - 30
diagonal 350 7.9 - 30post 18000 40
chord ~420 ~6.7 - 25.3diagonal ~295 ~6.7 - 25.3
post ~15200 ~34
base case space frame model
CLEAR SPAN
108 m x 75.6 m
91 m x 78 m
CROSS SECTIONLOAD-BEARING SYSTEM MEMBERSTRUCTURE
the Symbol Zone
Table 6: Cross-sections of members of Expo’70 the Symbol Zone and the BCSM
69

Figure 71: Illustration of the BCSM in BUILD Animator
The result of the simulation is given in Table 5. The structural performance of the BCSM is
quite good. The desired relative stress achieved with three of the thinnest cross-sections. That
means maximum stresses occurred in the model could be borne by even the members with
small cross-sections. This could happen because of the reason that the BCSM was scaled from
a larger span in to a smaller span and in this way the density of structural units was increased
and this caused higher structural performance.
B H Dchord - - 0.420 0.01
diagonal - - 0.295 0.01column - - 1.520 0.034
BASE CASE SPACE FRAME MODEL
0.615
STRUCTURAL MEMBER
CROSS-SECTION RELATIVE STRESS (sigma/fc)
SIZE(m) THICKNESS(m)
Table 7: Simulation result of the BCSM with span of 91m x 78m under dead load case
According to the result of simulation under the dead load case, the maximum stress occurred
in the BCSM is 101.54 kN/mm2. Higher stresses occur in the middle of the longer span and in
the members around column-roof connection.
70

Figure 72: Illustrated simulation result of the BCSM under dead load case
In the table below, structural information and all simulation results of the BCSM are given.
~ 107 m x 118 m x 31 m 91 m x 78 m 6.43 m 0.615 0.085 m 1200 tons
BASE CASE SPACE FRAME MODELSTRUCTURAL INFORMATION SIMULATION RESULTS
ARCHITECTURAL DIMENSIONS
CLEAR SPAN
STRUCTURAL DEPTH of ROOF
RELATIVE STRESS
MAX. DISPLACEMENT
STRUCTURAL WEIGHT
Table 8: Structural information and simulation results of the BCSM
In the calculation of structural weight of the BCSM, the same calculation process with the
BCFM was followed. The structural material is BUILD program default steel type which is
hot rolled steel.
Calculation of structural weight:
Density of hot rolled steel is 78.5 kN/m3. The total volume of material used in the
BCSM based on the calculations in the program is 152.818 m3.
Structural Weight = Material Density x Total Volume of Material
= 78.5 kN/m3 x 152.818 m3
= 11996.213 kN (1 kN = 0.1 ton)
= 1199.6213 ton ≈ 1200 tons
71

Figure 73: Exaggerated view of deformation of the BCFM under dead load case and simulation
results
4.4 Discussion
Simulation results sets a base case foam model as an inefficient structure in terms of structural
performance and weight while at the beginning, it was expected to develop a BCFM, at least,
with average efficiency. At this point, a discussion of some modeling issues about BCFM and
the base case space frame model may help us better understanding of the results.
Concerning the stability and the strength of BCFM, it was needed to reduce the clear span of
structure by 35%. After reduction, stability and strength was provided by cross-sections which
are quite big relative to cross-sections of the Water Cube members. As a result, BCFM has a
quite high weight. Even though, BCFM is much smaller than the Water Cube, their structural
weights are 5189 and 6500 tons respectively.
Regarding the modeling process of the BCFM, two major problems are encountered. The first
is related to the modeling scale. At the beginning, the same modeling process with the Water
Cube was followed but it required a higher computer processor and ram for simulations.
Therefore, the bubble density of BCFM is reduced leading to a larger mean bubble sizes. As
expected, a completely different façade from the Water Cube was obtained. Moreover, after
slicing, small bubble parts were observed in the façade. Probably, these parts do not have any
72
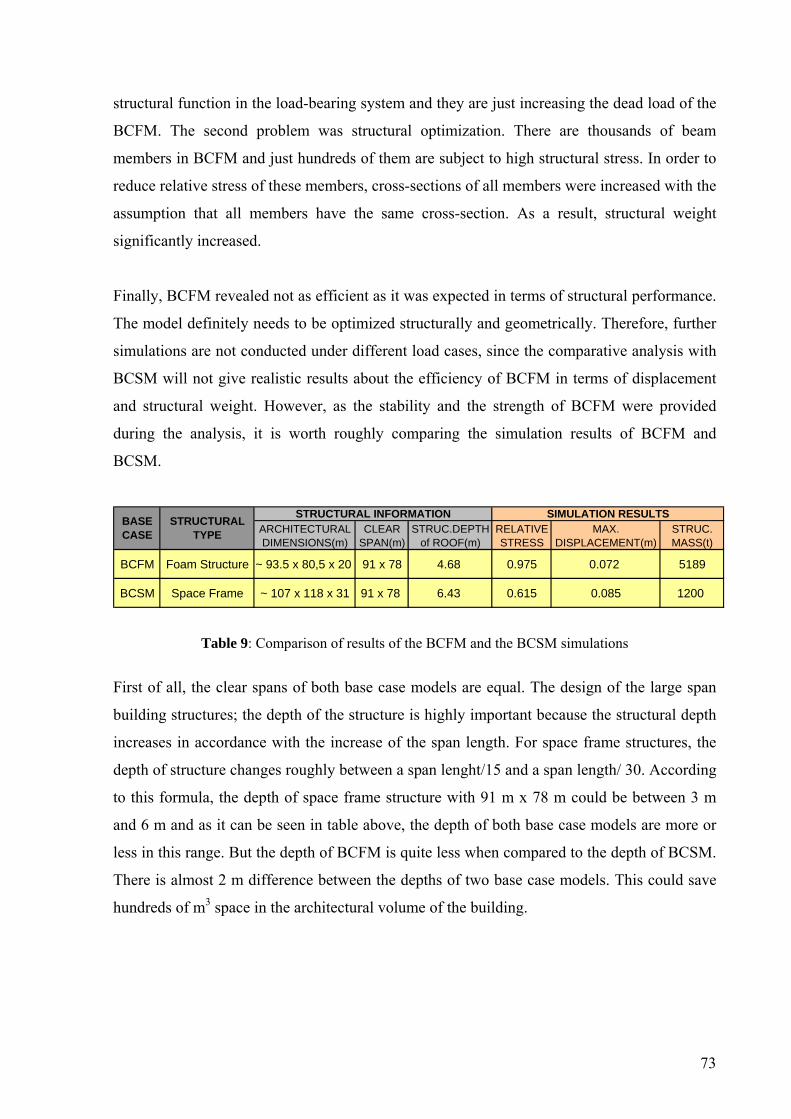
structural function in the load-bearing system and they are just increasing the dead load of the
BCFM. The second problem was structural optimization. There are thousands of beam
members in BCFM and just hundreds of them are subject to high structural stress. In order to
reduce relative stress of these members, cross-sections of all members were increased with the
assumption that all members have the same cross-section. As a result, structural weight
significantly increased.
Finally, BCFM revealed not as efficient as it was expected in terms of structural performance.
The model definitely needs to be optimized structurally and geometrically. Therefore, further
simulations are not conducted under different load cases, since the comparative analysis with
BCSM will not give realistic results about the efficiency of BCFM in terms of displacement
and structural weight. However, as the stability and the strength of BCFM were provided
during the analysis, it is worth roughly comparing the simulation results of BCFM and
BCSM.
BCFM Foam Structure ~ 93.5 x 80,5 x 20 91 x 78 4.68 0.975 0.072 5189
BCSM Space Frame ~ 107 x 118 x 31 91 x 78 6.43 0.615 0.085 1200
BASE CASE
STRUCTURAL TYPE
STRUCTURAL INFORMATION SIMULATION RESULTSARCHITECTURAL DIMENSIONS(m)
CLEAR SPAN(m)
STRUC.DEPTH of ROOF(m)
RELATIVE STRESS
MAX. DISPLACEMENT(m)
STRUC. MASS(t)
Table 9: Comparison of results of the BCFM and the BCSM simulations
First of all, the clear spans of both base case models are equal. The design of the large span
building structures; the depth of the structure is highly important because the structural depth
increases in accordance with the increase of the span length. For space frame structures, the
depth of structure changes roughly between a span lenght/15 and a span length/ 30. According
to this formula, the depth of space frame structure with 91 m x 78 m could be between 3 m
and 6 m and as it can be seen in table above, the depth of both base case models are more or
less in this range. But the depth of BCFM is quite less when compared to the depth of BCSM.
There is almost 2 m difference between the depths of two base case models. This could save
hundreds of m3 space in the architectural volume of the building.
73

Figure 74: Illustration of the foam structure and space frame simple models in structural depth
comparison
If the floor area of both models is 91m x 78m and heights of both models are equal, the saving
in architectural volume (A.V) is 12421.5 m3 is:
A.V.(foam model) = 91 x 78 x (h – 4.68) = 7098 (h – 4.68)
A.V.(space frame) = 91 x 78 x (h – 6.43) = 7098 (h – 6.43)
A.V.(differance) = A.V.(foam model) - A.V.(space frame)
= 7098 x [(h – 4.68) – (h – 6.43)] = 12421.5 m3
Secondly, the maximum displacement of BCFM is 0.072 m while the one of BCSM is
0.085 m. There are two major factors, which increase the displacement: The span and the
structural weight. Spans of the two structures are the same, and the structural weight of
BCFM is quite high. In spite of its high structural weight, maximum displacement of BCFM
is less than the displacement of BCSM.
In conclusion, cross-sections of BCFM’s members are quite big and the relative stress of the
structure is still around 1. Moreover, the structural weight is unrealistically high. Despite all
these facts, as a result of our comparison, it can be said that the BCFM is more efficient than
BCSM in terms of structural depth and the maximum displacement.
74
5 Conclusions and Prospects
In this study, efficiency analysis of foam structure was projected with a parametric
comparative study of foam structure and space frame based on structural models which were
developed based on the real projects the Water Cube and the Symbol Zone of the Expo’70.
These models are the base case foam model (BCFM) and the base case space frame model
(BCSM). Structural behavior of BCFM and BCSM were simulated. Analysis of both model
cases and their structural behavior simulations demonstrated significant facts.
First of all, BCFM is more efficient than BCSM in terms of structural depth which is an
important issue from architectural point of view because the structural depth of large span
structures is significantly high and therefore it is always tried to be minimized. Decrease in
structural depth causes increase in architectural volume which could be used for mechanical
installations or other functions of the large span building. The fact that the structural depth of
BCFM is less than the one of BCSM makes foam structure a preferable structure for large
spans.
Secondly, geometrical and structural optimizations are vitally important structural design
processes for BCFM. During the development process of BCFM, it has seen that rotation axes
and angles and position of slicing planes are critically important, because slight changes in
each of them could change the appearance of foam model and cause to left structurally
unnecessary, quite small recursive units after slicing. Geometrical optimization process
provides efficient composition of the recursive units without any unnecessary small unit
remnants to foam model. Furthermore, structural behavior simulations of BCFM showed that
structural performance of BCFM could be increased by optimizing it structurally. The foam
model consists of thousands of beam members and structural weight of the foam model could
be significantly reduced by structural optimization. BCFM is a model simply composed of
thousands of recursive bubble units which definitely needs to be optimized structurally and
geometrically.
Finally, for further researches, the answer of the question that what kind of shapes could be
built with foam structure is still unknown. The both BCFM and BCSM developed in this
study are flat structures. There are many example of space frame structure with different
shapes such as vaults, domes and hyperbolic paraboloids. Constructability of curved shapes
with foam structure could be examined in further researches.
75

Moreover, even thought foam structure basically is just a three-dimensional structure
composed of recursive bubble units, the geometrical design concerns such as rotation axes,
slicing plane positions, density of recursive units of the structure is critically important for
foam structure. Therefore, the importance and relationship between geometrical design
concerns of the foam structure could be demonstrated in a research which could be a
geometrical design guideline for it.
76

Bibliography
AISC. Steel Construction Manual. USA:AISC. ISBN 156424055X Architecture Australia (2006). “Engineering The Water Cube.” Architecture Australia July/August 2006. Arup Consulting Engineers, Designers, Planners and Project Managers www.arup.com A+U (2005). “Future Structures&Materials: PTW Architects+CSCEC+Design+ARUP National Swimming Center.” Architecture and Urbanism 01/2005 Bradshaw, R. (2002). “Special Strcutures:Past, Present, and Future.” Journal of Structural Engineering 128:6/2002. Chilton, J. (2000). Space Grid Structures. Oxford, UK: Architectural Press. ISBN 0 7506 3275 5 Detail (1970). “Bauten der Weltausstellung in Osaka.” Detail 5/1970, 1019-1024. Eggen, A. P., Sandaker, B.,N. (1995). Steel, Structure and Architecture. Whitney Library of Design/New York: USA: Watson-Guptil Publications. ISBN 0-8230-5020-3 El-Sheikh, A. (1996). Engineering Structures 22/2000,1070-1085. El-Sheikh, A. (2) (1996). “Development of a New Space Truss System.” Journal of Constructional Steel Research 37:3/1996, 205-227. “Future Structures & Materials PTW Architects+ CSCEC +Design +ARUP National Swimming Center.” Architecture and Urbanism 1/2005,124-129. Fu, X., Gu, L., Yang, X., Yu, W. (2005). (Only Abstract) “Structural Design Optimization of National Swimming Center Watercube.” Jianzhu Jiegou Xuebao (Journal of Building Structure) 26/2005, 13-19+26. Gibson, L. J., Ashby, M. F. (1997). Cellular Solids: Structure and Properties. Cambridge, UK: Cambridge University Press. ISBN 0 521 49560 1 Hensel, M., Menges, A., Weinstock, M. (2006). “Self-Organisation and Materail Constructions.” Techniques and Technologies in Morphogenetic Design (Weinstock, M.). London,UK: John Wiley&Sons Ltd. 34-41. ISBN 13-9780470015292 Hoke, JR. (2000). Architectural Graphical Standards. New York,USA:John Wiley&Sons,Inc. ISBN 0-471-34816-3 Kose, K. (1995).: “3D NMR Imagining of Foam Structures.” Journal of Magnetic Resonance Series A118/1995, 195-201. Kraynık, A., Reinelt, D. (1996).: “Linear Elastic Behavior of Dry Soap Foams.” Journal of Colloid and Interface Science 181/1996, 511-520. Schulitz, H., Sobek, W., Habermann, K. Steel Construction Manual. Munich:Germany: Institute für Internationale Architektur-Dokumentation GmbH. ISBN 3-7643-6181-6
77

Structural Engineer(1) (2004). “Beijing’s Water Cube of Breathtaking Bubbles.” The Structural Engineer 82:11/2004, 14-16. Structural Engineer(2) (2004). “Beijing Water Cube-The IT Challenge.” The Structural Engineer 82:13/2004, 23-26. Structural Engineer (2006). “Analysing Beijing’s Water Cube.” The Structural Engineer 83:3/2006, 26. Weaire, D., Hutzler, S. (1999). The Physics of Foams. New York, USA:Oxford Universty Press. ISBN 0-19-850551-5 William, T. (1887). “On the Division of Space with Minimum Partitional Area.” The London, Edinburgh and Dublin Philosophical Magazine 24/1887, 503-518. Williams, R. E. (1968). “Space Filling Polyhedron: It’s Relation to Aggregates of Soap Bubbles, Plant Cells, and Metal Crystallites.” Science 161:3838/1968, 276-277. Yu, W., Zhao, Y., Gu, L., Fu X., Dong, S. (2005). (Only Abstract) “Optimization od Geometric Constitution of New Polyhedron Spatial Frames.” Jianzhu Jiegou Xuebao (Journal of Building Structure) 26:6/2005, 7-12. Yu, W., Wang W., Gu L., Zhao, Y., Fu, X., Dong, S. (2005). (Only Abstract) “Study on Basic Cells of New Polyhedron Spatial Frames.” Jianzhu Jiegou Xuebao (Journal of Building Structure) 26:6/2005, 1-6. Zhao, Y., Wang, W., Xing, L., Fu, X., Gu, L., Dong, S. (2005). (Only Abstract) ”Experimental Study on Reinforcing Moment Connections for Square Steel Tubes in National Swimming Center.” Jianzhu Jiegou Xuebao (Journal of Building Structure) 26:6/2005, 45-53+63. Arup Web (2007). http://www.arup.com/eastasia/project.cfm?pageid=1250. Last visited in June 2007. Steel Pillow (2007). http://www.steelpillow.com/polyhedra/wp/wp.htm. Last visited in June 2007. Structurae (2007). http://en.structurae.de/structures/data/photos.cfm?ID=s0015480. Last visited in June 2007. Chris Bosse (2007). http://www.chrisbosse.de/. Last visit in June 2007 Architen (2007). http://www.architen.com/. Last visit in May 2007.
78
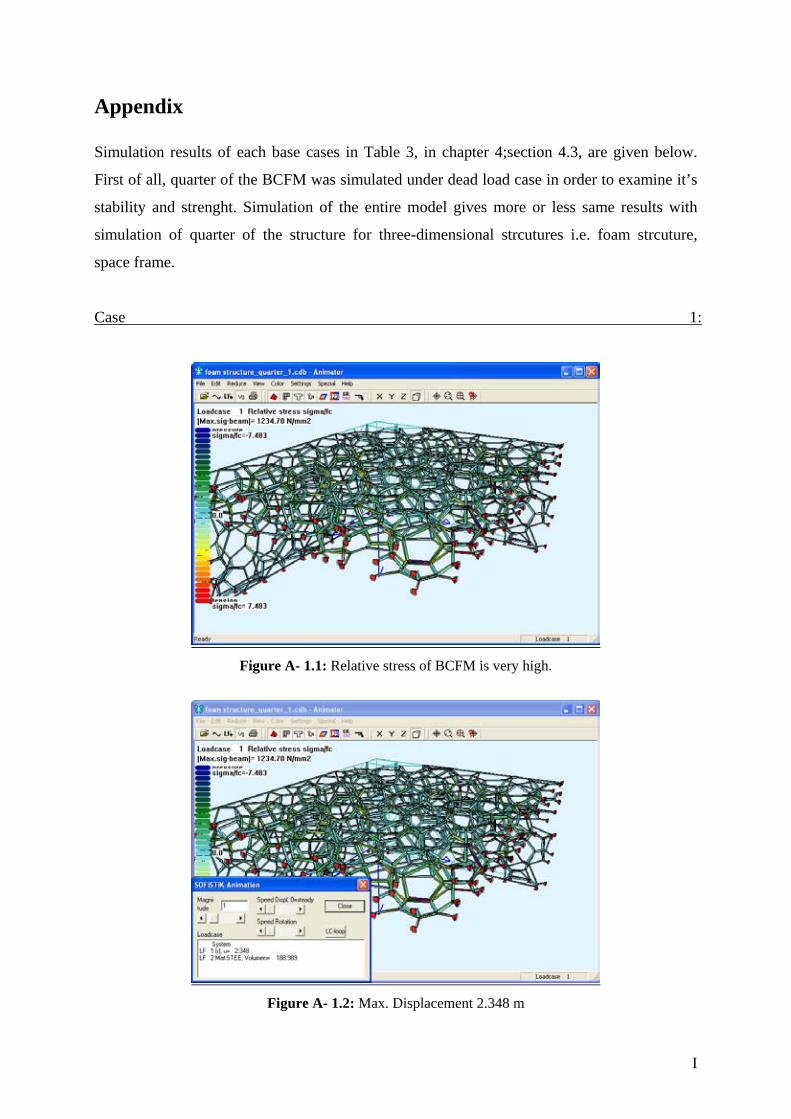
Appendix Simulation results of each base cases in Table 3, in chapter 4;section 4.3, are given below.
First of all, quarter of the BCFM was simulated under dead load case in order to examine it’s
stability and strenght. Simulation of the entire model gives more or less same results with
simulation of quarter of the structure for three-dimensional strcutures i.e. foam strcuture,
space frame.
Case 1:
Figure A- 1.1: Relative stress of BCFM is very high.
Figure A- 1.2: Max. Displacement 2.348 m
I

Case 2:
Figure A- 2.1: Relative stress was decreased but it is still high
Figure A- 2.2: Max. displacement is 2.144 m, it is also decreasing
II

Case 3:
Figure A- 3.1: Relative stress is still greater than 1
Figure A- 3.2: Max. displacement was decreased to 1.685 m
III
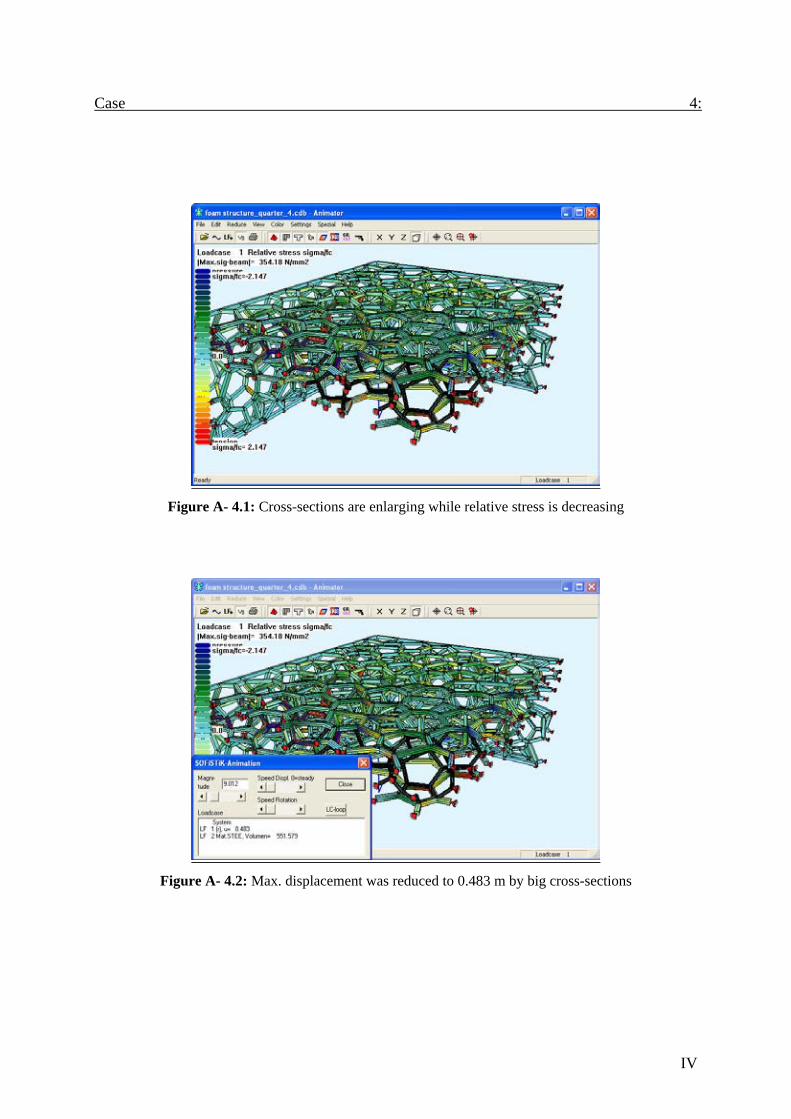
Case 4:
Figure A- 4.1: Cross-sections are enlarging while relative stress is decreasing
Figure A- 4.2: Max. displacement was reduced to 0.483 m by big cross-sections
IV

Case 5:
Figure A- 5.1: Max. stresses occurred in structure are decreasing
Figure A- 5.2: Displacement is very small
V

Case 6:
Figure A- 6.1: Relative stress is decreasing slowly
Figure A- 6.2: Displacement is very small because structural members are quite big
VI

Case 7:
Figure A- 7.1: Relative stress is around 1
Figure A- 7.2: Displacement is too small because structural members are quite strenght
VII

Case 8:
Figure A- 8.1: The lowest relative stress achieved during simulation anlyses.
Figure A- 8.2: Displacement is unknown, max. stresses of BCFM are increasing related with
increasing dead load.
VIII

Simulation of base case foam model with span 140 m by 120 m were done under dead load
case. But this simulations weren’t used in comparison. Cross-sections of members used in
simulation are given below.
B H Dchord 0.500 0.03
diagonal 0.350 0.03column 1.8 0.05
SPACE FRAME BASE CASE with span of 140 m x120 m
0.925
STRUCTURAL MEMBER
CROSS-SECTION RELATIVE STRESS (sigma/fc)
SIZE(m) THICKNESS(m)
Figure B-1: Relative stress of base case space frame model is less than 1. Stability and strength of structure was provided under dead load case.
Figure B-2: Displacement of BCSM around 20 cm
IX