Embed Size (px)
Citation preview
FEDERATED NATIONAL(NASDAQ: FNHC)22ND ANNUAL CFANY INSURANCE INDUSTRY CONFERENCE
March 19, 2018
SAFE HARBOR STATEMENTSafe harbor statement under the Private Securities Litigation Reform Act of 1995:Statements that are not historical fact are forward-looking statements that are subject to certain risks and uncertainties that could cause actual events andresults to differ materially from those discussed herein.The risks and uncertainties include, without limitation, risks and uncertainties related to estimates, assumptions and projections generally; the nature of theCompany’s business; the adequacy of its reserves for losses and loss adjustment expense; claims experience; weather conditions (including the severity andfrequency of storms, hurricanes, tornadoes and hail) and other catastrophic losses; reinsurance costs and the ability of reinsurers to indemnify the Company;raising additional capital and our potential failure to meet minimum capital and surplus requirements; potential assessments that support property and casualtyinsurance pools and associations; the effectiveness of internal financial controls; the effectiveness of our underwriting, pricing and related loss limitationmethods; changes in loss trends, including as a result of insureds’ assignment of benefits; court decisions and trends in litigation; our potential failure to payclaims accurately; ability to obtain regulatory approval applications for requested rate increases, or to underwrite in additional jurisdictions, and the timingthereof; inflation and other changes in economic conditions (including changes in interest rates and financial markets); pricing competition and other initiativesby competitors; legislative and regulatory developments; the outcome of litigation pending against the Company, and any settlement thereof; dependence oninvestment income and the composition of the Company’s investment portfolio; insurance agents; ratings by industry services; the reliability and security of ourinformation technology systems; reliance on key personnel; acts of war and terrorist activities; and other matters described from time to time by the Companyin releases and publications, and in periodic reports and other documents filed with the United States Securities and Exchange CommissionIn addition, investors should be aware that generally accepted accounting principles prescribe when a company may reserve for particular risks, includingclaims and litigation exposures. Accordingly, results for a given reporting period could be significantly affected if and when a reserve is established for acontingency. Reported results may therefore appear to be volatile in certain accounting periods.Readers are cautioned not to place undue reliance on these forward-looking statements, which speak only as of the date on which they are made. We do notundertake any obligation to update publicly or revise any forward-looking statements to reflect circumstances or events that occur after the date the forward-looking statements are made.
2
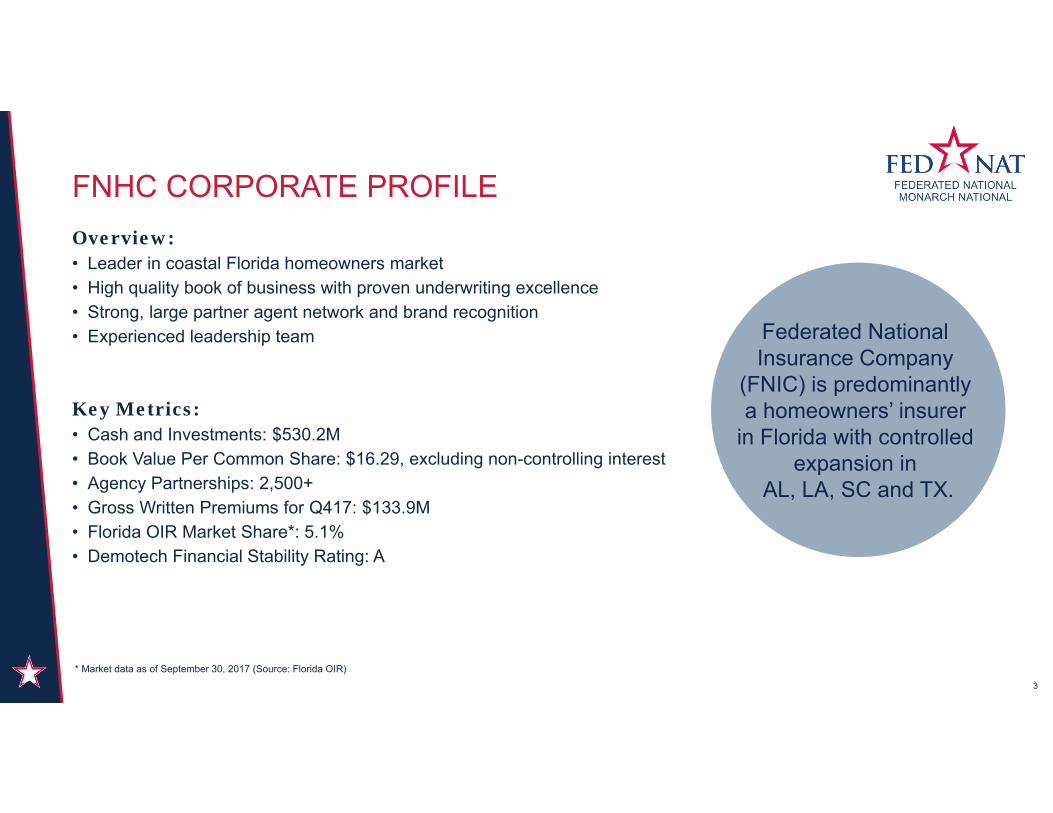
FNHC CORPORATE PROFILEOverview:• Leader in coastal Florida homeowners market• High quality book of business with proven underwriting excellence• Strong, large partner agent network and brand recognition• Experienced leadership team
Key Metrics:• Cash and Investments: $530.2M • Book Value Per Common Share: $16.29, excluding non-controlling interest• Agency Partnerships: 2,500+• Gross Written Premiums for Q417: $133.9M • Florida OIR Market Share*: 5.1%• Demotech Financial Stability Rating: A
3
Federated National Insurance Company
(FNIC) is predominantly a homeowners’ insurer
in Florida with controlled expansion in
AL, LA, SC and TX.
* Market data as of September 30, 2017 (Source: Florida OIR)

LONG-TERM TRACK RECORD OF BOOK VALUE GROWTH
$10.70 $11.70
$13.22 $14.13
$14.88 $15.54
$16.22 $16.86
$17.56 $17.92 $17.72
$16.25 $16.54 $16.97
$15.98 $16.29
$0.00
$2.00
$4.00
$6.00
$8.00
$10.00
$12.00
$14.00
$16.00
$18.00
$20.00
Q1-14 Q2-14 Q3-14 Q4-14 Q1-15 Q2-15 Q3-15 Q4-15 Q1-16 Q2-16 Q3-16 Q4-16* Q1-17 Q2-17 Q3-17** Q4-17
4
* Impacted by Hurricane Matthew** Impacted by Hurricane IrmaSource: Company Filings and SNL FinancialNote: Based on GAAP financial information

• Top five position in attractive Florida market
• Favorable track record of GWP
• Significant opportunity to expand market share and diversify book
• Recent refocus on homeowners market
• Industry experience and market savvy executive team
INVESTMENT CONSIDERATIONS
5
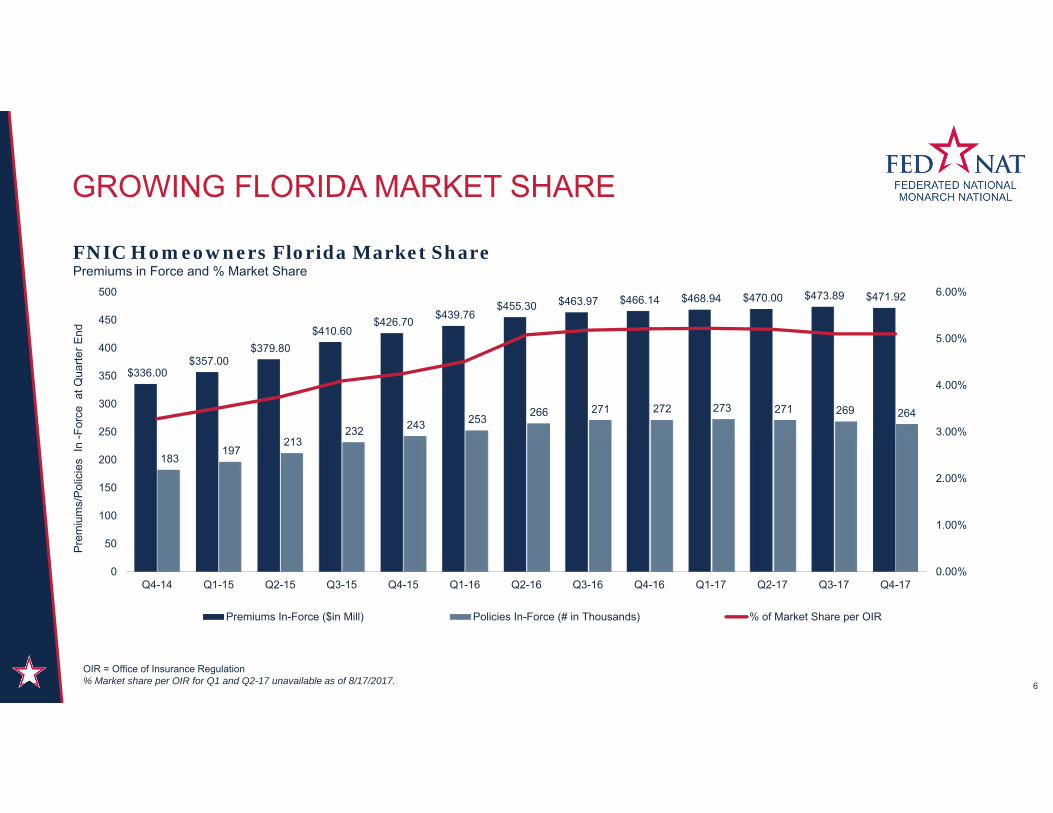
GROWING FLORIDA MARKET SHARE
6
OIR = Office of Insurance Regulation% Market share per OIR for Q1 and Q2-17 unavailable as of 8/17/2017.
$336.00 $357.00
$379.80 $410.60
$426.70 $439.76 $455.30 $463.97 $466.14 $468.94 $470.00 $473.89 $471.92
183 197
213 232 243 253 266 271 272 273 271 269 264
0.00%
1.00%
2.00%
3.00%
4.00%
5.00%
6.00%
0
50
100
150
200
250
300
350
400
450
500
Q4-14 Q1-15 Q2-15 Q3-15 Q4-15 Q1-16 Q2-16 Q3-16 Q4-16 Q1-17 Q2-17 Q3-17 Q4-17
Prem
ium
s/Po
licie
s In
-For
ce a
t Qua
rter E
nd
FNIC Homeowners Florida Market SharePremiums in Force and % Market Share
Premiums In-Force ($in Mill) Policies In-Force (# in Thousands) % of Market Share per OIR
Source: Florida OIR
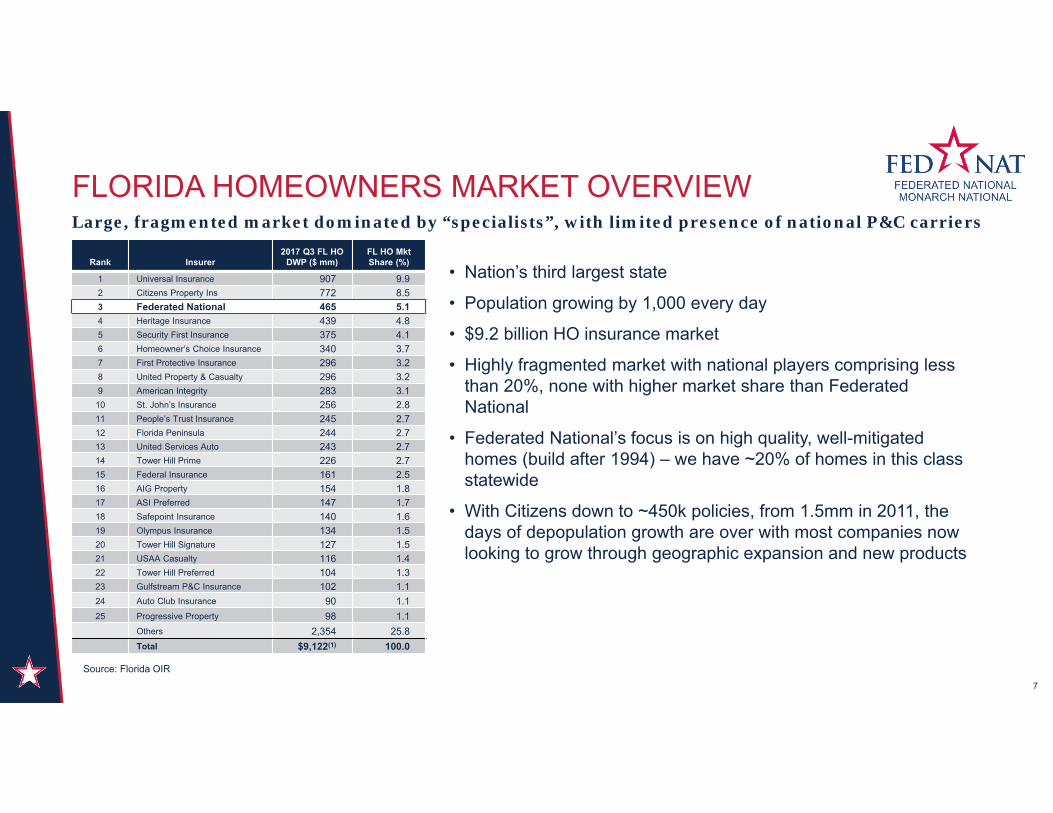
FLORIDA HOMEOWNERS MARKET OVERVIEW
• Nation’s third largest state
• Population growing by 1,000 every day
• $9.2 billion HO insurance market
• Highly fragmented market with national players comprising less than 20%, none with higher market share than Federated National
• Federated National’s focus is on high quality, well-mitigated homes (build after 1994) – we have ~20% of homes in this class statewide
• With Citizens down to ~450k policies, from 1.5mm in 2011, the days of depopulation growth are over with most companies now looking to grow through geographic expansion and new products
Large, fragmented market dominated by “specialists”, with limited presence of national P&C carriers
7
Rank Insurer 2017 Q3 FL HO
DWP ($ mm)FL HO Mkt Share (%)
1 Universal Insurance 907 9.92 Citizens Property Ins 772 8.5 3 Federated National 465 5.1 4 Heritage Insurance 439 4.8 5 Security First Insurance 375 4.1 6 Homeowner’s Choice Insurance 340 3.7 7 First Protective Insurance 296 3.2 8 United Property & Casualty 296 3.2 9 American Integrity 283 3.1
10 St. John’s Insurance 256 2.8 11 People’s Trust Insurance 245 2.7 12 Florida Peninsula 244 2.7 13 United Services Auto 243 2.7 14 Tower Hill Prime 226 2.7 15 Federal Insurance 161 2.5 16 AIG Property 154 1.817 ASI Preferred 147 1.7 18 Safepoint Insurance 140 1.6 19 Olympus Insurance 134 1.5 20 Tower Hill Signature 127 1.521 USAA Casualty 116 1.4 22 Tower Hill Preferred 104 1.3 23 Gulfstream P&C Insurance 102 1.124 Auto Club Insurance 90 1.1 25 Progressive Property 98 1.1
Others 2,354 25.8 Total $9,122(1) 100.0
DISTRIBUTION NETWORK & STRATEGY
• All policies are generated on a voluntary basis
• Partnership with 2,500+ partner agents– One of a few selected Florida homeowners’ insurance companies appointed to write voluntary business through
Allstate & GEICO Florida partner agents
• Focus on higher value, better mitigated properties– Emphasize properties which typically have more advanced wind / hurricane mitigation features and lower
All Other Peril (non-catastrophe) losses, all of which mitigate expected losses– Underwrite every risk to maintain our quality book of business
• Trust-based model– FNIC has achieved its growth by winning the business at the point of sale, not on price, but because our partner
insurance agents trust us with their clients based on past experience
8
Federated National is a partner of choice in the upper segment of the Florida homeowners market.
DISCIPLINED UNDERWRITING APPROACH
• Focus on higher value properties with an emphasis on more advanced wind / hurricane mitigation features and lower All Other Peril (non-catastrophe) losses
• Utilize a front-end Generalized Linear Model (“GLM”) to calculate each risk’s associated expenses, CAT and non-CAT exposure, cost of capital and risk concentration in order to determine a pass/fail position on all new business quoting – Manual reviews of every bound risk to ensure accuracy of information– Regulatory approved use of our GLM-based analytics to provide a layer of pre-binding portfolio optimization
management
• Rates on every policy a function of FNIC’s historical loss experience, concentration of risk, expenses and current market conditions – All risks are subject to an annual review to ensure low performing risks are not offered a renewal
• Business written by MNIC utilizes a similar disciplined approach as its policies are also underwritten by FedNat Underwriters (“FNU”), the Company’s wholly owned MGA
Federated National’s meticulous underwriting approach allows the Company to manage its current exposures while profitably underwriting new risks.
Underwriting Process Overview
9
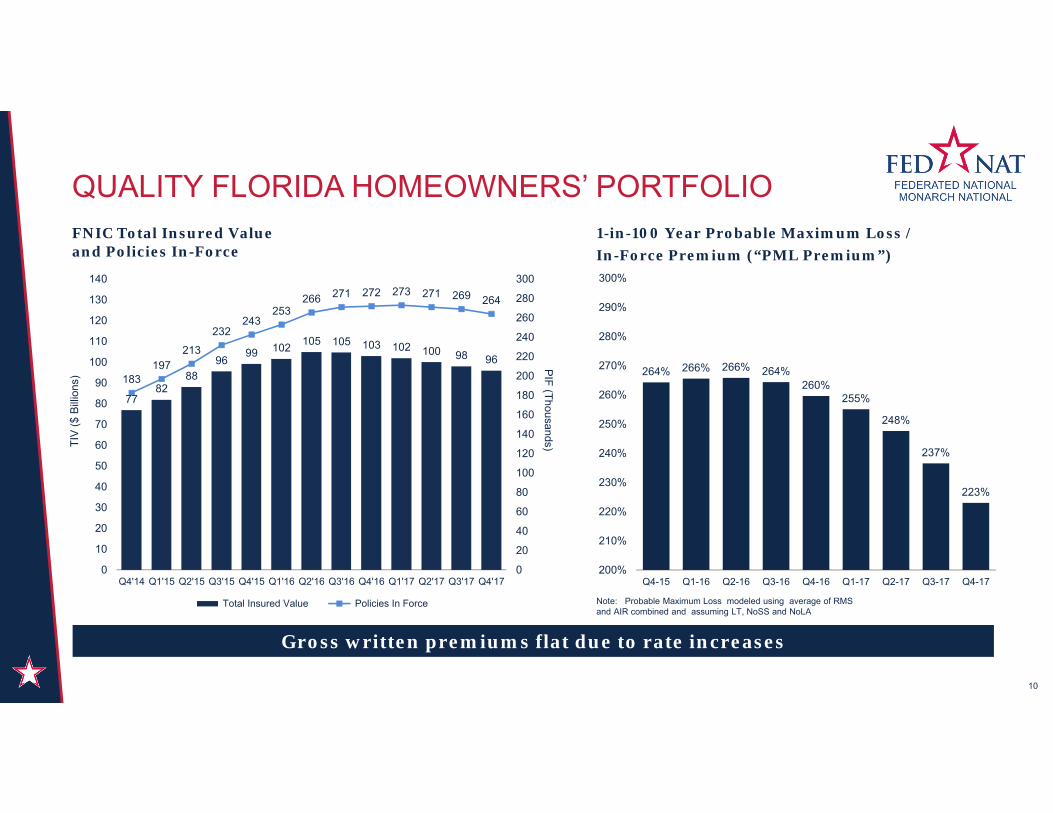
QUALITY FLORIDA HOMEOWNERS’ PORTFOLIO
10
1-in-100 Year Probable Maximum Loss /In-Force Premium (“PML Premium”)
Note: Probable Maximum Loss modeled using average of RMS and AIR combined and assuming LT, NoSS and NoLA
FNIC Total Insured Value and Policies In-Force
7782
8896
99 102 105 105 103 102 100 98 96
183197
213232
243253
266 271 272 273 271 269 264
0
20
40
60
80
100
120
140
160
180
200
220
240
260
280
300
0
10
20
30
40
50
60
70
80
90
100
110
120
130
140
Q4'14 Q1'15 Q2'15 Q3'15 Q4'15 Q1'16 Q2'16 Q3'16 Q4'16 Q1'17 Q2'17 Q3'17 Q4'17
PIF (Thousands)TIV
($ B
illion
s)
Total Insured Value Policies In Force
264% 266% 266% 264%260%
255%
248%
237%
223%
200%
210%
220%
230%
240%
250%
260%
270%
280%
290%
300%
Q4-15 Q1-16 Q2-16 Q3-16 Q4-16 Q1-17 Q2-17 Q3-17 Q4-17
Gross written premiums flat due to rate increases
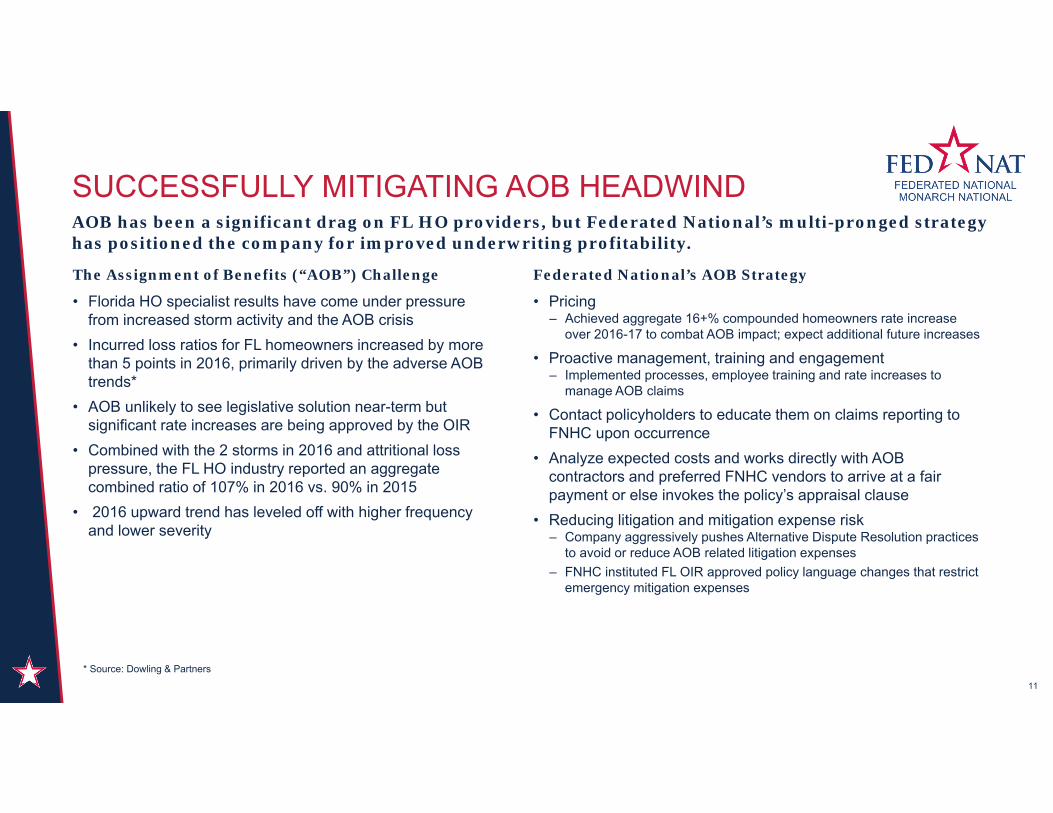
The Assignment of Benefits (“AOB”) Challenge
• Florida HO specialist results have come under pressure from increased storm activity and the AOB crisis
• Incurred loss ratios for FL homeowners increased by more than 5 points in 2016, primarily driven by the adverse AOB trends*
• AOB unlikely to see legislative solution near-term but significant rate increases are being approved by the OIR
• Combined with the 2 storms in 2016 and attritional loss pressure, the FL HO industry reported an aggregate combined ratio of 107% in 2016 vs. 90% in 2015
• 2016 upward trend has leveled off with higher frequency and lower severity
Federated National’s AOB Strategy
• Pricing– Achieved aggregate 16+% compounded homeowners rate increase
over 2016-17 to combat AOB impact; expect additional future increases
• Proactive management, training and engagement– Implemented processes, employee training and rate increases to
manage AOB claims
• Contact policyholders to educate them on claims reporting to FNHC upon occurrence
• Analyze expected costs and works directly with AOB contractors and preferred FNHC vendors to arrive at a fair payment or else invokes the policy’s appraisal clause
• Reducing litigation and mitigation expense risk– Company aggressively pushes Alternative Dispute Resolution practices
to avoid or reduce AOB related litigation expenses– FNHC instituted FL OIR approved policy language changes that restrict
emergency mitigation expenses
SUCCESSFULLY MITIGATING AOB HEADWINDAOB has been a significant drag on FL HO providers, but Federated National’s multi-pronged strategy has positioned the company for improved underwriting profitability.
11
* Source: Dowling & Partners
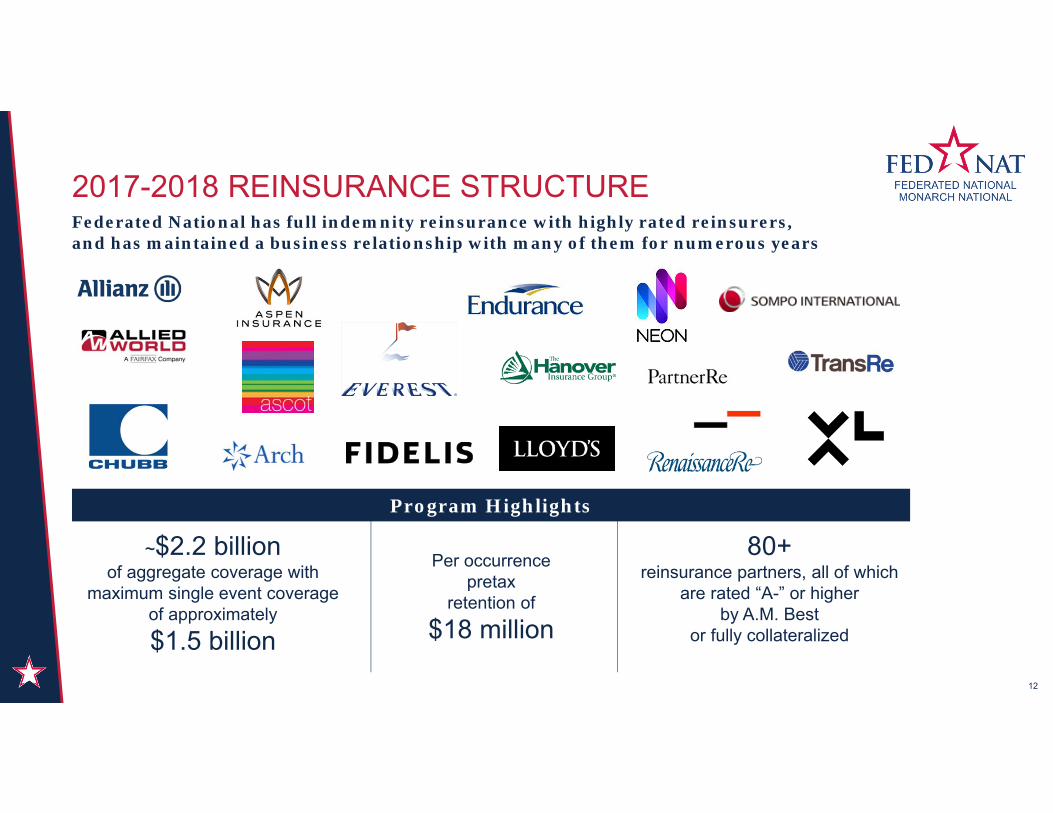
2017-2018 REINSURANCE STRUCTURE
Program Highlights
12
Federated National has full indemnity reinsurance with highly rated reinsurers, and has maintained a business relationship with many of them for numerous years
~$2.2 billion of aggregate coverage with
maximum single event coverage of approximately $1.5 billion
Per occurrence pretax
retention of $18 million
80+ reinsurance partners, all of which
are rated “A-” or higher by A.M. Best
or fully collateralized
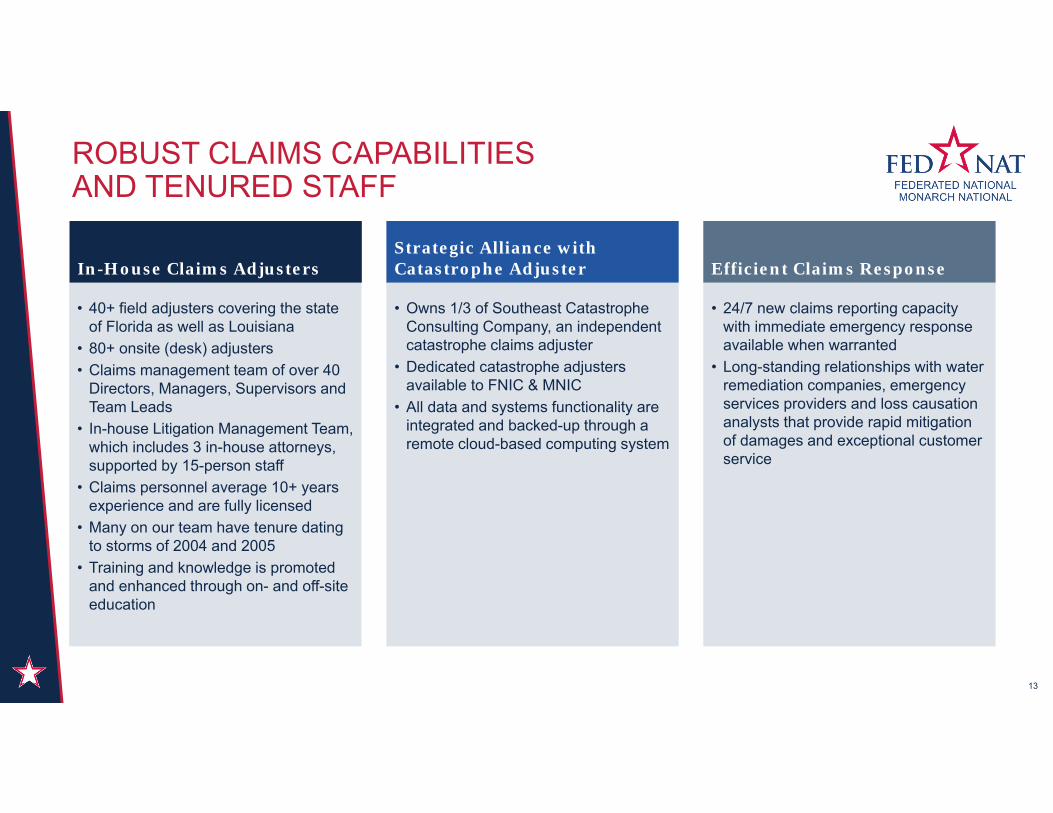
ROBUST CLAIMS CAPABILITIES AND TENURED STAFF
• 40+ field adjusters covering the state of Florida as well as Louisiana
• 80+ onsite (desk) adjusters• Claims management team of over 40
Directors, Managers, Supervisors and Team Leads
• In-house Litigation Management Team, which includes 3 in-house attorneys, supported by 15-person staff
• Claims personnel average 10+ years experience and are fully licensed
• Many on our team have tenure dating to storms of 2004 and 2005
• Training and knowledge is promoted and enhanced through on- and off-site education
• 24/7 new claims reporting capacity with immediate emergency response available when warranted
• Long-standing relationships with water remediation companies, emergency services providers and loss causation analysts that provide rapid mitigation of damages and exceptional customer service
• Owns 1/3 of Southeast Catastrophe Consulting Company, an independent catastrophe claims adjuster
• Dedicated catastrophe adjusters available to FNIC & MNIC
• All data and systems functionality are integrated and backed-up through a remote cloud-based computing system
In-House Claims AdjustersStrategic Alliance with Catastrophe Adjuster Efficient Claims Response
13

• Re-focusing on FNHC’s core strengths
• Maintain market share in high end Florida market
• Expand into larger, second tier pricing market through newly acquired full control of Monarch ($4.6B market opportunity)
• Selectively expand in adjacent coastal markets
• Continued investment in our people and processes to improve underwriting and claims performance through technology
2018 & BEYOND: BUILDING FOUNDATION FOR LONG-TERM VALUE CREATION
14
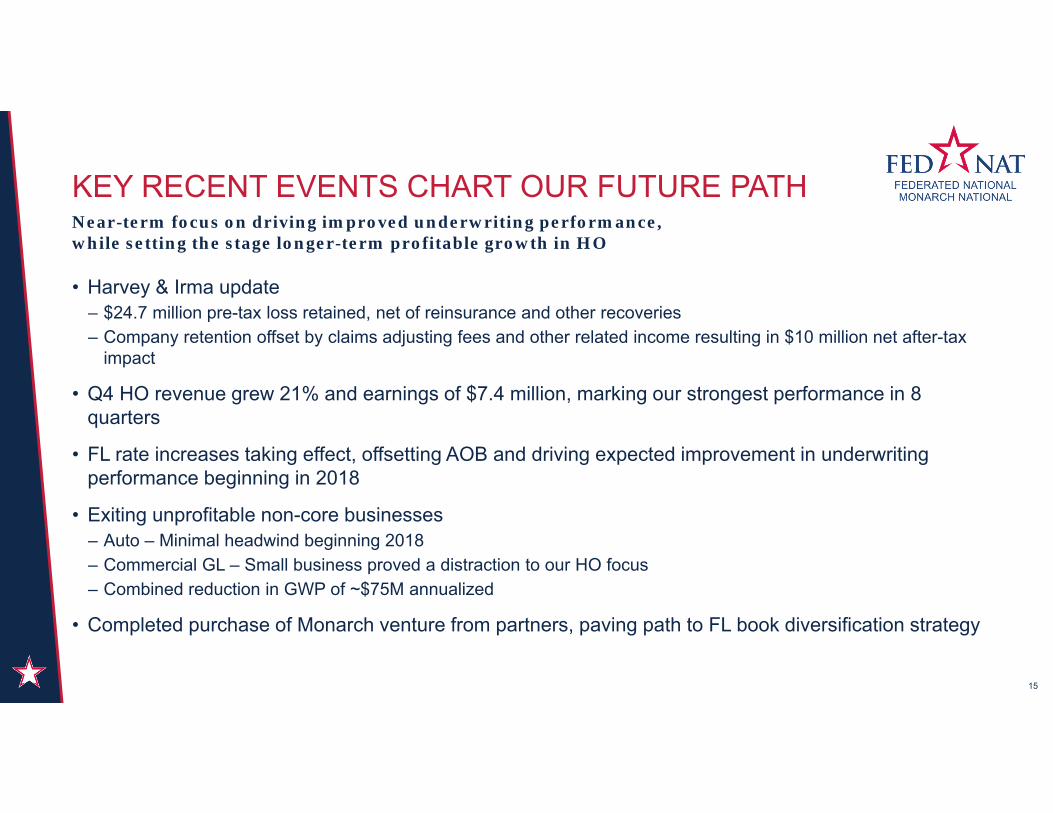
KEY RECENT EVENTS CHART OUR FUTURE PATH
• Harvey & Irma update– $24.7 million pre-tax loss retained, net of reinsurance and other recoveries– Company retention offset by claims adjusting fees and other related income resulting in $10 million net after-tax
impact
• Q4 HO revenue grew 21% and earnings of $7.4 million, marking our strongest performance in 8 quarters
• FL rate increases taking effect, offsetting AOB and driving expected improvement in underwriting performance beginning in 2018
• Exiting unprofitable non-core businesses– Auto – Minimal headwind beginning 2018– Commercial GL – Small business proved a distraction to our HO focus– Combined reduction in GWP of ~$75M annualized
• Completed purchase of Monarch venture from partners, paving path to FL book diversification strategy
15
Near-term focus on driving improved underwriting performance, while setting the stage longer-term profitable growth in HO
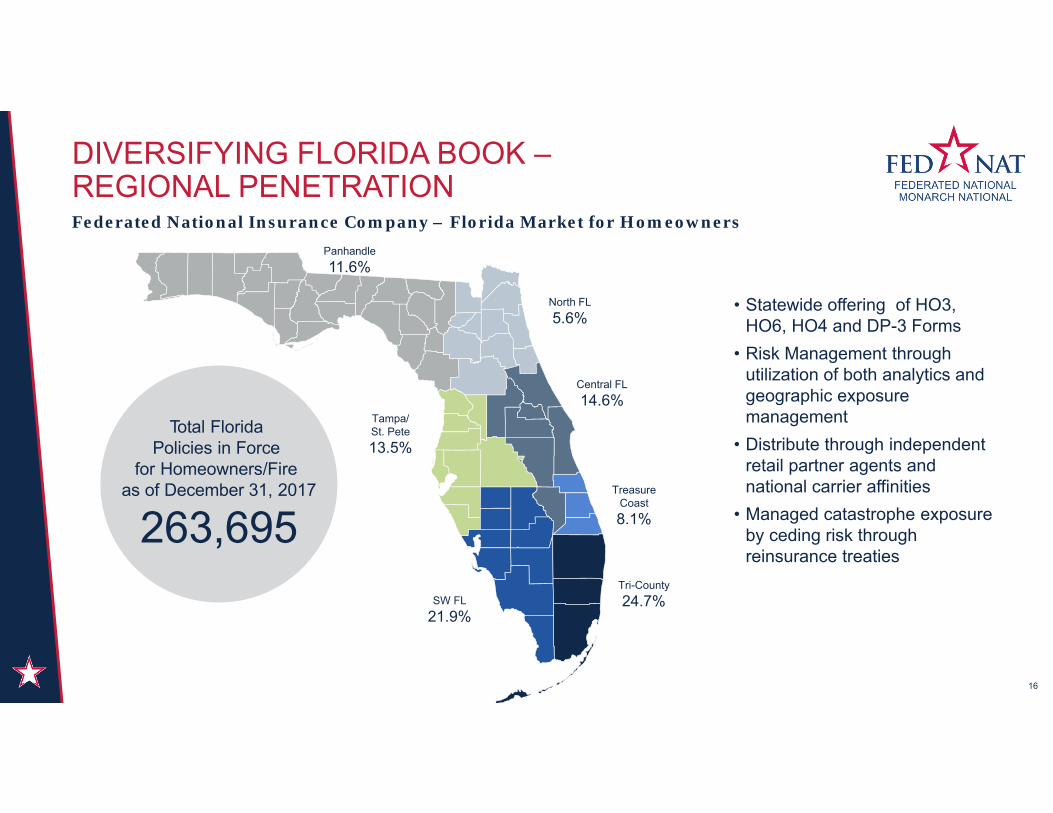
DIVERSIFYING FLORIDA BOOK –REGIONAL PENETRATION
16
Federated National Insurance Company – Florida Market for HomeownersPanhandle11.6%
North FL5.6%
Tampa/St. Pete13.5%
Central FL14.6%
Treasure Coast8.1%
SW FL21.9%
Tri-County24.7%
Total FloridaPolicies in Force
for Homeowners/Fireas of December 31, 2017
263,695
• Statewide offering of HO3, HO6, HO4 and DP-3 Forms
• Risk Management through utilization of both analytics and geographic exposure management
• Distribute through independent retail partner agents and national carrier affinities
• Managed catastrophe exposure by ceding risk through reinsurance treaties
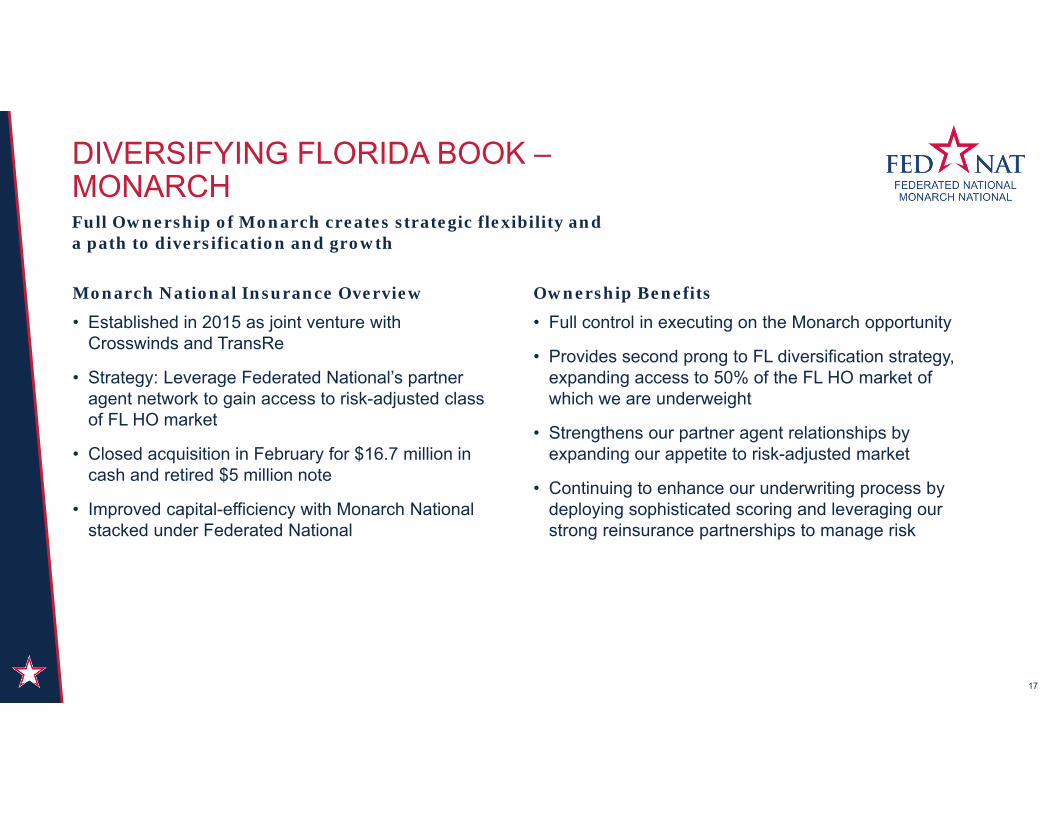
Monarch National Insurance Overview
• Established in 2015 as joint venture with Crosswinds and TransRe
• Strategy: Leverage Federated National’s partner agent network to gain access to risk-adjusted class of FL HO market
• Closed acquisition in February for $16.7 million in cash and retired $5 million note
• Improved capital-efficiency with Monarch National stacked under Federated National
Ownership Benefits
• Full control in executing on the Monarch opportunity
• Provides second prong to FL diversification strategy, expanding access to 50% of the FL HO market of which we are underweight
• Strengthens our partner agent relationships by expanding our appetite to risk-adjusted market
• Continuing to enhance our underwriting process by deploying sophisticated scoring and leveraging our strong reinsurance partnerships to manage risk
DIVERSIFYING FLORIDA BOOK –MONARCH
17
Full Ownership of Monarch creates strategic flexibility and a path to diversification and growth
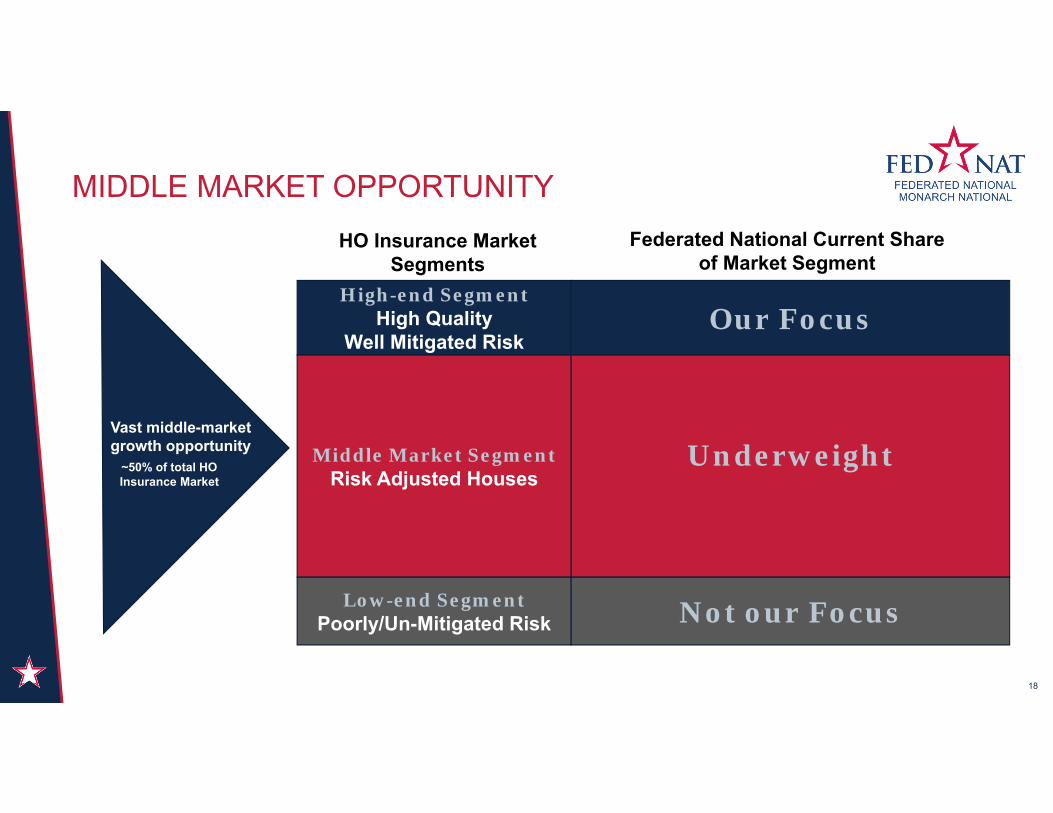
MIDDLE MARKET OPPORTUNITY
18
High-end SegmentHigh Quality
Well Mitigated Risk
Middle Market SegmentRisk Adjusted Houses
Low-end SegmentPoorly/Un-Mitigated Risk
HO Insurance Market Segments
Federated National Current Share of Market Segment
Our Focus
Underweight
Not our Focus
Vast middle-market growth opportunity
~50% of total HO Insurance Market
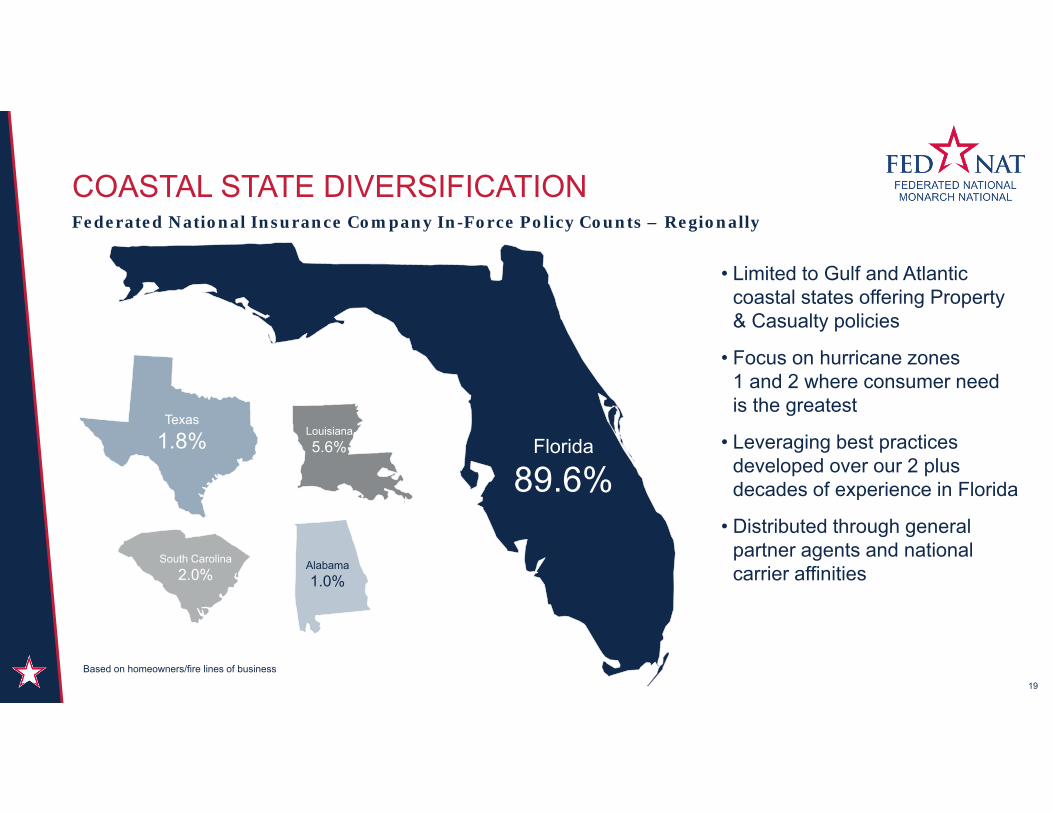
COASTAL STATE DIVERSIFICATION
19
Federated National Insurance Company In-Force Policy Counts – Regionally
• Limited to Gulf and Atlantic coastal states offering Property & Casualty policies
• Focus on hurricane zones 1 and 2 where consumer need is the greatest
• Leveraging best practices developed over our 2 plus decades of experience in Florida
• Distributed through general partner agents and national carrier affinities
Florida
89.6%
Texas
1.8% Louisiana5.6%
Alabama1.0%
South Carolina2.0%
Based on homeowners/fire lines of business

WHY WE ARE WELL POSITIONED TO SUCCEED
20
• Strong mindshare, partner agent network in Florida supports diversified regional penetration
• Ownership of Monarch gives us control in tailoring product for new Florida insurance classes
• Continued expansion as we take our model to neighboring states
• Multiple opportunities to leverage technology to improve performance
• Deep domain expertise across the FNHC organization
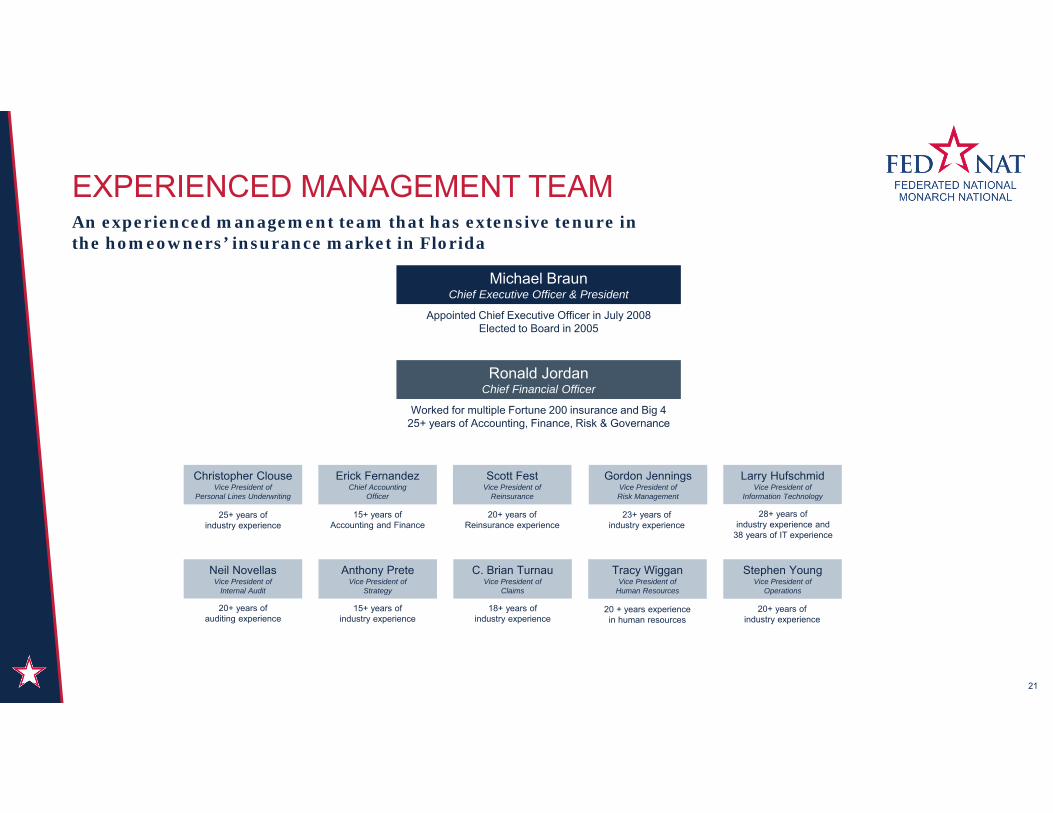
EXPERIENCED MANAGEMENT TEAMAn experienced management team that has extensive tenure in the homeowners’ insurance market in Florida
Michael BraunChief Executive Officer & President
Appointed Chief Executive Officer in July 2008Elected to Board in 2005
Ronald JordanChief Financial Officer
Worked for multiple Fortune 200 insurance and Big 4 25+ years of Accounting, Finance, Risk & Governance
21
Tracy WigganVice President of
Human Resources
20 + years experience in human resources
Anthony PreteVice President of
Strategy
15+ years of industry experience
Stephen YoungVice President of
Operations
20+ years of industry experience
C. Brian TurnauVice President of
Claims
18+ years of industry experience
Neil NovellasVice President of
Internal Audit
20+ years of auditing experience
Christopher ClouseVice President of
Personal Lines Underwriting
25+ years of industry experience
Larry HufschmidVice President of
Information Technology
28+ years of industry experience and
38 years of IT experience
Gordon JenningsVice President of Risk Management
23+ years of industry experience
Erick FernandezChief Accounting
Officer
15+ years of Accounting and Finance
Scott FestVice President of
Reinsurance
20+ years of Reinsurance experience
FINANCIAL OVERVIEW
22

$[VALUE]$[VALUE]
$[VALUE]$[VALUE]$[VALUE]
$[VALUE]$[VALUE] $[VALUE]
$[VALUE] $[VALUE]$[VALUE]$[VALUE]
$50,107 $54,028 $62,421
$67,825 $70,596 $74,958 $72,266
$80,435
$1,594 $2,752 $3,754 $5,921 $8,036 $5,619 $5,648 $4,339
$0$10,000$20,000$30,000$40,000$50,000$60,000$70,000$80,000$90,000
Q1-15 Q2-15 Q3-15 Q4-15 Q1-16 Q2-16 Q3-16 Q4-16 Q1-17 Q2-17 Q3-17 Q4-17
Net Premiums Earned (in thousands)
Net Premiums Earned HO Auto
PREMIUMS
23
$[VALUE]
$[VALUE] $[VALUE] $[VALUE]$[VALUE]
$[VALUE]$[VALUE]
$[VALUE]$[VALUE]
$[VALUE]
$[VALUE]$[VALUE]
$114,667
$145,648 $133,532
$118,890 $121,221
$151,626 $141,409
$122,499
$15,689 $18,996 $21,523 $13,271 $19,291
$10,622 $7,176 $6,416
$- $20,000 $40,000 $60,000 $80,000
$100,000 $120,000 $140,000 $160,000 $180,000
Q1-15 Q2-15 Q3-15 Q4-15 Q1-16 Q2-16 Q3-16 Q4-16 Q1-17 Q2-17 Q3-17 Q4-17
Gross Written Premiums (in thousands)
Gross Premiums Written HO Auto
Note: Breakouts for Homeowners and Automobile are provided from 1Q16 forwardNote: Excludes CGL

REVENUE AND EXPENSES
24
$54,936
$58,790
$72,599
$63,567 $65,010
$70,786
$81,758
$89,971 $93,054
$98,159 $98,697 $101,752
$16,503 $17,002
$26,562 $20,278
$20,510 $22,107
$32,941 $32,354 $32,271 $36,087
$33,509 $33,311
$10,000
$20,000
$30,000
$40,000
$50,000
$60,000
$70,000
$80,000
$90,000
$100,000
$110,000
Q1-15 Q2-15 Q3-15 Q4-15 Q1-16 Q2-16 Q3-16* Q4-16 Q1-17 Q2-17 Q3-17 Q4-17
Total Revenues and Expenses (excluding Losses, LAE and Taxes) (in thousands)
Total Revenues Total Expenses (excl Losses/LAE and Taxes)
*Unwinding of Florida homeowners’ 30% quota share reinsurance treaty.
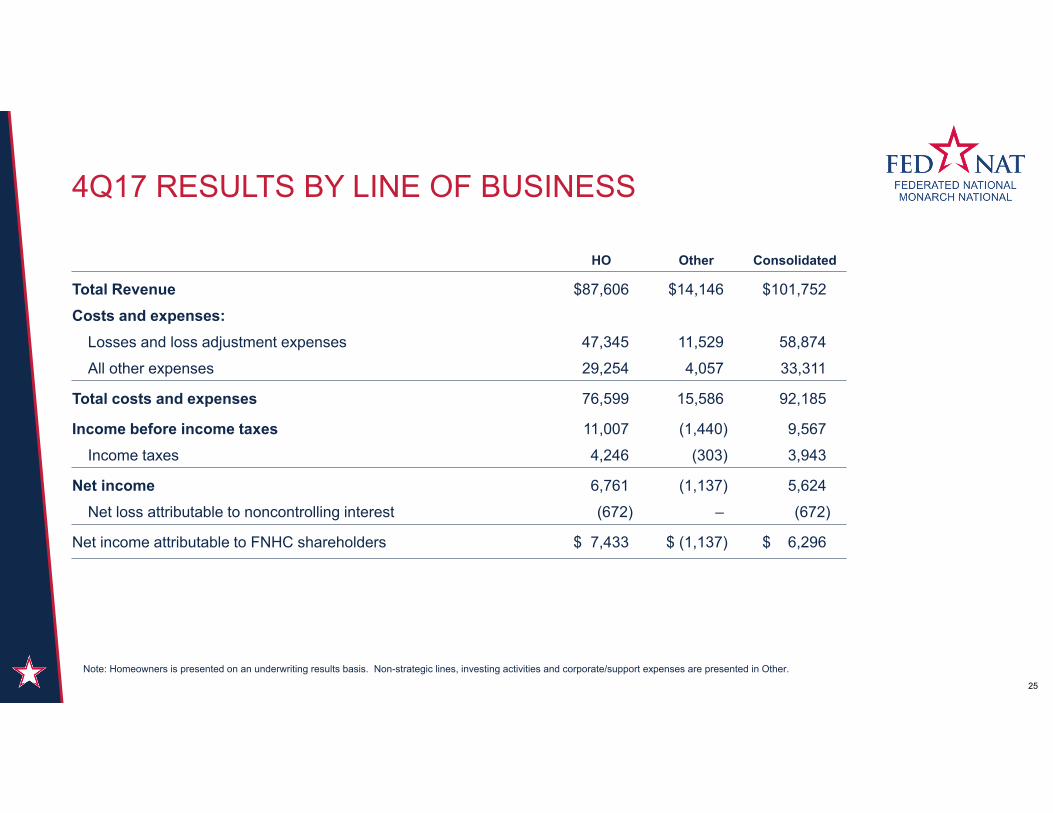
4Q17 RESULTS BY LINE OF BUSINESS
25
HO Other Consolidated
Total Revenue $87,606 $14,146 $101,752
Costs and expenses:Losses and loss adjustment expenses 47,345 11,529 58,874
All other expenses 29,254 4,057 33,311
Total costs and expenses 76,599 15,586 92,185
Income before income taxes 11,007 (1,440) 9,567
Income taxes 4,246 (303) 3,943
Net income 6,761 (1,137) 5,624
Net loss attributable to noncontrolling interest (672) – (672)
Net income attributable to FNHC shareholders $ 7,433 $ (1,137) $ 6,296
Note: Homeowners is presented on an underwriting results basis. Non-strategic lines, investing activities and corporate/support expenses are presented in Other.
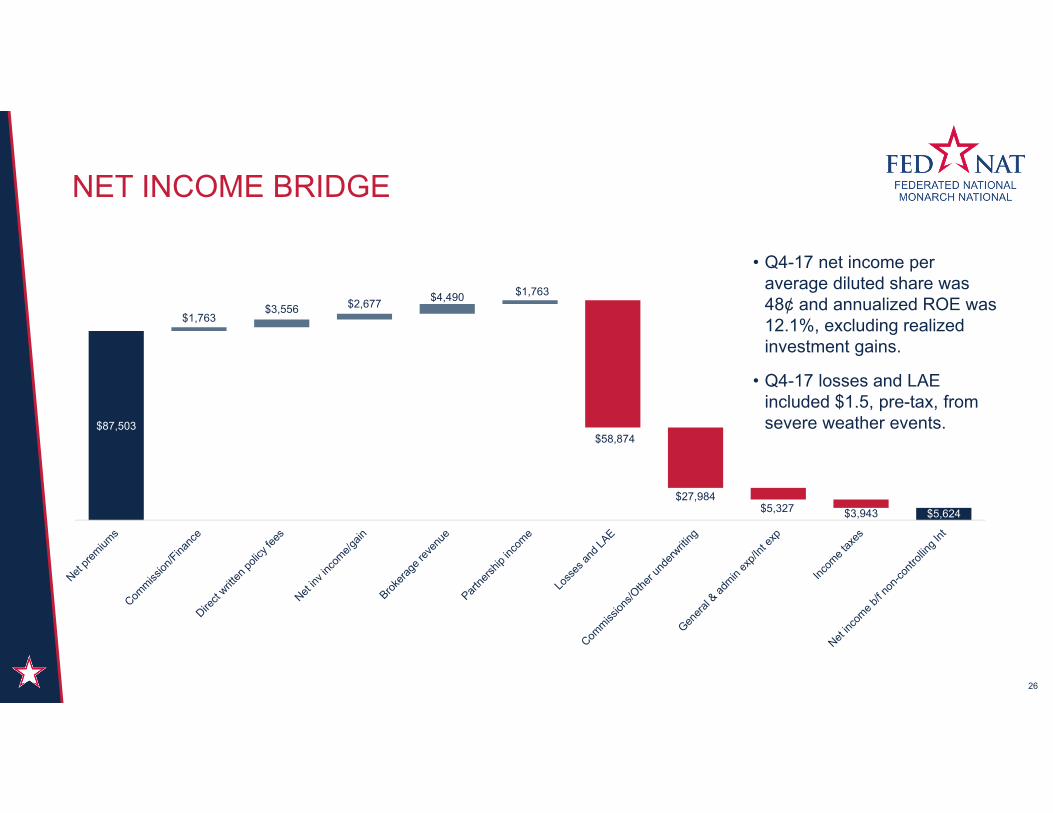
$87,503
$5,624
$1,763$3,556 $2,677 $4,490 $1,763
$58,874
$27,984$5,327 $3,943
NET INCOME BRIDGE
26
• Q4-17 net income per average diluted share was 48¢ and annualized ROE was 12.1%, excluding realized investment gains.
• Q4-17 losses and LAE included $1.5, pre-tax, from severe weather events.
LOSSES AND LAE
27
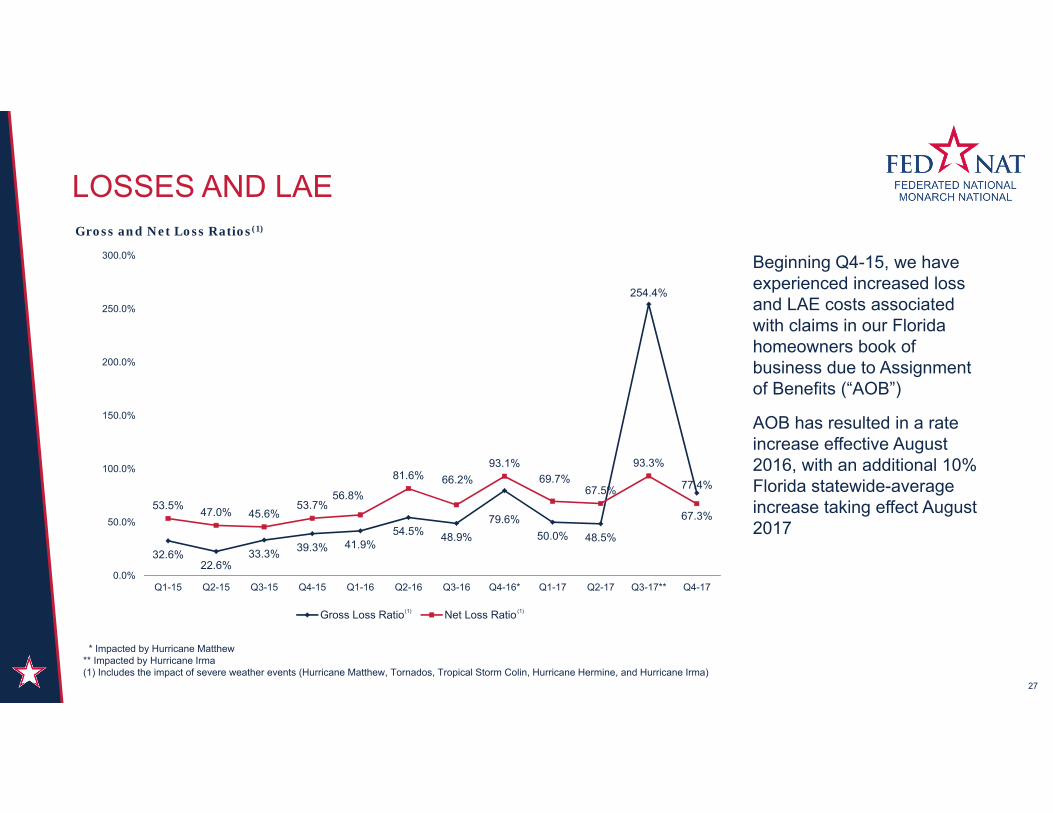
32.6%22.6%
33.3% 39.3% 41.9%54.5% 48.9%
79.6%50.0% 48.5%
254.4%
77.4%
53.5% 47.0% 45.6%53.7%
56.8%
81.6% 66.2%93.1%
69.7%67.5%
93.3%
67.3%
0.0%
50.0%
100.0%
150.0%
200.0%
250.0%
300.0%
Q1-15 Q2-15 Q3-15 Q4-15 Q1-16 Q2-16 Q3-16 Q4-16* Q1-17 Q2-17 Q3-17** Q4-17
Gross and Net Loss Ratios(1)
Gross Loss Ratio Net Loss Ratio(1) (1)
Beginning Q4-15, we have experienced increased loss and LAE costs associated with claims in our Florida homeowners book of business due to Assignment of Benefits (“AOB”)
AOB has resulted in a rate increase effective August 2016, with an additional 10% Florida statewide-average increase taking effect August 2017
* Impacted by Hurricane Matthew** Impacted by Hurricane Irma(1) Includes the impact of severe weather events (Hurricane Matthew, Tornados, Tropical Storm Colin, Hurricane Hermine, and Hurricane Irma)
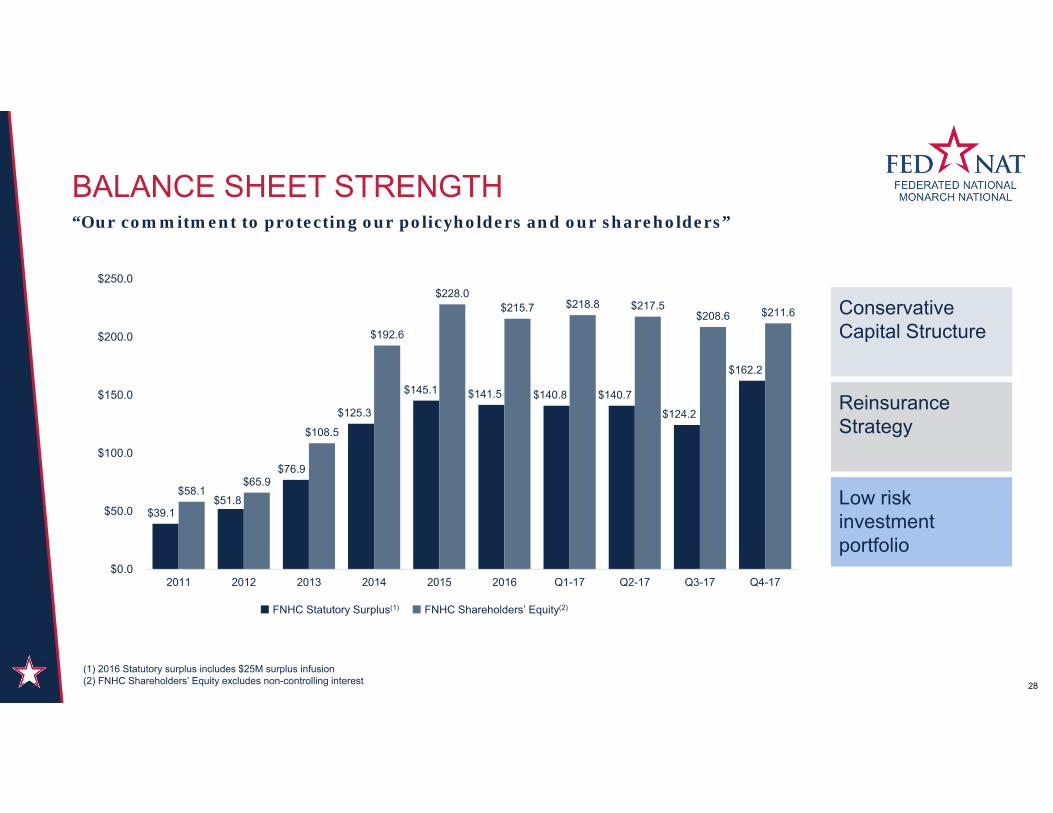
BALANCE SHEET STRENGTH
28
“Our commitment to protecting our policyholders and our shareholders”
$39.1 $51.8
$76.9
$125.3
$145.1 $141.5 $140.8 $140.7
$124.2
$162.2
$58.1 $65.9
$108.5
$192.6
$228.0 $215.7 $218.8 $217.5
$208.6 $211.6
$0.0
$50.0
$100.0
$150.0
$200.0
$250.0
2011 2012 2013 2014 2015 2016 Q1-17 Q2-17 Q3-17 Q4-17
FNHC Statutory Surplus(1) FNHC Shareholders’ Equity(2)
(1) 2016 Statutory surplus includes $25M surplus infusion(2) FNHC Shareholders’ Equity excludes non-controlling interest
Conservative Capital Structure
Reinsurance Strategy
Low risk investment portfolio
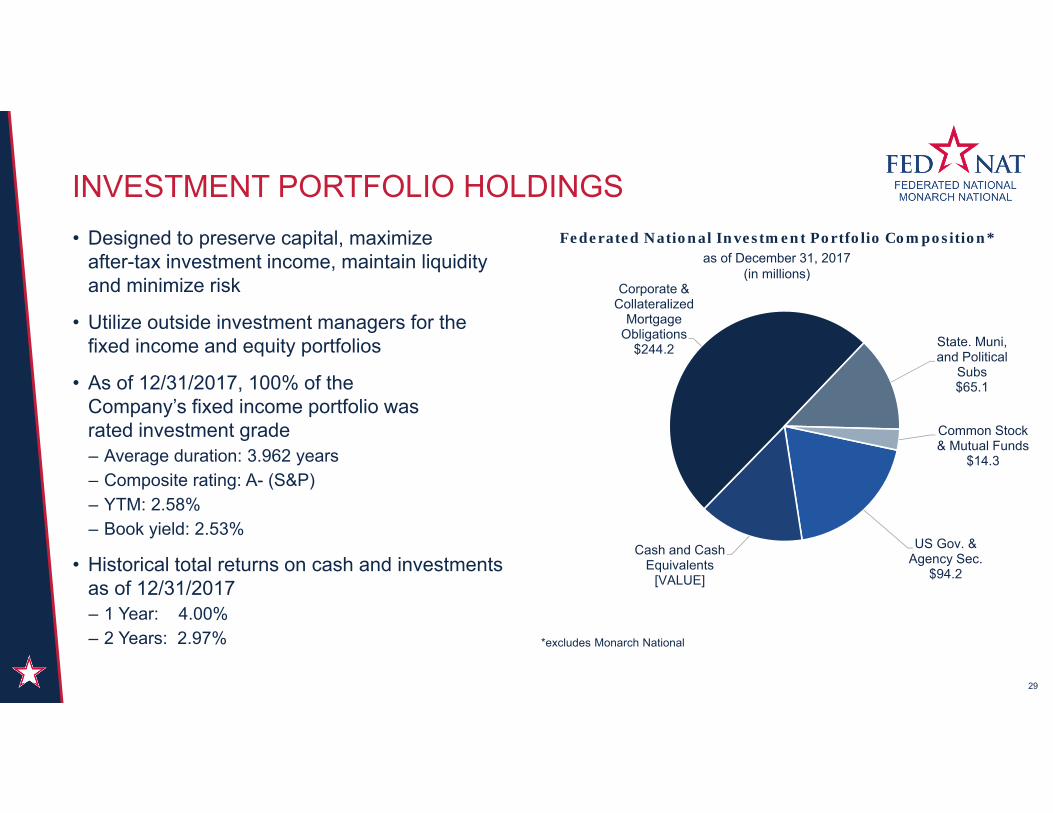
Federated National Investment Portfolio Composition* as of December 31, 2017
(in millions)
US Gov. & Agency Sec.
$94.2
Cash and Cash Equivalents
[VALUE]
Corporate & Collateralized
Mortgage Obligations
$244.2 State. Muni, and Political
Subs$65.1
Common Stock & Mutual Funds
$14.3
INVESTMENT PORTFOLIO HOLDINGS
29
• Designed to preserve capital, maximize after-tax investment income, maintain liquidity and minimize risk
• Utilize outside investment managers for the fixed income and equity portfolios
• As of 12/31/2017, 100% of the Company’s fixed income portfolio was rated investment grade– Average duration: 3.962 years– Composite rating: A- (S&P)– YTM: 2.58%– Book yield: 2.53%
• Historical total returns on cash and investments as of 12/31/2017– 1 Year: 4.00%– 2 Years: 2.97% *excludes Monarch National
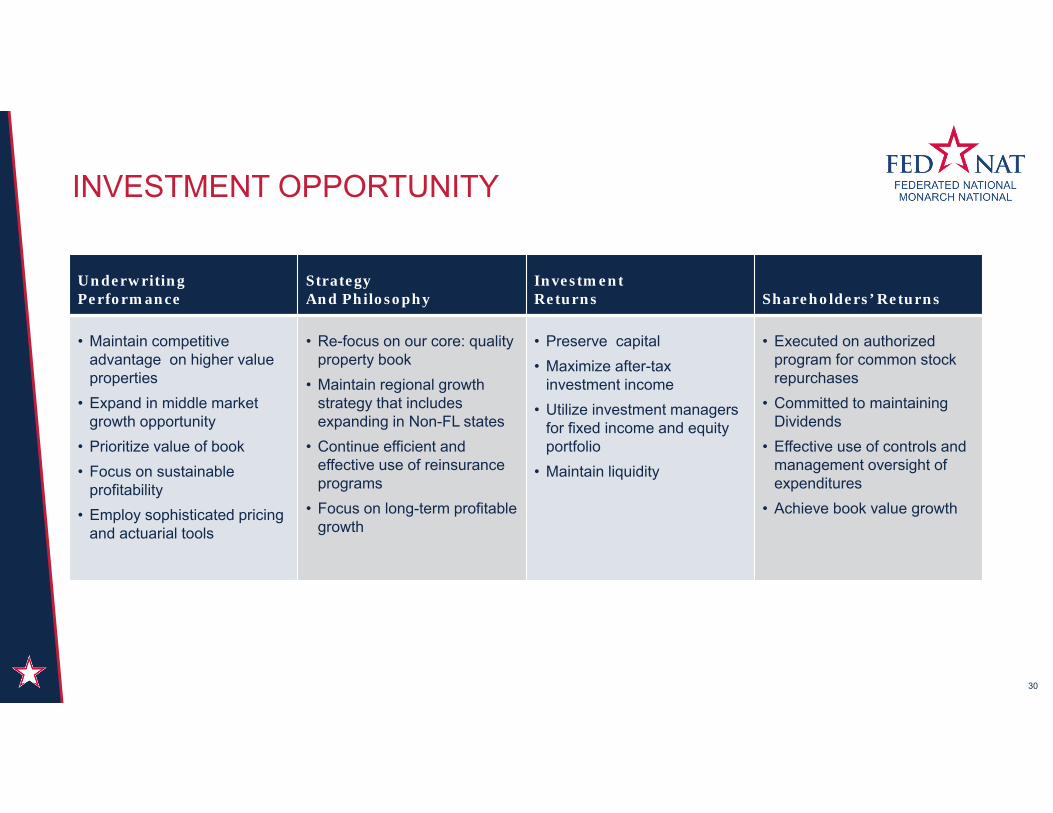
INVESTMENT OPPORTUNITY
30
UnderwritingPerformance
Strategy And Philosophy
Investment Returns Shareholders’ Returns
• Maintain competitive advantage on higher value properties
• Expand in middle market growth opportunity
• Prioritize value of book• Focus on sustainable
profitability• Employ sophisticated pricing
and actuarial tools
• Re-focus on our core: quality property book
• Maintain regional growth strategy that includes expanding in Non-FL states
• Continue efficient and effective use of reinsurance programs
• Focus on long-term profitable growth
• Preserve capital• Maximize after-tax
investment income• Utilize investment managers
for fixed income and equity portfolio
• Maintain liquidity
• Executed on authorized program for common stock repurchases
• Committed to maintaining Dividends
• Effective use of controls and management oversight of expenditures
• Achieve book value growth
THANK YOU!
31