Embed Size (px)
Citation preview
Preliminary Regulatory Impact Analysis
FMVSS No. 208 Motorcoach Seat Belts
Office of Regulatory Analysis and Evaluation National Center for Statistics and Analysis August 2010
Table of Contents I – Introduction …………………………………………………………..1 II – Background ………………………………………………………….3 III - The Proposed Rule ……………………………………………….5 IV – Research ……………………………………………………………6 V- Target Population …………………………………………………..40 VI - Benefits …………………………………………….………..46 VII - Costs …………………………………………………………..….58 VIII - Cost Effectiveness……………………………………………….63 IX - Cost Benefit……… ………………………………………………71 X – Alternatives ……… ………………………………………………76 XI - Regulatory Flexibility and Unfunded Mandate Acts ……..………77
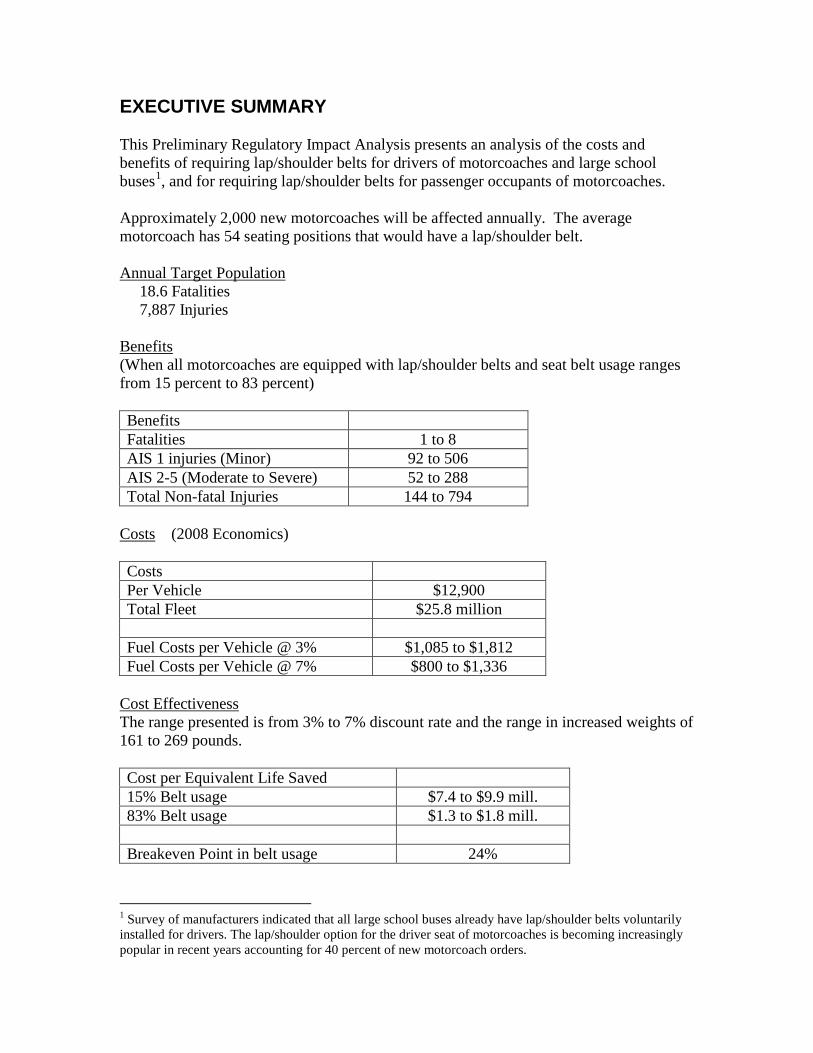
EXECUTIVE SUMMARY This Preliminary Regulatory Impact Analysis presents an analysis of the costs and benefits of requiring lap/shoulder belts for drivers of motorcoaches and large school buses1
, and for requiring lap/shoulder belts for passenger occupants of motorcoaches.
Approximately 2,000 new motorcoaches will be affected annually. The average motorcoach has 54 seating positions that would have a lap/shoulder belt. Annual Target Population 18.6 Fatalities 7,887 Injuries Benefits (When all motorcoaches are equipped with lap/shoulder belts and seat belt usage ranges from 15 percent to 83 percent) Benefits Fatalities 1 to 8 AIS 1 injuries (Minor) 92 to 506 AIS 2-5 (Moderate to Severe) 52 to 288 Total Non-fatal Injuries 144 to 794
Costs (2008 Economics)
Costs Per Vehicle $12,900 Total Fleet $25.8 million Fuel Costs per Vehicle @ 3% $1,085 to $1,812 Fuel Costs per Vehicle @ 7% $800 to $1,336
Cost Effectiveness
The range presented is from 3% to 7% discount rate and the range in increased weights of 161 to 269 pounds.
Cost per Equivalent Life Saved 15% Belt usage $7.4 to $9.9 mill. 83% Belt usage $1.3 to $1.8 mill. Breakeven Point in belt usage 24%
1 Survey of manufacturers indicated that all large school buses already have lap/shoulder belts voluntarily installed for drivers. The lap/shoulder option for the driver seat of motorcoaches is becoming increasingly popular in recent years accounting for 40 percent of new motorcoach orders.
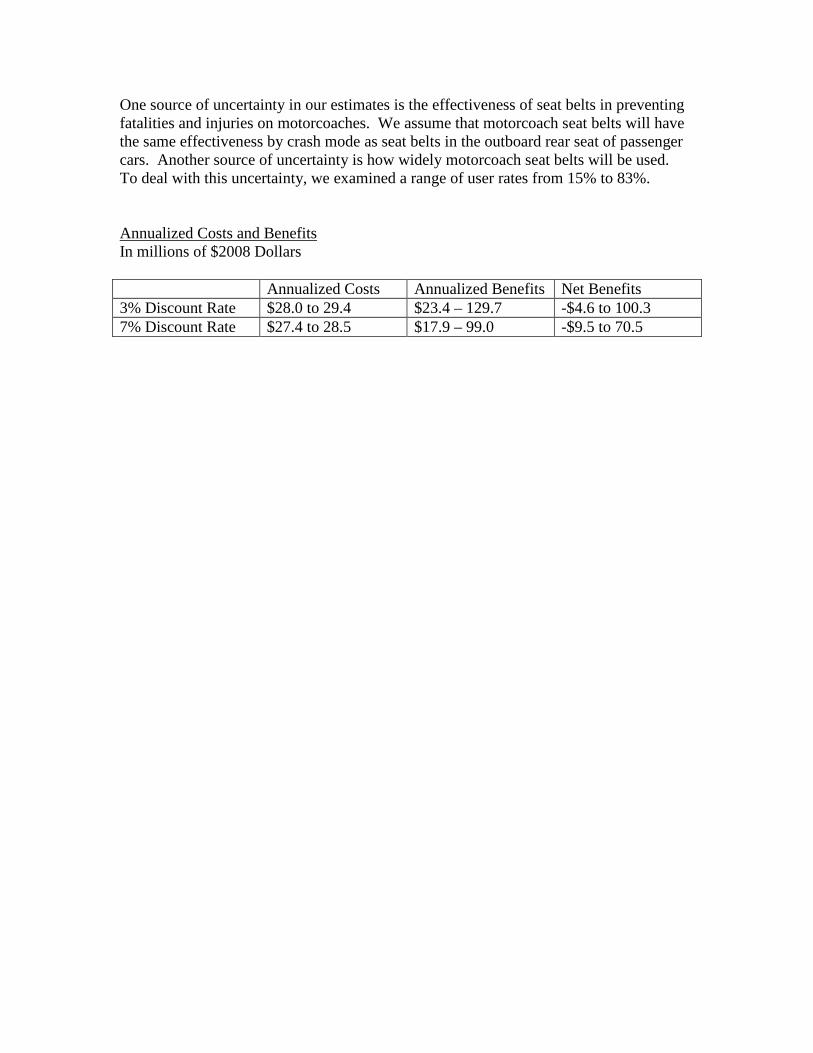
One source of uncertainty in our estimates is the effectiveness of seat belts in preventing fatalities and injuries on motorcoaches. We assume that motorcoach seat belts will have the same effectiveness by crash mode as seat belts in the outboard rear seat of passenger cars. Another source of uncertainty is how widely motorcoach seat belts will be used. To deal with this uncertainty, we examined a range of user rates from 15% to 83%. Annualized Costs and Benefits In millions of $2008 Dollars Annualized Costs Annualized Benefits Net Benefits 3% Discount Rate $28.0 to 29.4 $23.4 – 129.7 -$4.6 to 100.3 7% Discount Rate $27.4 to 28.5 $17.9 – 99.0 -$9.5 to 70.5
1
I. Introduction Millions of people are transported by motorcoach annually. These trips include both business and pleasure tours and are both intra and inter cities. Senior citizens and students account for the majority of occupants on these trips, approximately 54 percent. According to the Motorcoach Census 2008, the motor-coach industry in the United States and Canada had approximately 3,400 carriers and 33,536 motorcoaches. Of this number approximately 3,137 carriers and approximately 29,325 motorcoaches were based in the United States. In recent years, there have been several serious motorcoach crashes investigated by the National Transportation Safety Board (NTSB). In each crash there were at least three fatalities and six occupants with serious injuries. The causes of most of the motorcoach crashes were attributed to driver error or poor maintenance of the motorcoach. In many of these crashes, the NTSB determined that the risk of passenger fatalities or injuries would have been minimized if they had been properly restrained with a lap/shoulder belt. The main goal of this rulemaking is to reduce occupant ejection. Ejections account for seventy-eight percent of the fatalities in motorcoach rollover crashes and twenty-eight percent of the fatalities in non-rollover crashes. Lap/shoulder belts installed on motorcoaches could reduce the risk of fatal injuries in rollover crashes by 77 percent. Alternatives are considered in Chapter X. These alternatives include requiring a lap belt to be installed for motorcoach passengers and examining the ECE-R14 test requirement, which is less stringent than proposed. Lap belt test results, benefits and costs are discussed in the appropriate chapters and combined in Chapter X. The Definition of a Motorcoach The agency proposes to amend 49 CFR Part 571.3 to: Define a motorcoach as “a bus with a gross vehicle weight rating (GVWR) of 11,793 kg (26,000 pounds) or greater, 16 or more designated seating positions, and at least 2 rows of passenger seats that are forward facing or can convert to forward facing without the use of tools. Motorcoach does not include a school bus, multifunction school activity bus, or transit bus designed for an “urban area” as defined in 49 U.S.C. Section 5301(16).” There are various other definitions of a motorcoach. One definition from the Motorcoach Census 2008 describes a motorcoach as bus designed for long-distance transportation of passengers, characterized by integral construction with an elevated passenger deck located over a baggage compartment. It is as least 35 feet in length with a capacity of more than 30 passengers. This definition of motorcoach excludes the typical city transit

2
bus, which is designed for urban and suburban routes, and city sightseeing buses, such as double-decker buses and trolleys.2
2 Motorcoach Census 2008, A Benchmarking Study of the Size and Activity of the Motorcoach Industry in the United States and Canada in 2007. Paul Bourquin, Economist and Industry Analyst, December 18. 2008
3
II. Background Currently motorcoaches fall under the vehicle category of “bus” and must comply with, among other Federal Motor Vehicle Safety Standards, FMVSS No. 108, “Lamps, reflective devices, and associated equipment,” FMVSS No. 120, “Tire selection and rims and motor home/recreation vehicle trailer load carrying capacity information for motor vehicles with a GVWR of more than 4,536 kilograms (10,000 pounds),” FMVSS No. 121, “Air brake systems,” FMVSS No. 208, “Occupant crash protection,” FMVSS No. 209, “Seat belt assemblies,” FMVSS No. 210, “Seat belt assembly anchorages,” FMVSS No. 217, “Bus emergency exits and window retention and release,” and FMVSS No. 302, “Flammability of interior materials,” among other FMVSSs that apply to buses with a GVWR greater than 4,536 kg (10,000 pounds). FMVSS Nos. 208 and 210 presently apply to the driver’s seat only. FMVSS No. 208 requires either Type 1 or Type 2 seat belts for the driver-seating position in all buses. A Type 1 seat belt assembly is a lap belt for pelvic restraint. A Type 2 seat belt assembly is a combination of pelvic and upper torso restraints (a lap/shoulder belt). There is currently no requirement for seat belts to be installed at the passenger seating positions in buses.
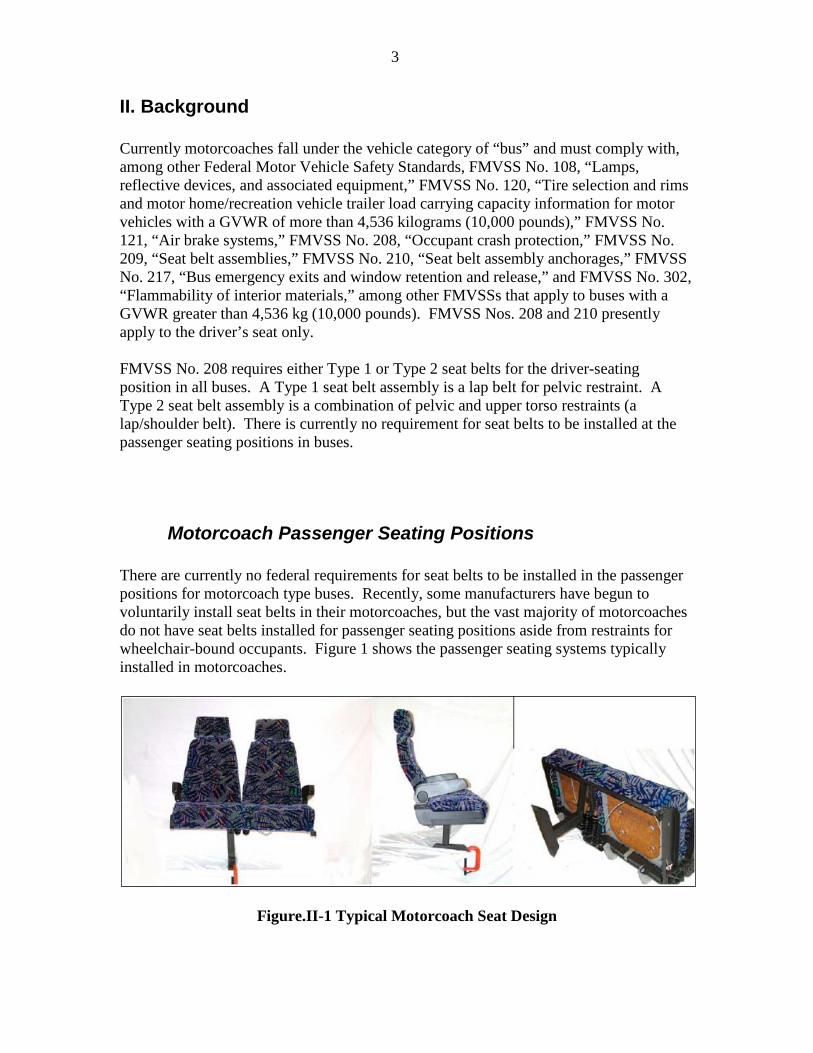
Motorcoach Passenger Seating Positions There are currently no federal requirements for seat belts to be installed in the passenger positions for motorcoach type buses. Recently, some manufacturers have begun to voluntarily install seat belts in their motorcoaches, but the vast majority of motorcoaches do not have seat belts installed for passenger seating positions aside from restraints for wheelchair-bound occupants. Figure 1 shows the passenger seating systems typically installed in motorcoaches.
Figure.II-1 Typical Motorcoach Seat Design
4
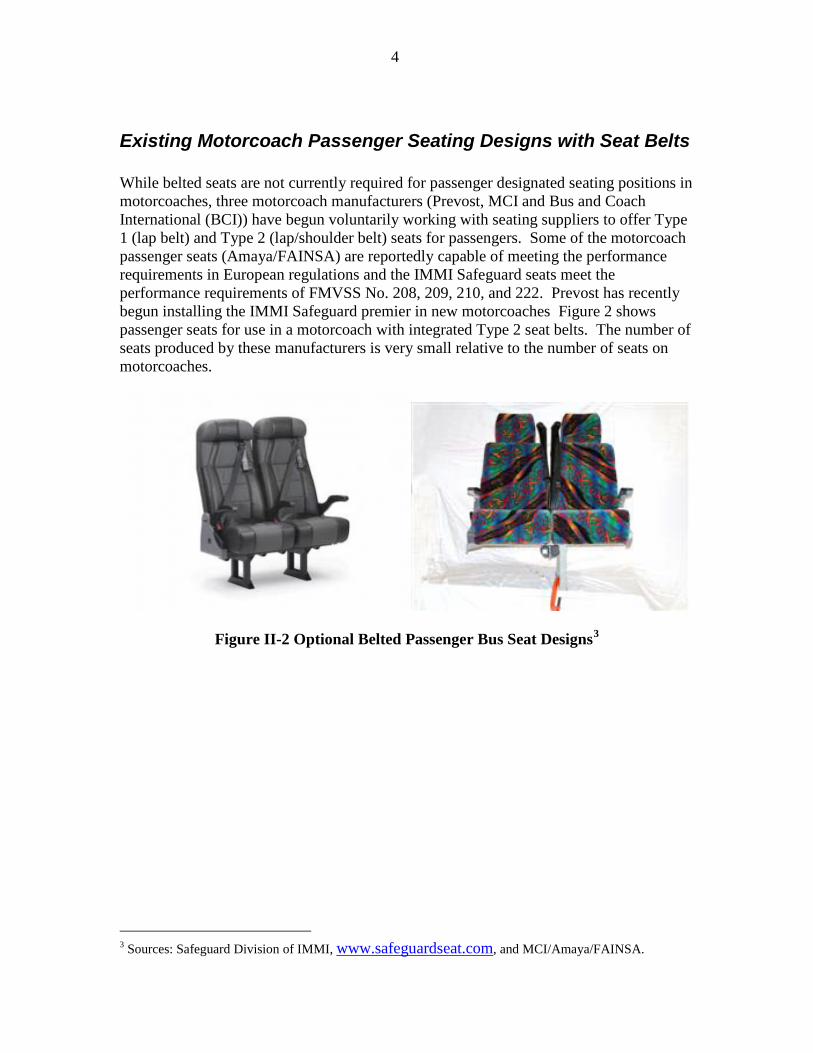
Existing Motorcoach Passenger Seating Designs with Seat Belts While belted seats are not currently required for passenger designated seating positions in motorcoaches, three motorcoach manufacturers (Prevost, MCI and Bus and Coach International (BCI)) have begun voluntarily working with seating suppliers to offer Type 1 (lap belt) and Type 2 (lap/shoulder belt) seats for passengers. Some of the motorcoach passenger seats (Amaya/FAINSA) are reportedly capable of meeting the performance requirements in European regulations and the IMMI Safeguard seats meet the performance requirements of FMVSS No. 208, 209, 210, and 222. Prevost has recently begun installing the IMMI Safeguard premier in new motorcoaches Figure 2 shows passenger seats for use in a motorcoach with integrated Type 2 seat belts. The number of seats produced by these manufacturers is very small relative to the number of seats on motorcoaches.
Figure II-2 Optional Belted Passenger Bus Seat Designs3
3 Sources: Safeguard Division of IMMI, www.safeguardseat.com, and MCI/Amaya/FAINSA.
5
III. The Proposed Rule This rulemaking is going to change the existing Federal Motor Vehicle Safety Standards (FMVSS) to regulate installation of lap/shoulder belts for drivers of motorcoaches and other types of large buses, and proposes lap/shoulder belts for passenger occupants of motorcoaches. An alternative examined in this analysis is for lap belts for passenger occupants of motorcoaches. The agency proposes to amend FMVSS No. 208, “Occupant Crash Protection,” to: require lap/shoulder belts at all driver and passenger seating positions of motorcoaches; require lap/shoulder belts at all driver seating positions for all buses with a gross vehicle weight (GVWR) greater than 4,536 kg (10,000 pounds); and require lap/shoulder belts at all locations to meet FMVSS No. 210, “Seat belt assembly anchorages,” which requires that a seat belt anchorage be of sufficient strength to with stand loads of 13,345 N (3,000 pounds) applied to the torso and the lap portion of the lap/shoulder belt anchorages.
6
IV. Research
NHTSA’s Frontal Crash Protection Research on Motorcoaches The agency’s objectives for the motorcoach frontal crash protection research program are as follows:
1. Obtain a motorcoach crash pulse from a severe frontal crash event, 2. Evaluate alternative occupant crash protection systems in controlled laboratory
tests, and 3. Provide results to support rulemaking activities to upgrade the occupant crash
protection for motorcoach passengers. To achieve these objectives, the agency conducted a full-scale motorcoach crash test to determine a representative crash pulse and completed a series of frontal sled test simulations to evaluate passenger occupant protection systems. The following sections describe the research and its findings.
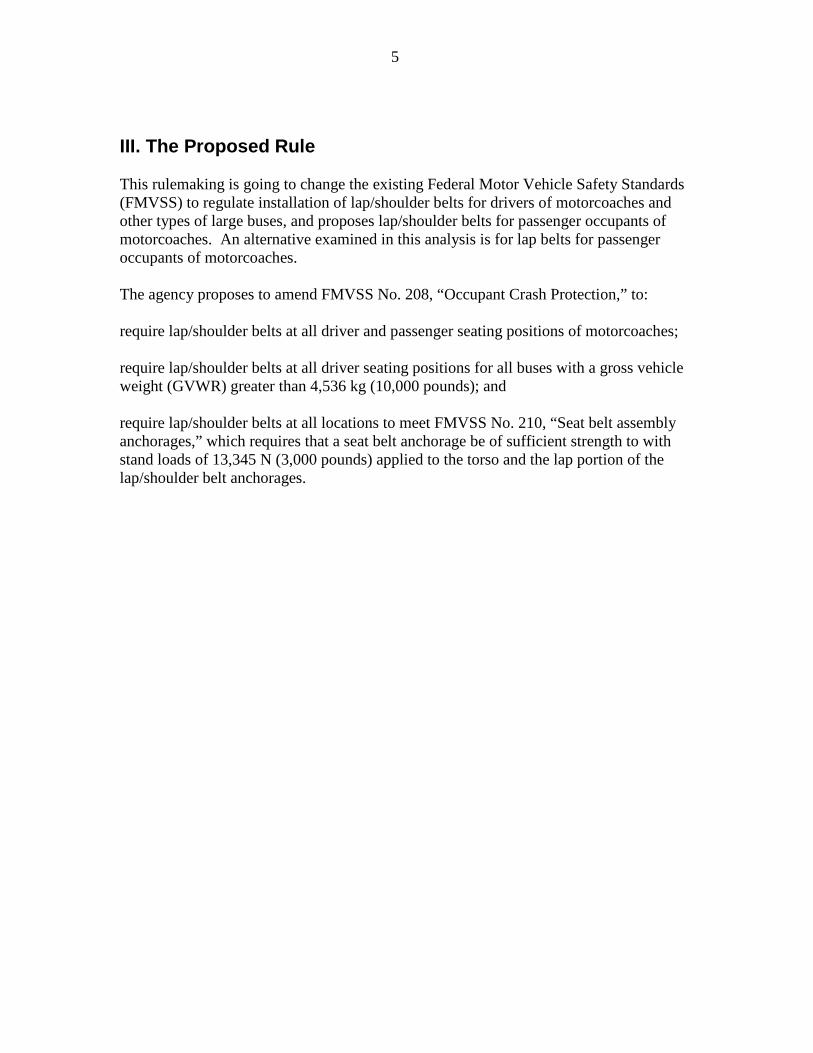
Full Scale Motorcoach Crash Test A 48.3 km/h (30 mph) full frontal rigid barrier crash test was conducted with a motorcoach in December 2007 at the Vehicle Research and Test Center (VRTC). The vehicle used for the test was a 45 foot long, 2000 model year, MCI 102EL3 Renaissance motorcoach with 54 passenger seats (Figure IV-1). The total tested weight of the vehicle, including dummies and equipment, was 19,377 kg (42,720 lbs).
Figure IV-1: Pre-test Photo of Full-Scale Rigid Barrier Crash Test
Twenty-two test dummies were used during the test to generate preliminary data on injury risk for various seating conditions. The test dummies4
4 The crash test dummies used in this program have limitations in that they are constructed with a fixed pelvis. This design does not allow the hips to fully articulate when the dummy strikes the seat back directly in front of it.
included: the 5th percentile
7
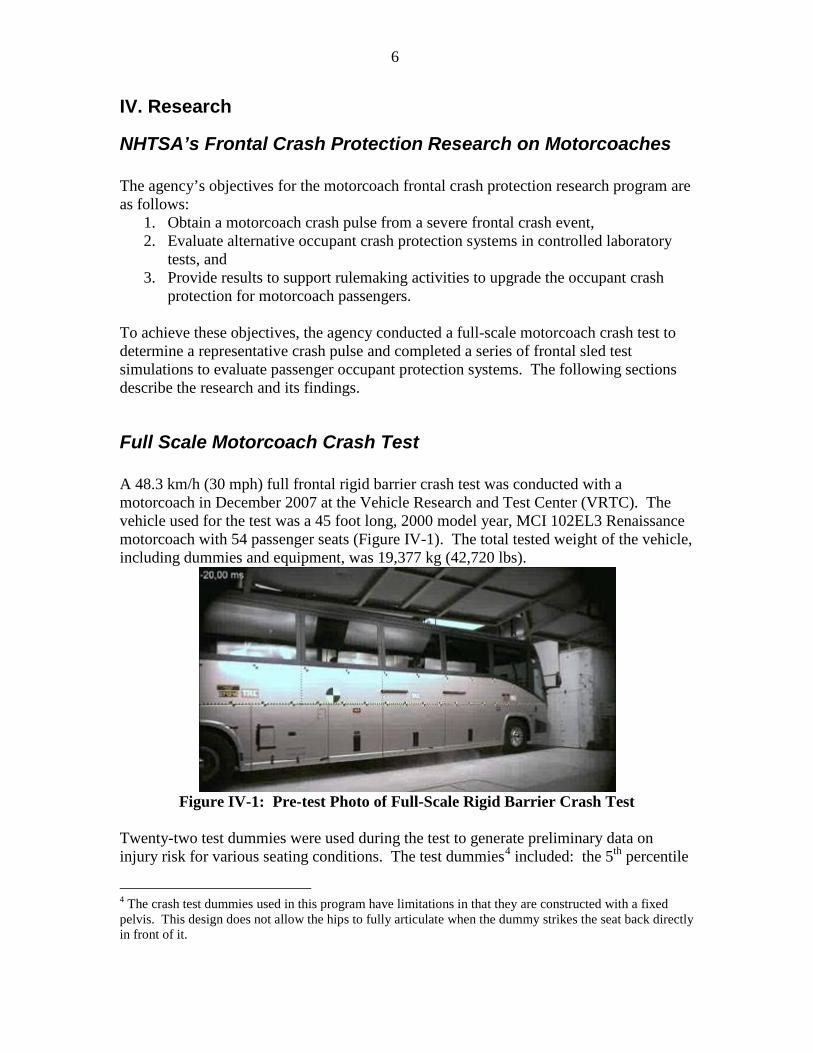
female Hybrid III dummy, the 50th percentile male Hybrid III dummy and the 95th percentile male Hybrid III dummy. The dummies were seated in an upright configuration see Figure IV-2. There are currently no specific seating procedures for positioning dummies in motorcoach seats, as there are for FMVSS No. 208 or other standards that utilize crash test dummies.
Figure IV-2: Pre-test Photo of Motorcoach Interior
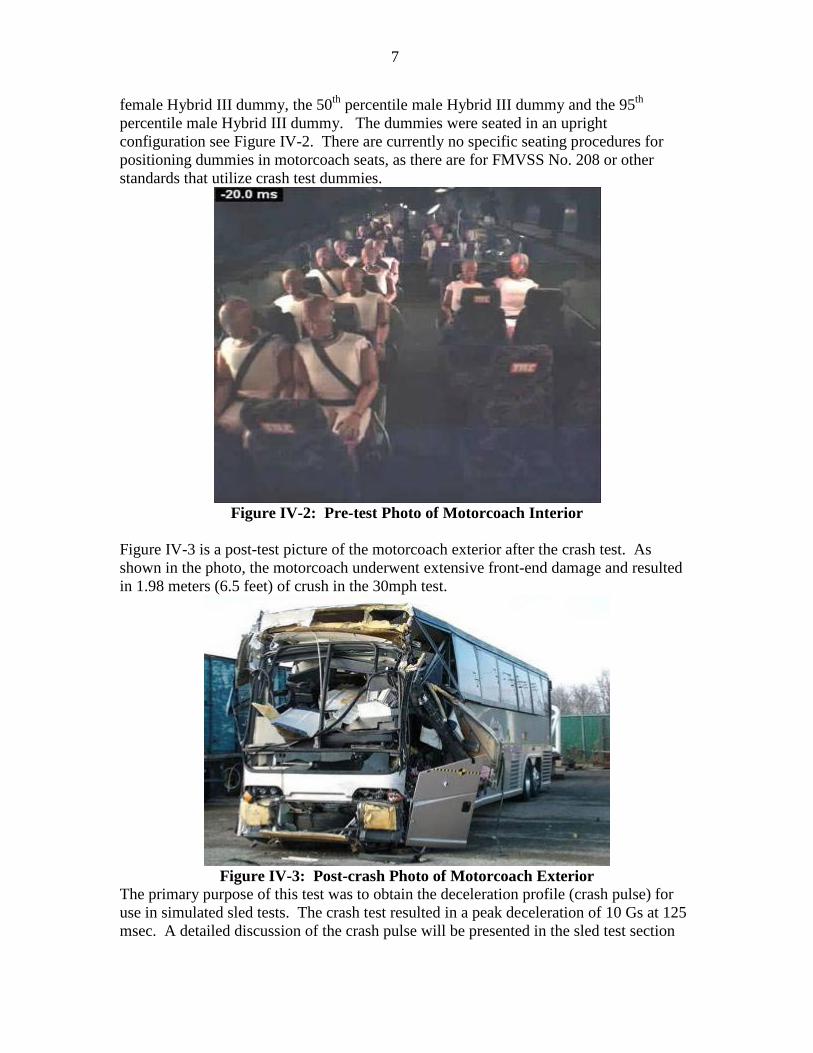
Figure IV-3 is a post-test picture of the motorcoach exterior after the crash test. As shown in the photo, the motorcoach underwent extensive front-end damage and resulted in 1.98 meters (6.5 feet) of crush in the 30mph test.
Figure IV-3: Post-crash Photo of Motorcoach Exterior
The primary purpose of this test was to obtain the deceleration profile (crash pulse) for use in simulated sled tests. The crash test resulted in a peak deceleration of 10 Gs at 125 msec. A detailed discussion of the crash pulse will be presented in the sled test section
8
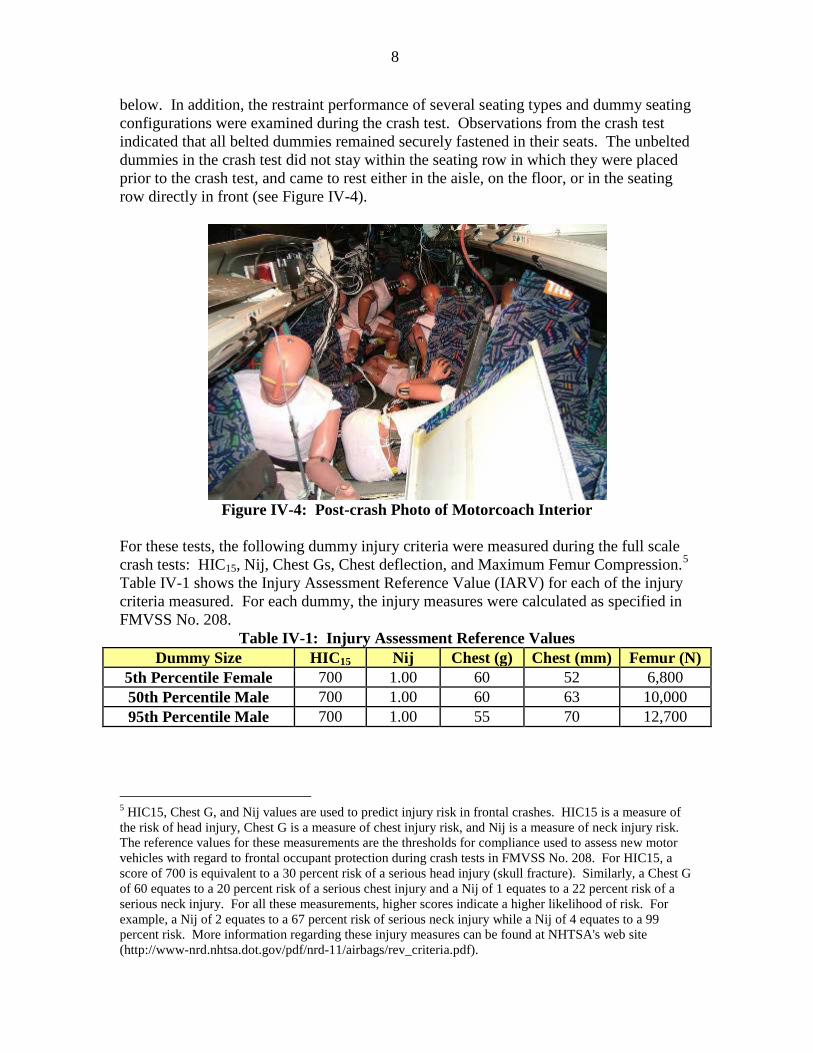
below. In addition, the restraint performance of several seating types and dummy seating configurations were examined during the crash test. Observations from the crash test indicated that all belted dummies remained securely fastened in their seats. The unbelted dummies in the crash test did not stay within the seating row in which they were placed prior to the crash test, and came to rest either in the aisle, on the floor, or in the seating row directly in front (see Figure IV-4).
Figure IV-4: Post-crash Photo of Motorcoach Interior
For these tests, the following dummy injury criteria were measured during the full scale crash tests: HIC15, Nij, Chest Gs, Chest deflection, and Maximum Femur Compression.5
Table IV-1: Injury Assessment Reference Values
Table IV-1 shows the Injury Assessment Reference Value (IARV) for each of the injury criteria measured. For each dummy, the injury measures were calculated as specified in FMVSS No. 208.
Dummy Size HIC15 Nij Chest (g) Chest (mm) Femur (N) 5th Percentile Female 700 1.00 60 52 6,800 50th Percentile Male 700 1.00 60 63 10,000 95th Percentile Male 700 1.00 55 70 12,700
5 HIC15, Chest G, and Nij values are used to predict injury risk in frontal crashes. HIC15 is a measure of the risk of head injury, Chest G is a measure of chest injury risk, and Nij is a measure of neck injury risk. The reference values for these measurements are the thresholds for compliance used to assess new motor vehicles with regard to frontal occupant protection during crash tests in FMVSS No. 208. For HIC15, a score of 700 is equivalent to a 30 percent risk of a serious head injury (skull fracture). Similarly, a Chest G of 60 equates to a 20 percent risk of a serious chest injury and a Nij of 1 equates to a 22 percent risk of a serious neck injury. For all these measurements, higher scores indicate a higher likelihood of risk. For example, a Nij of 2 equates to a 67 percent risk of serious neck injury while a Nij of 4 equates to a 99 percent risk. More information regarding these injury measures can be found at NHTSA's web site (http://www-nrd.nhtsa.dot.gov/pdf/nrd-11/airbags/rev_criteria.pdf).

9
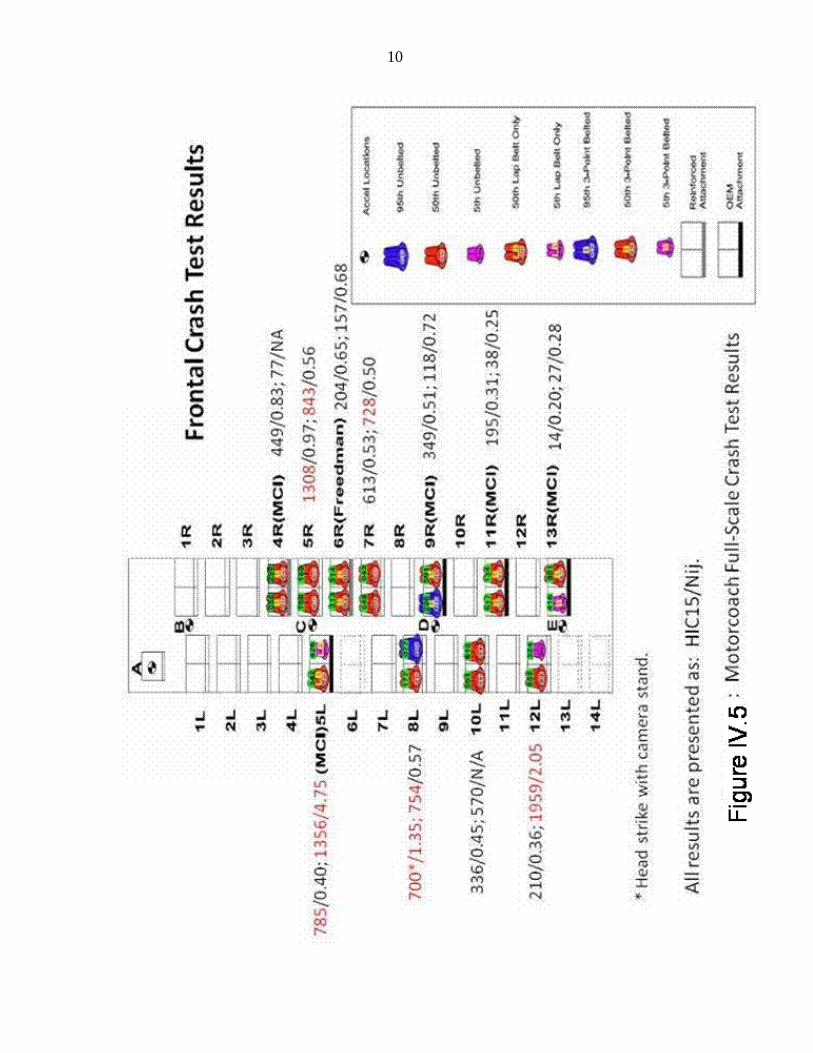
Figure IV-5 presents the HIC15 and Nij injury measures for the various dummy positions. Chest Gs, chest deflection and femur forces were low for all dummies and are not presented in the figure. The unbelted dummies and lap belted dummies generally exhibited higher injury values than dummies secured with lap/shoulder belts. The unbelted dummies seated next to the aisle ended up on the floor in the aisle. The dummies secured with lap/shoulder belts generally stayed in their seats and exhibited the lowest injury values during the crash test.
10
11
Accelerometers were positioned along the center aisle and at the driver seat of the motorcoach to record decelerations during the crash. These deceleration time histories were filtered to 30 Hz to give a relatively smooth trace that can be replicated with the sled. Using these data as a reference, NHTSA developed a metering pin which was used to control the deceleration of the HYGE sled and simulate the full frontal crash test pulse.
Frontal Sled Tests
General Overview of Methodology Twenty sled tests were then conducted to further study the performance of various seating system configurations available for use on motorcoaches for different sized occupants, as well as establish data for comparison with other international standards. Several seating configurations from the full scale motorcoach crash test were also simulated in the sled tests to observe any trends in the dummy injury values. The sled tests were engineered to replicate the deceleration time history of the motorcoach full-scale frontal impact crash test. The goal of the sled tests was to analyze the dummy injury measures to gain a better understanding of the effectiveness of the countermeasures. In addition to injury measures, dummy kinematics were also analyzed to identify the important factors contributing to the type, mechanism, and potential severity of any resulting injury.
Sled Buck Description To evaluate motorcoach safety restraint systems, a sled buck was constructed of three rows of motorcoach seats, each containing two seating positions. Each row had a seating configuration that represented an aisle and window position. The seats were separated by a distance of 34 inches between seats. This corresponded to an average value measured on the full scale motorcoach that was crash tested.6
6 VRTC selected 34 inch spacing after verifying the amount with seat manufacturers and MCI as a good middle value. Since the seats are infinitely adjustable, it is usually up to the fleet operators to install the seats wherever they want. The typical distance between them varies a lot. For example, they are closest together in Hawaii to accommodate more tourists. VRTC verified that the 95th percentile dummy would fit at 34” pitch between seats before selecting it.
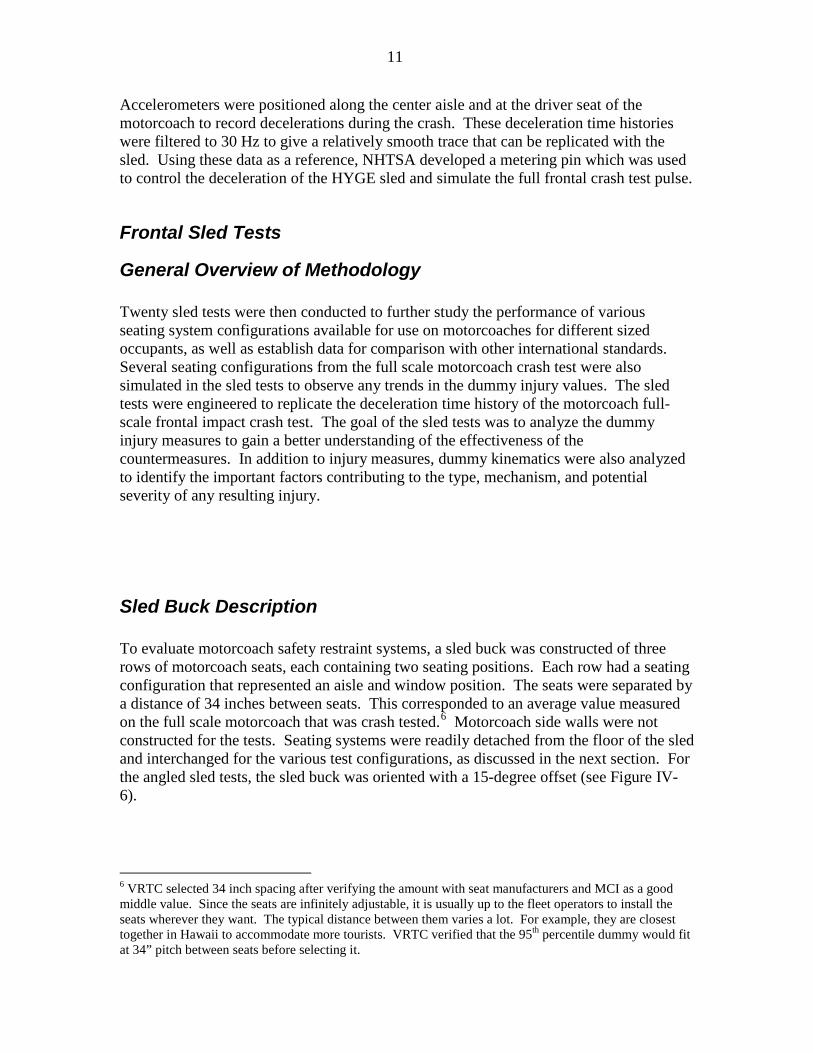
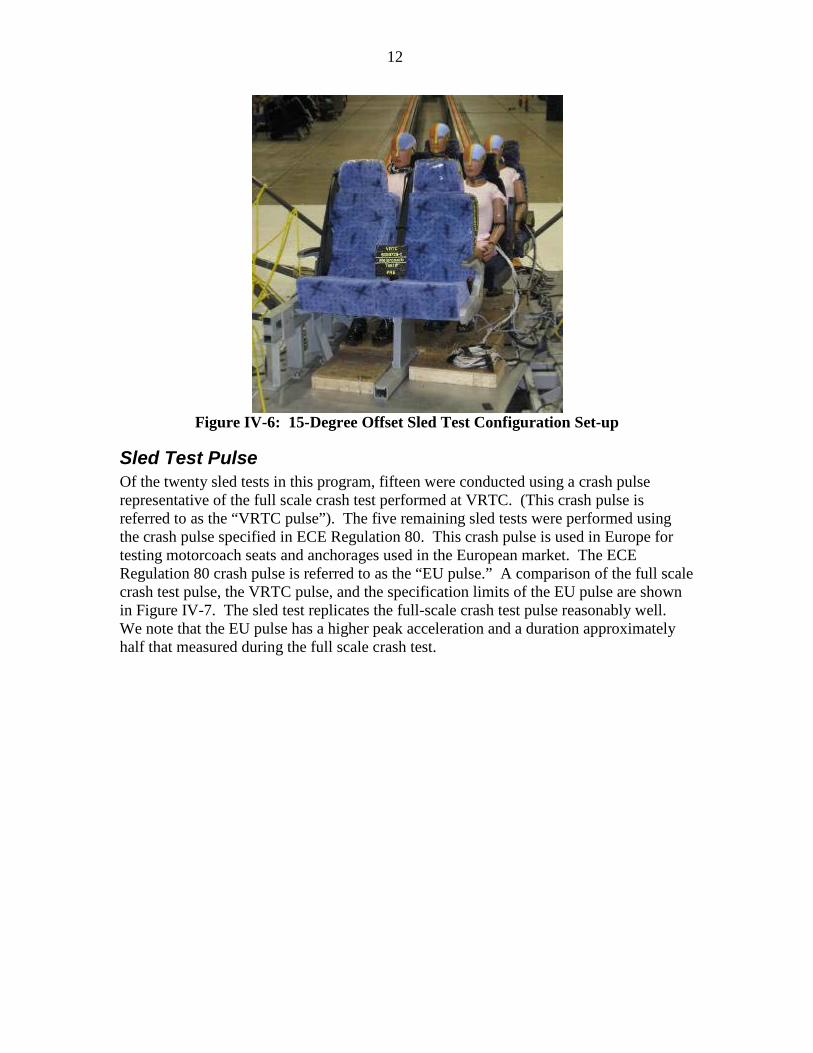
Motorcoach side walls were not constructed for the tests. Seating systems were readily detached from the floor of the sled and interchanged for the various test configurations, as discussed in the next section. For the angled sled tests, the sled buck was oriented with a 15-degree offset (see Figure IV-6).
12
Figure IV-6: 15-Degree Offset Sled Test Configuration Set-up
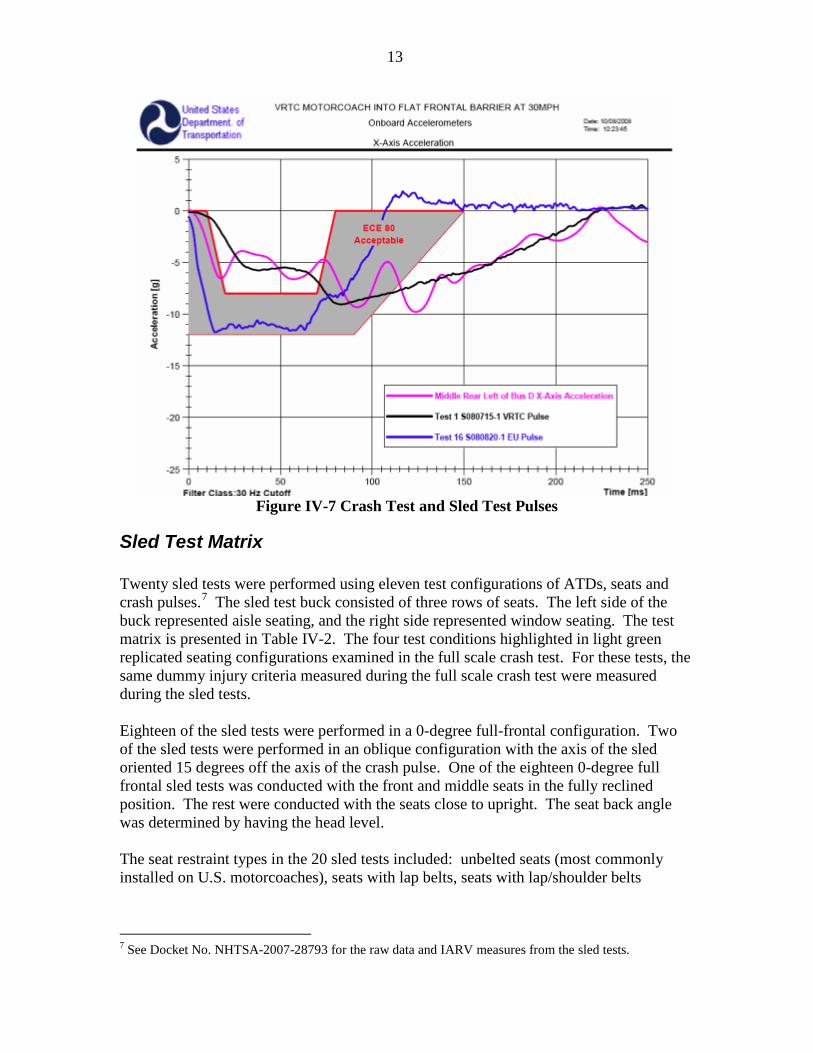
Sled Test Pulse Of the twenty sled tests in this program, fifteen were conducted using a crash pulse representative of the full scale crash test performed at VRTC. (This crash pulse is referred to as the “VRTC pulse”). The five remaining sled tests were performed using the crash pulse specified in ECE Regulation 80. This crash pulse is used in Europe for testing motorcoach seats and anchorages used in the European market. The ECE Regulation 80 crash pulse is referred to as the “EU pulse.” A comparison of the full scale crash test pulse, the VRTC pulse, and the specification limits of the EU pulse are shown in Figure IV-7. The sled test replicates the full-scale crash test pulse reasonably well. We note that the EU pulse has a higher peak acceleration and a duration approximately half that measured during the full scale crash test.
13
Figure IV-7 Crash Test and Sled Test Pulses
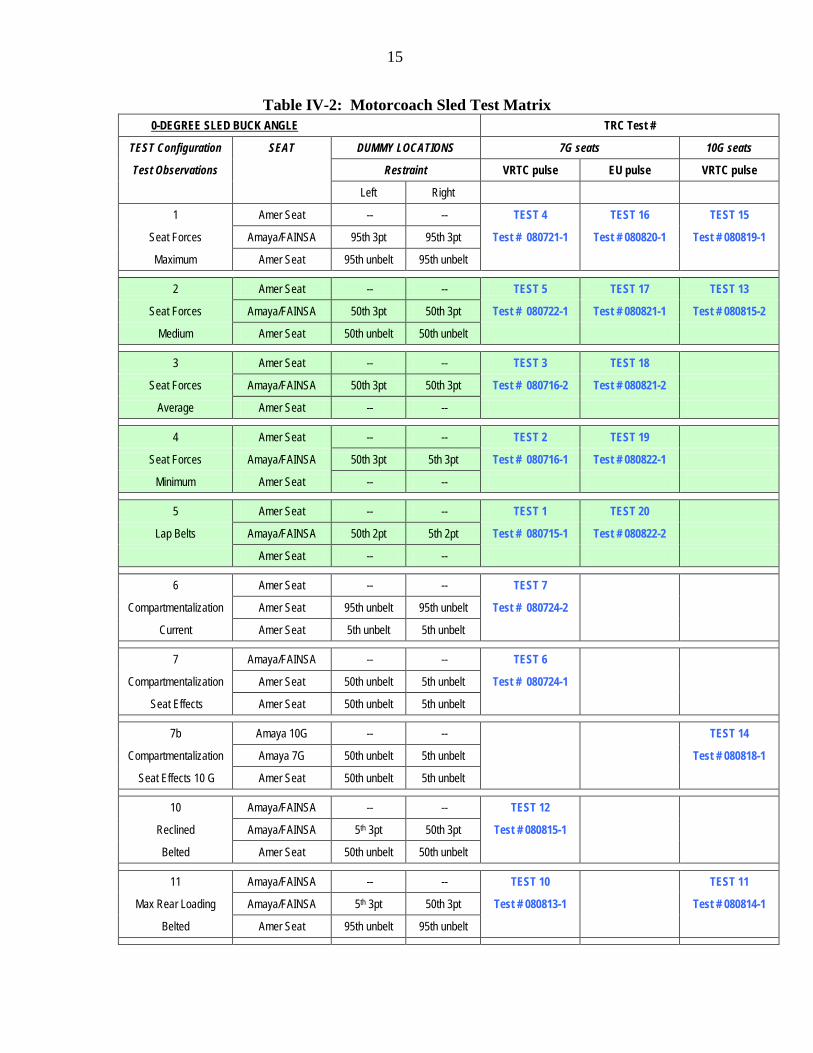
Sled Test Matrix Twenty sled tests were performed using eleven test configurations of ATDs, seats and crash pulses.7
The sled test buck consisted of three rows of seats. The left side of the buck represented aisle seating, and the right side represented window seating. The test matrix is presented in Table IV-2. The four test conditions highlighted in light green replicated seating configurations examined in the full scale crash test. For these tests, the same dummy injury criteria measured during the full scale crash test were measured during the sled tests.
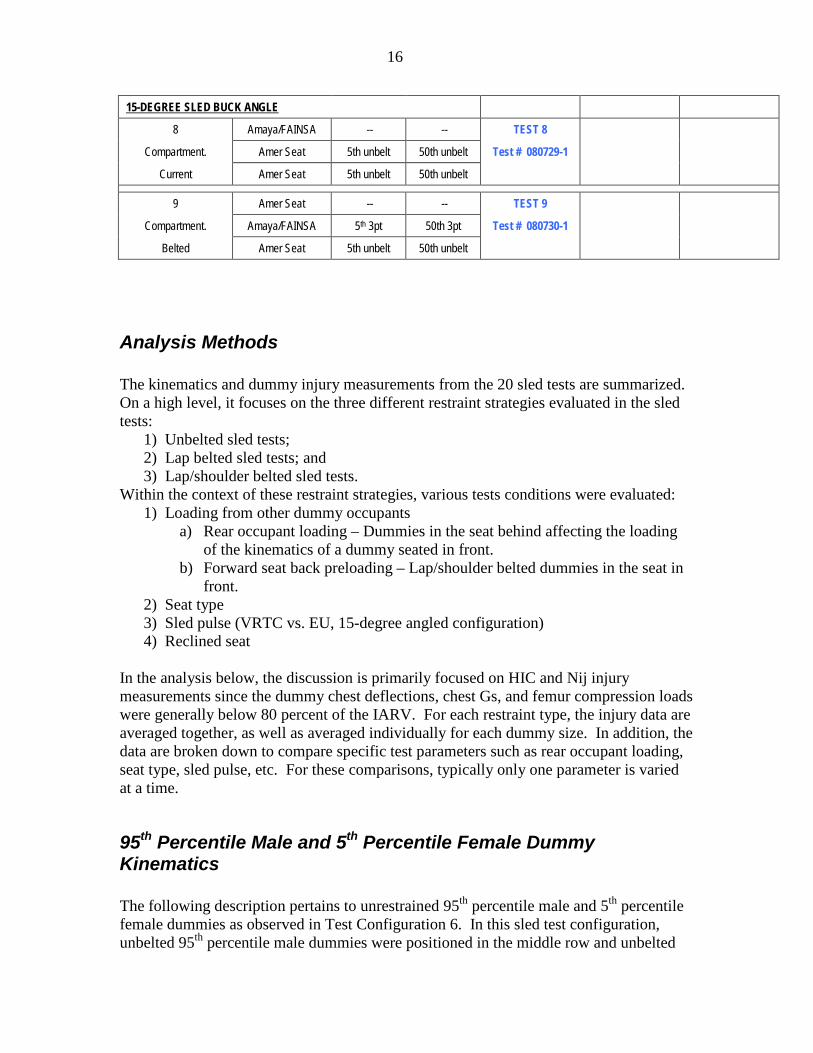
Eighteen of the sled tests were performed in a 0-degree full-frontal configuration. Two of the sled tests were performed in an oblique configuration with the axis of the sled oriented 15 degrees off the axis of the crash pulse. One of the eighteen 0-degree full frontal sled tests was conducted with the front and middle seats in the fully reclined position. The rest were conducted with the seats close to upright. The seat back angle was determined by having the head level. The seat restraint types in the 20 sled tests included: unbelted seats (most commonly installed on U.S. motorcoaches), seats with lap belts, seats with lap/shoulder belts
7 See Docket No. NHTSA-2007-28793 for the raw data and IARV measures from the sled tests.
14
(including those rated in the EU for 7G and 10G test loads).8
8 These seat ratings refer to ECE Regulation 14 and TRANS/WP.29/78/Rev.1/Amend2. ECE Regulation 14 applies to vehicles “having at least 4 wheels and used for the carriage of passengers,” and having more than 8 seats plus the driver with a mass exceeding 5 tonnes (11,023 lbs). Seats which conform to test loads equivalent to 6.6g are referred to as “7G seats.” Seats which conform to test loads equivalent to 10g are referred to as “10G seats.” Unbelted seats are typically rated as 7G. Both Type 1 and Type 2 belted seats are rated as either 7G or 10G.
As shown in Table IV-2, all seats used in the sled test program were either: American (Amer) seats, Amaya seats or Amaya/FAINSA seats. The American seats and Amaya 7G seats were used to represent the unbelted configuration. The Amaya/FAINSA seats were used to represent lap or lap/shoulder belt configurations.
15
Table IV-2: Motorcoach Sled Test Matrix 0-DEGREE SLED BUCK ANGLE TRC Test #
TEST Configuration SEAT DUMMY LOCATIONS 7G seats 10G seats
Test Observations Restraint VRTC pulse EU pulse VRTC pulse
Left Right
1 Amer Seat -- -- TEST 4 TEST 16 TEST 15
Seat Forces Amaya/FAINSA 95th 3pt 95th 3pt Test # 080721-1 Test # 080820-1 Test # 080819-1
Maximum Amer Seat 95th unbelt 95th unbelt 2 Amer Seat -- -- TEST 5 TEST 17 TEST 13
Seat Forces Amaya/FAINSA 50th 3pt 50th 3pt Test # 080722-1 Test # 080821-1 Test # 080815-2
Medium Amer Seat 50th unbelt 50th unbelt 3 Amer Seat -- -- TEST 3 TEST 18
Seat Forces Amaya/FAINSA 50th 3pt 50th 3pt Test # 080716-2 Test # 080821-2
Average Amer Seat -- -- 4 Amer Seat -- -- TEST 2 TEST 19
Seat Forces Amaya/FAINSA 50th 3pt 5th 3pt Test # 080716-1 Test # 080822-1
Minimum Amer Seat -- -- 5 Amer Seat -- -- TEST 1 TEST 20
Lap Belts Amaya/FAINSA 50th 2pt 5th 2pt Test # 080715-1 Test # 080822-2
Amer Seat -- -- 6 Amer Seat -- -- TEST 7
Compartmentalization Amer Seat 95th unbelt 95th unbelt Test # 080724-2
Current Amer Seat 5th unbelt 5th unbelt 7 Amaya/FAINSA -- -- TEST 6
Compartmentalization Amer Seat 50th unbelt 5th unbelt Test # 080724-1
Seat Effects Amer Seat 50th unbelt 5th unbelt
7b Amaya 10G -- -- TEST 14
Compartmentalization Amaya 7G 50th unbelt 5th unbelt Test # 080818-1
Seat Effects 10 G Amer Seat 50th unbelt 5th unbelt
10 Amaya/FAINSA -- -- TEST 12
Reclined Amaya/FAINSA 5th 3pt 50th 3pt Test # 080815-1
Belted Amer Seat 50th unbelt 50th unbelt
11 Amaya/FAINSA -- -- TEST 10 TEST 11
Max Rear Loading Amaya/FAINSA 5th 3pt 50th 3pt Test # 080813-1 Test # 080814-1
Belted Amer Seat 95th unbelt 95th unbelt
16
15-DEGREE SLED BUCK ANGLE
8 Amaya/FAINSA -- -- TEST 8
Compartment. Amer Seat 5th unbelt 50th unbelt Test # 080729-1
Current Amer Seat 5th unbelt 50th unbelt 9 Amer Seat -- -- TEST 9
Compartment. Amaya/FAINSA 5th 3pt 50th 3pt Test # 080730-1
Belted Amer Seat 5th unbelt 50th unbelt
Analysis Methods The kinematics and dummy injury measurements from the 20 sled tests are summarized. On a high level, it focuses on the three different restraint strategies evaluated in the sled tests:
1) Unbelted sled tests; 2) Lap belted sled tests; and 3) Lap/shoulder belted sled tests.
Within the context of these restraint strategies, various tests conditions were evaluated: 1) Loading from other dummy occupants
a) Rear occupant loading – Dummies in the seat behind affecting the loading of the kinematics of a dummy seated in front.
b) Forward seat back preloading – Lap/shoulder belted dummies in the seat in front.
2) Seat type 3) Sled pulse (VRTC vs. EU, 15-degree angled configuration) 4) Reclined seat
In the analysis below, the discussion is primarily focused on HIC and Nij injury measurements since the dummy chest deflections, chest Gs, and femur compression loads were generally below 80 percent of the IARV. For each restraint type, the injury data are averaged together, as well as averaged individually for each dummy size. In addition, the data are broken down to compare specific test parameters such as rear occupant loading, seat type, sled pulse, etc. For these comparisons, typically only one parameter is varied at a time.
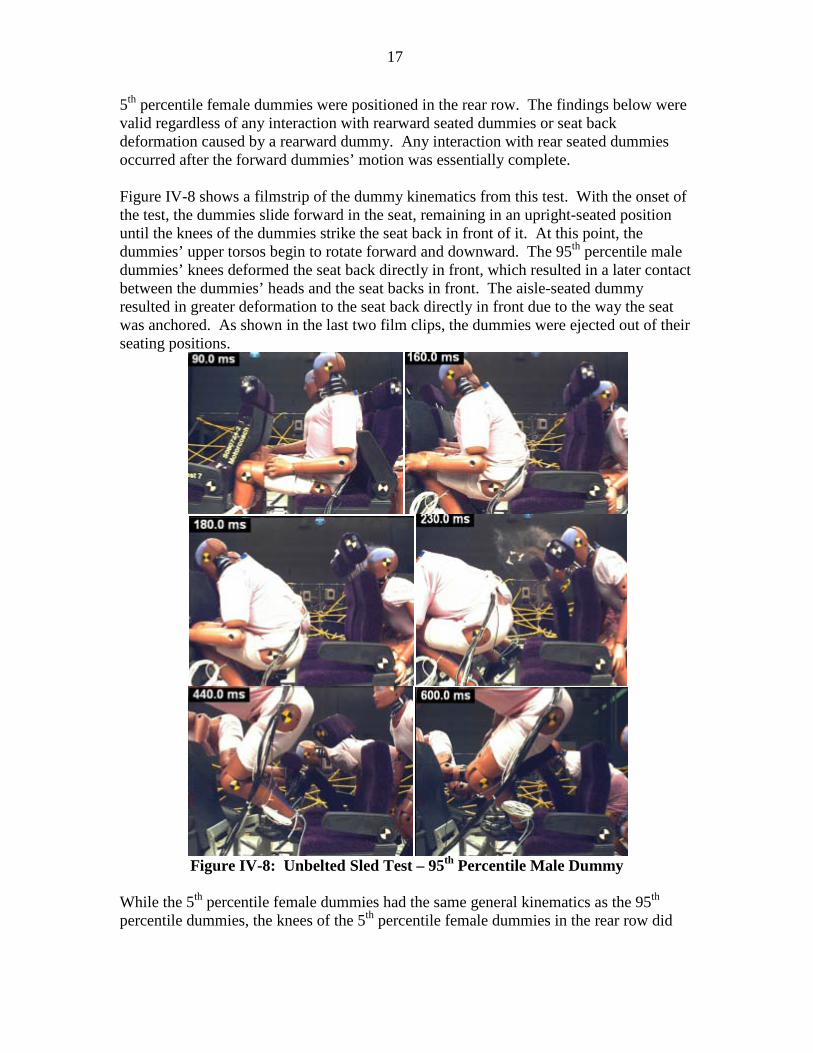
95th Percentile Male and 5th Percentile Female Dummy Kinematics The following description pertains to unrestrained 95th percentile male and 5th percentile female dummies as observed in Test Configuration 6. In this sled test configuration, unbelted 95th percentile male dummies were positioned in the middle row and unbelted
17
5th percentile female dummies were positioned in the rear row. The findings below were valid regardless of any interaction with rearward seated dummies or seat back deformation caused by a rearward dummy. Any interaction with rear seated dummies occurred after the forward dummies’ motion was essentially complete. Figure IV-8 shows a filmstrip of the dummy kinematics from this test. With the onset of the test, the dummies slide forward in the seat, remaining in an upright-seated position until the knees of the dummies strike the seat back in front of it. At this point, the dummies’ upper torsos begin to rotate forward and downward. The 95th percentile male dummies’ knees deformed the seat back directly in front, which resulted in a later contact between the dummies’ heads and the seat backs in front. The aisle-seated dummy resulted in greater deformation to the seat back directly in front due to the way the seat was anchored. As shown in the last two film clips, the dummies were ejected out of their seating positions.
Figure IV-8: Unbelted Sled Test – 95th Percentile Male Dummy
While the 5th percentile female dummies had the same general kinematics as the 95th percentile dummies, the knees of the 5th percentile female dummies in the rear row did

18
not deform the middle row seat back as much. Consequently, the dummies had a much more severe head contact with the seat back directly in front. At the end of the test, the aisle-seated dummies ended up in the aisle. The window-seated 95th percentile male dummy ended up in the front row while the 5th percentile female dummy ended up rebounding back into her initial seat. This discrepancy in kinematics between the aisle and window-seated dummies was due to the different amounts of deformation of the seat back directly in front of the dummies.
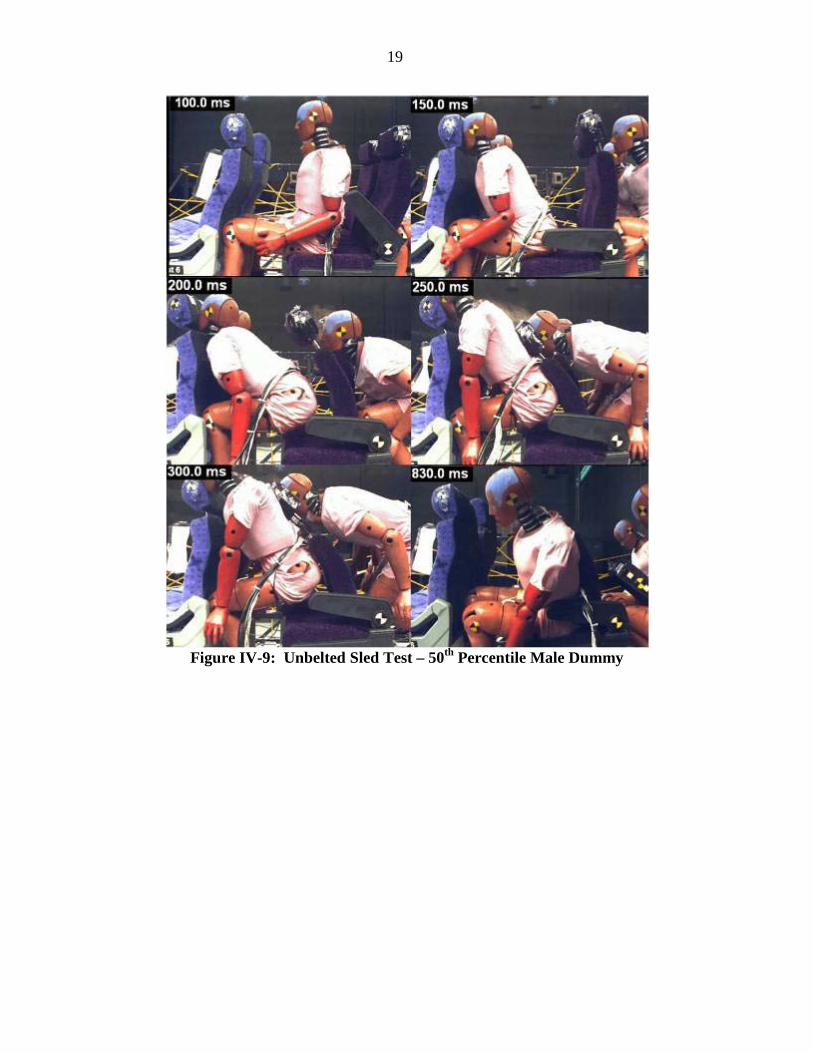
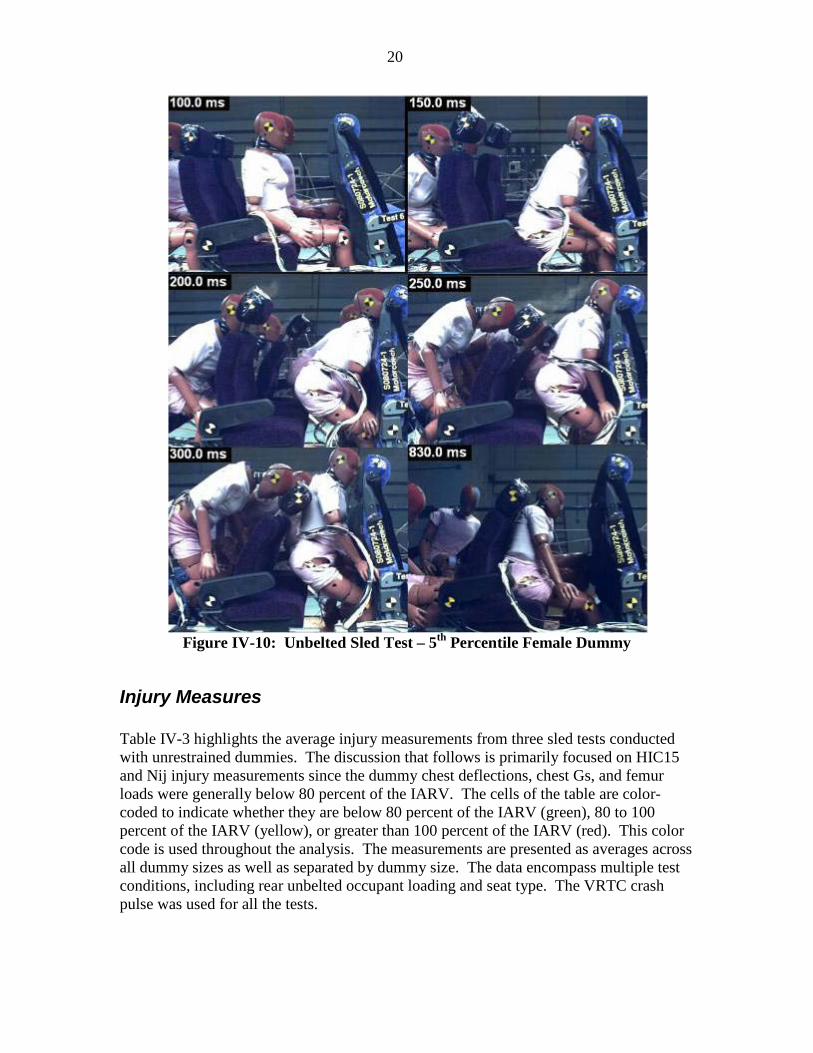
50th Percentile Male and 5th Percentile Female Dummy Kinematics The following description pertains to unrestrained 50th percentile male and 5th percentile female dummies as observed in Test Configuration 7. In this unbelted sled test, unbelted 50th percentile male dummies were positioned in the aisle seats (middle and rear rows) and unbelted 5th percentile female dummies were positioned in the window seats (middle and rear rows). As in the previous section, the findings below were valid regardless of any interaction with rearward seated dummies or seat back deformation caused by a rearward dummy. Any interaction with rear seated dummies occurred after the forward dummies’ motion was essentially complete. Figures IV-9 and IV-10 provide filmstrip9
illustrations of the dummy kinematics from this test series (for the 50th percentile male dummy and 5th percentile female dummy, respectively). In this particular test, the front row seats were Amaya/FAINSA 7G seats which have a stiffer seat back than the standard American type seats. With the onset of the test, the dummies slide forward in the seat, remaining in an upright-seated position until the knees of the dummies strike the seat back in front of it. At this point, the dummies’ upper torsos begin to rotate forward and downward.
Since the rear row dummies interacted with the standard American seat and the middle row dummies interacted with the stiffer (front row) seats, the middle row occupants resulted in higher neck extension than the rear row dummies when making contact. As seen in the prior test series, the 50th percentile male dummy in the rear row provided more knee-imparted deformation to the seat in front resulting in later head contact with the seat back than the adjacent 5th percentile female dummy. Unlike the previous test configuration with American seats, the aisle-seated dummies did not end up in the aisle at the end of the test. They were positioned in their original seating locations at final rest.
9 Reference: Sled Test Configuration 7, Test 6.
19
Figure IV-9: Unbelted Sled Test – 50th Percentile Male Dummy
20
Figure IV-10: Unbelted Sled Test – 5th Percentile Female Dummy
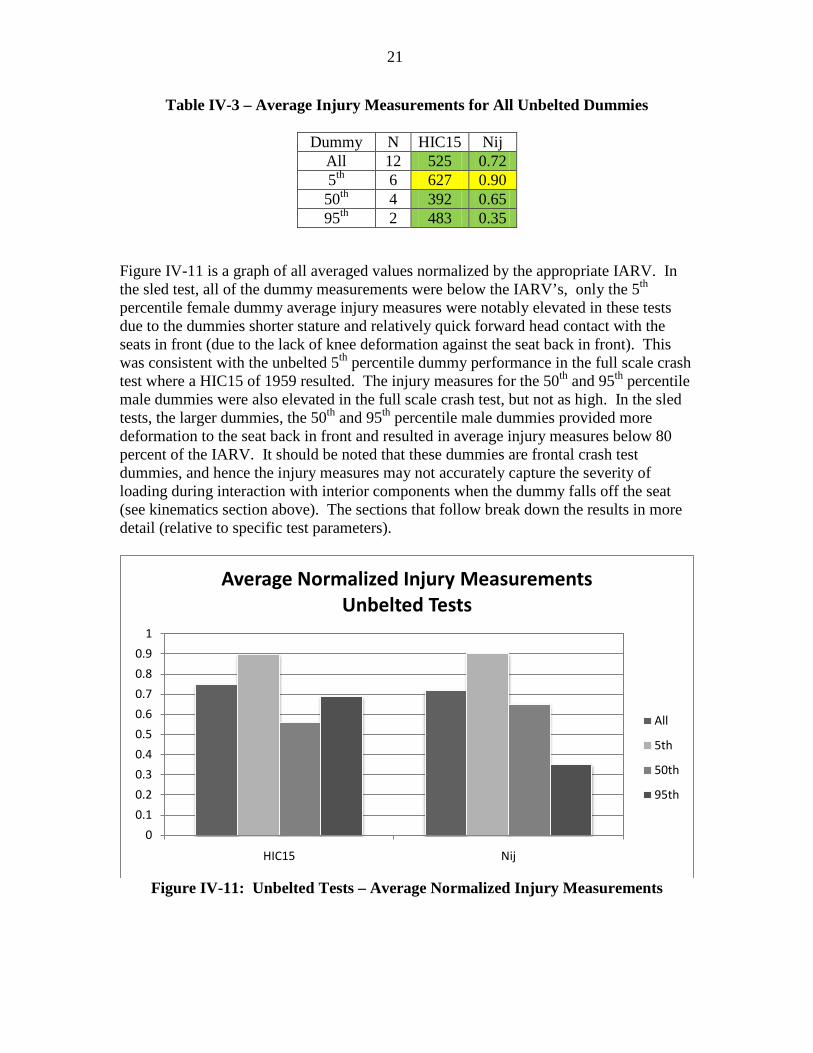
Injury Measures Table IV-3 highlights the average injury measurements from three sled tests conducted with unrestrained dummies. The discussion that follows is primarily focused on HIC15 and Nij injury measurements since the dummy chest deflections, chest Gs, and femur loads were generally below 80 percent of the IARV. The cells of the table are color-coded to indicate whether they are below 80 percent of the IARV (green), 80 to 100 percent of the IARV (yellow), or greater than 100 percent of the IARV (red). This color code is used throughout the analysis. The measurements are presented as averages across all dummy sizes as well as separated by dummy size. The data encompass multiple test conditions, including rear unbelted occupant loading and seat type. The VRTC crash pulse was used for all the tests.
21
Table IV-3 – Average Injury Measurements for All Unbelted Dummies
Dummy N HIC15 Nij All 12 525 0.72 5th 6 627 0.90 50th 4 392 0.65 95th 2 483 0.35
Figure IV-11 is a graph of all averaged values normalized by the appropriate IARV. In the sled test, all of the dummy measurements were below the IARV’s, only the 5th percentile female dummy average injury measures were notably elevated in these tests due to the dummies shorter stature and relatively quick forward head contact with the seats in front (due to the lack of knee deformation against the seat back in front). This was consistent with the unbelted 5th percentile dummy performance in the full scale crash test where a HIC15 of 1959 resulted. The injury measures for the 50th and 95th percentile male dummies were also elevated in the full scale crash test, but not as high. In the sled tests, the larger dummies, the 50th and 95th percentile male dummies provided more deformation to the seat back in front and resulted in average injury measures below 80 percent of the IARV. It should be noted that these dummies are frontal crash test dummies, and hence the injury measures may not accurately capture the severity of loading during interaction with interior components when the dummy falls off the seat (see kinematics section above). The sections that follow break down the results in more detail (relative to specific test parameters).
Figure IV-11: Unbelted Tests – Average Normalized Injury Measurements
0
0.1
0.2
0.3
0.4
0.5
0.6
0.7
0.8
0.9
1
HIC15 Nij
Average Normalized Injury Measurements Unbelted Tests
All
5th
50th
95th
22
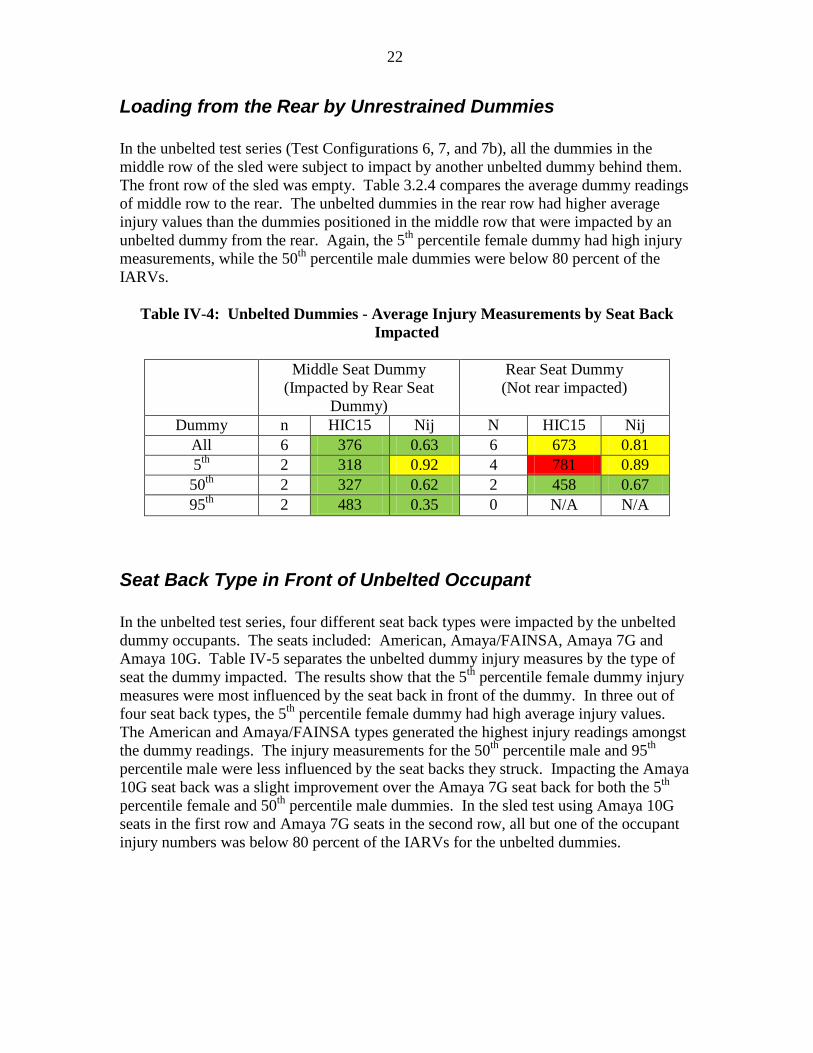
Loading from the Rear by Unrestrained Dummies In the unbelted test series (Test Configurations 6, 7, and 7b), all the dummies in the middle row of the sled were subject to impact by another unbelted dummy behind them. The front row of the sled was empty. Table 3.2.4 compares the average dummy readings of middle row to the rear. The unbelted dummies in the rear row had higher average injury values than the dummies positioned in the middle row that were impacted by an unbelted dummy from the rear. Again, the 5th percentile female dummy had high injury measurements, while the 50th percentile male dummies were below 80 percent of the IARVs.
Table IV-4: Unbelted Dummies - Average Injury Measurements by Seat Back Impacted
Middle Seat Dummy
(Impacted by Rear Seat Dummy)
Rear Seat Dummy (Not rear impacted)
Dummy n HIC15 Nij N HIC15 Nij All 6 376 0.63 6 673 0.81 5th 2 318 0.92 4 781 0.89 50th 2 327 0.62 2 458 0.67 95th 2 483 0.35 0 N/A N/A
Seat Back Type in Front of Unbelted Occupant In the unbelted test series, four different seat back types were impacted by the unbelted dummy occupants. The seats included: American, Amaya/FAINSA, Amaya 7G and Amaya 10G. Table IV-5 separates the unbelted dummy injury measures by the type of seat the dummy impacted. The results show that the 5th percentile female dummy injury measures were most influenced by the seat back in front of the dummy. In three out of four seat back types, the 5th percentile female dummy had high average injury values. The American and Amaya/FAINSA types generated the highest injury readings amongst the dummy readings. The injury measurements for the 50th percentile male and 95th percentile male were less influenced by the seat backs they struck. Impacting the Amaya 10G seat back was a slight improvement over the Amaya 7G seat back for both the 5th percentile female and 50th percentile male dummies. In the sled test using Amaya 10G seats in the first row and Amaya 7G seats in the second row, all but one of the occupant injury numbers was below 80 percent of the IARVs for the unbelted dummies.

23
Table IV-5: Unbelted Dummies - Average Injury Measurements by Seat Back Impacted
American Amaya/FAINSA Amaya 7G Amaya 10G
Dummy
n HIC15 Nij n HIC15 Nij n HIC15
Nij n HIC15 Nij
All 6 694 0.64 2 379 0.95 2 379 .95 2 266 0.59 5th 3 914 0.86 1 318 1.05 1 385 .97 1 318 0.78 50th 1 458 0.56 1 440 .85 1 457 .78 1 214 0.39 95th 2 483 0.35 0 N/A N/A 0 N/A N/A 0 N/A N/A
Lap Belt Sled Tests
Dummy Kinematics The following description pertains to lap belt restrained 5th percentile female and 50th percentile male dummies as observed in sled Test Configuration 5. In this sled test configuration, a lap belted 50th percentile male dummy was positioned in the aisle seat and a lap belted 5th percentile female dummy in the window seat. Figure IV-12 provides a filmstrip10
illustration of the dummy kinematics from this test series. The 5th percentile female and the 50th percentile male dummies have the same general kinematics. The differences were mainly found in the time and location of interaction between the dummy’s head and seat back.
The kinematics for a lap belt restrained passenger begins in a similar fashion to that of an unbelted passenger. With the onset of the test, the dummies slide forward in the seat, remaining in an upright-seated position until all the slack and/or stretch in the belt webbings are removed, and/or the knees of the dummies strike the seat back in front of it. At this point, the dummies’ upper torsos begin to rotate forward and downward. Since the lap belts helped in reducing the femur loads on the dummies, it did not force the seat backs directly in front to deform quite as much. Therefore, the dummies’ heads contacted the seat backs at an earlier time, when they were more upright. This resulted in significant neck extension in the dummies. As shown in Figure IV-12, the lap belt successfully maintained the dummies within their initial seat position. However, the extent, timing, and location of occupant head interaction were a function of other parameters, such as occupant size. As discussed in the next section, the dummy injury measurements were very high in this test condition.
10 Reference: Sled Test Configuration 5, Test 1.

24
Figure IV-12: Lap Belted Sled Test – 50th Percentile Male Dummy
Injury Measures Table IV-6 highlights the average injury measurements from two sled tests conducted with lap belted 5th percentile female and 50th percentile male dummies. Two crash pulses were utilized in these sled tests: the VRTC pulse and the EU pulse. Both tests were conducted with 7G seats and no rear occupants. Table IV-6 shows that the average dummy response in the lap belted sled tests. In every instance, the dummies exceeded the head and neck IARVs when the dummies were lap belted. This was consistent with the full scale crash test that resulted in a HIC15 value of 785 for the 50th percentile male dummy and 1,356 for the 5th percentile female dummy. Unlike the unbelted test series and the crash test, however, the 50th percentile male dummy had slightly higher average readings than the 5th percentile female dummy.
Table IV-6 – Average Injury Measurements for All Lap Belted Dummies
Dummy n HIC15 Nij All 4 1137 1.69 5th 2 1082 1.37 50th 2 1192 2.01 95th 0 N/A N/A
25
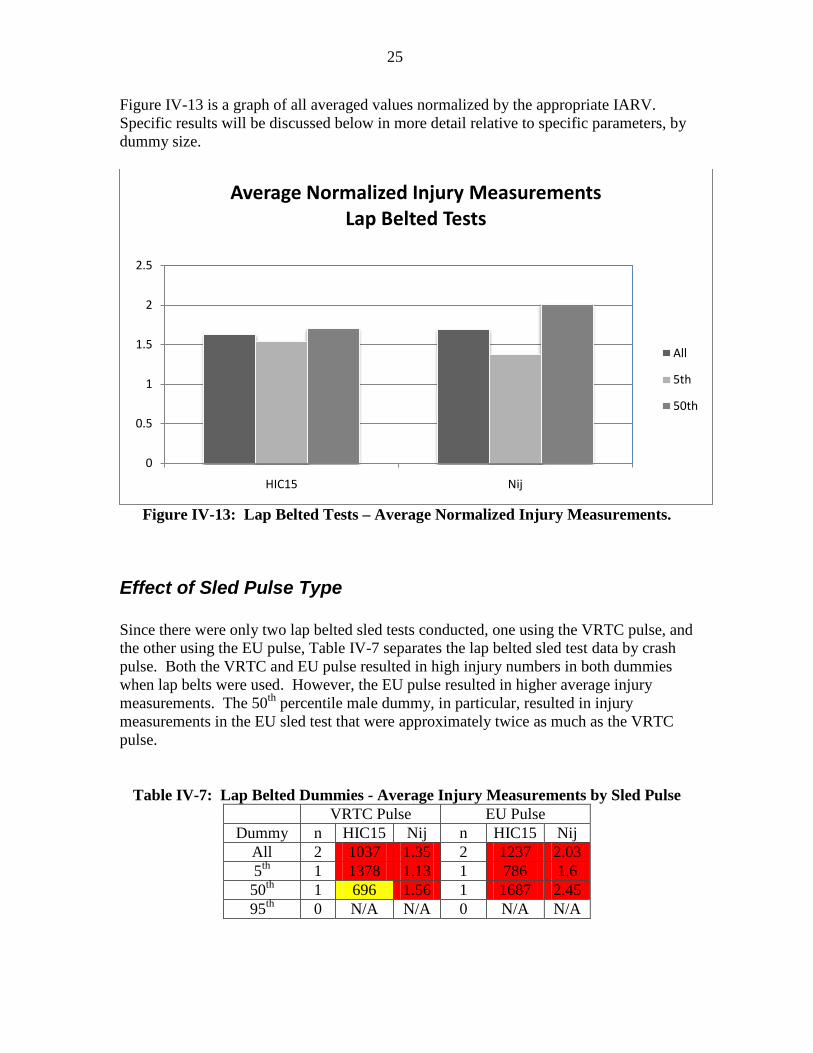
Figure IV-13 is a graph of all averaged values normalized by the appropriate IARV. Specific results will be discussed below in more detail relative to specific parameters, by dummy size.
Figure IV-13: Lap Belted Tests – Average Normalized Injury Measurements.
Effect of Sled Pulse Type Since there were only two lap belted sled tests conducted, one using the VRTC pulse, and the other using the EU pulse, Table IV-7 separates the lap belted sled test data by crash pulse. Both the VRTC and EU pulse resulted in high injury numbers in both dummies when lap belts were used. However, the EU pulse resulted in higher average injury measurements. The 50th percentile male dummy, in particular, resulted in injury measurements in the EU sled test that were approximately twice as much as the VRTC pulse.
Table IV-7: Lap Belted Dummies - Average Injury Measurements by Sled Pulse VRTC Pulse EU Pulse
Dummy n HIC15 Nij n HIC15 Nij All 2 1037 1.35 2 1237 2.03 5th 1 1378 1.13 1 786 1.6 50th 1 696 1.56 1 1687 2.45 95th 0 N/A N/A 0 N/A N/A
0
0.5
1
1.5
2
2.5
HIC15 Nij
Average Normalized Injury MeasurementsLap Belted Tests
All
5th
50th
26
Lap/Shoulder Belt Sled Tests
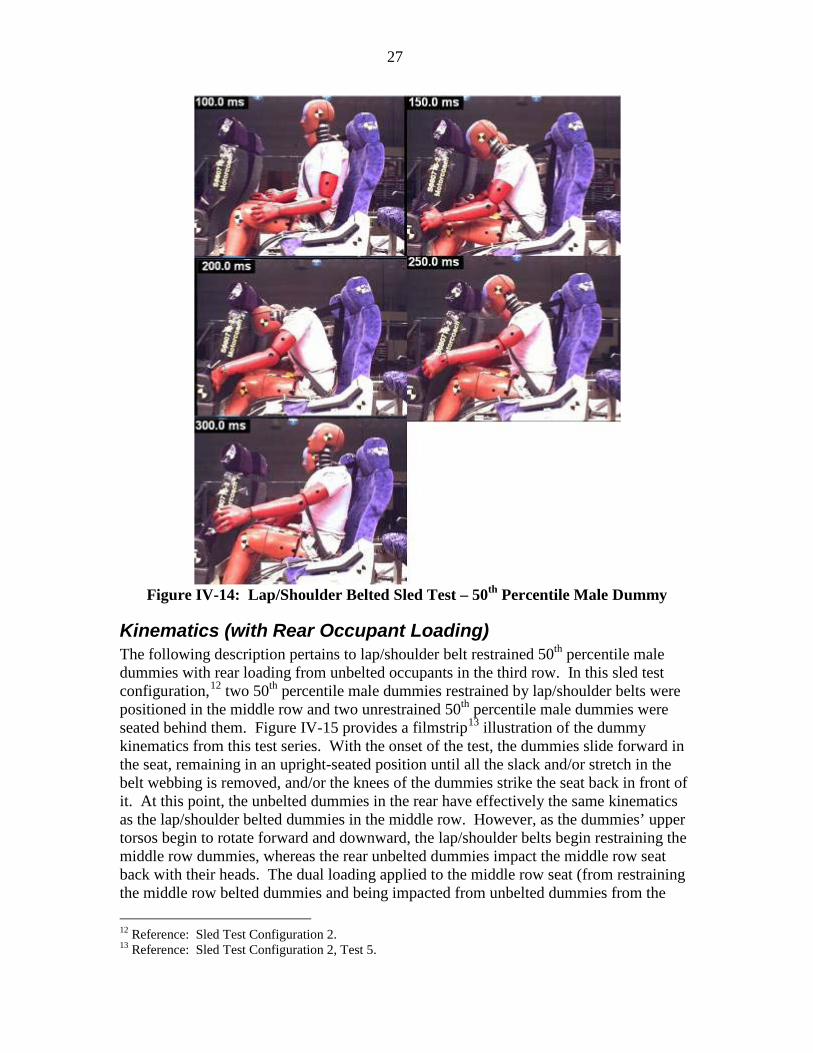
Kinematics (without Rear Occupant Loading) The following description pertains to lap/shoulder belt restrained 50th percentile male dummies without rear loading from unbelted occupants in the third row of Test Configuration 3, though similar observations were made with the 5th percentile female dummy (Test Configuration 4). In the sled tests (Test Configuration 3), two 50th percentile male dummies restrained by lap/shoulder belts were positioned in the middle row and no dummies were seated rearward. Figure IV-14 provides a filmstrip11
illustration of the dummy kinematics from this test series. With the onset of the test, the dummies slide forward in the seat, remaining in an upright-seated position until all the slack and/or stretch in the belt webbing is removed, and/or the knees of the dummies strike the seat back in front of it. At this point, the dummies’ upper torsos begin to rotate forward and downward; however, the lap/shoulder belt minimizes and restrains the motion of the upper torsos and prevents the dummies from contacting the seats in front. The fact that the dummy does not contact the seat in front is due to the dummy sitting height, the seat spacing and the lack of seat deformation due to an unbelted rear occupant. Upon rebound, the torsos of the dummies move upwards and backwards towards the seat. The dummies then slide rearward in a more upright-seated position. The lap/shoulder belts successfully maintained the dummies in their original seating position.
11 Reference: Sled Test Configuration 3, Test 3.
27
Figure IV-14: Lap/Shoulder Belted Sled Test – 50th Percentile Male Dummy
Kinematics (with Rear Occupant Loading) The following description pertains to lap/shoulder belt restrained 50th percentile male dummies with rear loading from unbelted occupants in the third row. In this sled test configuration,12 two 50th percentile male dummies restrained by lap/shoulder belts were positioned in the middle row and two unrestrained 50th percentile male dummies were seated behind them. Figure IV-15 provides a filmstrip13
12 Reference: Sled Test Configuration 2.
illustration of the dummy kinematics from this test series. With the onset of the test, the dummies slide forward in the seat, remaining in an upright-seated position until all the slack and/or stretch in the belt webbing is removed, and/or the knees of the dummies strike the seat back in front of it. At this point, the unbelted dummies in the rear have effectively the same kinematics as the lap/shoulder belted dummies in the middle row. However, as the dummies’ upper torsos begin to rotate forward and downward, the lap/shoulder belts begin restraining the middle row dummies, whereas the rear unbelted dummies impact the middle row seat back with their heads. The dual loading applied to the middle row seat (from restraining the middle row belted dummies and being impacted from unbelted dummies from the
13 Reference: Sled Test Configuration 2, Test 5.
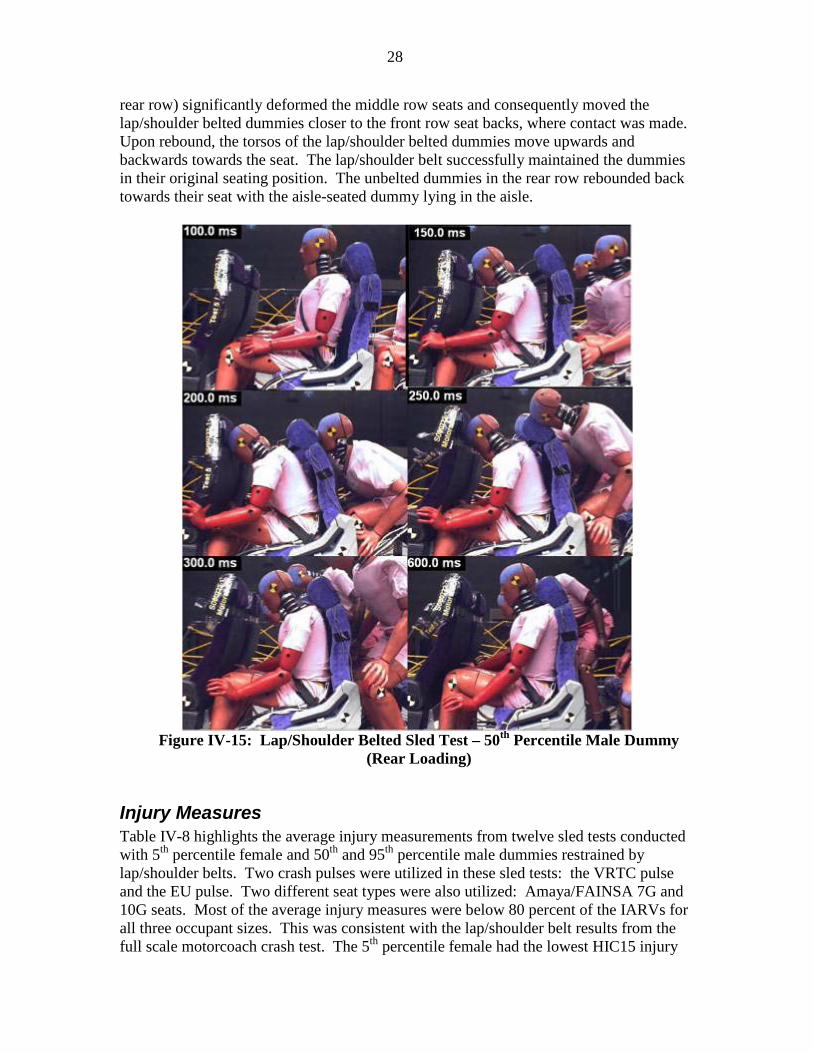
28
rear row) significantly deformed the middle row seats and consequently moved the lap/shoulder belted dummies closer to the front row seat backs, where contact was made. Upon rebound, the torsos of the lap/shoulder belted dummies move upwards and backwards towards the seat. The lap/shoulder belt successfully maintained the dummies in their original seating position. The unbelted dummies in the rear row rebounded back towards their seat with the aisle-seated dummy lying in the aisle.
Figure IV-15: Lap/Shoulder Belted Sled Test – 50th Percentile Male Dummy
(Rear Loading)
Injury Measures Table IV-8 highlights the average injury measurements from twelve sled tests conducted with 5th percentile female and 50th and 95th percentile male dummies restrained by lap/shoulder belts. Two crash pulses were utilized in these sled tests: the VRTC pulse and the EU pulse. Two different seat types were also utilized: Amaya/FAINSA 7G and 10G seats. Most of the average injury measures were below 80 percent of the IARVs for all three occupant sizes. This was consistent with the lap/shoulder belt results from the full scale motorcoach crash test. The 5th percentile female had the lowest HIC15 injury
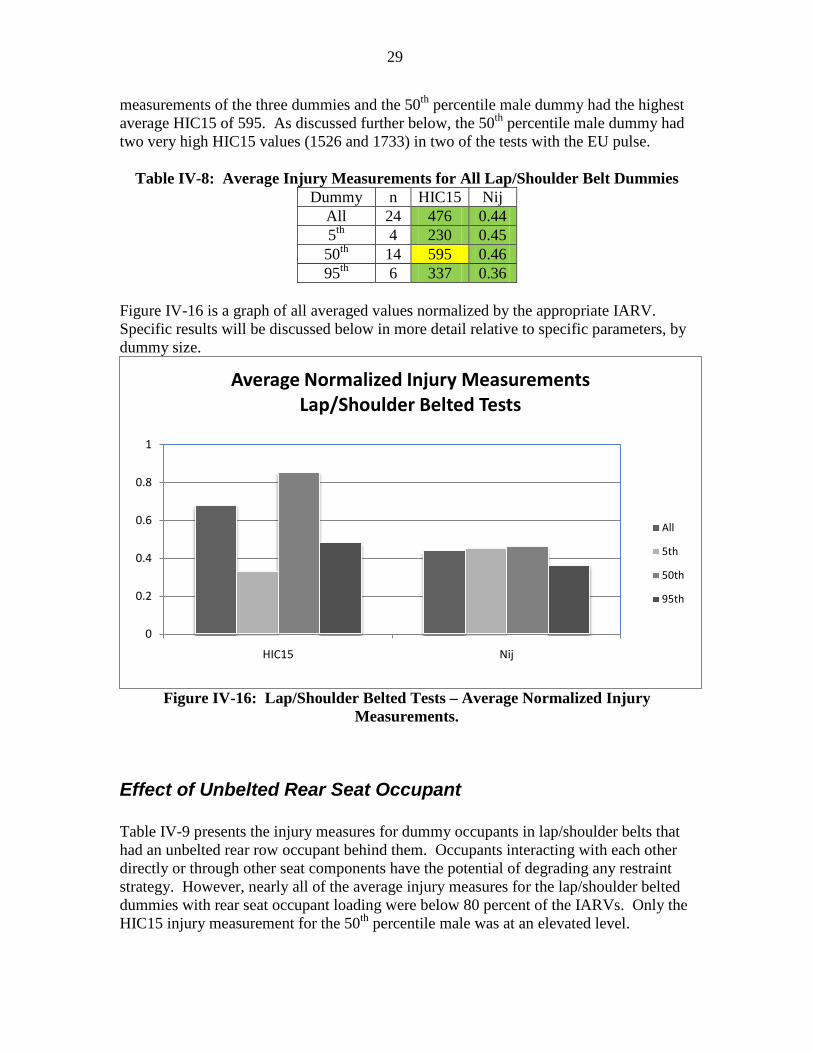
29
measurements of the three dummies and the 50th percentile male dummy had the highest average HIC15 of 595. As discussed further below, the 50th percentile male dummy had two very high HIC15 values (1526 and 1733) in two of the tests with the EU pulse.
Table IV-8: Average Injury Measurements for All Lap/Shoulder Belt Dummies Dummy n HIC15 Nij
All 24 476 0.44 5th 4 230 0.45 50th 14 595 0.46 95th 6 337 0.36
Figure IV-16 is a graph of all averaged values normalized by the appropriate IARV. Specific results will be discussed below in more detail relative to specific parameters, by dummy size.
Figure IV-16: Lap/Shoulder Belted Tests – Average Normalized Injury Measurements.
Effect of Unbelted Rear Seat Occupant Table IV-9 presents the injury measures for dummy occupants in lap/shoulder belts that had an unbelted rear row occupant behind them. Occupants interacting with each other directly or through other seat components have the potential of degrading any restraint strategy. However, nearly all of the average injury measures for the lap/shoulder belted dummies with rear seat occupant loading were below 80 percent of the IARVs. Only the HIC15 injury measurement for the 50th percentile male was at an elevated level.
0
0.2
0.4
0.6
0.8
1
HIC15 Nij
Average Normalized Injury Measurements Lap/Shoulder Belted Tests
All
5th
50th
95th
30
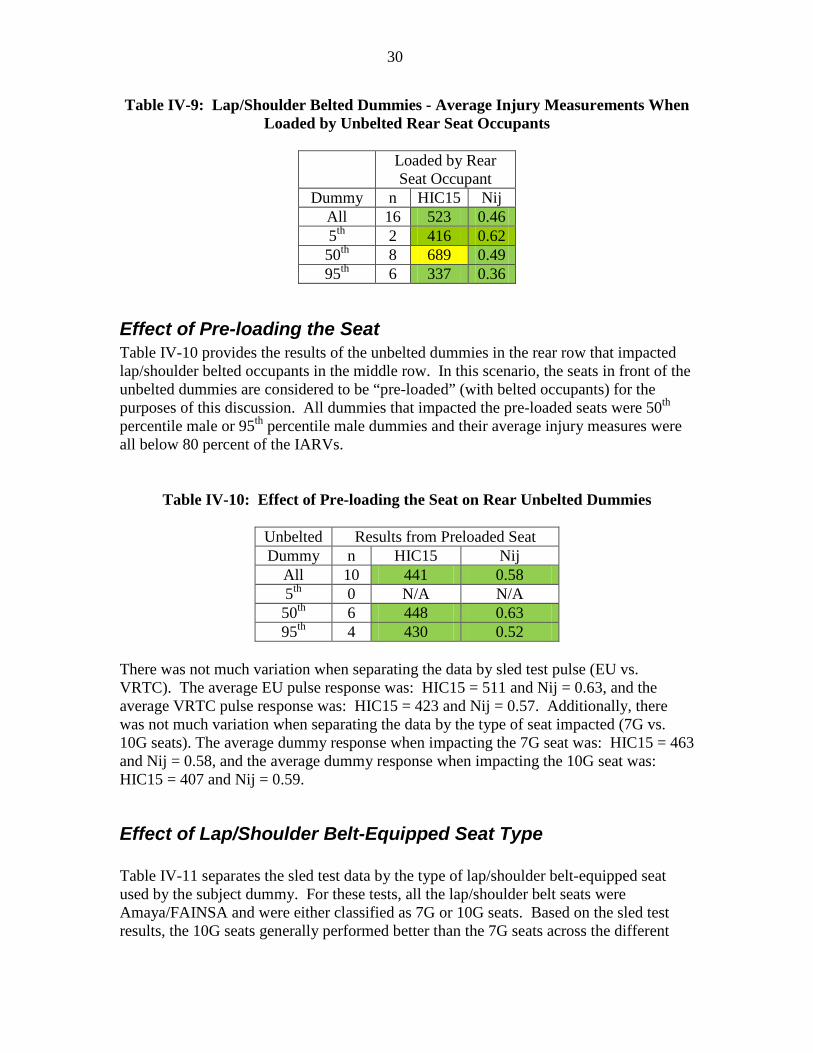
Table IV-9: Lap/Shoulder Belted Dummies - Average Injury Measurements When Loaded by Unbelted Rear Seat Occupants
Loaded by Rear
Seat Occupant Dummy n HIC15 Nij
All 16 523 0.46 5th 2 416 0.62 50th 8 689 0.49 95th 6 337 0.36
Effect of Pre-loading the Seat Table IV-10 provides the results of the unbelted dummies in the rear row that impacted lap/shoulder belted occupants in the middle row. In this scenario, the seats in front of the unbelted dummies are considered to be “pre-loaded” (with belted occupants) for the purposes of this discussion. All dummies that impacted the pre-loaded seats were 50th percentile male or 95th percentile male dummies and their average injury measures were all below 80 percent of the IARVs.
Table IV-10: Effect of Pre-loading the Seat on Rear Unbelted Dummies
Unbelted Results from Preloaded Seat Dummy n HIC15 Nij
All 10 441 0.58 5th 0 N/A N/A 50th 6 448 0.63 95th 4 430 0.52
There was not much variation when separating the data by sled test pulse (EU vs. VRTC). The average EU pulse response was: HIC15 = 511 and Nij = 0.63, and the average VRTC pulse response was: HIC15 = 423 and Nij = 0.57. Additionally, there was not much variation when separating the data by the type of seat impacted (7G vs. 10G seats). The average dummy response when impacting the 7G seat was: HIC15 = 463 and Nij = 0.58, and the average dummy response when impacting the 10G seat was: HIC15 = 407 and Nij = 0.59.
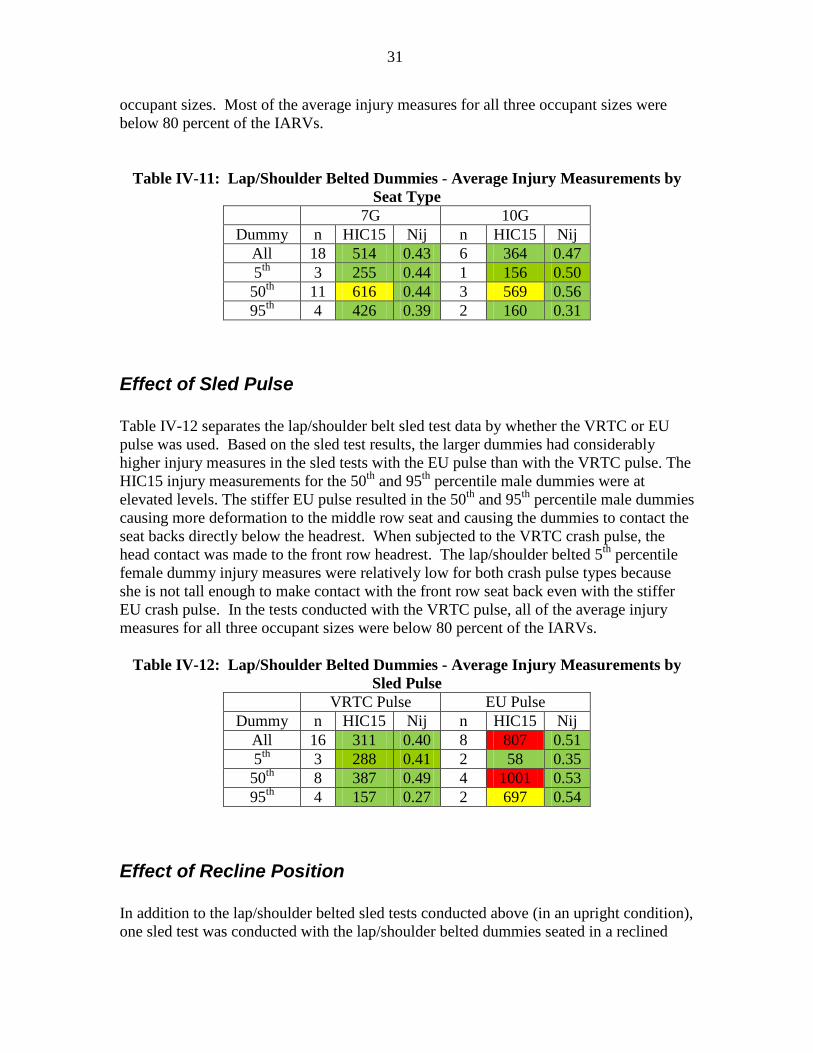
Effect of Lap/Shoulder Belt-Equipped Seat Type Table IV-11 separates the sled test data by the type of lap/shoulder belt-equipped seat used by the subject dummy. For these tests, all the lap/shoulder belt seats were Amaya/FAINSA and were either classified as 7G or 10G seats. Based on the sled test results, the 10G seats generally performed better than the 7G seats across the different
31
occupant sizes. Most of the average injury measures for all three occupant sizes were below 80 percent of the IARVs.
Table IV-11: Lap/Shoulder Belted Dummies - Average Injury Measurements by
Seat Type 7G 10G
Dummy n HIC15 Nij n HIC15 Nij All 18 514 0.43 6 364 0.47 5th 3 255 0.44 1 156 0.50 50th 11 616 0.44 3 569 0.56 95th 4 426 0.39 2 160 0.31
Effect of Sled Pulse Table IV-12 separates the lap/shoulder belt sled test data by whether the VRTC or EU pulse was used. Based on the sled test results, the larger dummies had considerably higher injury measures in the sled tests with the EU pulse than with the VRTC pulse. The HIC15 injury measurements for the 50th and 95th percentile male dummies were at elevated levels. The stiffer EU pulse resulted in the 50th and 95th percentile male dummies causing more deformation to the middle row seat and causing the dummies to contact the seat backs directly below the headrest. When subjected to the VRTC crash pulse, the head contact was made to the front row headrest. The lap/shoulder belted 5th percentile female dummy injury measures were relatively low for both crash pulse types because she is not tall enough to make contact with the front row seat back even with the stiffer EU crash pulse. In the tests conducted with the VRTC pulse, all of the average injury measures for all three occupant sizes were below 80 percent of the IARVs.
Table IV-12: Lap/Shoulder Belted Dummies - Average Injury Measurements by Sled Pulse
VRTC Pulse EU Pulse Dummy n HIC15 Nij n HIC15 Nij
All 16 311 0.40 8 807 0.51 5th 3 288 0.41 2 58 0.35 50th 8 387 0.49 4 1001 0.53 95th 4 157 0.27 2 697 0.54
Effect of Recline Position In addition to the lap/shoulder belted sled tests conducted above (in an upright condition), one sled test was conducted with the lap/shoulder belted dummies seated in a reclined

32
seat back position, with the front row seats also in a reclined seat back position and the rear row seats in an upright position. Table IV-13 presents the average results from the lap/shoulder belted dummies in a reclined seating position as well as the average results for the unbelted dummies seated behind the dummies in the reclined seats. The test was conducted with the VRTC pulse and 7G seats. The average injury values were all below 80 percent of the IARVs for all cases. Table IV-13: Lap/Shoulder Belted Dummies - Average Injury Measurements in Reclined
Position Lap/Shoulder Belted
Dummy in Reclined Seat
Unbelted Dummy Seated Behind Reclined
Seat Dummy N HIC15 Nij n HIC15 Nij
All 2 276 0.59 2 262 0.43 5th 1 247 0.68 0 N/A N/A 50th 1 305 0.49 2 262 0.43 95th 0 N/A N/A 0 N/A N/A
3.2.2.4.8 15-Degree Sled Tests In addition to the lap/shoulder belt sled tests conducted above, two sled tests were conducted in an off-axis orientation. In one test, the middle row dummies were unbelted. In the other test, the middle row dummies were restrained by lap/shoulder belts. Both tests were conducted with the VRTC pulse and 7G seats. In each test, unbelted dummies were positioned in the rear row. Table IV-14 presents the average dummy results for the middle row occupants. The middle row dummies restrained by lap/shoulder belts had lower HIC 15 and Nij measurements compared to the unbelted dummies. However, all the injury measures were very low. The dummies restrained by lap/shoulder belts maintained their seating positions, however, the unbelted 5th percentile female dummy was ejected from her seat into the aisle, and the unbelted 50th percentile male dummy came to rest in the seat next to his original position.
Table IV-14: Average Injury Measurements in Oblique Tests (Middle Row) Unbelted Dummies Lap/Shoulder Belted
Dummies Dummy n HIC15 Nij n HIC15 Nij
All 2 321 0.70 2 69 0.46 5th 1 177 0.79 1 83 0.67 50th 1 464 0.61 1 55 0.24 95th 0 N/A N/A 0 N/A N/A
33
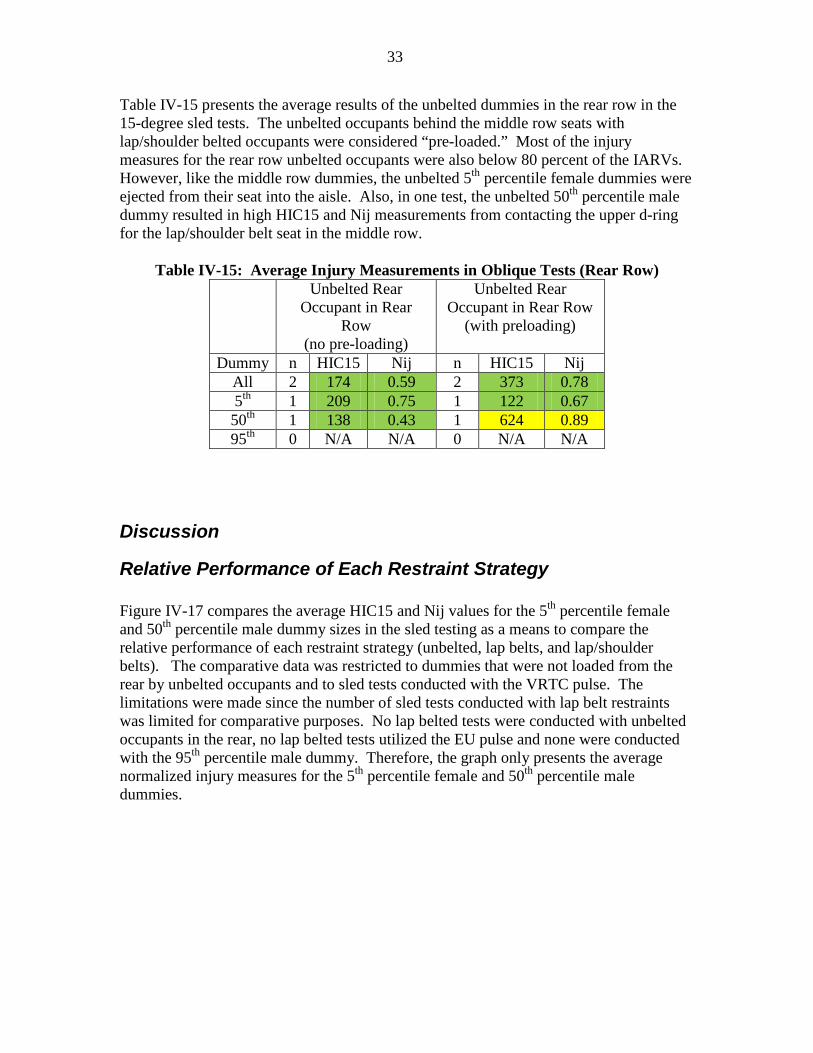
Table IV-15 presents the average results of the unbelted dummies in the rear row in the 15-degree sled tests. The unbelted occupants behind the middle row seats with lap/shoulder belted occupants were considered “pre-loaded.” Most of the injury measures for the rear row unbelted occupants were also below 80 percent of the IARVs. However, like the middle row dummies, the unbelted 5th percentile female dummies were ejected from their seat into the aisle. Also, in one test, the unbelted 50th percentile male dummy resulted in high HIC15 and Nij measurements from contacting the upper d-ring for the lap/shoulder belt seat in the middle row.
Table IV-15: Average Injury Measurements in Oblique Tests (Rear Row)
Unbelted Rear Occupant in Rear
Row (no pre-loading)
Unbelted Rear Occupant in Rear Row
(with preloading)
Dummy n HIC15 Nij n HIC15 Nij All 2 174 0.59 2 373 0.78 5th 1 209 0.75 1 122 0.67 50th 1 138 0.43 1 624 0.89 95th 0 N/A N/A 0 N/A N/A
Discussion
Relative Performance of Each Restraint Strategy Figure IV-17 compares the average HIC15 and Nij values for the 5th percentile female and 50th percentile male dummy sizes in the sled testing as a means to compare the relative performance of each restraint strategy (unbelted, lap belts, and lap/shoulder belts). The comparative data was restricted to dummies that were not loaded from the rear by unbelted occupants and to sled tests conducted with the VRTC pulse. The limitations were made since the number of sled tests conducted with lap belt restraints was limited for comparative purposes. No lap belted tests were conducted with unbelted occupants in the rear, no lap belted tests utilized the EU pulse and none were conducted with the 95th percentile male dummy. Therefore, the graph only presents the average normalized injury measures for the 5th percentile female and 50th percentile male dummies.

34
Figure IV-17: Restraint Comparison – Average Normalized Injury Measurements
Figure IV-17 shows that the lowest average HIC and Nij values were associated with the lap/shoulder belt restraint for both dummy sizes. In contrast, most of the average injury measures for the lap belt restraint condition were at or above the IARVs. The low HIC15 and Nij values for the lap/shoulder restraint condition are consistent with the dummy kinematics, which indicated that the lap/shoulder belt restraint limited head contact with the forward seat back, particularly for the 5th percentile female dummies. The unbelted dummies were more susceptible to hitting other hard structures or being displaced from their seats. Since a lap belted sled test for the 95th percentile male dummy was not conducted, Figure IV-18 plots the average HIC15 and Nij values for the 95th percentile male dummy in the unbelted and lap/shoulder belt sled tests. Based on the available data, the comparison was limited to 7G seats and the VRTC pulse. The dummies were also loaded from the rear by unbelted occupants.
0
0.4
0.8
1.2
1.6
2
Unbelted Lap Belt Lap/Shoulder Belt
Restraint ComparisonAverage Normalized Injury Measurements
5th-HIC
5th-Nij
50th-HIC
50th-Nij
35
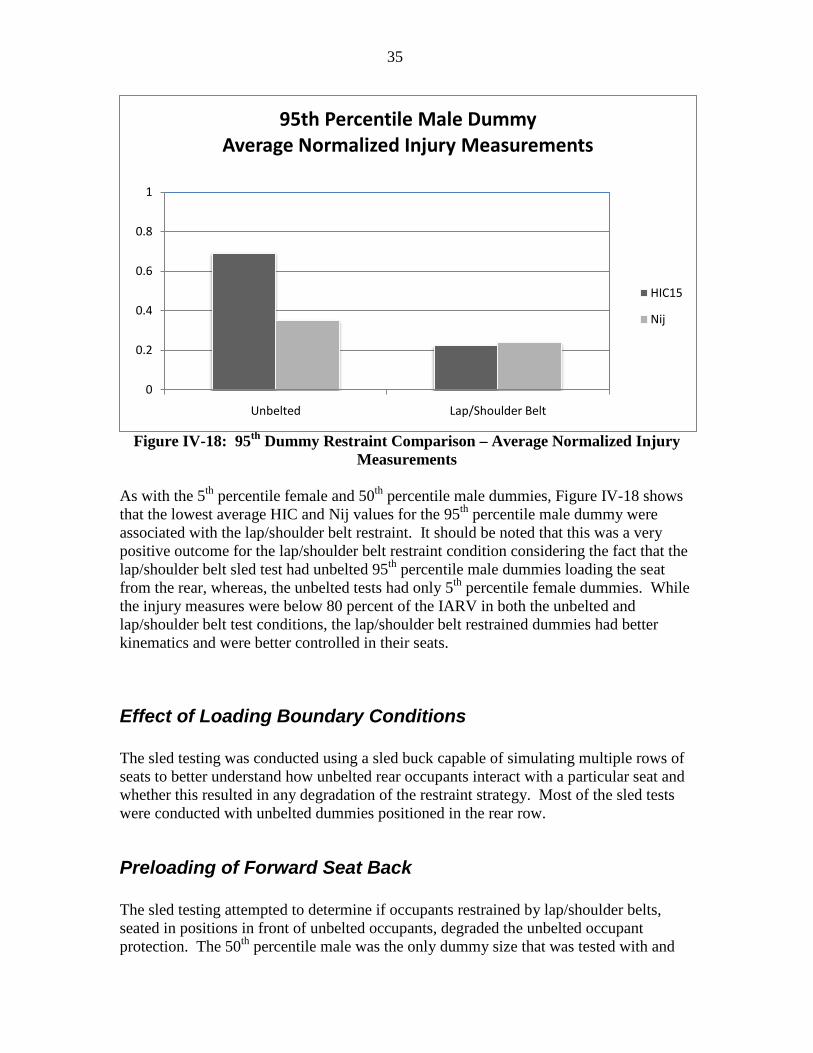
Figure IV-18: 95th Dummy Restraint Comparison – Average Normalized Injury Measurements
As with the 5th percentile female and 50th percentile male dummies, Figure IV-18 shows that the lowest average HIC and Nij values for the 95th percentile male dummy were associated with the lap/shoulder belt restraint. It should be noted that this was a very positive outcome for the lap/shoulder belt restraint condition considering the fact that the lap/shoulder belt sled test had unbelted 95th percentile male dummies loading the seat from the rear, whereas, the unbelted tests had only 5th percentile female dummies. While the injury measures were below 80 percent of the IARV in both the unbelted and lap/shoulder belt test conditions, the lap/shoulder belt restrained dummies had better kinematics and were better controlled in their seats.
Effect of Loading Boundary Conditions The sled testing was conducted using a sled buck capable of simulating multiple rows of seats to better understand how unbelted rear occupants interact with a particular seat and whether this resulted in any degradation of the restraint strategy. Most of the sled tests were conducted with unbelted dummies positioned in the rear row.
Preloading of Forward Seat Back The sled testing attempted to determine if occupants restrained by lap/shoulder belts, seated in positions in front of unbelted occupants, degraded the unbelted occupant protection. The 50th percentile male was the only dummy size that was tested with and
0
0.2
0.4
0.6
0.8
1
Unbelted Lap/Shoulder Belt
95th Percentile Male DummyAverage Normalized Injury Measurements
HIC15
Nij

36
without “preloading” of the seat back in front by a lap/shoulder belted dummy. The results showed that there was little difference when comparing the average injury measures of the unbelted dummies that impacted a pre-loaded seat (HIC15 = 417 and Nij = 0.63) to those that impacted a seat that was not preloaded (HIC15 = 392 and Nij = 0.65). Thus, the average injury measures showed very little sensitivity to the preloaded condition. None of the belted dummies in this study were evaluated with preloading of the forward seat back.
Loading from the Rear by Unrestrained Dummies The sled testing also investigated if unrestrained dummies in the rear row loading the middle row lap/shoulder belt-equipped seats would degrade the occupant protection provided to the lap/shoulder belted occupant. Only the belted 5th percentile female and the 50th percentile male test dummies were tested with loading from rear unbelted dummies. Table IV-16 compares the average injury measures for lap/shoulder belted dummies with and without loading from the rear by an unrestrained dummy.
Table IV-16: Lap/Shoulder Belted Dummies - Comparison of Rear Seat Loading
Effects Loaded by Rear
Seat Dummy No Rear Seat
Dummy Dummy n HIC15 Nij n HIC15 Nij
All 16 523 0.46 8 383 0.39 5th 2 416 0.62 2 45 0.29 50th 8 689 0.49 6 496 0.43 95th 6 337 0.36 0 N/A N/A
Based on the results, the lap/shoulder belted occupants that were loaded from the rear had slightly higher injury measures than those that did not have rear seat loading. This was a different trend from the unbelted tests where the unbelted occupants in the rear had the higher injury measures (see earlier section). However, nearly all of the average injury measures in the lap/shoulder belt sled series were below 80 percent of the IARVs. Only the HIC15 injury measurement for the 50th percentile male was at an elevated level.
Lap/Shoulder Belt Seat Type Two types of lap/shoulder-belt seats were evaluated in the sled tests: Amaya/FAINSA 7G and 10G seats. Based on the sled test results, both seats provided superior performance over the lap belted and unbelted conditions in the sled tests. While there were fewer tests with the 10G seats, they generally performed slightly better on average than the 7G seats across the different occupant sizes.
37
Sled Pulse (VRTC vs. EU, 15-degree angled configuration) Two types of crash pulses were used in the sled tests: the VRTC pulse and the EU pulse. The EU pulse was only used in the lap belt and lap/shoulder belt sled tests (not in the unbelted tests). Based on the results, the dummy injury measures were generally higher in the sled tests conducted with the EU pulse, particularly for the larger dummy occupant sizes. Even in the lap/shoulder belt tests, the head injury measurements for the 50th and 95th percentile male dummies were at elevated levels due to head contact with the seat back in front (typically below the head rest). The lap/shoulder belted 5th percentile female dummy was not as affected by the EU pulse since the smaller dummy was not tall enough to make contact with the front row seat back. In the tests conducted with the VRTC pulse, all of the injury measures for lap/shoulder belted occupants were below 80 percent of the IARVs. VRTC also conducted two 15-degree off-axis sled tests in this study using the VRTC pulse and 7G seats. The results showed that the dummies restrained by lap/shoulder belts had lower HIC 15 and Nij measurements compared to the unbelted dummies. However, all the injury measures for both tests were very low. The dummies restrained by lap/shoulder belts maintained their seating positions in the 15-degree angled configuration, while the unbelted dummies were ejected from their seats into the aisle or adjacent seating positions or made contact with the middle row seat belt d-ring anchors.
Unbelted Dummies • Average head and neck injury measures were typically below 80 percent of the
IARVs. Although, it should be noted that the dummies used were frontal crash test dummies, and hence the injury measures may not accurately capture the severity of loading during interaction with interior components when the dummy falls off the seat.
• Elevated head injury values resulted in tests with the 5th percentile female dummy due to the lower contact with the seat back in front. This observation was consistent in the sled tests and full scale crash tests.
• The 5th percentile female dummy resulted in elevated head injury measures when making contact with most of the seat types evaluated.
• Larger dummies provided more deformation to the seat backs positioned in front of them and were less sensitive to the seat back type (including stiffer belted seats).
• Unbelted dummies were typically ejected out of their seating position and displaced into the aisle or adjacent seats. They were also more susceptible to hitting other hard structures.
• Injury measures did not appear to be adversely affected by rear occupant loading. Any interaction with rear seated dummies occurred after the forward dummies’ motion was essentially complete.
38
Lap Belted Dummies • Head and neck injury measures exceeded the IARVs for all the dummies tested. • The poor performance of the lap belt restraint in the sled tests was consistent with the
lap belt results from the full scale motorcoach crash test. • Compared to the unbelted dummies, the dummy’s head typically hit the seat back in
front at an earlier point in time due to the lap belt restraining forward motion and the upper torso pivoting about the lap belt.
• Seats in front of lap belted dummies were not deformed by the dummies’ femur loading, and consequently, not as compliant when struck.
• Lap belts were able to retain the dummies in their seating position post-test.
Lap/Shoulder Belted Dummies • Average head and neck injury measures were low for all dummy sizes and below
those seen in unbelted and lap belted sled tests. This was consistent with the lap/shoulder belt results from the full scale crash test.
• Lap and shoulder belts retained the dummies in their seating positions and were able to mitigate head contact with the seat in front.
• Rear unbelted occupant loading resulted in additional forward excursion for the lap/shoulder belted dummies, and head contact was made with the seat in front in some cases. The resulting average injury measures were still relatively low in most cases.
• All of the unbelted dummies in the rear seats that impacted middle row seats that were “preloaded” by belted occupants had low average injury measures that were below 80 percent of the IARVs.
• Both lap/shoulder belt-equipped seat types (7G and 10G) provided good performance in the sled tests, with the 10G seats showing some improvement over the 7G seats.
• The EU pulse was able to generate higher injury numbers in the larger dummies due to contact with the seat back in front. The VRTC pulse resulted in all average injury measures to be below 80 percent of the IARVs.
• Lap and shoulder belted dummies performed better in the sled tests conducted at a 15-degree angle. They had lower injury measures and were retained in their seats. Unbelted dummies were ejected into the aisle.
• In the one test where the front and middle row seat backs were reclined, the injury measures for the lap belted occupants and the unbelted rear row occupants were all below 80 percent of the IARVs.
39
NHTSA’s Motorcoach Rollover Testing Seventy eight percent of the fatalities in motorcoach rollover crashes are attributable to ejections. The agency believes that lap/shoulder belts will aid in containing the occupant within the vehicle in the event of a crash. Seat belts are estimated to be 80 percent effective14
in preventing fatal injuries in rollover crashes. Since most of the fatalities in motorcoach crashes are due to ejections, we believe that seat belts in motorcoaches will provide similar protection to the occupants of the motorcoach as belts provide to occupants of light vehicles. To improve motorcoach protection in rollover crashes, NHTSA’s priorities have been focused on requiring seat belts on motorcoaches, and improving the structural integrity of the roof.
14 Estimated based on Charles J. Kahane, PhD. (December 2000) “Fatality Reduction by Safety Belts for Front-Seat Occupants of Cars and Light Trucks”, Washington, DC, National Highway Traffic Safety Administration, page 28
40
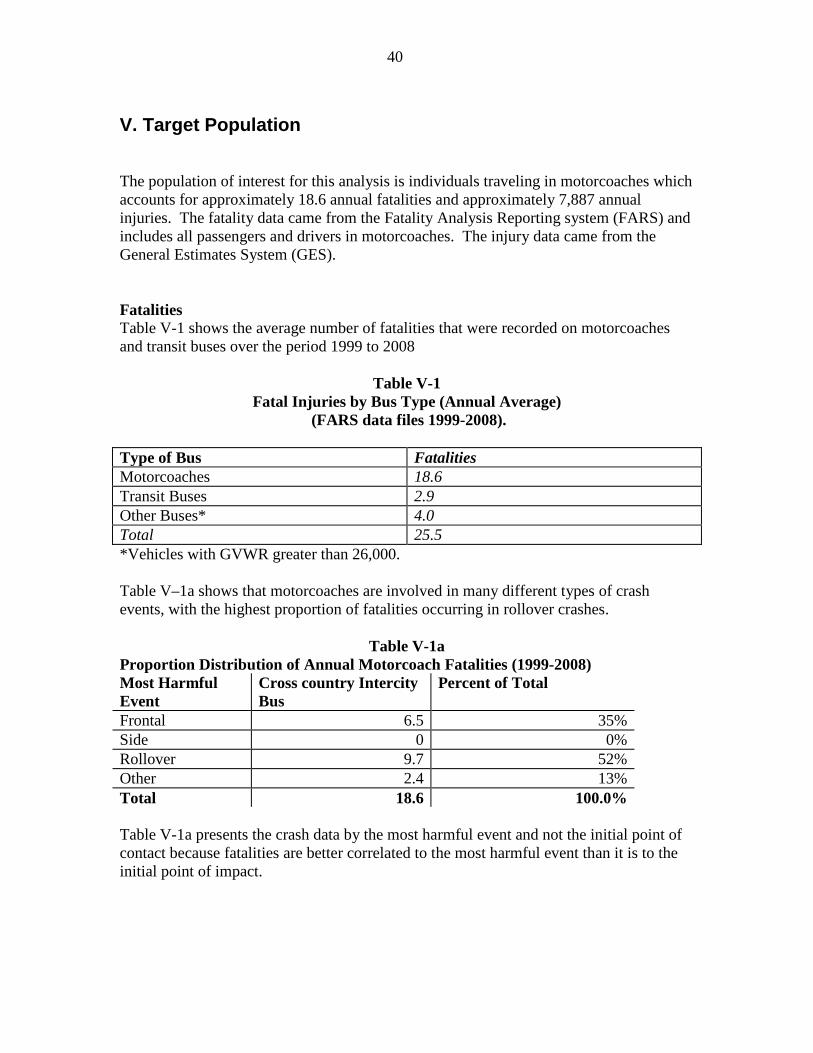
V. Target Population The population of interest for this analysis is individuals traveling in motorcoaches which accounts for approximately 18.6 annual fatalities and approximately 7,887 annual injuries. The fatality data came from the Fatality Analysis Reporting system (FARS) and includes all passengers and drivers in motorcoaches. The injury data came from the General Estimates System (GES). Fatalities Table V-1 shows the average number of fatalities that were recorded on motorcoaches and transit buses over the period 1999 to 2008
Table V-1
Fatal Injuries by Bus Type (Annual Average) (FARS data files 1999-2008).
Type of Bus Fatalities Motorcoaches 18.6 Transit Buses 2.9 Other Buses* 4.0 Total 25.5 *Vehicles with GVWR greater than 26,000.
Table V–1a shows that motorcoaches are involved in many different types of crash events, with the highest proportion of fatalities occurring in rollover crashes.
Table V-1a
Proportion Distribution of Annual Motorcoach Fatalities (1999-2008) Most Harmful Event
Cross country Intercity Bus
Percent of Total
Frontal 6.5 35% Side 0 0% Rollover 9.7 52% Other 2.4 13% Total 18.6 100.0% Table V-1a presents the crash data by the most harmful event and not the initial point of contact because fatalities are better correlated to the most harmful event than it is to the initial point of impact.

41
FARS 1999-2008 data (for the ten years, not the annual average) indicates the following:
Table V-2a Driver and Passenger Fatalities by most harmful event and whether the occupant was ejected.
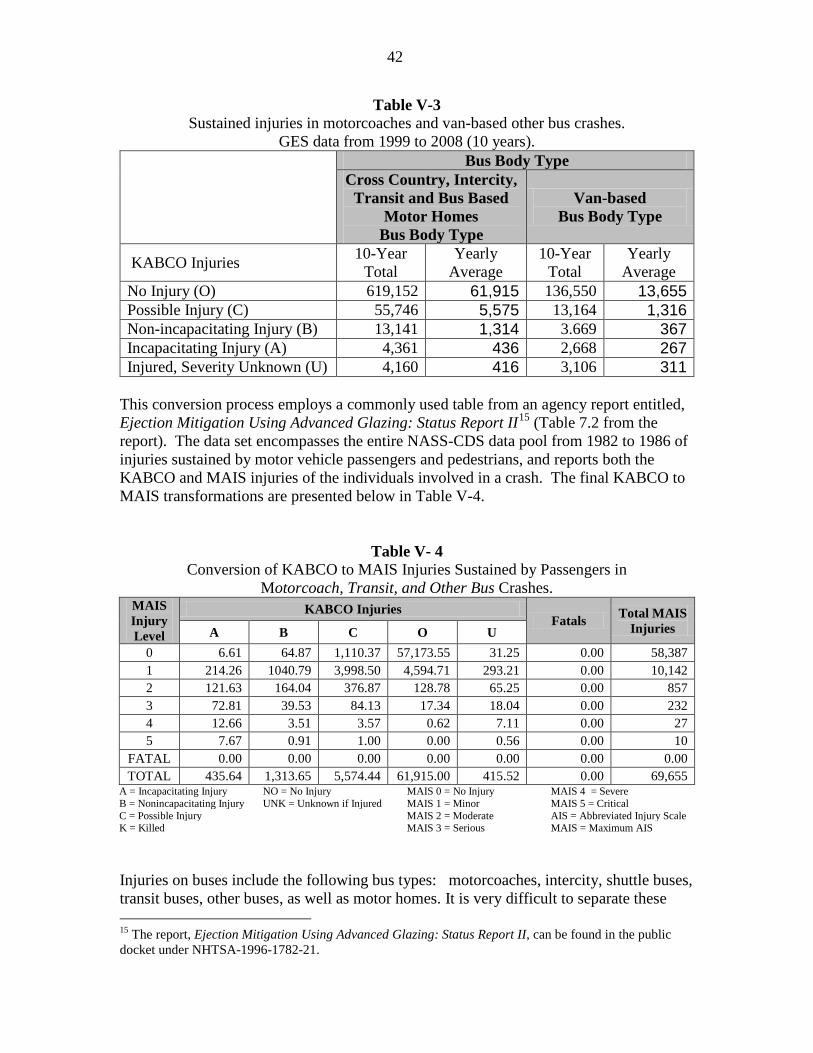
Table V-2b Driver and Passenger Fatalities by initial impact point and whether the occupant was ejected. Driver Passenger Total Eject No Eject Eject No Eject Front 3 15 15 32 65 Side 0 0 0 0 0 Non-Collision 2 4 74 41 121 Total 5 19 89 73 186 In both tables, it is clear that the fatalities were related to ejection. Therefore, the primary purpose of this rulemaking effort is to prevent ejections. Table V-2b indicates that ejections are especially a problem in non-collision rollover events. Injuries The National Automotive Sampling System/General Estimate System (NASS/GES) that is normally used to determine injury levels does not collect data specific to motorcoaches. The data collected in NASS/GES is coded as buses, making it very difficult to separate the motorcoaches from the other types of buses. As seen in Table V-3 the injury data included motorcoaches, motor homes and transit buses data. Further, the injury data were not classified according to initial point of contact (frontal impact, side impact or rollovers) a classification used in the fatal crashes, see Table V-2b. Given the coding and the classification of the data, we made a few simplifying assumptions in order to obtain injury estimates for motorcoaches. For injuries, we utilize data from the General Estimate System (GES). Table V-3 shows estimates of motorcoach passengers as well as passengers on other buses involved in related traffic crashes. Being police-reported data, the GES data in Table V-3 appear in the KABCO scale rather than the body-region based MAIS scale. Before any meaningful analysis can be performed on the injury data, we first convert the KABCO injuries into MAIS injuries.
eject No eject Eject No EjectRollover 2 4 74 17 97Roadside 1 7 14 20 42MultiVeh 2 8 1 12 23Other 0 0 0 24 24
5 19 89 73 186
Driver Passenger
42
Table V-3 Sustained injuries in motorcoaches and van-based other bus crashes.
GES data from 1999 to 2008 (10 years).
Bus Body Type Cross Country, Intercity,
Transit and Bus Based Motor Homes
Bus Body Type
Van-based Bus Body Type
KABCO Injuries 10-Year Total
Yearly Average
10-Year Total
Yearly Average
No Injury (O) 619,152 61,915 136,550 13,655 Possible Injury (C) 55,746 5,575 13,164 1,316 Non-incapacitating Injury (B) 13,141 1,314 3.669 367 Incapacitating Injury (A) 4,361 436 2,668 267 Injured, Severity Unknown (U) 4,160 416 3,106 311
This conversion process employs a commonly used table from an agency report entitled, Ejection Mitigation Using Advanced Glazing: Status Report II15
(Table 7.2 from the report). The data set encompasses the entire NASS-CDS data pool from 1982 to 1986 of injuries sustained by motor vehicle passengers and pedestrians, and reports both the KABCO and MAIS injuries of the individuals involved in a crash. The final KABCO to MAIS transformations are presented below in Table V-4.
Table V- 4
Conversion of KABCO to MAIS Injuries Sustained by Passengers in Motorcoach, Transit, and Other Bus Crashes.
MAIS Injury Level
KABCO Injuries Fatals Total MAIS
Injuries A B C O U 0 6.61 64.87 1,110.37 57,173.55 31.25 0.00 58,387 1 214.26 1040.79 3,998.50 4,594.71 293.21 0.00 10,142 2 121.63 164.04 376.87 128.78 65.25 0.00 857 3 72.81 39.53 84.13 17.34 18.04 0.00 232 4 12.66 3.51 3.57 0.62 7.11 0.00 27 5 7.67 0.91 1.00 0.00 0.56 0.00 10
FATAL 0.00 0.00 0.00 0.00 0.00 0.00 0.00 TOTAL 435.64 1,313.65 5,574.44 61,915.00 415.52 0.00 69,655
A = Incapacitating Injury NO = No Injury MAIS 0 = No Injury MAIS 4 = Severe B = Nonincapacitating Injury UNK = Unknown if Injured MAIS 1 = Minor MAIS 5 = Critical C = Possible Injury MAIS 2 = Moderate AIS = Abbreviated Injury Scale K = Killed MAIS 3 = Serious MAIS = Maximum AIS Injuries on buses include the following bus types: motorcoaches, intercity, shuttle buses, transit buses, other buses, as well as motor homes. It is very difficult to separate these 15 The report, Ejection Mitigation Using Advanced Glazing: Status Report II, can be found in the public docket under NHTSA-1996-1782-21.
43
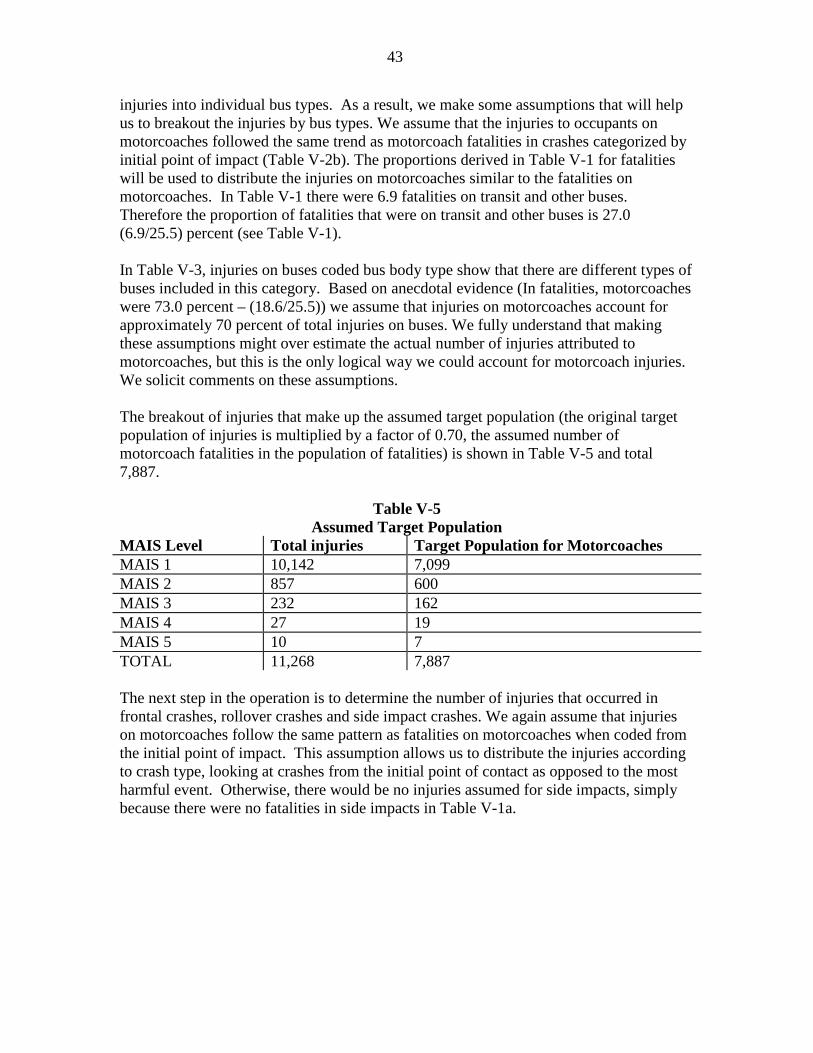
injuries into individual bus types. As a result, we make some assumptions that will help us to breakout the injuries by bus types. We assume that the injuries to occupants on motorcoaches followed the same trend as motorcoach fatalities in crashes categorized by initial point of impact (Table V-2b). The proportions derived in Table V-1 for fatalities will be used to distribute the injuries on motorcoaches similar to the fatalities on motorcoaches. In Table V-1 there were 6.9 fatalities on transit and other buses. Therefore the proportion of fatalities that were on transit and other buses is 27.0 (6.9/25.5) percent (see Table V-1). In Table V-3, injuries on buses coded bus body type show that there are different types of buses included in this category. Based on anecdotal evidence (In fatalities, motorcoaches were 73.0 percent – (18.6/25.5)) we assume that injuries on motorcoaches account for approximately 70 percent of total injuries on buses. We fully understand that making these assumptions might over estimate the actual number of injuries attributed to motorcoaches, but this is the only logical way we could account for motorcoach injuries. We solicit comments on these assumptions. The breakout of injuries that make up the assumed target population (the original target population of injuries is multiplied by a factor of 0.70, the assumed number of motorcoach fatalities in the population of fatalities) is shown in Table V-5 and total 7,887.
Table V-5 Assumed Target Population
MAIS Level Total injuries Target Population for Motorcoaches MAIS 1 10,142 7,099 MAIS 2 857 600 MAIS 3 232 162 MAIS 4 27 19 MAIS 5 10 7 TOTAL 11,268 7,887 The next step in the operation is to determine the number of injuries that occurred in frontal crashes, rollover crashes and side impact crashes. We again assume that injuries on motorcoaches follow the same pattern as fatalities on motorcoaches when coded from the initial point of impact. This assumption allows us to distribute the injuries according to crash type, looking at crashes from the initial point of contact as opposed to the most harmful event. Otherwise, there would be no injuries assumed for side impacts, simply because there were no fatalities in side impacts in Table V-1a.
44
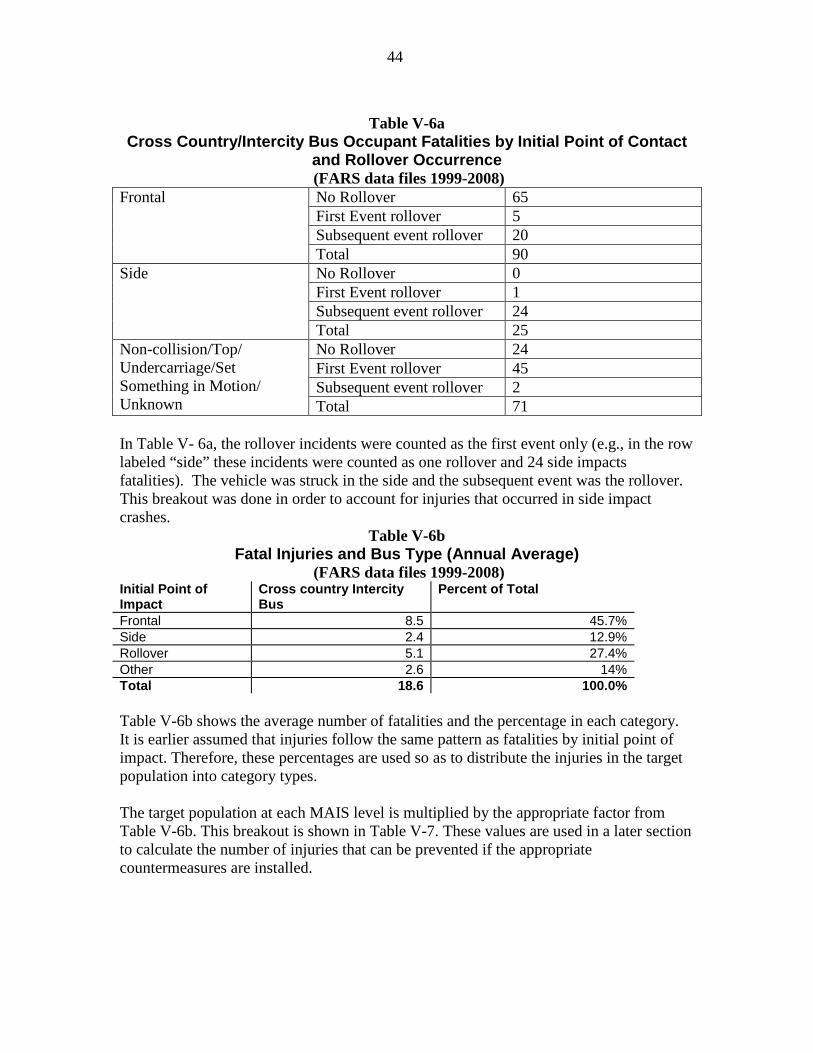
Table V-6a
Cross Country/Intercity Bus Occupant Fatalities by Initial Point of Contact and Rollover Occurrence (FARS data files 1999-2008)
Frontal No Rollover 65 First Event rollover 5 Subsequent event rollover 20 Total 90
Side No Rollover 0 First Event rollover 1 Subsequent event rollover 24 Total 25
Non-collision/Top/ Undercarriage/Set Something in Motion/ Unknown
No Rollover 24 First Event rollover 45 Subsequent event rollover 2 Total 71
In Table V- 6a, the rollover incidents were counted as the first event only (e.g., in the row labeled “side” these incidents were counted as one rollover and 24 side impacts fatalities). The vehicle was struck in the side and the subsequent event was the rollover. This breakout was done in order to account for injuries that occurred in side impact crashes.
Table V-6b Fatal Injuries and Bus Type (Annual Average)
(FARS data files 1999-2008) Initial Point of Impact
Cross country Intercity Bus
Percent of Total
Frontal 8.5 45.7% Side 2.4 12.9% Rollover 5.1 27.4% Other 2.6 14% Total 18.6 100.0% Table V-6b shows the average number of fatalities and the percentage in each category. It is earlier assumed that injuries follow the same pattern as fatalities by initial point of impact. Therefore, these percentages are used so as to distribute the injuries in the target population into category types. The target population at each MAIS level is multiplied by the appropriate factor from Table V-6b. This breakout is shown in Table V-7. These values are used in a later section to calculate the number of injuries that can be prevented if the appropriate countermeasures are installed.
45
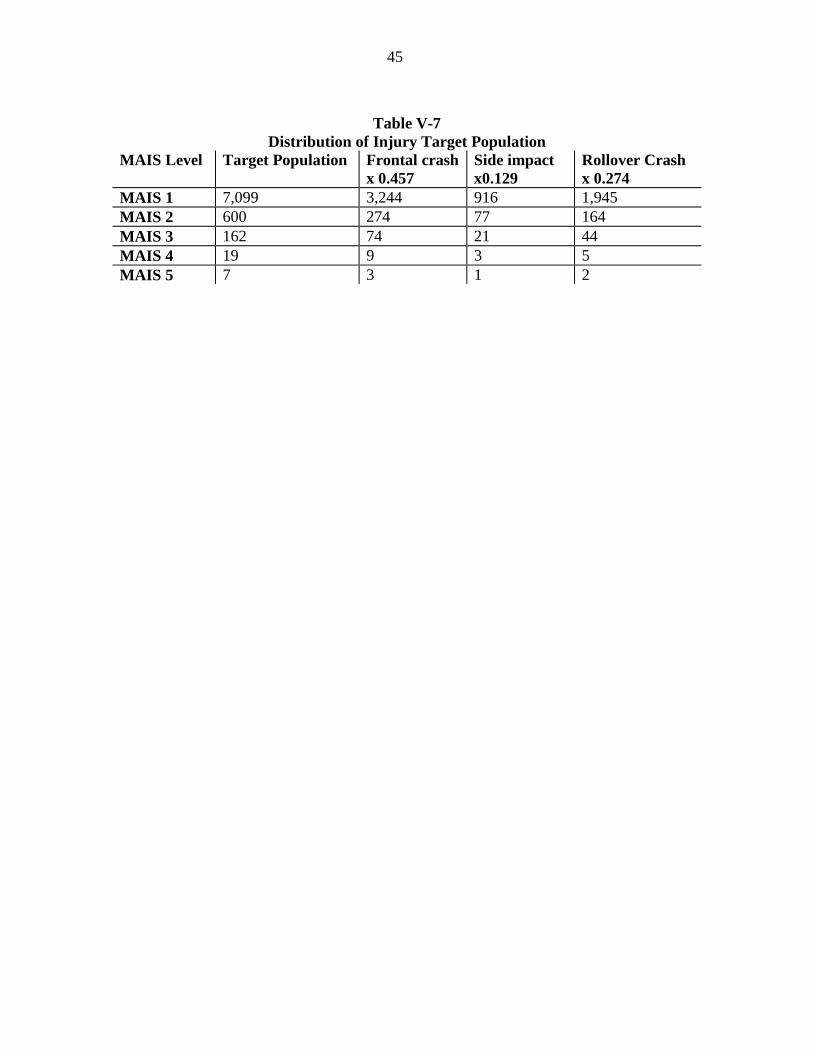
Table V-7
Distribution of Injury Target Population MAIS Level Target Population Frontal crash
x 0.457 Side impact x0.129
Rollover Crash x 0.274
MAIS 1 7,099 3,244 916 1,945 MAIS 2 600 274 77 164 MAIS 3 162 74 21 44 MAIS 4 19 9 3 5 MAIS 5 7 3 1 2

46
VI. BENEFITS Effectiveness This section estimates the potential lives saved and injuries mitigated if a counter-measure is installed on the subject vehicles. In order to calculate the benefits, we must first establish the effectiveness rate of a lap/shoulder belt and a lap belt. Table VI-1(a) shows the assumed effectiveness of lap/shoulder belts and Table VI-1(b) shows the assumed effectiveness for lap belts in motorcoaches.
Table VI- 1(a)
Motorcoach Effectiveness Estimates – Lap/Shoulder Belts (%)
3-point Belts Fatalities Injuries AIS(2-5) Injuries AIS 1 Side Impact 42 47 10
Rollover 77 82 10 Frontal Impact 29 34 10
Table VI- 1(b)
Motorcoach Effectiveness Estimates - Lap Belts (%)
2-point Belts Fatalities Injuries AIS(2-5) Injuries AIS 1 Side Impact 39 44 10
Rollover 76 81 10 Frontal Impact 0 0 10
• Estimated based on Christina Morgan (June 1999) “Effectiveness of Lap/Shoulder Belts in the Back Outboard Seating Positions,” Washington, DC, National Highway Traffic Safety Administration. Data from this report were divided into crash mode in the report “Lives Saved by the Federal Motor Vehicle Safety Standards and Other Vehicle Safety Technology, 1960-2002”, October 2004, DOT HS 809-833, page 86 for lap belts and Page 100 for lap/shoulder belts.
Since lap/shoulder belts and lap belts have not been installed on motorcoaches, we have no real world data on their effectiveness. We use estimates from the rear seat of passenger cars by crash mode as a proxy measure of seat belt effectiveness in motorcoaches. We have both lap and lap/shoulder belt fatality effectiveness estimates for the rear seat of passenger cars. The rear seat of a passenger car is somewhat similar to a
47
motorcoach seat in that there is a seat back in front of the position and not a dash board (which would be the case if front seat occupants were used). The real debate, in our minds, is frontal impacts. In sled tests shown earlier in this analysis lap belts resulted in more injuries than being unrestrained and lap/shoulder belts were obviously more effective. In addition, we did not measure abdominal injuries, and abdominal injuries have been shown to be a problem with lap belts. Lap/shoulder belts do a better job of distributing the load over the chest area of the occupant and are very effective for abdominal injuries. The kinematics and force of an occupant jackknifing around the lap belt, potentially causing an abdominal injury, and hitting their head on the seat back in front of them, potentially causing head and neck injury, is highly dependent upon the speed of the crash. So, you definitely want a lap/shoulder belt in a severe crash, rather than a lap belt. However, most injuries occur in lower speed crashes. It would seem that real world data from passenger car effectiveness would be a better proxy measure for less severe injuries, than test data at high severity. Lap and lap/shoulder belts are very effective in reducing AIS 2-5 injuries in light vehicles and should also be very effective for motorcoaches. The issue is how much reliance can be put in the sled test data when making estimates of lap belt effectiveness compared to real world data of other vehicle types. For this analysis, we are assuming that real world data on the rear seats in passenger cars are closest to the environment in motorcoaches and as such will be a better proxy measure of effectiveness for motorcoaches than the sled test data. Lap/shoulder belt effectiveness and lap belt effectiveness estimates in preventing injury was not obtained directly from crash data in the rear seat, but was inferred by examining the relationships between other crash data estimates: lap-belt vs. 3-point-belt effectiveness in the front seat of cars. The difference in effectiveness between AIS 2-5 injuries and fatalities was 5 percentage points, except for frontal impacts with lap belt only. AIS 1 injury effectiveness was found to be 10 percent.
48
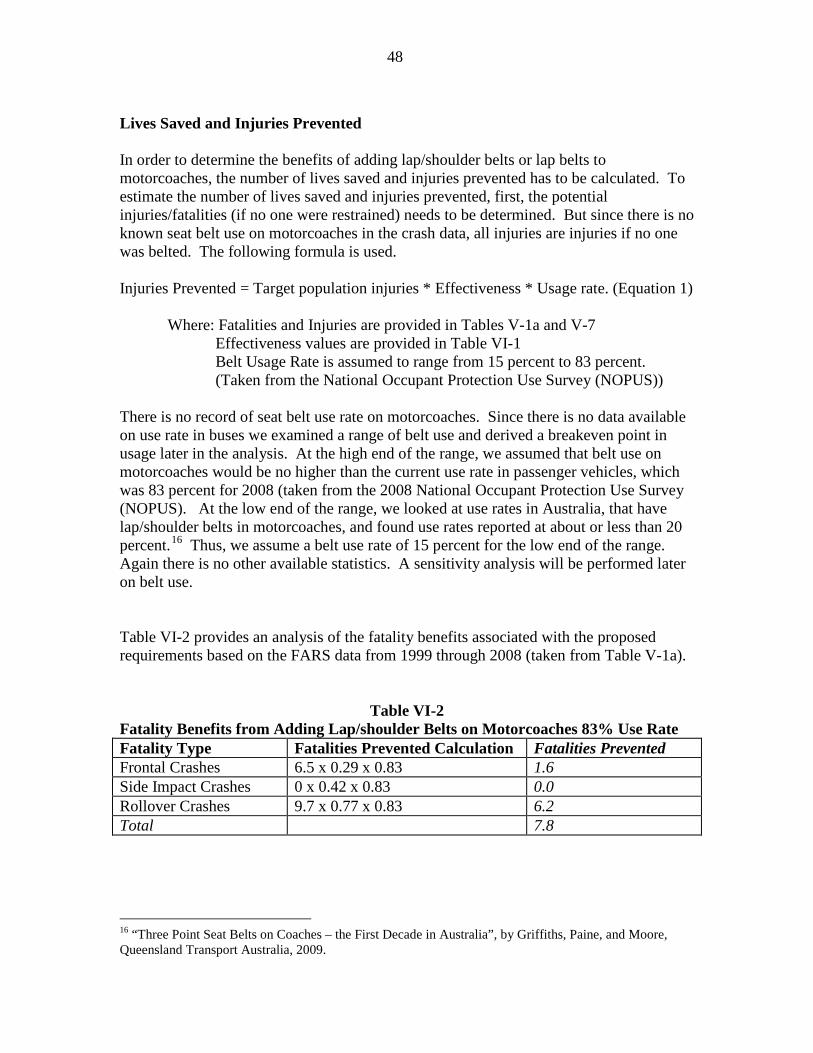
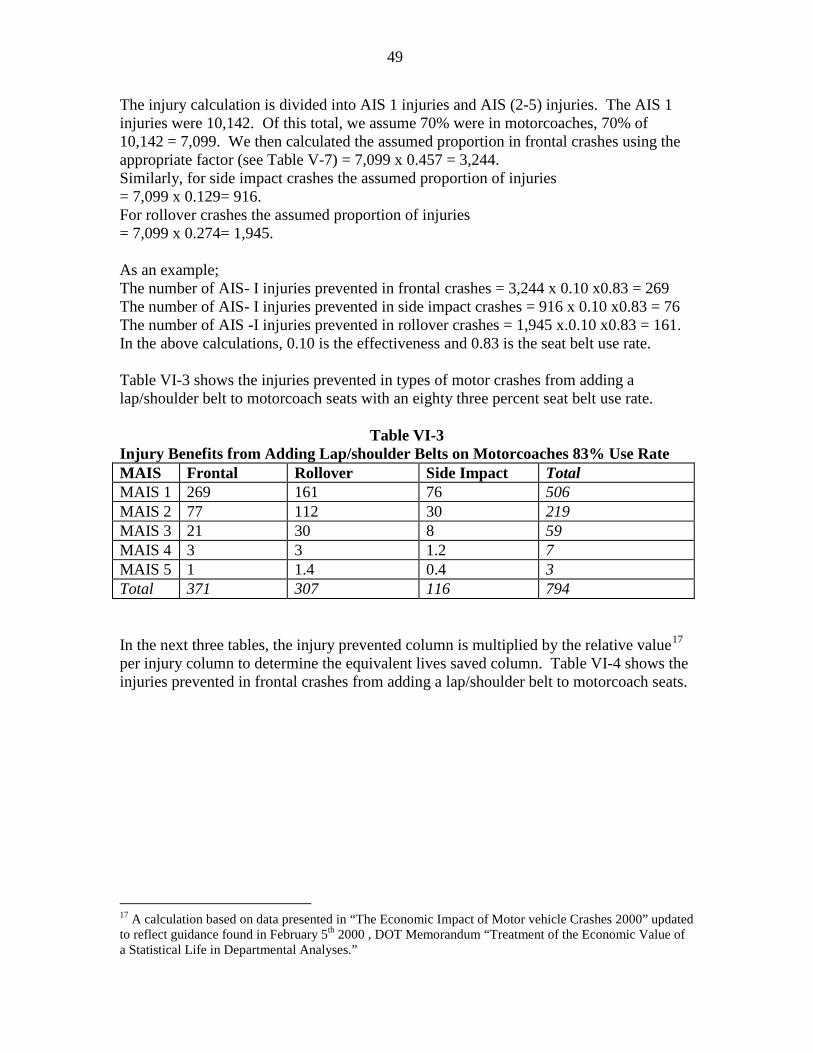
Lives Saved and Injuries Prevented In order to determine the benefits of adding lap/shoulder belts or lap belts to motorcoaches, the number of lives saved and injuries prevented has to be calculated. To estimate the number of lives saved and injuries prevented, first, the potential injuries/fatalities (if no one were restrained) needs to be determined. But since there is no known seat belt use on motorcoaches in the crash data, all injuries are injuries if no one was belted. The following formula is used. Injuries Prevented = Target population injuries * Effectiveness * Usage rate. (Equation 1)
Where: Fatalities and Injuries are provided in Tables V-1a and V-7 Effectiveness values are provided in Table VI-1 Belt Usage Rate is assumed to range from 15 percent to 83 percent. (Taken from the National Occupant Protection Use Survey (NOPUS)) There is no record of seat belt use rate on motorcoaches. Since there is no data available on use rate in buses we examined a range of belt use and derived a breakeven point in usage later in the analysis. At the high end of the range, we assumed that belt use on motorcoaches would be no higher than the current use rate in passenger vehicles, which was 83 percent for 2008 (taken from the 2008 National Occupant Protection Use Survey (NOPUS). At the low end of the range, we looked at use rates in Australia, that have lap/shoulder belts in motorcoaches, and found use rates reported at about or less than 20 percent.16
Thus, we assume a belt use rate of 15 percent for the low end of the range. Again there is no other available statistics. A sensitivity analysis will be performed later on belt use.
Table VI-2 provides an analysis of the fatality benefits associated with the proposed requirements based on the FARS data from 1999 through 2008 (taken from Table V-1a).
Table VI-2 Fatality Benefits from Adding Lap/shoulder Belts on Motorcoaches 83% Use Rate Fatality Type Fatalities Prevented Calculation Fatalities Prevented Frontal Crashes 6.5 x 0.29 x 0.83 1.6 Side Impact Crashes 0 x 0.42 x 0.83 0.0 Rollover Crashes 9.7 x 0.77 x 0.83 6.2 Total 7.8
16 “Three Point Seat Belts on Coaches – the First Decade in Australia”, by Griffiths, Paine, and Moore, Queensland Transport Australia, 2009.
49
The injury calculation is divided into AIS 1 injuries and AIS (2-5) injuries. The AIS 1 injuries were 10,142. Of this total, we assume 70% were in motorcoaches, 70% of 10,142 = 7,099. We then calculated the assumed proportion in frontal crashes using the appropriate factor (see Table V-7) = 7,099 x 0.457 = 3,244. Similarly, for side impact crashes the assumed proportion of injuries = 7,099 x 0.129= 916. For rollover crashes the assumed proportion of injuries = 7,099 x 0.274= 1,945. As an example; The number of AIS- I injuries prevented in frontal crashes = 3,244 x 0.10 x0.83 = 269 The number of AIS- I injuries prevented in side impact crashes = 916 x 0.10 x0.83 = 76 The number of AIS -I injuries prevented in rollover crashes = 1,945 x.0.10 x0.83 = 161. In the above calculations, 0.10 is the effectiveness and 0.83 is the seat belt use rate. Table VI-3 shows the injuries prevented in types of motor crashes from adding a lap/shoulder belt to motorcoach seats with an eighty three percent seat belt use rate.
Table VI-3 Injury Benefits from Adding Lap/shoulder Belts on Motorcoaches 83% Use Rate MAIS Frontal Rollover Side Impact Total MAIS 1 269 161 76 506 MAIS 2 77 112 30 219 MAIS 3 21 30 8 59 MAIS 4 3 3 1.2 7 MAIS 5 1 1.4 0.4 3 Total 371 307 116 794 In the next three tables, the injury prevented column is multiplied by the relative value17
per injury column to determine the equivalent lives saved column. Table VI-4 shows the injuries prevented in frontal crashes from adding a lap/shoulder belt to motorcoach seats.
17 A calculation based on data presented in “The Economic Impact of Motor vehicle Crashes 2000” updated to reflect guidance found in February 5th 2000 , DOT Memorandum “Treatment of the Economic Value of a Statistical Life in Departmental Analyses.”
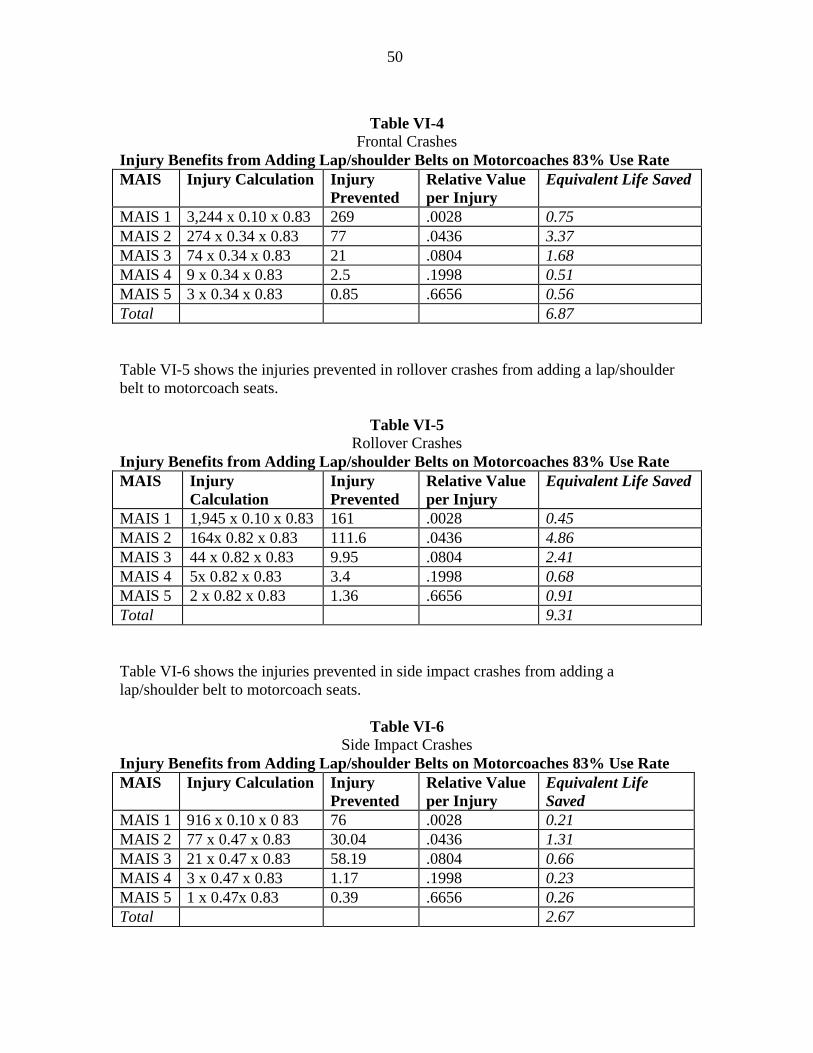
50
Table VI-4
Frontal Crashes Injury Benefits from Adding Lap/shoulder Belts on Motorcoaches 83% Use Rate MAIS Injury Calculation Injury
Prevented Relative Value per Injury
Equivalent Life Saved
MAIS 1 3,244 x 0.10 x 0.83 269 .0028 0.75 MAIS 2 274 x 0.34 x 0.83 77 .0436 3.37 MAIS 3 74 x 0.34 x 0.83 21 .0804 1.68 MAIS 4 9 x 0.34 x 0.83 2.5 .1998 0.51 MAIS 5 3 x 0.34 x 0.83 0.85 .6656 0.56 Total 6.87 Table VI-5 shows the injuries prevented in rollover crashes from adding a lap/shoulder belt to motorcoach seats.
Table VI-5
Rollover Crashes Injury Benefits from Adding Lap/shoulder Belts on Motorcoaches 83% Use Rate MAIS Injury
Calculation Injury Prevented
Relative Value per Injury
Equivalent Life Saved
MAIS 1 1,945 x 0.10 x 0.83 161 .0028 0.45 MAIS 2 164x 0.82 x 0.83 111.6 .0436 4.86 MAIS 3 44 x 0.82 x 0.83 9.95 .0804 2.41 MAIS 4 5x 0.82 x 0.83 3.4 .1998 0.68 MAIS 5 2 x 0.82 x 0.83 1.36 .6656 0.91 Total 9.31 Table VI-6 shows the injuries prevented in side impact crashes from adding a lap/shoulder belt to motorcoach seats.
Table VI-6
Side Impact Crashes Injury Benefits from Adding Lap/shoulder Belts on Motorcoaches 83% Use Rate MAIS Injury Calculation Injury
Prevented Relative Value per Injury
Equivalent Life Saved
MAIS 1 916 x 0.10 x 0 83 76 .0028 0.21 MAIS 2 77 x 0.47 x 0.83 30.04 .0436 1.31 MAIS 3 21 x 0.47 x 0.83 58.19 .0804 0.66 MAIS 4 3 x 0.47 x 0.83 1.17 .1998 0.23 MAIS 5 1 x 0.47x 0.83 0.39 .6656 0.26 Total 2.67
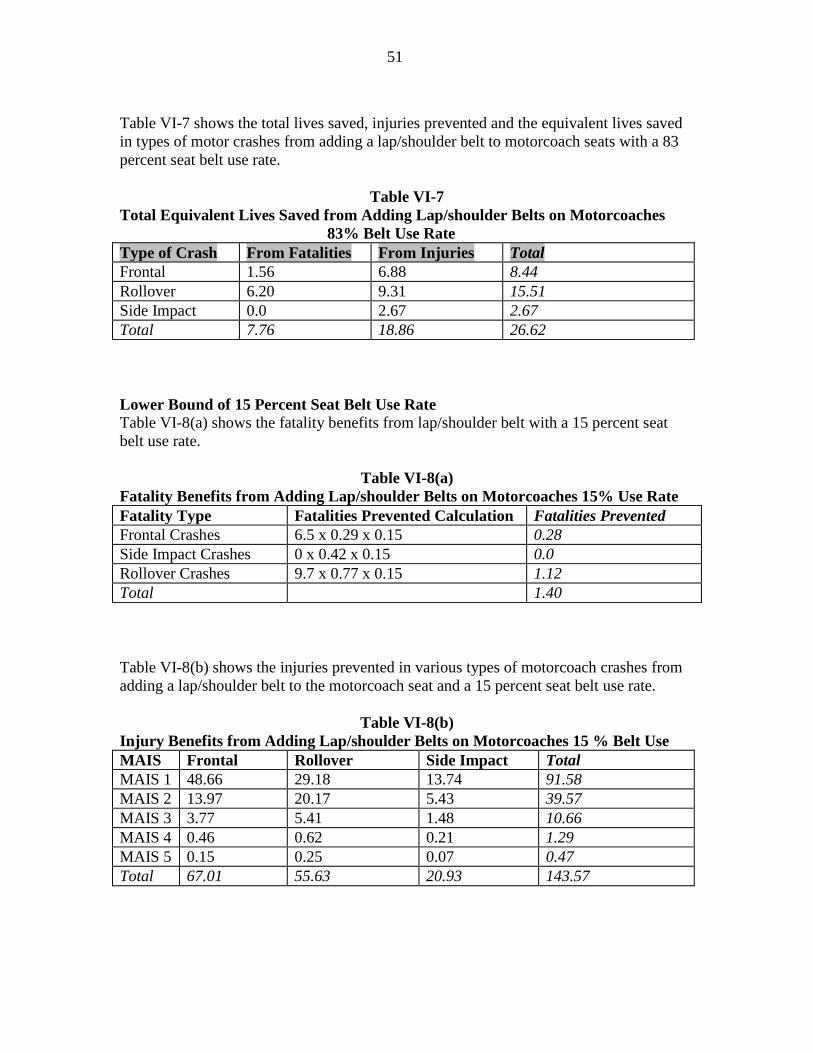
51
Table VI-7 shows the total lives saved, injuries prevented and the equivalent lives saved in types of motor crashes from adding a lap/shoulder belt to motorcoach seats with a 83 percent seat belt use rate.
Table VI-7
Total Equivalent Lives Saved from Adding Lap/shoulder Belts on Motorcoaches 83% Belt Use Rate Type of Crash From Fatalities From Injuries Total Frontal 1.56 6.88 8.44 Rollover 6.20 9.31 15.51 Side Impact 0.0 2.67 2.67 Total 7.76 18.86 26.62 Lower Bound of 15 Percent Seat Belt Use Rate Table VI-8(a) shows the fatality benefits from lap/shoulder belt with a 15 percent seat belt use rate.
Table VI-8(a)
Fatality Benefits from Adding Lap/shoulder Belts on Motorcoaches 15% Use Rate Fatality Type Fatalities Prevented Calculation Fatalities Prevented Frontal Crashes 6.5 x 0.29 x 0.15 0.28 Side Impact Crashes 0 x 0.42 x 0.15 0.0 Rollover Crashes 9.7 x 0.77 x 0.15 1.12 Total 1.40 Table VI-8(b) shows the injuries prevented in various types of motorcoach crashes from adding a lap/shoulder belt to the motorcoach seat and a 15 percent seat belt use rate.
Table VI-8(b) Injury Benefits from Adding Lap/shoulder Belts on Motorcoaches 15 % Belt Use MAIS Frontal Rollover Side Impact Total MAIS 1 48.66 29.18 13.74 91.58 MAIS 2 13.97 20.17 5.43 39.57 MAIS 3 3.77 5.41 1.48 10.66 MAIS 4 0.46 0.62 0.21 1.29 MAIS 5 0.15 0.25 0.07 0.47 Total 67.01 55.63 20.93 143.57
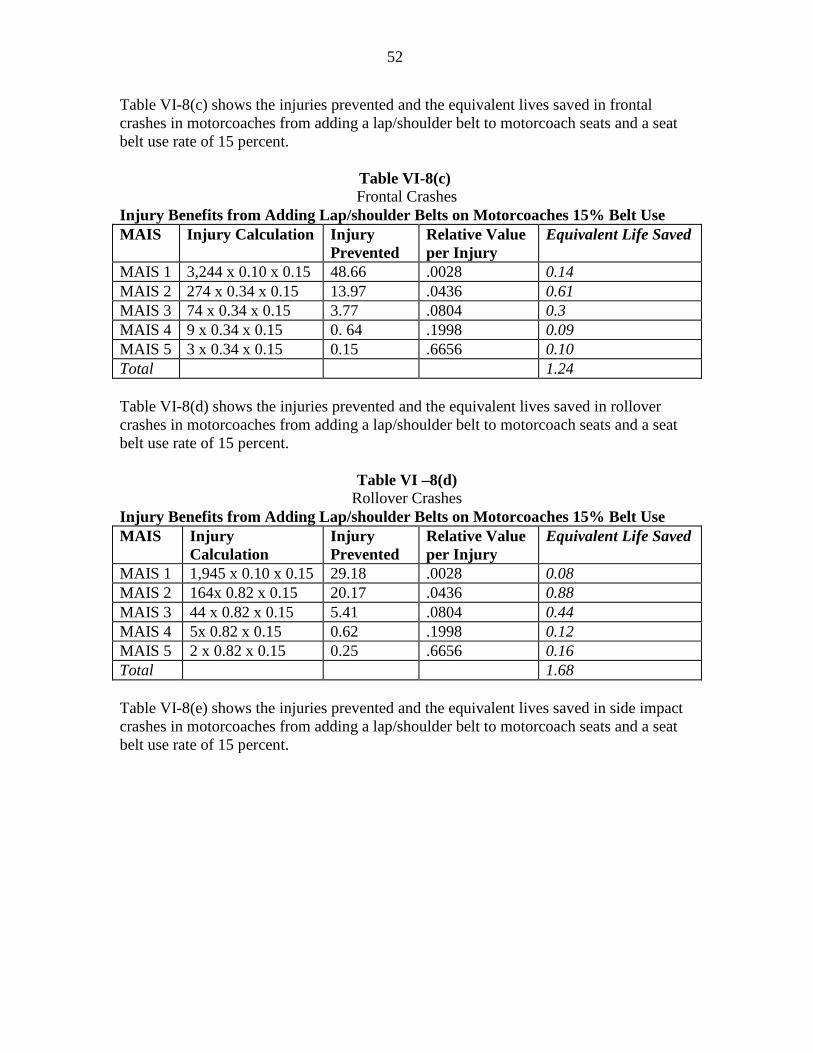
52
Table VI-8(c) shows the injuries prevented and the equivalent lives saved in frontal crashes in motorcoaches from adding a lap/shoulder belt to motorcoach seats and a seat belt use rate of 15 percent. Table VI-8(c)
Frontal Crashes Injury Benefits from Adding Lap/shoulder Belts on Motorcoaches 15% Belt Use MAIS Injury Calculation Injury
Prevented Relative Value per Injury
Equivalent Life Saved
MAIS 1 3,244 x 0.10 x 0.15 48.66 .0028 0.14 MAIS 2 274 x 0.34 x 0.15 13.97 .0436 0.61 MAIS 3 74 x 0.34 x 0.15 3.77 .0804 0.3 MAIS 4 9 x 0.34 x 0.15 0. 64 .1998 0.09 MAIS 5 3 x 0.34 x 0.15 0.15 .6656 0.10 Total 1.24 Table VI-8(d) shows the injuries prevented and the equivalent lives saved in rollover crashes in motorcoaches from adding a lap/shoulder belt to motorcoach seats and a seat belt use rate of 15 percent.
Table VI –8(d) Rollover Crashes
Injury Benefits from Adding Lap/shoulder Belts on Motorcoaches 15% Belt Use MAIS Injury
Calculation Injury Prevented
Relative Value per Injury
Equivalent Life Saved
MAIS 1 1,945 x 0.10 x 0.15 29.18 .0028 0.08 MAIS 2 164x 0.82 x 0.15 20.17 .0436 0.88 MAIS 3 44 x 0.82 x 0.15 5.41 .0804 0.44 MAIS 4 5x 0.82 x 0.15 0.62 .1998 0.12 MAIS 5 2 x 0.82 x 0.15 0.25 .6656 0.16 Total 1.68 Table VI-8(e) shows the injuries prevented and the equivalent lives saved in side impact crashes in motorcoaches from adding a lap/shoulder belt to motorcoach seats and a seat belt use rate of 15 percent.
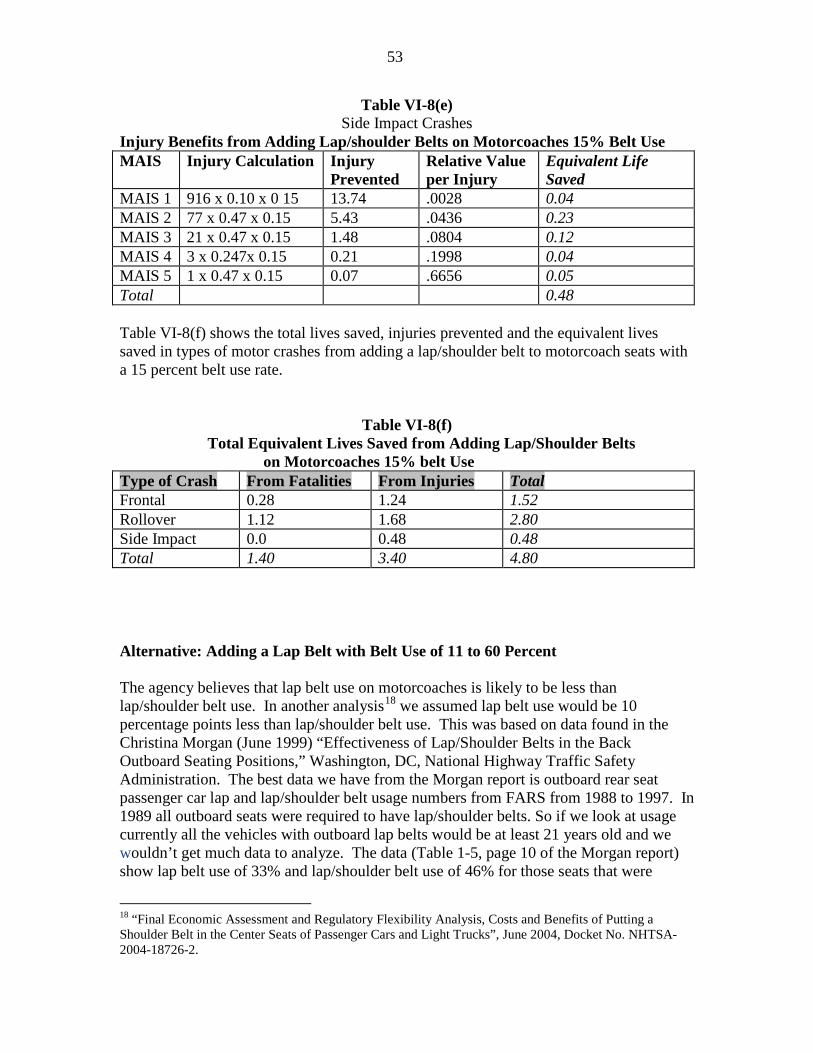
53
Table VI-8(e) Side Impact Crashes
Injury Benefits from Adding Lap/shoulder Belts on Motorcoaches 15% Belt Use MAIS Injury Calculation Injury
Prevented Relative Value per Injury
Equivalent Life Saved
MAIS 1 916 x 0.10 x 0 15 13.74 .0028 0.04 MAIS 2 77 x 0.47 x 0.15 5.43 .0436 0.23 MAIS 3 21 x 0.47 x 0.15 1.48 .0804 0.12 MAIS 4 3 x 0.247x 0.15 0.21 .1998 0.04 MAIS 5 1 x 0.47 x 0.15 0.07 .6656 0.05 Total 0.48 Table VI-8(f) shows the total lives saved, injuries prevented and the equivalent lives saved in types of motor crashes from adding a lap/shoulder belt to motorcoach seats with a 15 percent belt use rate.
Table VI-8(f) Total Equivalent Lives Saved from Adding Lap/Shoulder Belts on Motorcoaches 15% belt Use Type of Crash From Fatalities From Injuries Total Frontal 0.28 1.24 1.52 Rollover 1.12 1.68 2.80 Side Impact 0.0 0.48 0.48 Total 1.40 3.40 4.80 Alternative: Adding a Lap Belt with Belt Use of 11 to 60 Percent The agency believes that lap belt use on motorcoaches is likely to be less than lap/shoulder belt use. In another analysis18
18 “Final Economic Assessment and Regulatory Flexibility Analysis, Costs and Benefits of Putting a Shoulder Belt in the Center Seats of Passenger Cars and Light Trucks”, June 2004, Docket No. NHTSA-2004-18726-2.
we assumed lap belt use would be 10 percentage points less than lap/shoulder belt use. This was based on data found in the Christina Morgan (June 1999) “Effectiveness of Lap/Shoulder Belts in the Back Outboard Seating Positions,” Washington, DC, National Highway Traffic Safety Administration. The best data we have from the Morgan report is outboard rear seat passenger car lap and lap/shoulder belt usage numbers from FARS from 1988 to 1997. In 1989 all outboard seats were required to have lap/shoulder belts. So if we look at usage currently all the vehicles with outboard lap belts would be at least 21 years old and we wouldn’t get much data to analyze. The data (Table 1-5, page 10 of the Morgan report) show lap belt use of 33% and lap/shoulder belt use of 46% for those seats that were
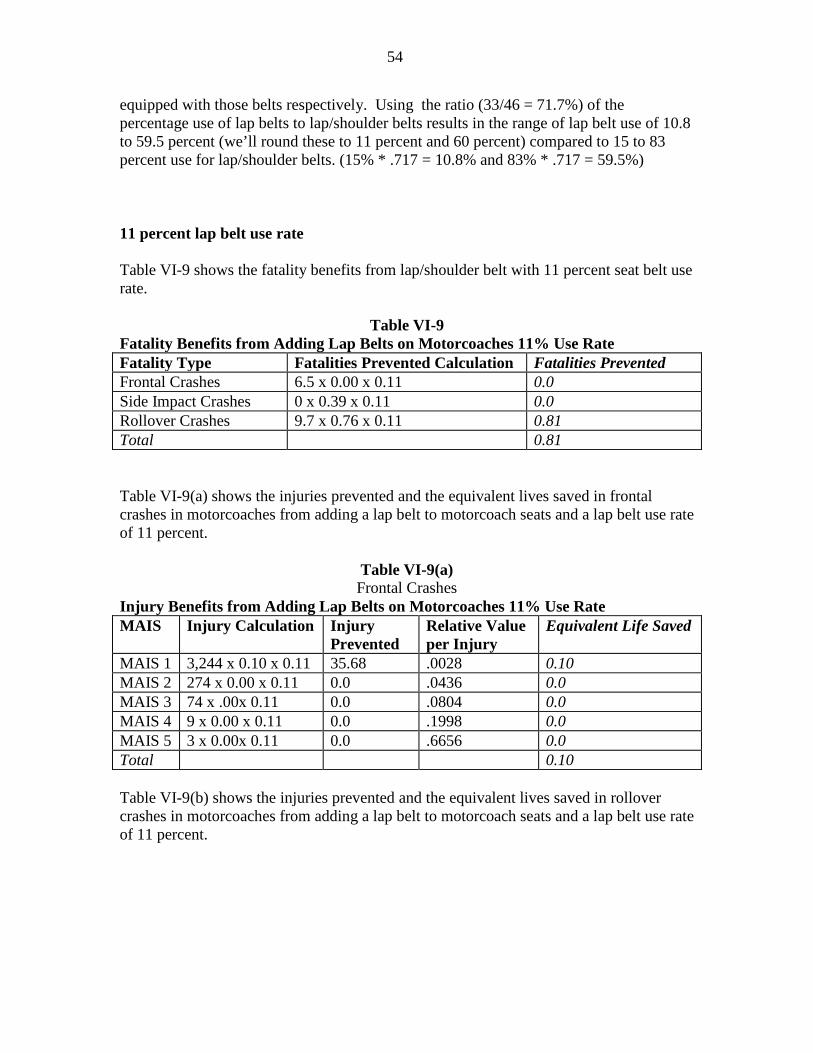
54
equipped with those belts respectively. Using the ratio (33/46 = 71.7%) of the percentage use of lap belts to lap/shoulder belts results in the range of lap belt use of 10.8 to 59.5 percent (we’ll round these to 11 percent and 60 percent) compared to 15 to 83 percent use for lap/shoulder belts. (15% * .717 = 10.8% and 83% * .717 = 59.5%) 11 percent lap belt use rate Table VI-9 shows the fatality benefits from lap/shoulder belt with 11 percent seat belt use rate.
Table VI-9 Fatality Benefits from Adding Lap Belts on Motorcoaches 11% Use Rate Fatality Type Fatalities Prevented Calculation Fatalities Prevented Frontal Crashes 6.5 x 0.00 x 0.11 0.0 Side Impact Crashes 0 x 0.39 x 0.11 0.0 Rollover Crashes 9.7 x 0.76 x 0.11 0.81 Total 0.81 Table VI-9(a) shows the injuries prevented and the equivalent lives saved in frontal crashes in motorcoaches from adding a lap belt to motorcoach seats and a lap belt use rate of 11 percent.
Table VI-9(a) Frontal Crashes
Injury Benefits from Adding Lap Belts on Motorcoaches 11% Use Rate MAIS Injury Calculation Injury
Prevented Relative Value per Injury
Equivalent Life Saved
MAIS 1 3,244 x 0.10 x 0.11 35.68 .0028 0.10 MAIS 2 274 x 0.00 x 0.11 0.0 .0436 0.0 MAIS 3 74 x .00x 0.11 0.0 .0804 0.0 MAIS 4 9 x 0.00 x 0.11 0.0 .1998 0.0 MAIS 5 3 x 0.00x 0.11 0.0 .6656 0.0 Total 0.10 Table VI-9(b) shows the injuries prevented and the equivalent lives saved in rollover crashes in motorcoaches from adding a lap belt to motorcoach seats and a lap belt use rate of 11 percent.
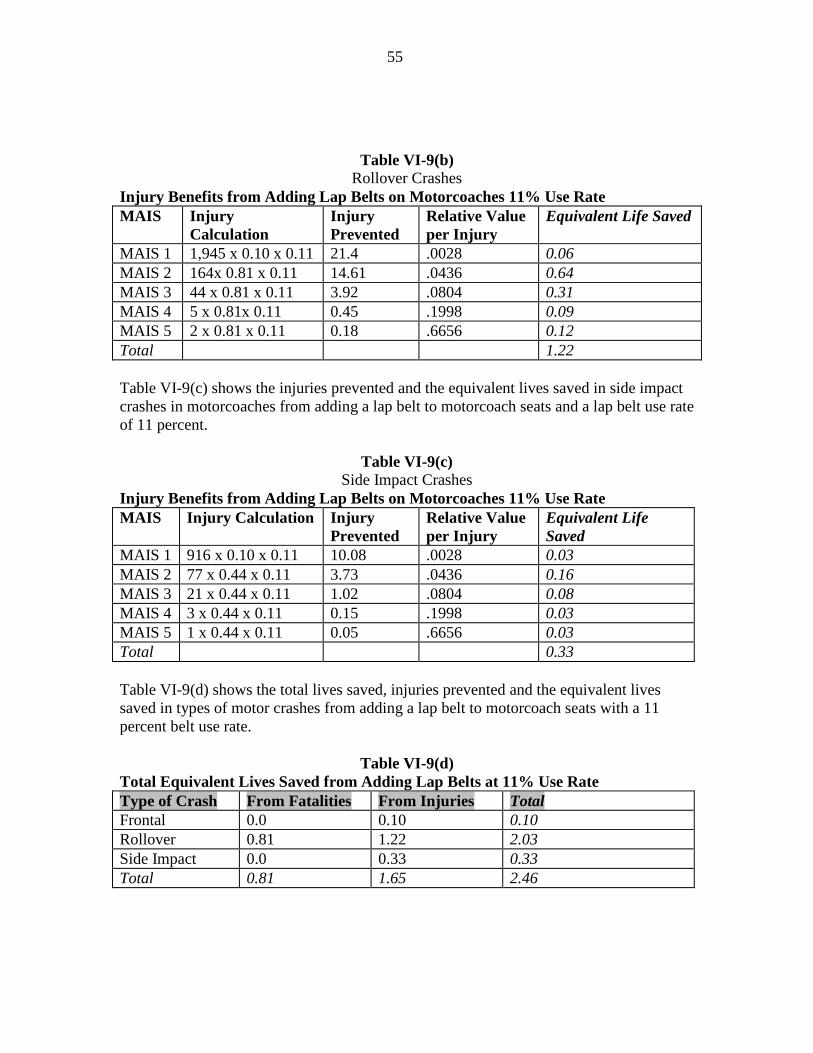
55
Table VI-9(b) Rollover Crashes
Injury Benefits from Adding Lap Belts on Motorcoaches 11% Use Rate MAIS Injury
Calculation Injury Prevented
Relative Value per Injury
Equivalent Life Saved
MAIS 1 1,945 x 0.10 x 0.11 21.4 .0028 0.06 MAIS 2 164x 0.81 x 0.11 14.61 .0436 0.64 MAIS 3 44 x 0.81 x 0.11 3.92 .0804 0.31 MAIS 4 5 x 0.81x 0.11 0.45 .1998 0.09 MAIS 5 2 x 0.81 x 0.11 0.18 .6656 0.12 Total 1.22 Table VI-9(c) shows the injuries prevented and the equivalent lives saved in side impact crashes in motorcoaches from adding a lap belt to motorcoach seats and a lap belt use rate of 11 percent.
Table VI-9(c) Side Impact Crashes
Injury Benefits from Adding Lap Belts on Motorcoaches 11% Use Rate MAIS Injury Calculation Injury
Prevented Relative Value per Injury
Equivalent Life Saved
MAIS 1 916 x 0.10 x 0.11 10.08 .0028 0.03 MAIS 2 77 x 0.44 x 0.11 3.73 .0436 0.16 MAIS 3 21 x 0.44 x 0.11 1.02 .0804 0.08 MAIS 4 3 x 0.44 x 0.11 0.15 .1998 0.03 MAIS 5 1 x 0.44 x 0.11 0.05 .6656 0.03 Total 0.33 Table VI-9(d) shows the total lives saved, injuries prevented and the equivalent lives saved in types of motor crashes from adding a lap belt to motorcoach seats with a 11 percent belt use rate.
Table VI-9(d) Total Equivalent Lives Saved from Adding Lap Belts at 11% Use Rate Type of Crash From Fatalities From Injuries Total Frontal 0.0 0.10 0.10 Rollover 0.81 1.22 2.03 Side Impact 0.0 0.33 0.33 Total 0.81 1.65 2.46
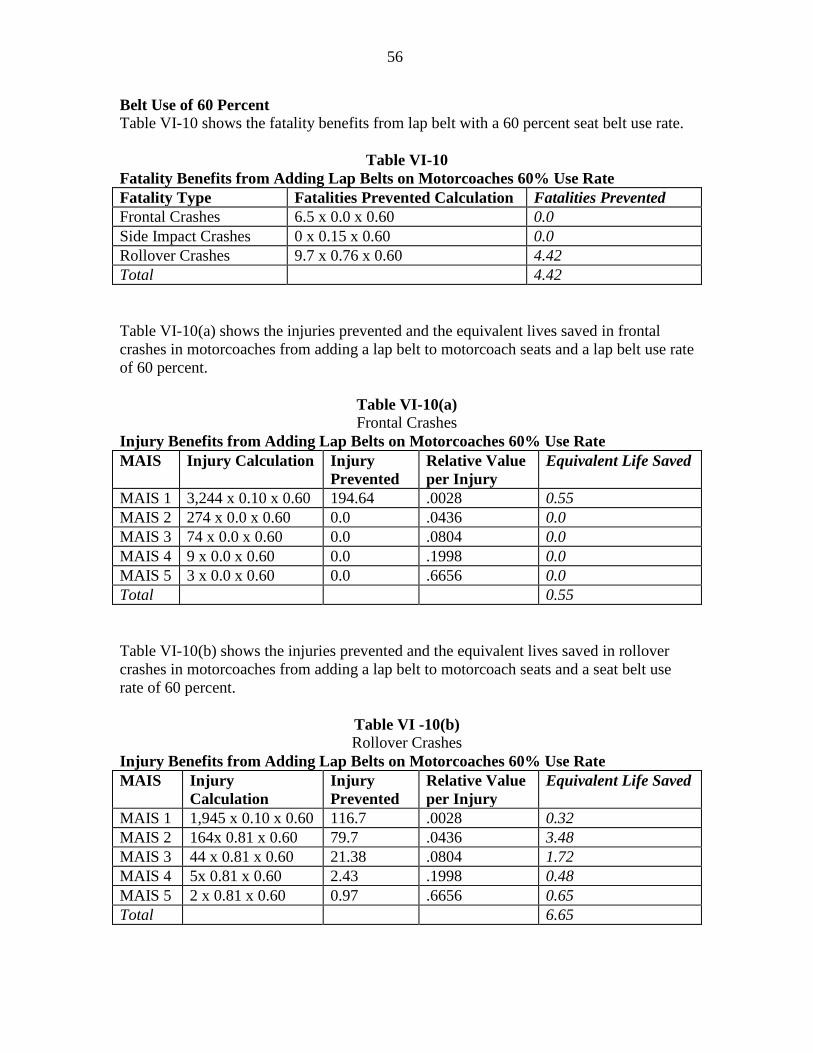
56
Belt Use of 60 Percent Table VI-10 shows the fatality benefits from lap belt with a 60 percent seat belt use rate.
Table VI-10
Fatality Benefits from Adding Lap Belts on Motorcoaches 60% Use Rate Fatality Type Fatalities Prevented Calculation Fatalities Prevented Frontal Crashes 6.5 x 0.0 x 0.60 0.0 Side Impact Crashes 0 x 0.15 x 0.60 0.0 Rollover Crashes 9.7 x 0.76 x 0.60 4.42 Total 4.42 Table VI-10(a) shows the injuries prevented and the equivalent lives saved in frontal crashes in motorcoaches from adding a lap belt to motorcoach seats and a lap belt use rate of 60 percent.
Table VI-10(a) Frontal Crashes
Injury Benefits from Adding Lap Belts on Motorcoaches 60% Use Rate MAIS Injury Calculation Injury
Prevented Relative Value per Injury
Equivalent Life Saved
MAIS 1 3,244 x 0.10 x 0.60 194.64 .0028 0.55 MAIS 2 274 x 0.0 x 0.60 0.0 .0436 0.0 MAIS 3 74 x 0.0 x 0.60 0.0 .0804 0.0 MAIS 4 9 x 0.0 x 0.60 0.0 .1998 0.0 MAIS 5 3 x 0.0 x 0.60 0.0 .6656 0.0 Total 0.55 Table VI-10(b) shows the injuries prevented and the equivalent lives saved in rollover crashes in motorcoaches from adding a lap belt to motorcoach seats and a seat belt use rate of 60 percent.
Table VI -10(b) Rollover Crashes
Injury Benefits from Adding Lap Belts on Motorcoaches 60% Use Rate MAIS Injury
Calculation Injury Prevented
Relative Value per Injury
Equivalent Life Saved
MAIS 1 1,945 x 0.10 x 0.60 116.7 .0028 0.32 MAIS 2 164x 0.81 x 0.60 79.7 .0436 3.48 MAIS 3 44 x 0.81 x 0.60 21.38 .0804 1.72 MAIS 4 5x 0.81 x 0.60 2.43 .1998 0.48 MAIS 5 2 x 0.81 x 0.60 0.97 .6656 0.65 Total 6.65
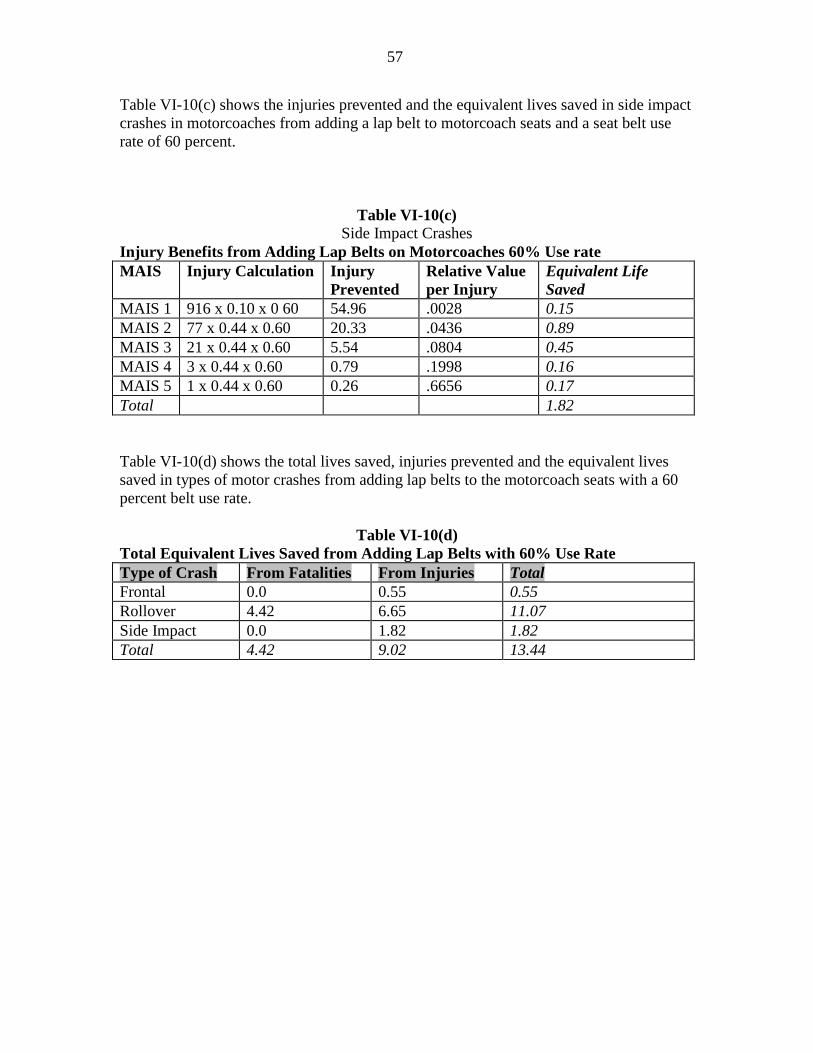
57
Table VI-10(c) shows the injuries prevented and the equivalent lives saved in side impact crashes in motorcoaches from adding a lap belt to motorcoach seats and a seat belt use rate of 60 percent.
Table VI-10(c) Side Impact Crashes
Injury Benefits from Adding Lap Belts on Motorcoaches 60% Use rate MAIS Injury Calculation Injury
Prevented Relative Value per Injury
Equivalent Life Saved
MAIS 1 916 x 0.10 x 0 60 54.96 .0028 0.15 MAIS 2 77 x 0.44 x 0.60 20.33 .0436 0.89 MAIS 3 21 x 0.44 x 0.60 5.54 .0804 0.45 MAIS 4 3 x 0.44 x 0.60 0.79 .1998 0.16 MAIS 5 1 x 0.44 x 0.60 0.26 .6656 0.17 Total 1.82 Table VI-10(d) shows the total lives saved, injuries prevented and the equivalent lives saved in types of motor crashes from adding lap belts to the motorcoach seats with a 60 percent belt use rate.
Table VI-10(d) Total Equivalent Lives Saved from Adding Lap Belts with 60% Use Rate Type of Crash From Fatalities From Injuries Total Frontal 0.0 0.55 0.55 Rollover 4.42 6.65 11.07 Side Impact 0.0 1.82 1.82 Total 4.42 9.02 13.44

58
VII. Costs Cost of Installing Lap/Shoulder Belts on New Motorcoach Passenger Seating Positions The size of motorcoach fleet estimate from the Motorcoach Census 2008 is 29,325 vehicles. Motorcoach Facts 2008 states that approximately 2000 motorcoaches are produced annually.19
The following cost estimates have been obtained from IMMI who has been working with Greyhound Bus Company to install three-point belts on their motorcoaches. The incremental cost of adding IMMI seats with three-point belts on a 54 passenger motorcoach is approximately $9,900. The cost to change the seat anchorages and to reinforce the floor is approximately $3,000. Total cost of adding belts, changing the anchorages and reinforcing the floor is approximately $12,900. The total cost of adding three point seat belts to all new motorcoaches is $25.8 million ($12,900 x 2,000). As seen later, adding a shoulder belt to the driver seat for 60 percent of the motorcoaches will added an additional $34.000 to the fleet. Total cost of the adding three point belts and shoulder belt to 60 percent of the driver’s seat is approximately $25.8 million ($25.8 million + $34,000).
Cost of Lap Belts on New Motorcoaches For the alternative of adding a lap belt, the agency estimates that the cost per new bus is approximately $6,000. The total cost per fleet is $12,000,000 ($6,000 x 2,000).
Cost of Installing Lap/Shoulder belts on Bus Driver Seating Positions FMVSS No. 208 currently requires buses with a gross vehicle weight rating (GVWR) of 4,536 kg (10,000 pounds) or less to provide a lap/shoulder belt for the driver seating position. For heavier (large) buses, FMVSS No. 208 requires that all buses be equipped, at a minimum, with either lap or lap/shoulder belts at the driver’s designated seating position.20 The difference in costs between a lap belt only and a lap/shoulder belt at the driver seating position is approximately $28.1121
. This cost includes the difference in cost between a lap and lap/shoulder belt, adding in pretensioners and load limiters for the lap/shoulder belt and bringing these estimates up to 2008 dollars. Some manufacturers have suggested that only about 40 percent of the new motorcoach buyers are requesting lap/shoulder belts. That would add approximately $34,000 (2000 x.6 x $28.11) to the cost of the fleet. Therefore, the cost of requiring lap/shoulder belts in the driver seat of motorcoaches and other buses is estimated to be $34,000.
19 Motorcoach Facts 2008,”Comparisons of Energy Use and Emission from Different Transportation Modes” M.J Bradley and Associates 20 Manufacturers may alternatively equip buses with a complete occupant protection system that requires no action by the vehicle occupants. However, currently all large bus manufacturers have opted to install seat belts at the driver’s position. 21 “Cost and Weight Added by the Federal Motor Vehicle Safety Standards for Model Years 1968-2001 in Passenger Cars and Light Trucks”, December 2004, DOT HS 809 834, Pages 81 and 88.
59
Cost of Installing Lap or Lap/Shoulder Belts on Existing Motorcoach Passenger Seating Positions (Retrofitting) NHTSA has the authority to promulgate safety standards for existing commercial motor vehicles under Sec. 101(f) of Motor Carrier Safety Improvement Act of 1999 (Public Law 106-159; Dec. 9, 1999). According to the Nathan report, Motorcoach Census 2005, approximately 2,665 of the motorcoach service providers operated 10 or fewer buses. Rulemaking believes that many of these motorcoach operators may be considered small businesses. Therefore, the effects on small business in promulgating a regulation to install lap/shoulder belts on existing motorcoaches may be substantial and should be considered. Greyhound estimated in the January 15, 2009 meeting with the agency that the cost to retrofit existing newer MCI model motorcoaches with lap/shoulder seat belts in each passenger seating position to be approximately $40,000. The reason for the substantial cost increase over the cost associated with installing laps/shoulder belts in new motorcoaches is due to the fact that all of the existing seats would need to be replaced. Additional seat anchorage strengthening to accommodate the additional loading from the seat belts would need to be done. This may include strengthening both the floor and side wall and may be even more costly on older motorcoaches. The existing fleet size is approximately 29,325 motorcoaches and assuming that all motorcoaches would require similar structural changes, the total cost for retrofitting the entire fleet with lap/shoulder seat belts to be $1,173,000,000 ($40,000 x 29,325). This may be an under estimate considering older motorcoaches. The cost of retrofitting a motorcoach with lap belt only is estimated to be approximately $6,000 per motorcoach. The cost of retrofitting the fleet of motorcoaches with lap belts is $175,950,000 ($6,000 x 29,325). This cost assumes that the motorcoaches are lap belt ready. If the motorcoaches are not lap belt ready, then the motorcoaches must be reinforced in order to support lap belts. The agency assumes that the reinforcement of the motorcoach to accommodate a lap belt is similar to the reinforcement of the motorcoach for a lap/shoulder belt. As a result, the cost of retrofitting motorcoaches to accommodate lap belts is $997,050,000 ($34,000 x 29,325). Given the very large expense to retrofit, it is not likely to be economically viable for small operators. The agency has heard claims of the possibility that some small operator might be forced to retrofit because consumers might decide to use only buses that have seat belts. Given that many of the small operators are regional and specialty carriers that do not compete with large established companies, the agency does not believe that lacking a seat belt in the motorcoach would have an adverse effect on the economic viability of small operators. Weight Impacts Based on preliminary results from a NHTSA contractor doing cost/weight teardown studies of motorcoach seats, it is estimated that the weight added by 3-point lap/shoulder belts ranges from 5.96 to 9.95 pounds per 2-person seat. This is the weight only of the seat belt assembly itself and does not include changing the design of the seat, reinforcing the floor, walls or other areas of the motorcoach. Assuming a 54 passenger motorcoach,
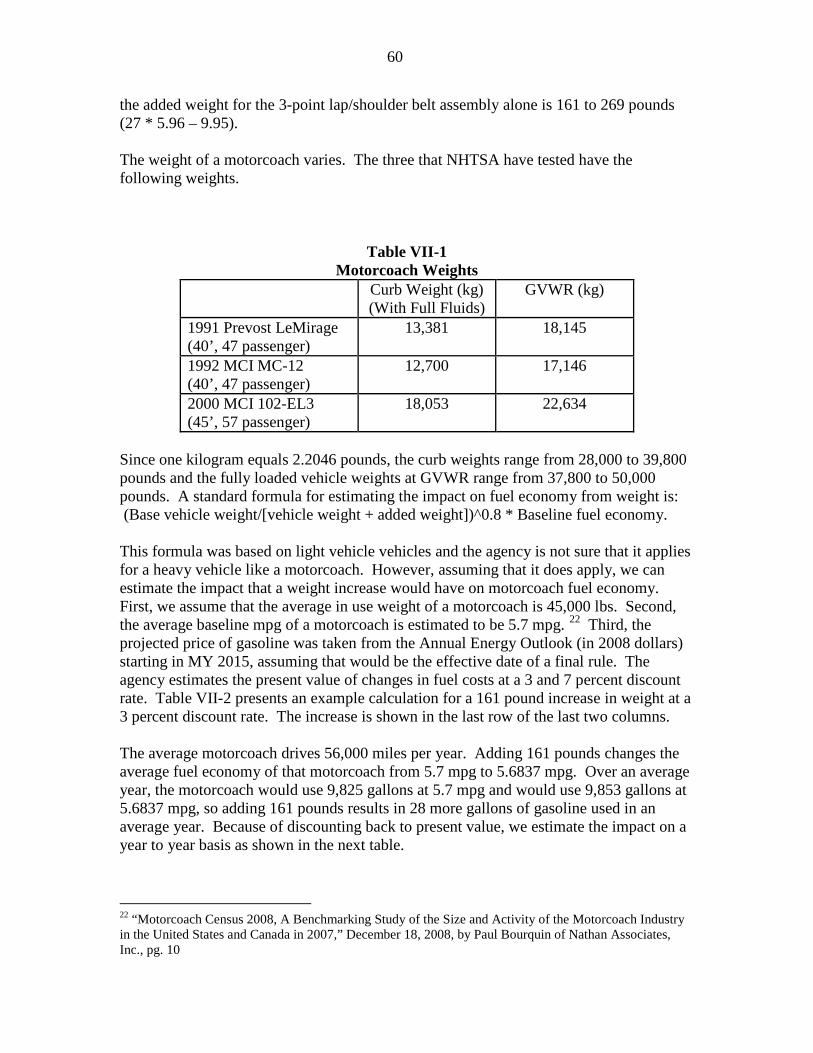
60
the added weight for the 3-point lap/shoulder belt assembly alone is 161 to 269 pounds (27 * 5.96 – 9.95). The weight of a motorcoach varies. The three that NHTSA have tested have the following weights.
Table VII-1 Motorcoach Weights
Curb Weight (kg) (With Full Fluids)
GVWR (kg)
1991 Prevost LeMirage (40’, 47 passenger)
13,381 18,145
1992 MCI MC-12 (40’, 47 passenger)
12,700 17,146
2000 MCI 102-EL3 (45’, 57 passenger)
18,053 22,634
Since one kilogram equals 2.2046 pounds, the curb weights range from 28,000 to 39,800 pounds and the fully loaded vehicle weights at GVWR range from 37,800 to 50,000 pounds. A standard formula for estimating the impact on fuel economy from weight is: (Base vehicle weight/[vehicle weight + added weight])^0.8 * Baseline fuel economy. This formula was based on light vehicle vehicles and the agency is not sure that it applies for a heavy vehicle like a motorcoach. However, assuming that it does apply, we can estimate the impact that a weight increase would have on motorcoach fuel economy. First, we assume that the average in use weight of a motorcoach is 45,000 lbs. Second, the average baseline mpg of a motorcoach is estimated to be 5.7 mpg. 22
Third, the projected price of gasoline was taken from the Annual Energy Outlook (in 2008 dollars) starting in MY 2015, assuming that would be the effective date of a final rule. The agency estimates the present value of changes in fuel costs at a 3 and 7 percent discount rate. Table VII-2 presents an example calculation for a 161 pound increase in weight at a 3 percent discount rate. The increase is shown in the last row of the last two columns.
The average motorcoach drives 56,000 miles per year. Adding 161 pounds changes the average fuel economy of that motorcoach from 5.7 mpg to 5.6837 mpg. Over an average year, the motorcoach would use 9,825 gallons at 5.7 mpg and would use 9,853 gallons at 5.6837 mpg, so adding 161 pounds results in 28 more gallons of gasoline used in an average year. Because of discounting back to present value, we estimate the impact on a year to year basis as shown in the next table.
22 “Motorcoach Census 2008, A Benchmarking Study of the Size and Activity of the Motorcoach Industry in the United States and Canada in 2007,” December 18, 2008, by Paul Bourquin of Nathan Associates, Inc., pg. 10

61
Table VII-2 Example Calculation of Present Discounted Value of Fuel Costs
at 3% at 3%
Yr 1 = 2015 Fuel Fuel Present Present
Weighted
Consumption
Consumption Value Value
Vehicle
Vehicle
Vehicle
Fuel Price with Base with New of Fuel of Fuel
Age Miles Survival Miles
per Gallon
Fuel Economy
Fuel Economy
Consumption
Consumption
(years)
Traveled
Probability
Traveled
(2008 dollars) (gallons) (gallons)
(Base FE) (New FE)
1 64,901 0.9995 64,869 2.71 11,380 11,413 $29,951 $30,036 2 63,628 0.9985 63,533 2.78 11,146 11,178 $29,243 $29,327 3 62,381 0.9953 62,088 2.86 10,893 10,924 $28,471 $28,552 4 61,157 0.9874 60,386 2.91 10,594 10,624 $27,373 $27,451 5 59,958 0.9747 58,441 2.95 10,253 10,282 $26,087 $26,161 6 58,783 0.9574 56,279 3.00 9,873 9,902 $24,819 $24,890 7 57,630 0.9354 53,907 3.03 9,457 9,484 $23,320 $23,387 8 56,500 0.9092 51,370 3.07 9,012 9,038 $21,871 $21,934 9 55,370 0.879 48,670 3.11 8,539 8,563 $20,322 $20,380
10 54,263 0.8453 45,869 3.13 8,047 8,070 $18,719 $18,772 11 53,177 0.8083 42,983 3.17 7,541 7,562 $17,256 $17,306 12 52,114 0.7687 40,060 3.21 7,028 7,048 $15,819 $15,864 13 51,072 0.727 37,129 3.25 6,514 6,533 $14,419 $14,460 14 50,050 0.6836 34,214 3.30 6,002 6,020 $13,106 $13,144 15 49,049 0.6392 31,352 3.35 5,500 5,516 $11,843 $11,877 16 48,068 0.5942 28,562 3.38 5,011 5,025 $10,540 $10,570 17 47,107 0.5491 25,866 3.42 4,538 4,551 $9,381 $9,408 18 46,165 0.5045 23,290 3.47 4,086 4,098 $8,325 $8,349 19 45,241 0.4608 20,847 3.50 3,657 3,668 $7,300 $7,321 20 44,336 0.4183 18,546 3.55 3,254 3,263 $6,398 $6,417 21 43,450 0.3774 16,398 3.61 2,877 2,885 $5,589 $5,605 22 42,581 0.3385 14,414 3.66 2,529 2,536 $4,824 $4,838 23 41,729 0.3017 12,590 3.70 2,209 2,215 $4,137 $4,149
Total 1,208,
710
911,662
159,941 160,398 $379,125 $380,210
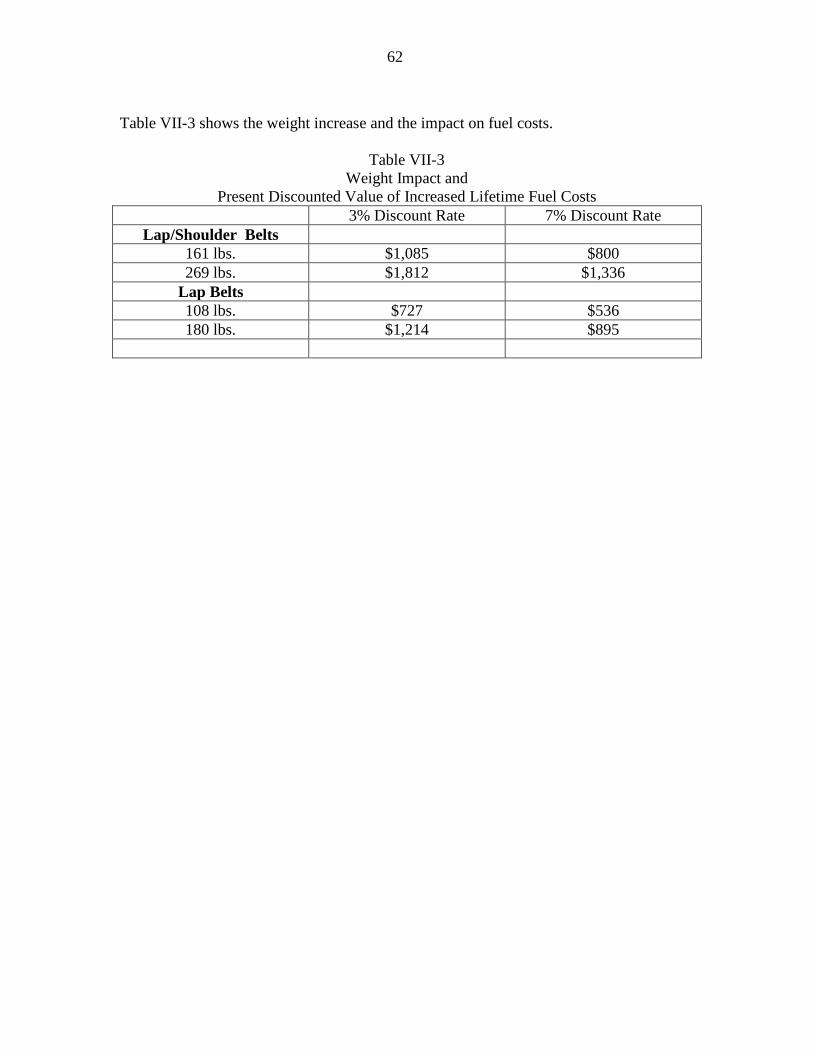
62
Table VII-3 shows the weight increase and the impact on fuel costs.
Table VII-3 Weight Impact and
Present Discounted Value of Increased Lifetime Fuel Costs 3% Discount Rate 7% Discount Rate
Lap/Shoulder Belts 161 lbs. $1,085 $800 269 lbs. $1,812 $1,336
Lap Belts 108 lbs. $727 $536 180 lbs. $1,214 $895
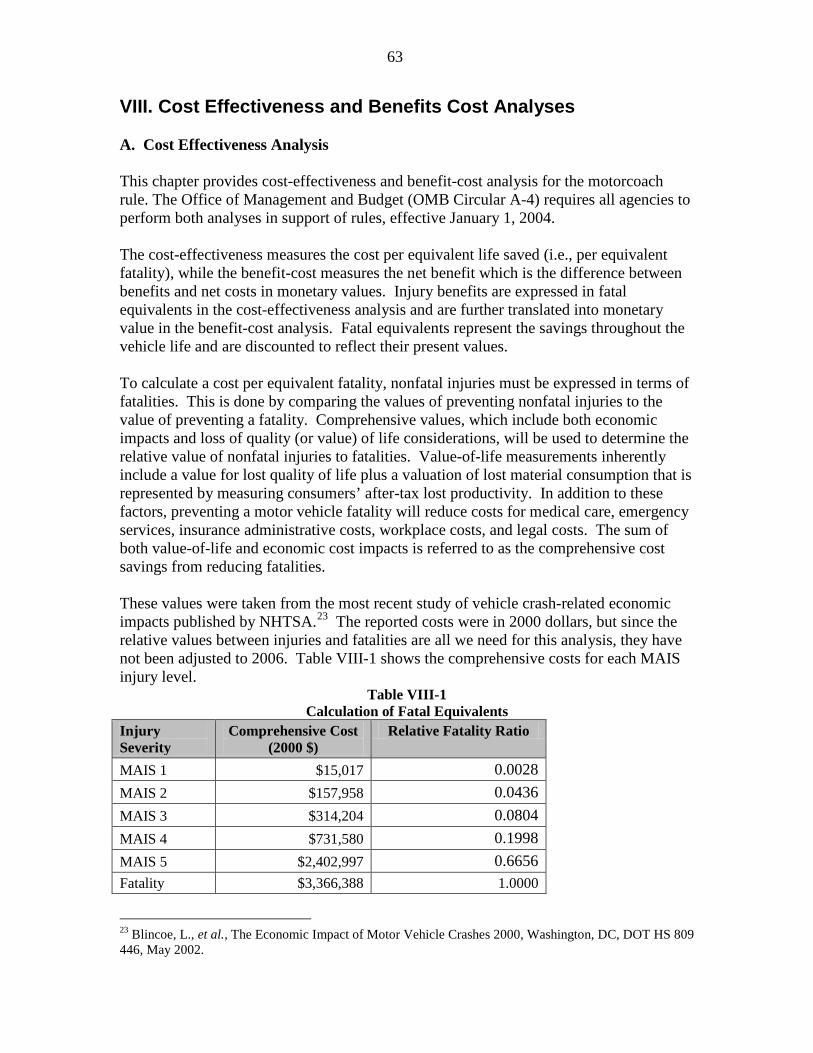
63
VIII. Cost Effectiveness and Benefits Cost Analyses A. Cost Effectiveness Analysis This chapter provides cost-effectiveness and benefit-cost analysis for the motorcoach rule. The Office of Management and Budget (OMB Circular A-4) requires all agencies to perform both analyses in support of rules, effective January 1, 2004. The cost-effectiveness measures the cost per equivalent life saved (i.e., per equivalent fatality), while the benefit-cost measures the net benefit which is the difference between benefits and net costs in monetary values. Injury benefits are expressed in fatal equivalents in the cost-effectiveness analysis and are further translated into monetary value in the benefit-cost analysis. Fatal equivalents represent the savings throughout the vehicle life and are discounted to reflect their present values. To calculate a cost per equivalent fatality, nonfatal injuries must be expressed in terms of fatalities. This is done by comparing the values of preventing nonfatal injuries to the value of preventing a fatality. Comprehensive values, which include both economic impacts and loss of quality (or value) of life considerations, will be used to determine the relative value of nonfatal injuries to fatalities. Value-of-life measurements inherently include a value for lost quality of life plus a valuation of lost material consumption that is represented by measuring consumers’ after-tax lost productivity. In addition to these factors, preventing a motor vehicle fatality will reduce costs for medical care, emergency services, insurance administrative costs, workplace costs, and legal costs. The sum of both value-of-life and economic cost impacts is referred to as the comprehensive cost savings from reducing fatalities. These values were taken from the most recent study of vehicle crash-related economic impacts published by NHTSA.23
Table VIII-1
The reported costs were in 2000 dollars, but since the relative values between injuries and fatalities are all we need for this analysis, they have not been adjusted to 2006. Table VIII-1 shows the comprehensive costs for each MAIS injury level.
Calculation of Fatal Equivalents Injury Severity
Comprehensive Cost (2000 $)
Relative Fatality Ratio
MAIS 1 $15,017 0.0028 MAIS 2 $157,958 0.0436 MAIS 3 $314,204 0.0804 MAIS 4 $731,580 0.1998 MAIS 5 $2,402,997 0.6656 Fatality $3,366,388 1.0000
23 Blincoe, L., et al., The Economic Impact of Motor Vehicle Crashes 2000, Washington, DC, DOT HS 809 446, May 2002.
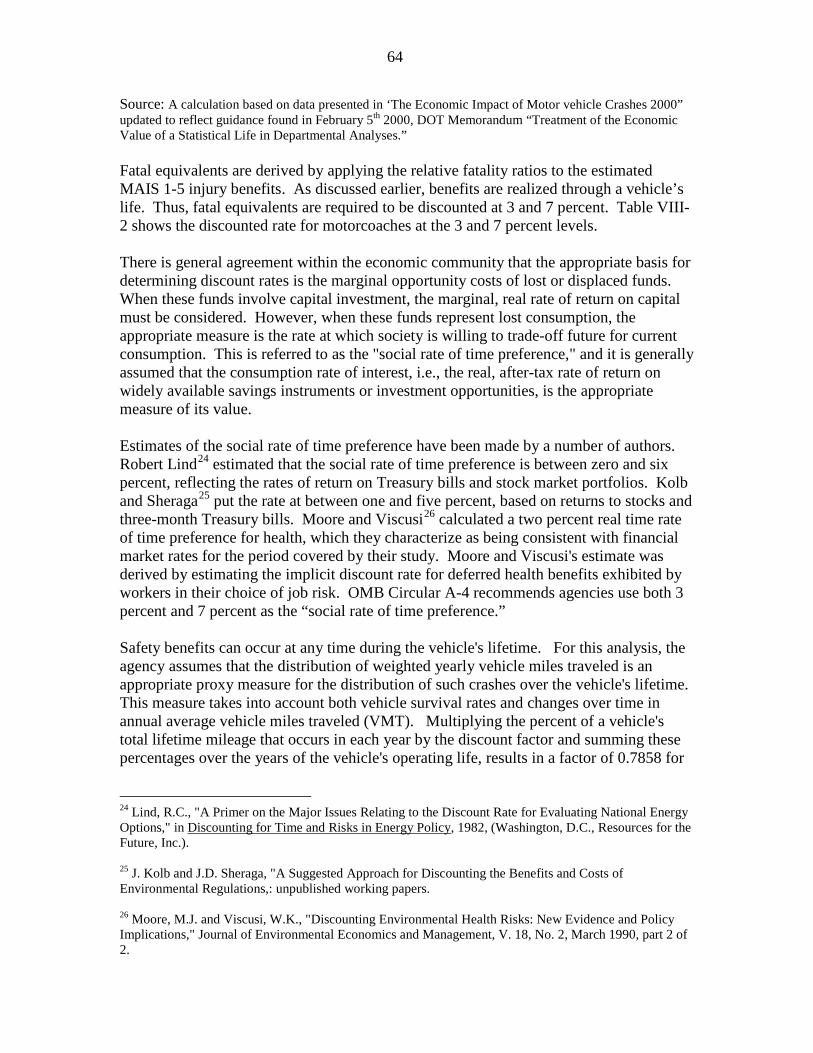
64
Source: A calculation based on data presented in ‘The Economic Impact of Motor vehicle Crashes 2000” updated to reflect guidance found in February 5th 2000, DOT Memorandum “Treatment of the Economic Value of a Statistical Life in Departmental Analyses.” Fatal equivalents are derived by applying the relative fatality ratios to the estimated MAIS 1-5 injury benefits. As discussed earlier, benefits are realized through a vehicle’s life. Thus, fatal equivalents are required to be discounted at 3 and 7 percent. Table VIII-2 shows the discounted rate for motorcoaches at the 3 and 7 percent levels. There is general agreement within the economic community that the appropriate basis for determining discount rates is the marginal opportunity costs of lost or displaced funds. When these funds involve capital investment, the marginal, real rate of return on capital must be considered. However, when these funds represent lost consumption, the appropriate measure is the rate at which society is willing to trade-off future for current consumption. This is referred to as the "social rate of time preference," and it is generally assumed that the consumption rate of interest, i.e., the real, after-tax rate of return on widely available savings instruments or investment opportunities, is the appropriate measure of its value. Estimates of the social rate of time preference have been made by a number of authors. Robert Lind24 estimated that the social rate of time preference is between zero and six percent, reflecting the rates of return on Treasury bills and stock market portfolios. Kolb and Sheraga25 put the rate at between one and five percent, based on returns to stocks and three-month Treasury bills. Moore and Viscusi26
calculated a two percent real time rate of time preference for health, which they characterize as being consistent with financial market rates for the period covered by their study. Moore and Viscusi's estimate was derived by estimating the implicit discount rate for deferred health benefits exhibited by workers in their choice of job risk. OMB Circular A-4 recommends agencies use both 3 percent and 7 percent as the “social rate of time preference.”
Safety benefits can occur at any time during the vehicle's lifetime. For this analysis, the agency assumes that the distribution of weighted yearly vehicle miles traveled is an appropriate proxy measure for the distribution of such crashes over the vehicle's lifetime. This measure takes into account both vehicle survival rates and changes over time in annual average vehicle miles traveled (VMT). Multiplying the percent of a vehicle's total lifetime mileage that occurs in each year by the discount factor and summing these percentages over the years of the vehicle's operating life, results in a factor of 0.7858 for
24 Lind, R.C., "A Primer on the Major Issues Relating to the Discount Rate for Evaluating National Energy Options," in Discounting for Time and Risks in Energy Policy, 1982, (Washington, D.C., Resources for the Future, Inc.). 25 J. Kolb and J.D. Sheraga, "A Suggested Approach for Discounting the Benefits and Costs of Environmental Regulations,: unpublished working papers. 26 Moore, M.J. and Viscusi, W.K., "Discounting Environmental Health Risks: New Evidence and Policy Implications," Journal of Environmental Economics and Management, V. 18, No. 2, March 1990, part 2 of 2.

65
motorcoaches under a 3 percent discounted rate. For the 7 percent discounted rate, these factors are 0.5999 for motorcoaches. In order to develop the discount factors in Table VIII-2, the following steps were taken, using the following factors. From the “Motorcoach Census 2008”, page 9, an average mileage per motorcoach was obtained. The Census determined the average mileage by summing the number of motorcoaches and the total route mileage for those coaches (1.88 billion), to determine that the average motorcoach drives 56,000 miles per year. There are average sales of approximately 2,000 coaches per year, and a fleet of 33,536. Since many instances the motorcoach engine is replaced after approximately 20 years, some longer, we calculated the average life of a motorcoach was 23 years27
. The 23 years number was derived by using the survivability (Column two Table VIII-2) of heavy trucks as a proxy for motorcoaches. Heavy trucks survivability was used because there is none available for motorcoaches. We assumed that the average mileage per motorcoach would decrease by a small percentage (2%) per year by age of the bus. This assumption tries to take into account that as motorcoaches get older, they are more likely to have mechanical problems that would keep them from full duties. Similar decreases in annual miles driven by age also occur for passenger cars and light trucks. It also takes into account human nature, that is when given a chance to drive a new or older bus to an event, most people would choose the newer bus. In the earlier years the coach is driven more miles and in the later years the coach is driven less miles. Thus, we determined that an average of 56,000 miles occur in Year 8 of the life of the motorcoach given the survivability of the vehicle and the total mileage of the fleet.
27 While the bus itself lasts longer and will be sold for other purposes, the decision makers would consider its’ life over the 15 years. Theoretically there would be a small benefit to society in reducing injuries after the 15 years, but they would add little to the analysis due to the heavy discounting in later years.
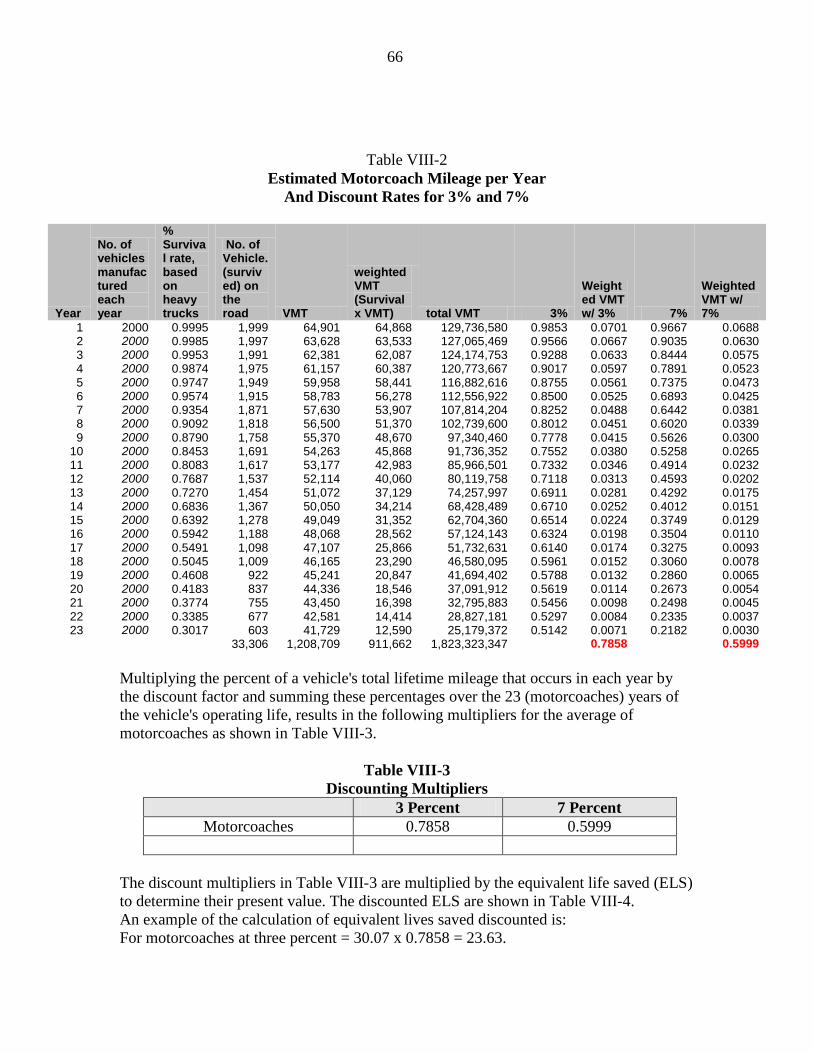
66
Table VIII-2 Estimated Motorcoach Mileage per Year
And Discount Rates for 3% and 7%
Year
No. of vehicles manufactured each year
% Survival rate, based on heavy trucks
No. of Vehicle. (survived) on the road VMT
weighted VMT (Survival x VMT) total VMT 3%
Weighted VMT w/ 3% 7%
Weighted VMT w/ 7%
1 2000 0.9995 1,999 64,901 64,868 129,736,580 0.9853 0.0701 0.9667 0.0688 2 2000 0.9985 1,997 63,628 63,533 127,065,469 0.9566 0.0667 0.9035 0.0630 3 2000 0.9953 1,991 62,381 62,087 124,174,753 0.9288 0.0633 0.8444 0.0575 4 2000 0.9874 1,975 61,157 60,387 120,773,667 0.9017 0.0597 0.7891 0.0523 5 2000 0.9747 1,949 59,958 58,441 116,882,616 0.8755 0.0561 0.7375 0.0473 6 2000 0.9574 1,915 58,783 56,278 112,556,922 0.8500 0.0525 0.6893 0.0425 7 2000 0.9354 1,871 57,630 53,907 107,814,204 0.8252 0.0488 0.6442 0.0381 8 2000 0.9092 1,818 56,500 51,370 102,739,600 0.8012 0.0451 0.6020 0.0339 9 2000 0.8790 1,758 55,370 48,670 97,340,460 0.7778 0.0415 0.5626 0.0300
10 2000 0.8453 1,691 54,263 45,868 91,736,352 0.7552 0.0380 0.5258 0.0265 11 2000 0.8083 1,617 53,177 42,983 85,966,501 0.7332 0.0346 0.4914 0.0232 12 2000 0.7687 1,537 52,114 40,060 80,119,758 0.7118 0.0313 0.4593 0.0202 13 2000 0.7270 1,454 51,072 37,129 74,257,997 0.6911 0.0281 0.4292 0.0175 14 2000 0.6836 1,367 50,050 34,214 68,428,489 0.6710 0.0252 0.4012 0.0151 15 2000 0.6392 1,278 49,049 31,352 62,704,360 0.6514 0.0224 0.3749 0.0129 16 2000 0.5942 1,188 48,068 28,562 57,124,143 0.6324 0.0198 0.3504 0.0110 17 2000 0.5491 1,098 47,107 25,866 51,732,631 0.6140 0.0174 0.3275 0.0093 18 2000 0.5045 1,009 46,165 23,290 46,580,095 0.5961 0.0152 0.3060 0.0078 19 2000 0.4608 922 45,241 20,847 41,694,402 0.5788 0.0132 0.2860 0.0065 20 2000 0.4183 837 44,336 18,546 37,091,912 0.5619 0.0114 0.2673 0.0054 21 2000 0.3774 755 43,450 16,398 32,795,883 0.5456 0.0098 0.2498 0.0045 22 2000 0.3385 677 42,581 14,414 28,827,181 0.5297 0.0084 0.2335 0.0037 23 2000 0.3017 603 41,729 12,590 25,179,372 0.5142 0.0071 0.2182 0.0030
33,306 1,208,709 911,662 1,823,323,347 0.7858 0.5999 Multiplying the percent of a vehicle's total lifetime mileage that occurs in each year by the discount factor and summing these percentages over the 23 (motorcoaches) years of the vehicle's operating life, results in the following multipliers for the average of motorcoaches as shown in Table VIII-3.
Table VIII-3
Discounting Multipliers 3 Percent 7 Percent
Motorcoaches 0.7858 0.5999
The discount multipliers in Table VIII-3 are multiplied by the equivalent life saved (ELS) to determine their present value. The discounted ELS are shown in Table VIII-4. An example of the calculation of equivalent lives saved discounted is: For motorcoaches at three percent = 30.07 x 0.7858 = 23.63.
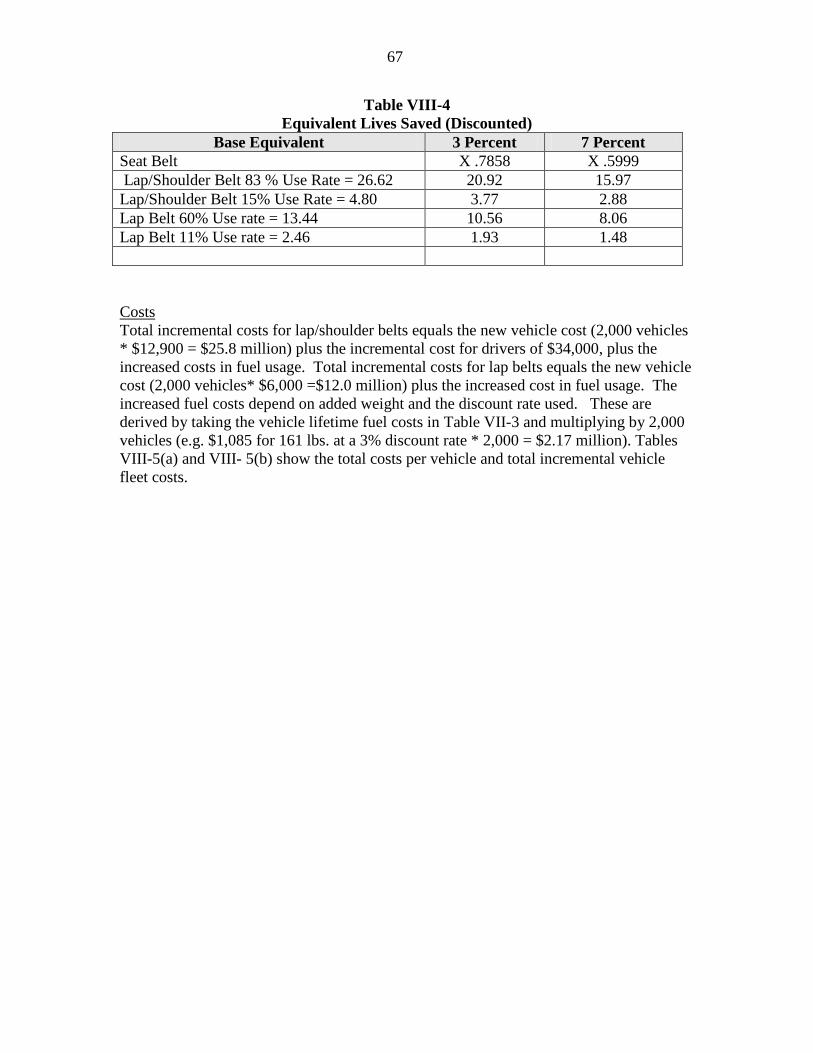
67
Table VIII-4 Equivalent Lives Saved (Discounted)
Base Equivalent 3 Percent 7 Percent Seat Belt X .7858 X .5999 Lap/Shoulder Belt 83 % Use Rate = 26.62 20.92 15.97 Lap/Shoulder Belt 15% Use Rate = 4.80 3.77 2.88 Lap Belt 60% Use rate = 13.44 10.56 8.06 Lap Belt 11% Use rate = 2.46 1.93 1.48
Costs Total incremental costs for lap/shoulder belts equals the new vehicle cost (2,000 vehicles * $12,900 = $25.8 million) plus the incremental cost for drivers of $34,000, plus the increased costs in fuel usage. Total incremental costs for lap belts equals the new vehicle cost (2,000 vehicles* $6,000 =$12.0 million) plus the increased cost in fuel usage. The increased fuel costs depend on added weight and the discount rate used. These are derived by taking the vehicle lifetime fuel costs in Table VII-3 and multiplying by 2,000 vehicles (e.g. $1,085 for 161 lbs. at a 3% discount rate * 2,000 = $2.17 million). Tables VIII-5(a) and VIII- 5(b) show the total costs per vehicle and total incremental vehicle fleet costs.
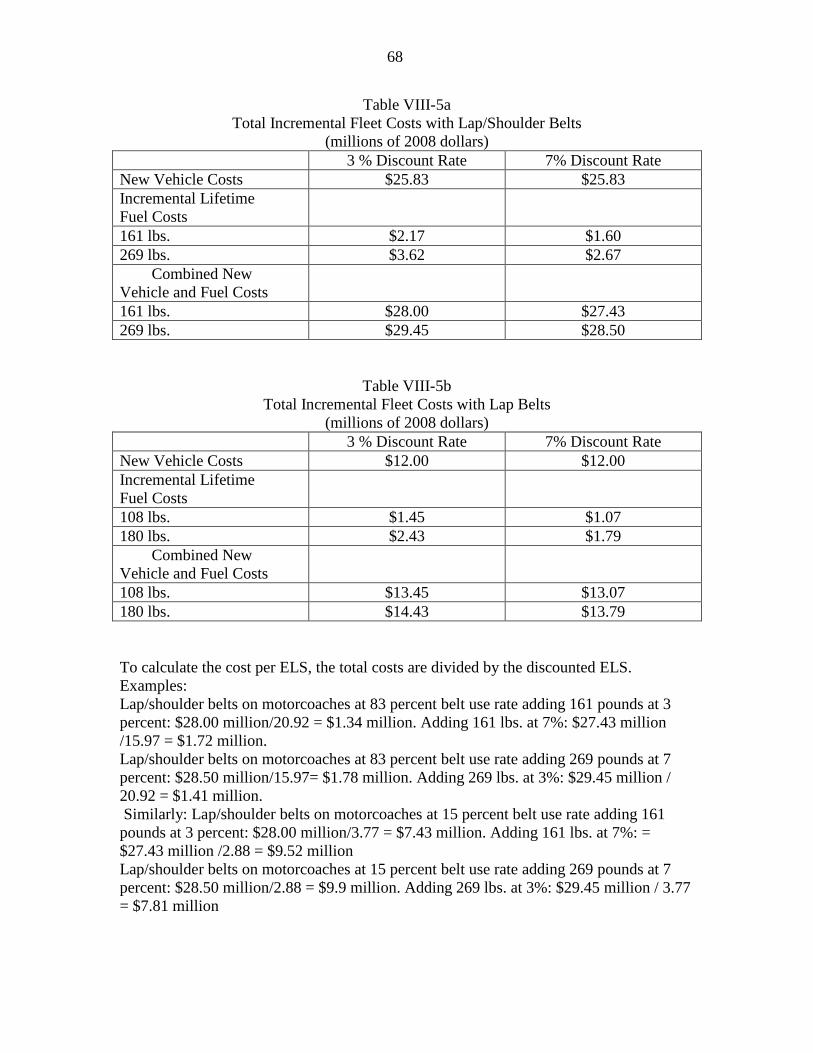
68
Table VIII-5a Total Incremental Fleet Costs with Lap/Shoulder Belts
(millions of 2008 dollars) 3 % Discount Rate 7% Discount Rate New Vehicle Costs $25.83 $25.83 Incremental Lifetime Fuel Costs
161 lbs. $2.17 $1.60 269 lbs. $3.62 $2.67 Combined New Vehicle and Fuel Costs
161 lbs. $28.00 $27.43 269 lbs. $29.45 $28.50
Table VIII-5b
Total Incremental Fleet Costs with Lap Belts (millions of 2008 dollars)
3 % Discount Rate 7% Discount Rate New Vehicle Costs $12.00 $12.00 Incremental Lifetime Fuel Costs
108 lbs. $1.45 $1.07 180 lbs. $2.43 $1.79 Combined New Vehicle and Fuel Costs
108 lbs. $13.45 $13.07 180 lbs. $14.43 $13.79 To calculate the cost per ELS, the total costs are divided by the discounted ELS. Examples: Lap/shoulder belts on motorcoaches at 83 percent belt use rate adding 161 pounds at 3 percent: $28.00 million/20.92 = $1.34 million. Adding 161 lbs. at 7%: $27.43 million /15.97 = $1.72 million. Lap/shoulder belts on motorcoaches at 83 percent belt use rate adding 269 pounds at 7 percent: $28.50 million/15.97= $1.78 million. Adding 269 lbs. at 3%: $29.45 million / 20.92 = $1.41 million. Similarly: Lap/shoulder belts on motorcoaches at 15 percent belt use rate adding 161 pounds at 3 percent: $28.00 million/3.77 = $7.43 million. Adding 161 lbs. at 7%: = $27.43 million /2.88 = $9.52 million Lap/shoulder belts on motorcoaches at 15 percent belt use rate adding 269 pounds at 7 percent: $28.50 million/2.88 = $9.9 million. Adding 269 lbs. at 3%: $29.45 million / 3.77 = $7.81 million
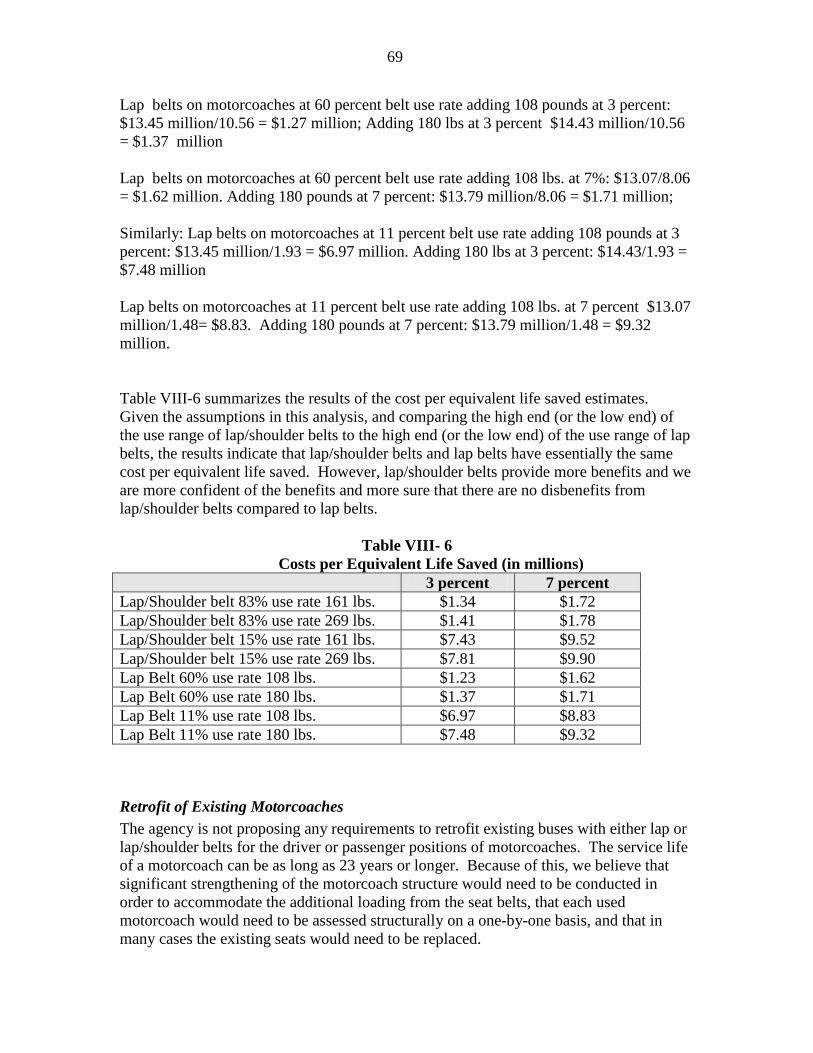
69
Lap belts on motorcoaches at 60 percent belt use rate adding 108 pounds at 3 percent: $13.45 million/10.56 = $1.27 million; Adding 180 lbs at 3 percent $14.43 million/10.56 = $1.37 million Lap belts on motorcoaches at 60 percent belt use rate adding 108 lbs. at 7%: $13.07/8.06 = $1.62 million. Adding 180 pounds at 7 percent: $13.79 million/8.06 = $1.71 million; Similarly: Lap belts on motorcoaches at 11 percent belt use rate adding 108 pounds at 3 percent: $13.45 million/1.93 = $6.97 million. Adding 180 lbs at 3 percent: $14.43/1.93 = $7.48 million Lap belts on motorcoaches at 11 percent belt use rate adding 108 lbs. at 7 percent $13.07 million/1.48= $8.83. Adding 180 pounds at 7 percent: $13.79 million/1.48 = $9.32 million. Table VIII-6 summarizes the results of the cost per equivalent life saved estimates. Given the assumptions in this analysis, and comparing the high end (or the low end) of the use range of lap/shoulder belts to the high end (or the low end) of the use range of lap belts, the results indicate that lap/shoulder belts and lap belts have essentially the same cost per equivalent life saved. However, lap/shoulder belts provide more benefits and we are more confident of the benefits and more sure that there are no disbenefits from lap/shoulder belts compared to lap belts.
Table VIII- 6 Costs per Equivalent Life Saved (in millions) 3 percent 7 percent Lap/Shoulder belt 83% use rate 161 lbs. $1.34 $1.72 Lap/Shoulder belt 83% use rate 269 lbs. $1.41 $1.78 Lap/Shoulder belt 15% use rate 161 lbs. $7.43 $9.52 Lap/Shoulder belt 15% use rate 269 lbs. $7.81 $9.90 Lap Belt 60% use rate 108 lbs. $1.23 $1.62 Lap Belt 60% use rate 180 lbs. $1.37 $1.71 Lap Belt 11% use rate 108 lbs. $6.97 $8.83 Lap Belt 11% use rate 180 lbs. $7.48 $9.32
Retrofit of Existing Motorcoaches The agency is not proposing any requirements to retrofit existing buses with either lap or lap/shoulder belts for the driver or passenger positions of motorcoaches. The service life of a motorcoach can be as long as 23 years or longer. Because of this, we believe that significant strengthening of the motorcoach structure would need to be conducted in order to accommodate the additional loading from the seat belts, that each used motorcoach would need to be assessed structurally on a one-by-one basis, and that in many cases the existing seats would need to be replaced.
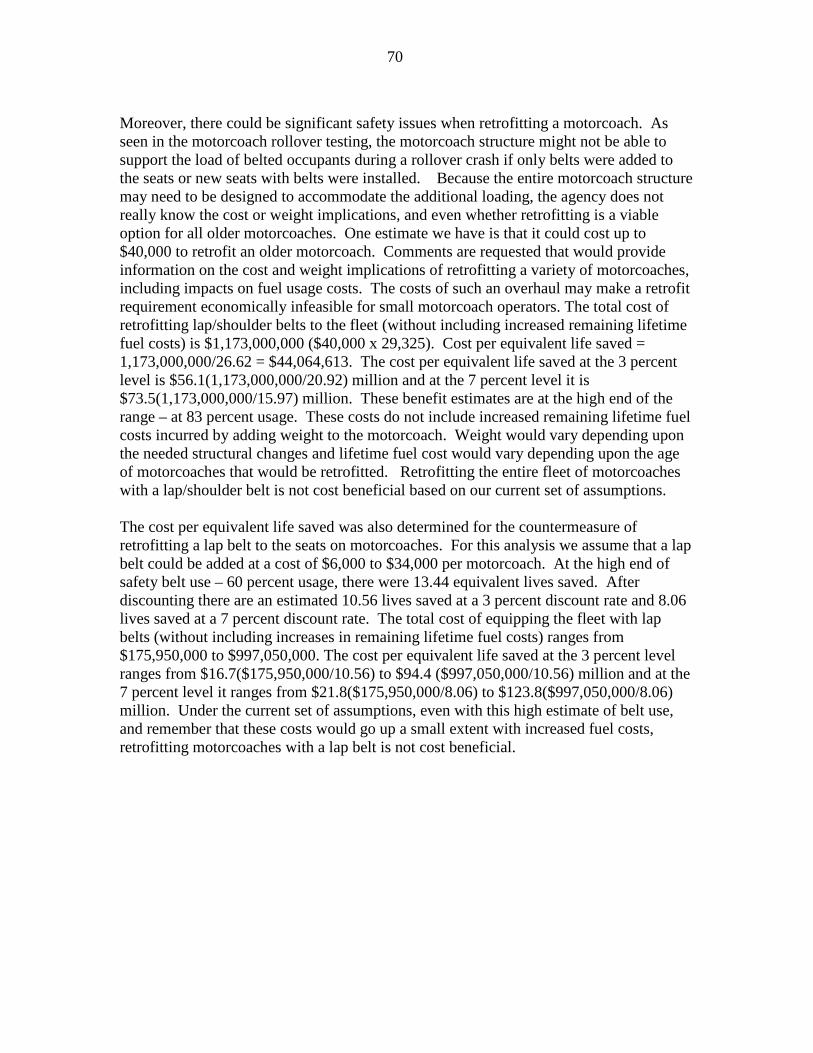
70
Moreover, there could be significant safety issues when retrofitting a motorcoach. As seen in the motorcoach rollover testing, the motorcoach structure might not be able to support the load of belted occupants during a rollover crash if only belts were added to the seats or new seats with belts were installed. Because the entire motorcoach structure may need to be designed to accommodate the additional loading, the agency does not really know the cost or weight implications, and even whether retrofitting is a viable option for all older motorcoaches. One estimate we have is that it could cost up to $40,000 to retrofit an older motorcoach. Comments are requested that would provide information on the cost and weight implications of retrofitting a variety of motorcoaches, including impacts on fuel usage costs. The costs of such an overhaul may make a retrofit requirement economically infeasible for small motorcoach operators. The total cost of retrofitting lap/shoulder belts to the fleet (without including increased remaining lifetime fuel costs) is $1,173,000,000 ($40,000 x 29,325). Cost per equivalent life saved = 1,173,000,000/26.62 = $44,064,613. The cost per equivalent life saved at the 3 percent level is $56.1(1,173,000,000/20.92) million and at the 7 percent level it is $73.5(1,173,000,000/15.97) million. These benefit estimates are at the high end of the range – at 83 percent usage. These costs do not include increased remaining lifetime fuel costs incurred by adding weight to the motorcoach. Weight would vary depending upon the needed structural changes and lifetime fuel cost would vary depending upon the age of motorcoaches that would be retrofitted. Retrofitting the entire fleet of motorcoaches with a lap/shoulder belt is not cost beneficial based on our current set of assumptions. The cost per equivalent life saved was also determined for the countermeasure of retrofitting a lap belt to the seats on motorcoaches. For this analysis we assume that a lap belt could be added at a cost of $6,000 to $34,000 per motorcoach. At the high end of safety belt use – 60 percent usage, there were 13.44 equivalent lives saved. After discounting there are an estimated 10.56 lives saved at a 3 percent discount rate and 8.06 lives saved at a 7 percent discount rate. The total cost of equipping the fleet with lap belts (without including increases in remaining lifetime fuel costs) ranges from $175,950,000 to $997,050,000. The cost per equivalent life saved at the 3 percent level ranges from $16.7($175,950,000/10.56) to $94.4 ($997,050,000/10.56) million and at the 7 percent level it ranges from $21.8($175,950,000/8.06) to $123.8($997,050,000/8.06) million. Under the current set of assumptions, even with this high estimate of belt use, and remember that these costs would go up a small extent with increased fuel costs, retrofitting motorcoaches with a lap belt is not cost beneficial.
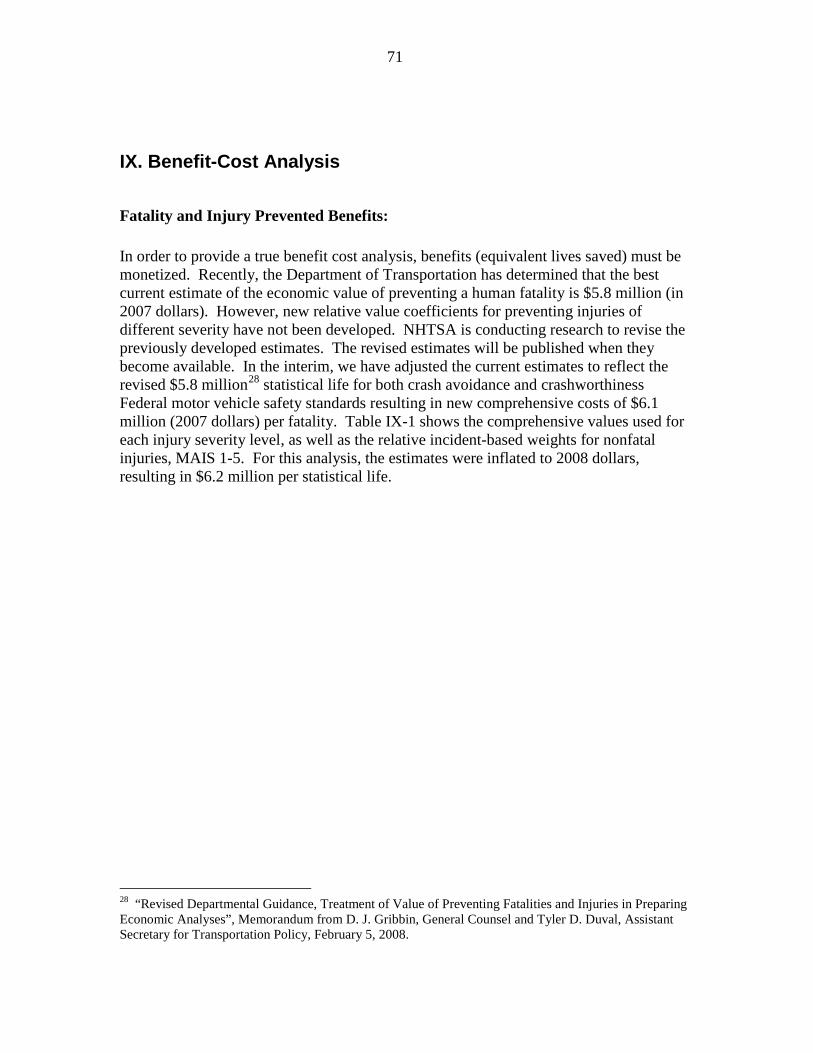
71
IX. Benefit-Cost Analysis
Fatality and Injury Prevented Benefits: In order to provide a true benefit cost analysis, benefits (equivalent lives saved) must be monetized. Recently, the Department of Transportation has determined that the best current estimate of the economic value of preventing a human fatality is $5.8 million (in 2007 dollars). However, new relative value coefficients for preventing injuries of different severity have not been developed. NHTSA is conducting research to revise the previously developed estimates. The revised estimates will be published when they become available. In the interim, we have adjusted the current estimates to reflect the revised $5.8 million28
statistical life for both crash avoidance and crashworthiness Federal motor vehicle safety standards resulting in new comprehensive costs of $6.1 million (2007 dollars) per fatality. Table IX-1 shows the comprehensive values used for each injury severity level, as well as the relative incident-based weights for nonfatal injuries, MAIS 1-5. For this analysis, the estimates were inflated to 2008 dollars, resulting in $6.2 million per statistical life.
28 “Revised Departmental Guidance, Treatment of Value of Preventing Fatalities and Injuries in Preparing Economic Analyses”, Memorandum from D. J. Gribbin, General Counsel and Tyler D. Duval, Assistant Secretary for Transportation Policy, February 5, 2008.
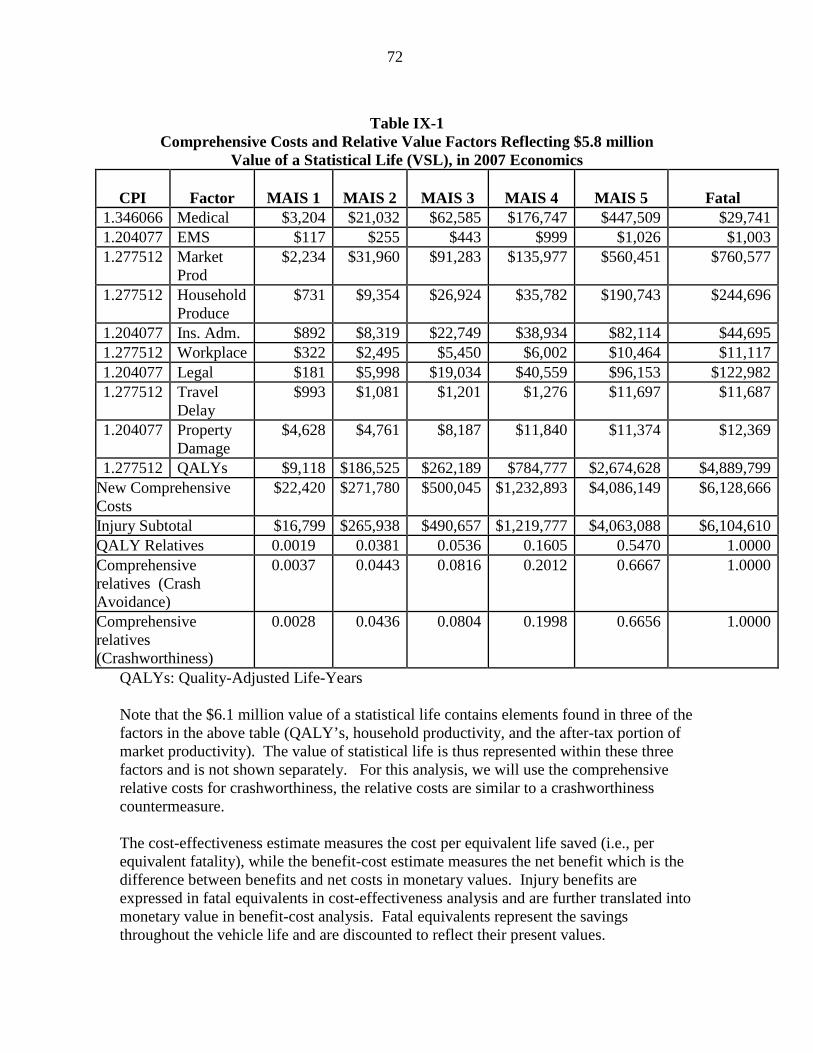
72
Table IX-1
Comprehensive Costs and Relative Value Factors Reflecting $5.8 million Value of a Statistical Life (VSL), in 2007 Economics
CPI
Factor
MAIS 1
MAIS 2
MAIS 3
MAIS 4
MAIS 5
Fatal
1.346066 Medical $3,204 $21,032 $62,585 $176,747 $447,509 $29,741 1.204077 EMS $117 $255 $443 $999 $1,026 $1,003 1.277512 Market
Prod $2,234 $31,960 $91,283 $135,977 $560,451 $760,577
1.277512 Household Produce
$731 $9,354 $26,924 $35,782 $190,743 $244,696
1.204077 Ins. Adm. $892 $8,319 $22,749 $38,934 $82,114 $44,695 1.277512 Workplace $322 $2,495 $5,450 $6,002 $10,464 $11,117 1.204077 Legal $181 $5,998 $19,034 $40,559 $96,153 $122,982 1.277512 Travel
Delay $993 $1,081 $1,201 $1,276 $11,697 $11,687
1.204077 Property Damage
$4,628 $4,761 $8,187 $11,840 $11,374 $12,369
1.277512 QALYs $9,118 $186,525 $262,189 $784,777 $2,674,628 $4,889,799 New Comprehensive Costs
$22,420 $271,780 $500,045 $1,232,893 $4,086,149 $6,128,666
Injury Subtotal $16,799 $265,938 $490,657 $1,219,777 $4,063,088 $6,104,610 QALY Relatives 0.0019 0.0381 0.0536 0.1605 0.5470 1.0000 Comprehensive relatives (Crash Avoidance)
0.0037 0.0443 0.0816 0.2012 0.6667 1.0000
Comprehensive relatives (Crashworthiness)
0.0028 0.0436 0.0804 0.1998 0.6656 1.0000
QALYs: Quality-Adjusted Life-Years Note that the $6.1 million value of a statistical life contains elements found in three of the factors in the above table (QALY’s, household productivity, and the after-tax portion of market productivity). The value of statistical life is thus represented within these three factors and is not shown separately. For this analysis, we will use the comprehensive relative costs for crashworthiness, the relative costs are similar to a crashworthiness countermeasure. The cost-effectiveness estimate measures the cost per equivalent life saved (i.e., per equivalent fatality), while the benefit-cost estimate measures the net benefit which is the difference between benefits and net costs in monetary values. Injury benefits are expressed in fatal equivalents in cost-effectiveness analysis and are further translated into monetary value in benefit-cost analysis. Fatal equivalents represent the savings throughout the vehicle life and are discounted to reflect their present values.
73
When accounting for the benefits of safety measures, cost savings not included in value of life measurements must also be accounted for. Value of life measurements inherently include a value for lost quality of life plus a valuation of lost material consumption that is represented by measuring consumer’s after-tax lost productivity. In addition to these factors, preventing a motor vehicle fatality will reduce costs for medical care, emergency services, insurance administrative costs, workplace costs, and legal costs. If the countermeasure is one that also prevents a crash from occurring, property damage and travel delay would be prevented as well. The sum of both value of life and economic cost impacts is referred to as the comprehensive cost savings from reducing fatalities. The countermeasures that result from FMVSS No. 208 and 210, affect vehicle crashworthiness and would thus not involve property damage or travel delay. Therefore, the comprehensive cost savings from preventing a fatality for crashworthiness countermeasures is $6.23 in 2008 economics. The basis for the benefit-cost analyses will thus be $6.2 million. For example, if 83 percent lap/shoulder belt use is assumed, multiplying the value of life by the equivalent lives saved derives the total benefits from injuries and fatalities reduced. Subtracting total net costs from the total benefits derives the net benefits. For example, for motorcoaches total benefits discounted at a three percent discount rate, (20.92 x $6.2 million) - $28.0 to 29.4 million = $101.7 – 100.3 million, at the seven percent discount rate (15.97 x $6.2 million) - $27.4 to $28.5 million = $71.6 to $70.5 million. The results for each scenario are summarized in Table IX-2. Positive Net Benefits indicate that Benefits valued at $6.2 million per equivalent life are higher than Net Costs. Negative Net Benefits indicate that Benefits valued at $6.2 million per equivalent life are lower than Net Costs.
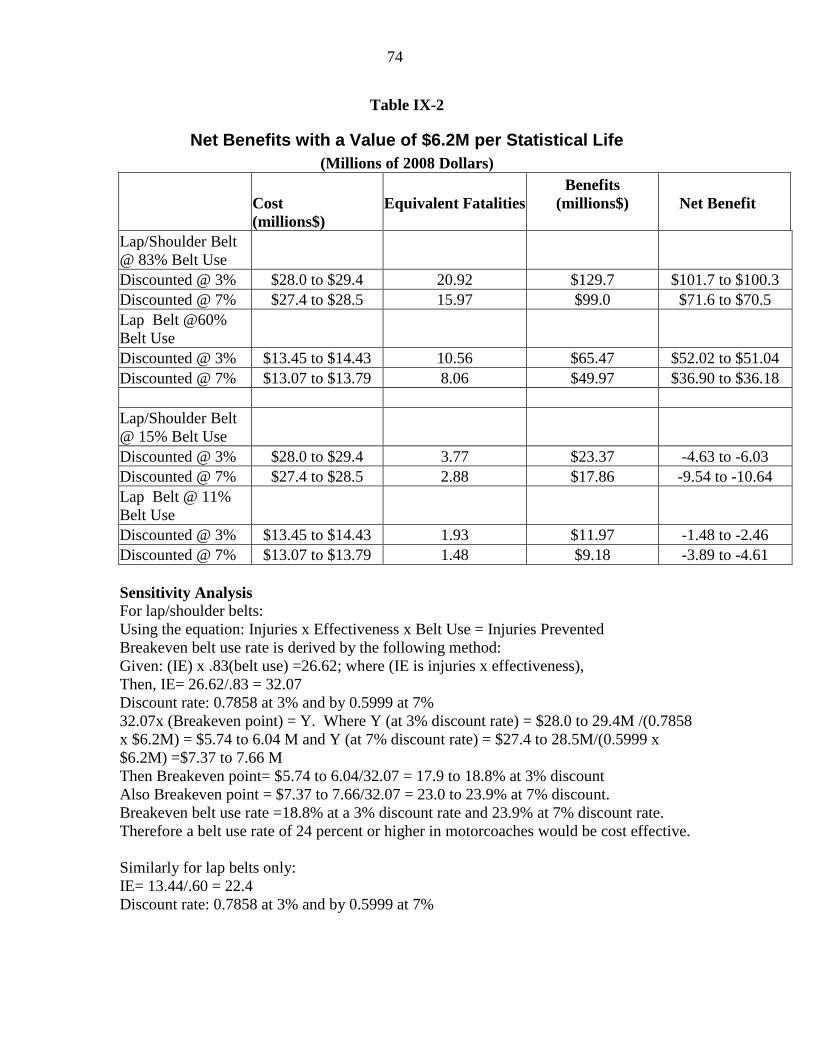
74
Table IX-2
Net Benefits with a Value of $6.2M per Statistical Life (Millions of 2008 Dollars)
Cost (millions$)
Equivalent Fatalities
Benefits (millions$)
Net Benefit
Lap/Shoulder Belt @ 83% Belt Use Discounted @ 3% $28.0 to $29.4 20.92 $129.7 $101.7 to $100.3 Discounted @ 7% $27.4 to $28.5 15.97 $99.0 $71.6 to $70.5 Lap Belt @60% Belt Use Discounted @ 3% $13.45 to $14.43 10.56 $65.47 $52.02 to $51.04 Discounted @ 7% $13.07 to $13.79 8.06 $49.97 $36.90 to $36.18 Lap/Shoulder Belt @ 15% Belt Use Discounted @ 3% $28.0 to $29.4 3.77 $23.37 -4.63 to -6.03 Discounted @ 7% $27.4 to $28.5 2.88 $17.86 -9.54 to -10.64 Lap Belt @ 11% Belt Use Discounted @ 3% $13.45 to $14.43 1.93 $11.97 -1.48 to -2.46 Discounted @ 7% $13.07 to $13.79 1.48 $9.18 -3.89 to -4.61 Sensitivity Analysis For lap/shoulder belts: Using the equation: Injuries x Effectiveness x Belt Use = Injuries Prevented Breakeven belt use rate is derived by the following method: Given: (IE) x .83(belt use) =26.62; where (IE is injuries x effectiveness), Then, IE= 26.62/.83 = 32.07 Discount rate: 0.7858 at 3% and by 0.5999 at 7% 32.07x (Breakeven point) = Y. Where Y (at 3% discount rate) = $28.0 to 29.4M /(0.7858 x $6.2M) = $5.74 to 6.04 M and Y (at 7% discount rate) = $27.4 to 28.5M/(0.5999 x $6.2M) =$7.37 to 7.66 M Then Breakeven point= $5.74 to 6.04/32.07 = 17.9 to 18.8% at 3% discount Also Breakeven point = $7.37 to 7.66/32.07 = 23.0 to 23.9% at 7% discount. Breakeven belt use rate =18.8% at a 3% discount rate and 23.9% at 7% discount rate. Therefore a belt use rate of 24 percent or higher in motorcoaches would be cost effective. Similarly for lap belts only: IE= 13.44/.60 = 22.4 Discount rate: 0.7858 at 3% and by 0.5999 at 7%
75
22.4 x (Breakeven point) = Y. Where Y (at 3% discount rate) = $13.45 to $14.43M / (0.7858 x $6.2M) = $2.76 to $2.96 M and Y (at 7% discount rate) = $13.07 to $13.79M/(0.5999 x $6.2M) =$3.51 to $3.71 M Then Breakeven point= $2.76/22.4 to $2.96/22.4 = 12.3% to 13.2% at 3% discount Also Breakeven point = $3.51/22.4 to $3.71/22.4 = 15.7% to 16.6% at 7% discount. Breakeven belt use rate =13.2% at a 3% discount rate and 16.6% at 7% discount rate. Therefore a belt use rate of 17 percent or higher in motorcoaches would be cost effective. With an estimated breakeven point of 24 percent for lap/shoulder belts and 17 percent for lap belts, the difference in use between the two types of belts systems becomes very important. The agency has found in the rear seat of passenger cars that lap belt use was 71.7 percent of lap/shoulder belt use, as used previously in this analysis. Since 71.7 percent of 24 percent equals 17.2 percent, the cost per equivalent life saved between lap belts and lap/shoulder belts is essentially the same. This is the same conclusion as derived from the results in Table VIII-6.
76
X. ALTERNATIVES The agency has examined an alternative of adding a lap belt only as a substitute for lap/shoulder belts on motorcoaches. Real world data on light vehicles and sled testing with motorcoach seats both show that lap/shoulder belts are more effective than lap belts in reducing injuries and fatalities. Given the cost estimates and effectiveness estimates assumed in this analysis, the cost per equivalent life saved is essentially the same between lap belts and lap/shoulder belts. The breakeven point for lap belt use is 17 percent and for lap/shoulder belt use is 24 percent. However, lap/shoulder belts are used more often than lap belts. The ratio of this difference is essentially the same as was found between lap and lap/shoulder belt usage in the rear seat of passenger cars. Assuming that this relationship would hold for motorcoaches, results in essentially the same cost per equivalent life saved for lap belts as for lap/shoulder belts. The agency also looked at the seat belt and seat anchorage strength requirements of the European Union standard, ECE R.14, and the Australian standard, ADR 68. ECE R.14 requires seat and seat anchorages to withstand a total lap/shoulder belt load of 9,000 N along with a 10 g inertial seat loading for small buses (M2 category 29) and 6.6 g inertial seat loading for large buses (M3 category30
). We estimated that for a 40 kg seat, the total load on the anchorages in an ECE R.14 test is 10,300 N per seating position. In contrast, the total anchorage loads applied in FMVSS No. 210 is about 26,700 N per seating position. The ADR 68 seat and seat belt anchorage test specifies simultaneous application of loading from the belted occupant, the unbelted occupant in the rear and a 20 g inertial seat loading. We estimated that the ADR 68 anchorage test would result in significantly greater anchorage loads than those in the FMVSS No. 210 test. The loads we measured in the simulated 30 mph barrier impact exceeded the loads applied per the EU standards, and the measured loads were close to the FMVSS No. 210 loads so the agency adopted the FMVSS No. 210 requirements. One of the reasons we are proposing higher strength than the EU standard is that we are proposing that the seat anchorages be able to withstand the loads in a 30 mph full frontal rigid barrier crash when the seat is occupied by a belted occupant and when the seat behind is occupied by an unbelted occupant. So the seat anchorages have to withstand loads from the seat belt, the inertial seat loads, and the loading from the occupant behind.
The agency tested two seats that are designed to meet the ECE R.14 requirements for M2 (10 g seats) and M3 buses (6.6 g seats) and both of those seats performed well in the motorcoach 30 mph frontal crash test and sled tests. Theoretically, an alternative analysis would compare the marginal costs and benefits of seats that are designed to just comply with the EU standard to a seat that just complies with our proposal. However, we do not have a seat that is minimally compliant and it is difficult for us to determine how much more safety benefits a seat minimally compliant to FMVSS No. 210 would have over a seat minimally compliant to ECE R.14. Similarly, how much more costly is such a seat
29 M2 category buses have more than eight seating positions and a mass not exceeding 11,023 lbs. 30 M3 category buses have more than eight seating positions and a mass exceeding 11,023 lbs.
77
over the minimally compliant ECE R.14 seat. Data or estimates on both costs and benefits would be needed for a proper marginal cost/benefit analysis. XI. REGULATORY FLEXIBILITY ACT AND UNFUNDED MANDATES REFORM ACT ANALYSIS Regulatory Flexibility Act The Regulatory Flexibility Act of 1980 (5 U.S.C. §601 et seq.) requires agencies to evaluate the potential effects of their proposed and final rules on small businesses, small organizations and small governmental jurisdictions. In compliance with the Regulatory Flexibility Act, 5 U.S.C. 60l et seq., NHTSA has evaluated the effects of this proposed rule on small entities. The head of the agency has certified that this proposed rule will not have a significant economic impact on a substantial number of small entities. The factual basis for the certification (5 U.S.C. 605(b)) is set forth below. Although the agency is not required to issue an initial regulatory flexibility analysis, we discuss below many of the issues that an initial regulatory flexibility analysis would address. Overview of the objectives of and legal basis for the proposed rule This rule is needed to improve the safety of occupants in motorcoaches. The NPRM proposes to require lap/shoulder belts on a number of motorcoaches. Presently a very small percent of the motorcoaches have a lap/shoulder belt. Description and estimate of the number of small entities to which the rule, if made final, will apply; compliance impacts This rule affects motor vehicle manufacturers, motorcoach manufacturers and motorcoach seat manufacturers. Business entities are defined as small businesses using the North American Industry Classification system (NAICS) code, for the purpose of receiving Small Business Administration assistance. One of the criteria for determining size, as stated in 13 CFR 121.201, is the number of employees in the firm. For establishments primarily engaged in manufacturing or assembling automobiles, light and heavy duty trucks, buses, motor homes, new tires, or motor vehicle body manufacturing (NAICS code 336211), the firm must have less than 1,000 employees to be classified as a small business. For supplier establishments manufacturing many of the safety systems, the firm must have less than 750 employees to be classified as a small business. For establishments manufacturing motor vehicle seats and interior trim packages (NAICS code 336360), alterers and second-stage manufacturers, the firm must have less than 500 employees to be classified as a small business. This NPRM directly affects motorcoaches and motorcoach seat manufacturers. There are five motorcoach manufacturers and at least two motorcoach seat manufacturers. The five manufacturers are large businesses (more than 1,000 employees for manufacturers). The two motorcoach seat manufacturers are considered large businesses (more than 500 employees for suppliers).
78
Table X-1 Employment of Motorcoach and Motorcoach Seats Manufacturers
Motorcoach Manufacturers Number of Employees Motorcoach Industries (MCI) 2,300 Prevost 1,337 Van Hool 4,500 Serta (Subsidiary of Daimler) 22,000 BCI Bus and Coach International N/A* Motorcoach Seat Manufacturers IMMI 700 Amaya (Brazil) N/A Notes: The employment number on this company was not listed in Dunn and Bradstreet.
This proposed rule would not have a significant economic impact on a substantial number of small entities that are manufacturers. None of the U.S. motorcoach manufacturers and motorcoach seat manufacturers is a small business. Some of the purchasers of new motorcoaches are small motorcoach operators. However, purchasers of motorcoaches are indirectly affected by this proposal and only those entities directly affected by proposals are required to be addressed in a regulatory flexibility discussion or analysis. The NPRM also discusses, but does not propose, retrofitting existing motorcoaches. If retrofitting became part of the final rule, it would affect motorcoach operators directly. Based on the Motorcoach Census31
, there were 3,137 motorcoach carriers in the United States in 2007. An estimated 78.8 percent (or about 2,470 carriers) have less than 10 motorcoaches in their fleet and average 3 motorcoaches and 11 employees. The small business definition for all transit and ground passenger transportation (subsector 485) and in particular the Charter Bus Industry (NAICS code 485510) is revenue of $7 million. Even though we do not have revenue information for these firms, it is very likely that the majority of these 2,470 carriers are small businesses.
If the agency decides later to propose retrofitting of existing motorcoaches, it would be through a supplemental NPRM. If we issue such an SNPRM, we will assess the impact
31 “Motorcoach Census 2008, A Benchmarking Study of the Size and Activity of the Motorcoach Industry in the United States and Canada in 2007”, December 18, 2008, by Paul Bourquin of Nathan Associates, Inc.
79
of the proposed rule on small entities in accordance with the Regulatory Flexibility Act (5 U.S.C. 601 et seq.) and prepare and publish an initial regulatory flexibility analysis if appropriate. A description of the projected reporting, recording keeping and other compliance requirements of a final rule including an estimate of the classes of small entities which will be subject to the requirement and the type of professional skills necessary for preparation of the report or record. There are no reporting requirements associated with this proposal. An identification, to the extent practicable, of all relevant Federal rules which may duplicate, overlap, or conflict with the final rule. We know of no Federal rules which duplicate, overlap, or conflict with the proposal. A description of any significant alternatives to the final rule which accomplish the stated objectives of applicable statutes and which minimize any significant economic impact of the final rule on small entities. The agency has considered the alternative of requiring lap belts for passengers instead of lap/shoulder belts. Lap belts, while effective against ejection, would provide only a portion of the benefits of passenger frontal crash protection as lap/shoulder belts. For that reason, the agency prefers the alternative of a lap/shoulder belt requirement. The costs and benefits of each alternative is discussed in this document. Because the preferred alternative of lap/shoulder belts would not have a significant economic impact on small entities, there is no alternative that would minimize a significant economic impact on small entities. Retrofit With regard to a retrofit requirement applying to a population of on-road vehicles, NHTSA is seeking information on the potential effects of a retrofit requirement on small businesses, small organizations, and small Government jurisdictions. This PRIA and the NPRM have questions that would assist the agency in analyzing the potential impacts of a retrofit requirement on small businesses. An estimated 78.8 percent of the 3,137 motorcoach carriers in the United States in 2007 (or about 2,470 carriers) have less than 10 motorcoaches in their fleet, and an average of three motorcoaches and eleven employees. The documents request comments on the merits of applying a retrofit requirement to a limited population of on-road vehicles to minimize any significant economic impact on small entities, such as applying a retrofit requirement to only those motorcoaches manufactured after 2010, and/or only to motorcoaches that have seat belt ready passenger seats, etc., and providing extra lead time for the vehicles to be retrofitted. Responses to those questions will assist the agency in deciding whether to proceed with a proposal to require on-road motorcoaches to be retrofitted with seat belts. Comments are requested on the number of small businesses among motorcoach operators (compared to the Small Business Definition of $7 million of revenue per year) and the age of motorcoaches owned by small and large businesses.

80
UNFUNDED MANDATES REFORM ACT. The Unfunded Mandates Reform Act of 1995 (Public Law 104-4) requires agencies to prepare a written assessment of the costs, benefits, and other effects of proposed or final rules that include a Federal mandate likely to result in the expenditures by States, local or tribal governments, in the aggregate, or by the private sector, of more than $100 million annually (adjusted annually for inflation with base year of 1995). Adjusting this amount by the implicit gross domestic product price deflator for the 2008 results in $133 million (122.42/92.106 = 1.33). The assessment may be included in conjunction with other assessments, as it is here. The final rule is not likely to result in expenditures by State, local or tribal governments of more than $133 million annually. The costs of this proposed rule are estimated to be less than $30 million.