Embed Size (px)
Citation preview

FORM 8-K
FMC TECHNOLOGIES INC
(Current report filing)
Filed 9/1/2006 For Period Ending 9/1/2006
Address 1803 GEARS ROAD
HOUSTON, Texas 77067
Telephone 281-591-4000
CIK 0001135152
Industry Oil Well Services & Equipment
Sector Energy
Fiscal Year 12/31

UNITED STATES
SECURITIES AND EXCHANGE COMMISSION
Washington, D.C. 20549
FORM 8-K
CURRENT REPORT
Pursuant to Section 13 or 15 (d) of the Securities Exchange Act of 1934
Date of Report (Date of earliest event reported)
September 1, 2006
FMC TECHNOLOGIES, INC. (Exact name of registrant as specified in its charter)
1803 Gears Road, Houston, TX 77067 (Address of principal executive offices) (Zip Code)
(281) 591-4000 Registrant’s telephone number, including area code
Check the appropriate box below if the Form 8-K filing is intended to simultaneously satisfy the filing obligation of the registrant under any of the following provisions:
Delaware 1-16489 36-4412642 (State or other jurisdiction
of incorporation) (Commission File Number)
(I.R.S. Employer
Identification No.)
� Written communications pursuant to Rule 425 under the Securities Act (17 CFR 230.425)
� Soliciting material pursuant to Rule 14a-12 under the Exchange Act (17 CFR 240.14a-12)
� Pre-commencement communications pursuant to Rule 14d-2(b) under the Exchange Act (17 CFR 240.14d-2(b))
� Pre-commencement communications pursuant to Rule 13e-4(c) under the Exchange Act (17 CFR 240.13e-4(c))

SECTION 7 – Regulation FD
ITEM 7.01 REGULATION FD DISCLOSURE.
Joseph H. Netherland, Chairman and Chief Executive Officer of FMC Technologies, Inc., and William H. Schumann, III, Senior Vice President and Chief Financial Officer of FMC Technologies, Inc., will make a presentation at the Lehman Brothers CEO Energy/Power Conference in New York, New York on Tuesday, September 5, 2006.
Slides containing information to be presented at this conference are attached hereto as an exhibit to this report and are incorporated herein in their entirety by this reference. These slides may also be accessed at the Company’s website ( www.fmctechnologies.com ). This information is being furnished under Item 7.01 of Form 8-K and is not deemed “filed” for purposes of Section 18 of the Securities Exchange Act of 1934, as amended, is not subject to the liabilities of that section and is not deemed incorporated by reference in any filing under the Securities Act of 1933, as amended. The posting and furnishing of this information is not intended to, and does not, constitute a determination by FMC Technologies, Inc. that the information is material or that investors should consider this information before deciding to buy or sell FMC Technologies, Inc. securities.
SECTION 9 – Financial Statements and Exhibits
ITEM 9.01 FINANCIAL STATEMENTS AND EXHIBITS.
(c) Exhibits:
99.1 Slides for the FMC Technologies, Inc. presentation on September 5, 2006

SIGNATURE
Pursuant to the requirements of the Securities Exchange Act of 1934, the Registrant has duly caused this report to be signed on its behalf by the undersigned thereunto duly authorized.
Date: September 1, 2006
FMC TECHNOLOGIES, INC.
By: /s/ William H. Schumann, III Senior Vice President and Chief Financial Officer
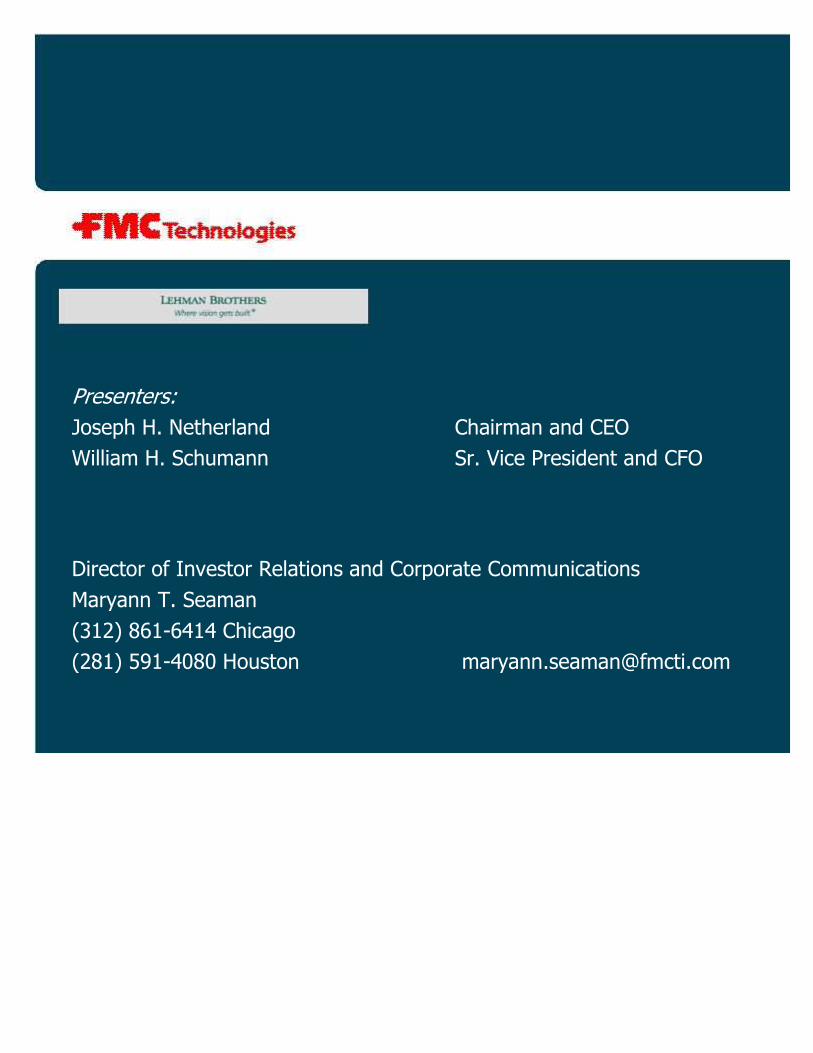
Director of Investor Relations and Corporate Communications
Maryann T. Seaman
(312) 861-6414 Chicago
(281) 591-4080 Houston [email protected]
Presenters:
Joseph H. Netherland Chairman and CEO
William H. Schumann Sr. Vice President and CFO
These slides and the accompanying presentation contain “forward-looking”
which represent management’s best judgment as of the date hereof, based on currently
available information. Actual results may differ materially from those contained in such
forward-looking statements.
The Company’s periodic reports filed under the Securities Exchange Act of 1934 include
information concerning factors that may cause actual results to differ from those
anticipated by these forward-looking statements. The Company undertakes no obligation
to update or revise these forward-looking statements to reflect new events or
uncertainties.
Although the Company reports its results using GAAP, the Company uses non
measures when management believes those measures provide useful information for its
stockholders.
The Appendices to this presentation provide reconciliations to GAAP for any non
measures referenced in today’s presentation.

• Citrus Extractors
• Freezing Systems
• Food Processing
Systems
• Loaders
• Deicers
• Boarding
Bridges
• RampSnake
• Subsea Trees
• Surface Wellheads
• Manifolds
• Control Systems
• Floating Production
Systems
• Separation Systems
• Fluid Control
• Loading Systems
• Measurement Solutions
FMC Technologies at a Glance 2005 Revenue: $3.2 Billion
FoodTech 17 %
Airport Systems
10 %
Energy Systems
73 %

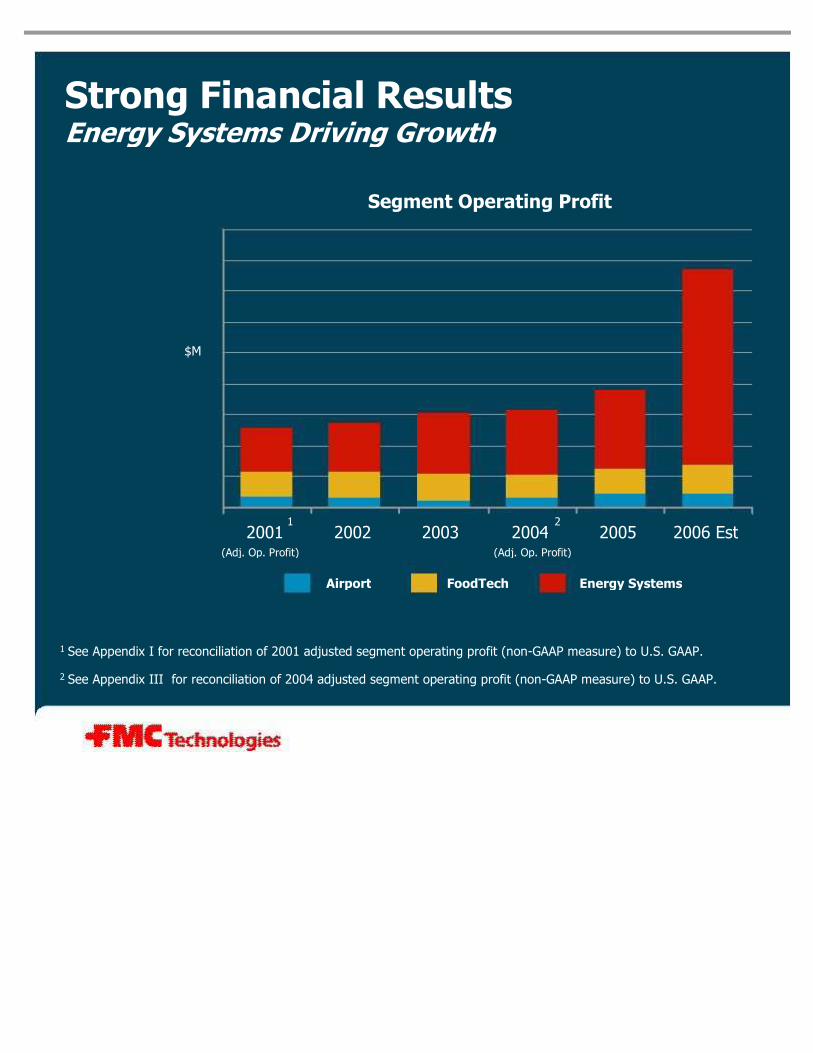
Strong Financial Results Energy Systems Driving Growth
1 See Appendix I for reconciliation of 2001 adjusted segment operating profit (non-GAAP measure) to U.S. GAAP.
2 See Appendix III for reconciliation of 2004 adjusted segment operating profit (non-GAAP measure) to U.S. GAAP.
2001 2002 2003 2004 2005 2006 Est
Segment Operating Profit
(Adj. Op. Profit) (Adj. Op. Profit)
Airport FoodTech Energy Systems
1 2
$M
2001 2002 2003 2004 2005 2006 Est
Strong Financial Results Energy Systems Driving Growth
Segment Operating Profit
(Adj. Op. Profit) (Adj. Op. Profit)
Airport FoodTech Energy Systems
1 2
$M
1 See Appendix I for reconciliation of 2001 adjusted segment operating profit (non-GAAP measure) to U.S. GAAP.
2 See Appendix III for reconciliation of 2004 adjusted segment operating profit (non-GAAP measure) to U.S. GAAP.

$0.77
$1.03
$1.25
$1.54
$2.95 - $3.15
$0.87
$0.00
$0.50
$1.00
$1.50
$2.00
$2.50
$3.00
$3.50
2001 2002 2003 2004 2005 2006 Est
Strong Financial Results Income Continuing Upward Trend
Adjusted Income per Diluted Share
(Adjusted Income) (Adjusted Income)
1 2
1 See Appendix II for reconciliation of 2001 adjusted income per diluted share (non-GAAP measure) to U.S. GAAP.
2 See Appendix IV for reconciliation of 2004 and 2005 adjusted income per diluted share (non-GAAP measure) to U.S. GAAP.
3 Excludes income of $0.03 per diluted share from the sale of trademarks related to discontinued operations.
2
(Adjusted Income)
3
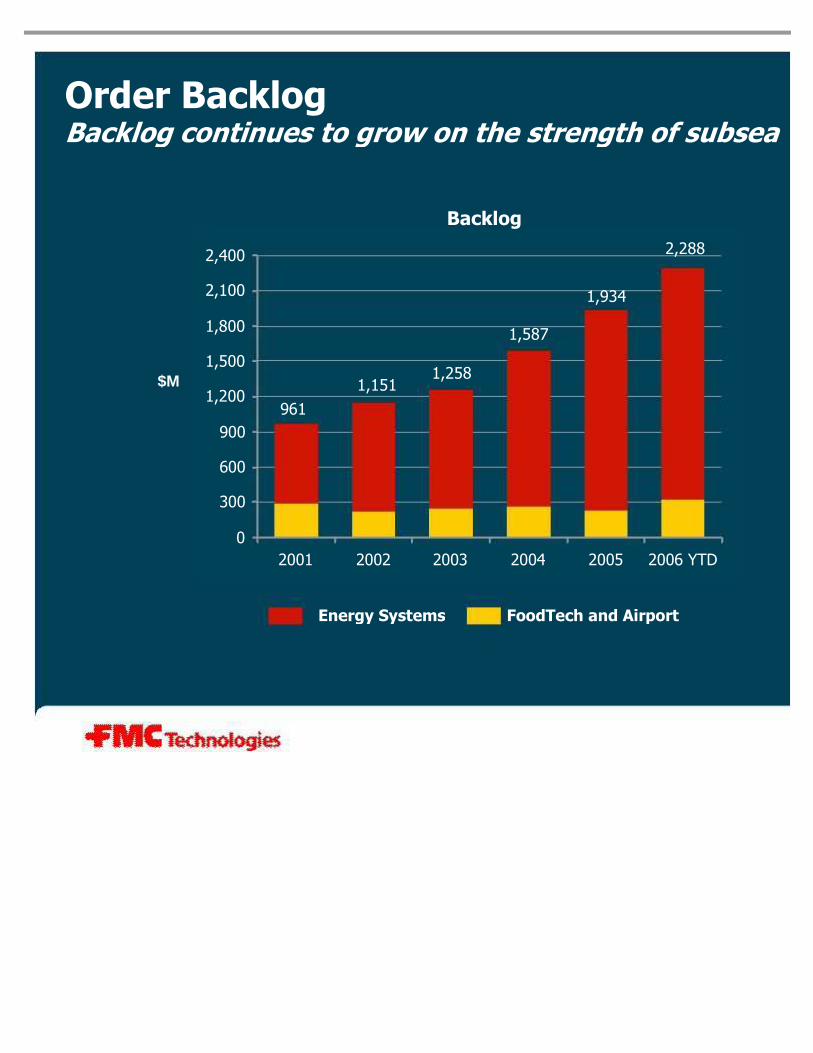
Order Backlog Backlog continues to grow on the strength of subsea
0
300
600
900
1,200
1,500
1,800
2,100
2,400
2001 2002 2003 2004 2005 2006 YTD
Backlog
$M
961
Energy Systems FoodTech and Airport
1,151 1,258
1,587
1,934
2,288
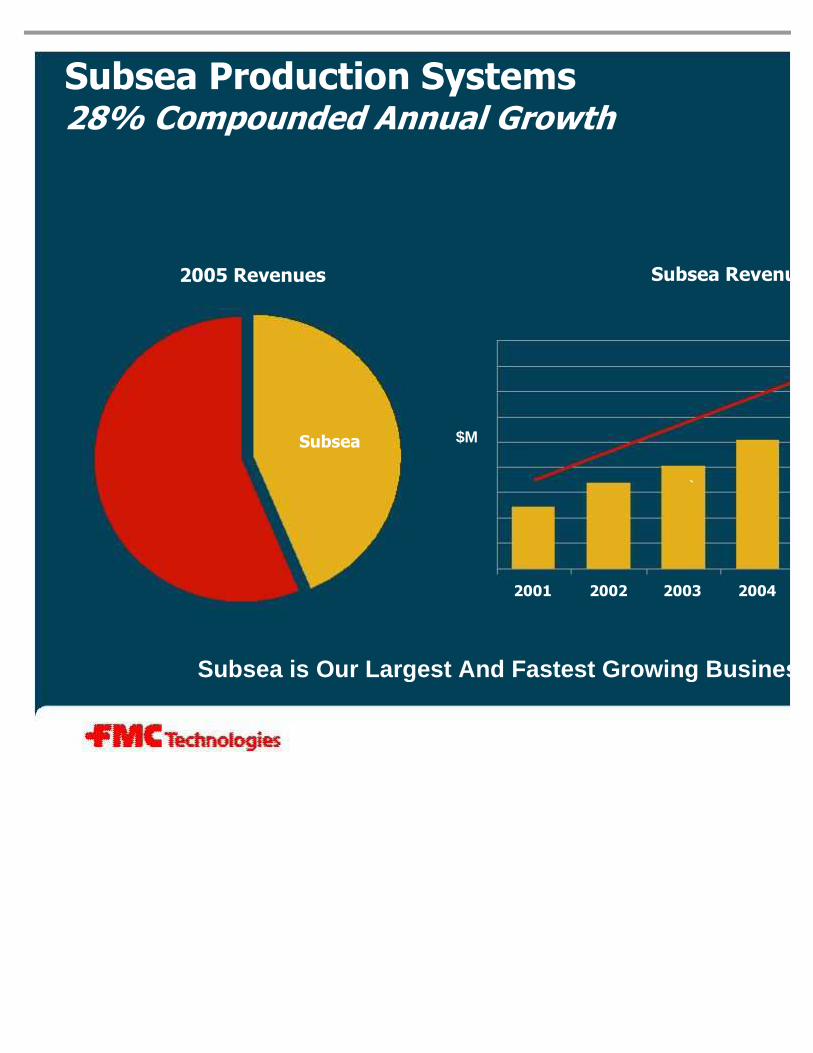
2001 2002 2003 2004
`
Subsea Production Systems 28% Compounded Annual Growth
Subsea $M
2005 Revenues Subsea Revenue
Subsea is Our Largest And Fastest Growing Business

38% 39%
47%
41%
23%
38%
0%
5%
10%
15%
20%
25%
30%
35%
40%
45%
50%
2001 2002 2003 2004 2005 2006
YTD
Vetco
Gray
19%
FTI
38%
2001-Q2 2006 Unit Market Share*
Unit Market Share
Subsea Tree*
Subsea Production Systems Maintaining Leading Share
*Source: Quest Offshore Resources July 2006
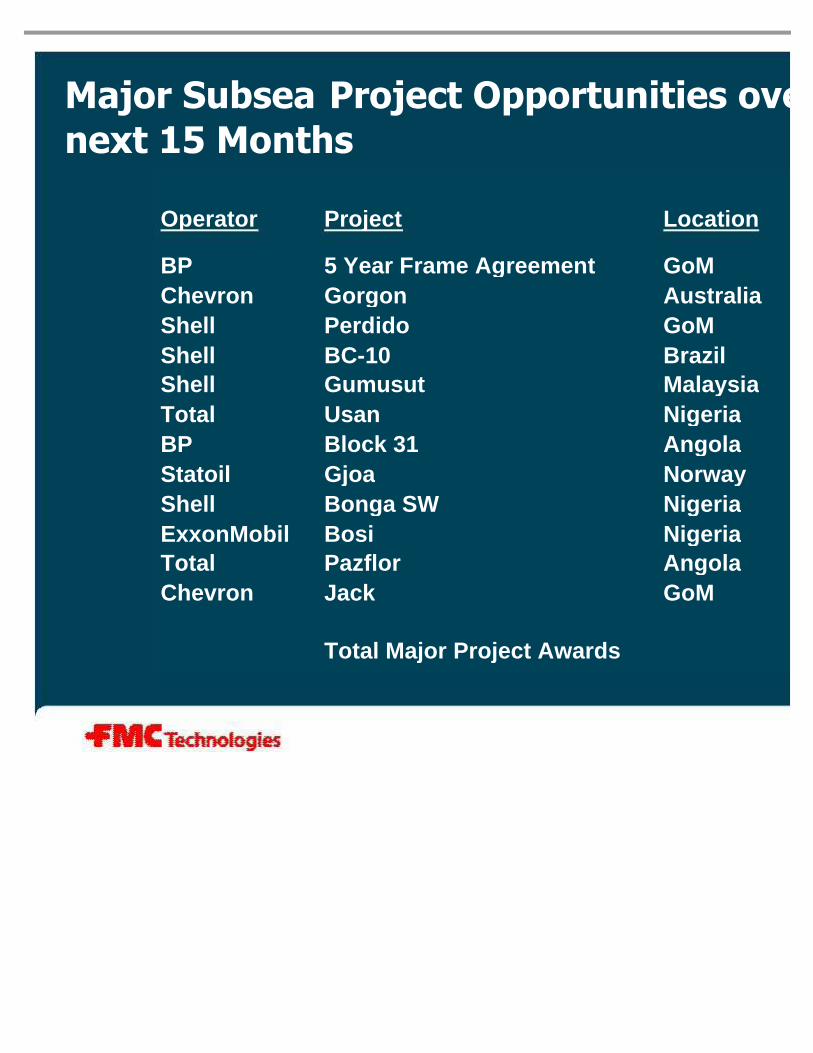
Major Subsea Project Opportunities over the
next 15 Months
Operator Project Location
BP 5 Year Frame Agreement GoM Chevron Gorgon Australia Shell Perdido GoM Shell BC-10 Brazil Shell Gumusut Malaysia Total Usan Nigeria BP Block 31 Angola Statoil Gjoa Norway Shell Bonga SW Nigeria ExxonMobil Bosi Nigeria Total Pazflor Angola Chevron Jack GoM
Total Major Project Awards

0
100
200
300
400
500
600
2004 2005 2006 2007
0
50
100
150
200
250
300
350
2004 2005 2006 2007 - 2008
Global Subsea Tree Installations*
FTI Manufacturing Capacity
FoodTech
Energy
Production
Systems Energy
Processing
Airport
Capacity Increases to Meet Tree Demand
$110 - $120 million
Capital Spending Projections for 2006
*Source: Quest Offshore Resources Inc. May 2006
Units
Units

Growing the Energy Franchise
• Expanding the subsea franchise
• Growing other energy businesses

Subsea Processing
Light Well Intervention
Expanding the Subsea Franchise
Subsea Separation Gas Compression

Subsea Processing
Light Well Intervention
Expanding the Subsea Franchise
Subsea Separation Gas Compression

Light Well Intervention Increased Oil Recovery
• Began 6-yr contract with Statoil
• Developing riserless light well intervention experience in the North Sea’s Norwegian sector
• Easier, low-cost access to subsea wells should allow enhanced recovery rates to approach the 57% seen on platform wells in the region

Tordis Subsea Separation Project Award
• Statoil awarded contract to FTI worth approximately $100M for the delivery of a subsea separation and boosting system for their TORDIS field in the North Sea
• First adoption of a full-scale subsea separation facility
• Subsea separation technology is expected to increase Statoilrecovery by approximately 19 million extra barrels on their TORDIS field
– Deployment beginning with the installation of a pipeline inline manifold in the
summer of 2006
– Completion planned for summer of 2007 with the installation of separation, boosting, and injection systems
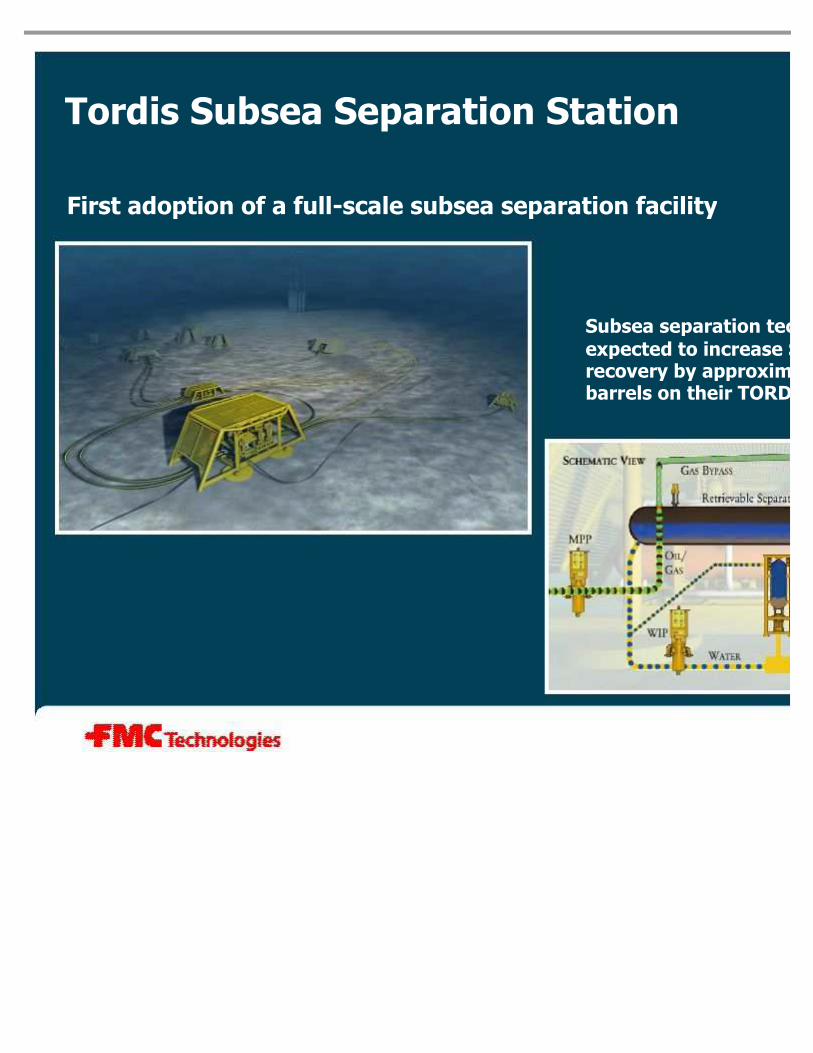
Tordis Subsea Separation Station
First adoption of a full-scale subsea separation facility
Subsea separation technology is
expected to increase Statoilrecovery by approximately 19 million barrels on their TORDIS field

Subsea Gas Compressor
• Simple and robust design – seal -less design – magnetic bearings – no gearbox
• Suitable for large pressure ratio and volume flow.

Surface Wellhead Strategic Acquisition Thermal Wellhead Product Line for Oil Sands
• Purchased assets of Galaxy Oilfield Services
• Supply specialty wellhead equipment for production of oil sands and heavy oil – Unique high temperature technology
– Market leader in Canada
– Strong customer relationships
• Synergies with FMC include – Facilities in Edmonton and Cold Lake, Alberta
– Integration with current FMC Canada business will double Canadian presence
– Replacement of FTI gates valves currently sourced from other suppliers
– International distribution
– World wide sourcing
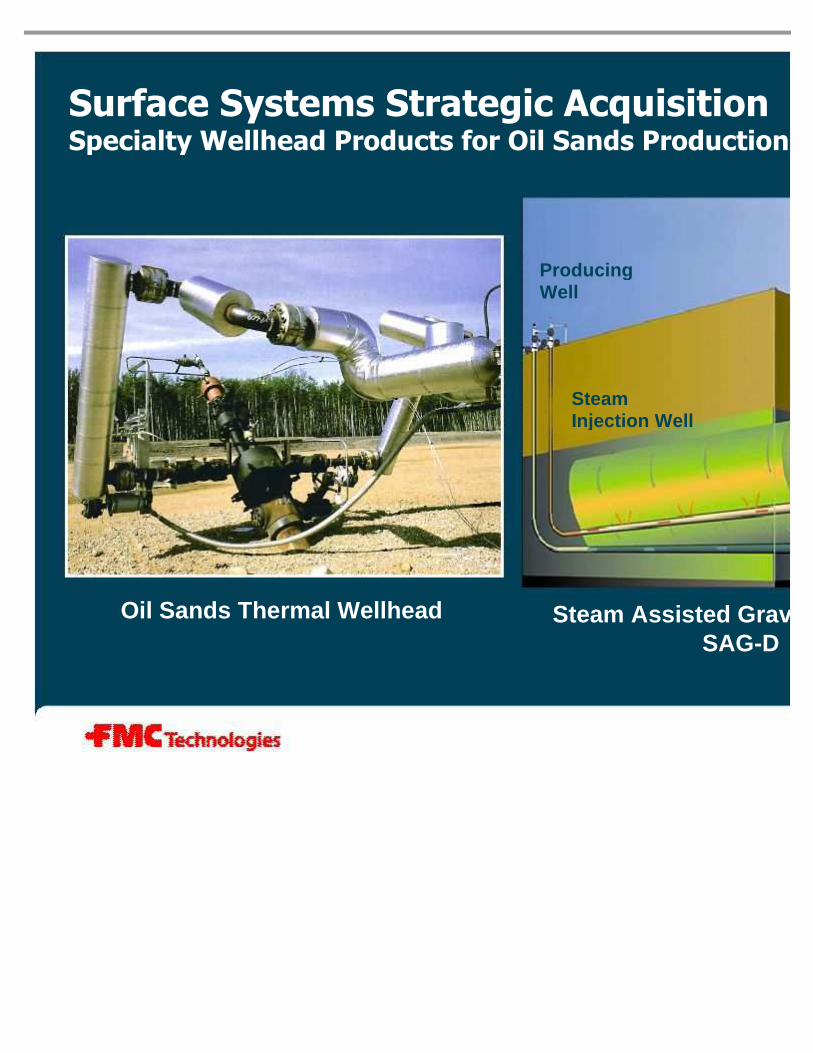
Surface Systems Strategic Acquisition Specialty Wellhead Products for Oil Sands Production
Oil Sands Thermal Wellhead Steam Assisted Gravity Drainage SAG-D
Producing Well
Steam Injection Well

Well Service Pumps Expanding the Energy Franchise
• Well service pump product introduction in January 2007 as part of FMC’s Fluid Control business
• Two pump models under development with maximum ratings of 2700 hp (Quintuplex) and 2400 hp (Triplex)
• Estimating incremental revenue in the range of $20 - $25

0%
2%
4%
6%
8%
10%
12%
14%
2001 2002 2003
FMC Technologies OSX
$301
$245
$203
$193
$39
$103
$37
$66
$69
0
50
100
150
200
250
300
350
400
1/1/01 12/31/01 12/31/02 12/31/03 12/31/04 12/31/05
Net Debt After-Tax Return on Investment
$0.77 $0.87
$1.03
$0.00
$0.20
$0.40
$0.60
$0.80
$1.00
$1.20
$1.40
$1.60
$1.80
2001 2002 2003
Adjusted Income per Share
$1.9
$2.1 $2.3
$2.8
$3.2
$0.0
$0.5
$1.0
$1.5
$2.0
$2.5
$3.0
$3.5
2001 2002 2003 2004 2005
$B
Revenue
Financial Highlights
(Adjusted Income) (Adjusted Income)
1
Synthetic Leases
Debt Net of Cash
1 See Appendix II for reconciliation of 2001 adjusted income per diluted share (non-GAAP measure) to U.S. GAAP. 2 See Appendix IV for reconciliation of 2004 and 2005 adjusted income per diluted share (non-GAAP measure) to U.S. GAAP. 3 At January 1, 2001, debt, net of cash is presented on a pro forma basis as defined in the Separation and Distribution Agreement with FMC Corporation. 4 Return on Investment (ROI) is calculated as income before the cumulative effect of changes in accounting principles plus after-tax interest expense as a percentage of total average debt and equity. The calculations of 2001, 2004 and 2005 ROI use adjusted income which is a non-GAAP measure. See Appendices I, III and V.
$M 3

In Summary
• Strong and Growing Subsea Franchise
• Expanding the Subsea Franchise
– Light Well Intervention
– Subsea Separation
– Gas Compression
• Growing Other Energy Business
– Well Service Pumps
– Thermal Wellhead for Oil Sands
• Strong Balance Sheet
An Oilfield Services Company with

Appendices

Appendix I Reconciliation of Non-GAAP measures (as required by Regulation G) (In millions)
Adjusted income before the cumulative effect of a change in accounting principle (non-GAAP measure)
Less: Pro forma interest expense, net of income taxes
Add back: Income tax charges related to the separation from FMC Corporation
Add back: Restructuring and asset impairment charges, net of income taxes
Income before the cumulative effect of a change in accounting principle (GAAP measure)
Adjusted segment operating profit (non-GAAP measure)
Add back: Restructuring and asset impairment charges
Segment operating profit (GAAP measure)

Q1 2001* Q2 2001* Q3 2001 Q4 2001 Income per diluted share before cumulative effect o f a change in accounting principle (GAAP measure) (0.06) $ 0.15 $ 0.15 $ $
Less: Pro forma incremental interest expense (0.04) (0.03) -
Add back: Restructuring and asset impairment charges 0.10 - 0.06 Income taxes related to separation from FMC 0.05 0.06 0.02
Other 0.01 0.01 -
Adjusted income per diluted share (non -GAAP measure) 0.06 $ 0.19 $ 0.23 $ $
Appendix II Reconciliation of Non-GAAP measures (as required by Regulation G)
*Results relating to periods prior to June 1, 2001 were carved out from the consolidated financial statements of FMC Corporation.
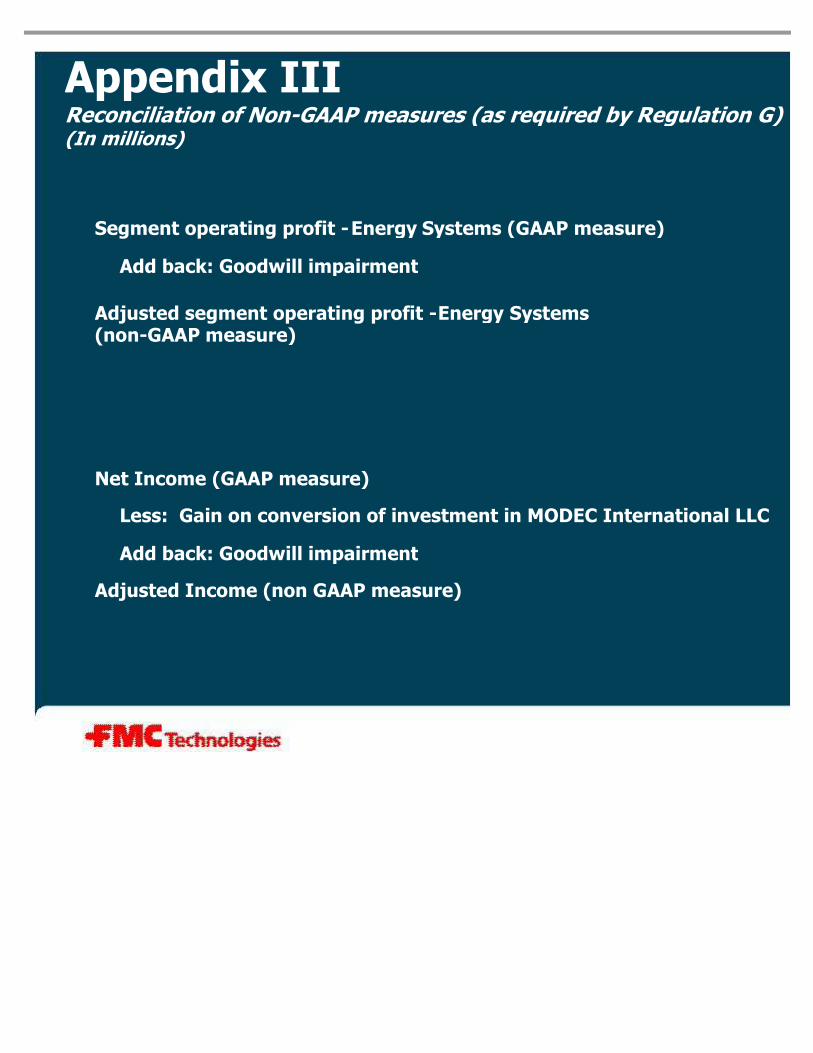
Appendix III Reconciliation of Non-GAAP measures (as required by Regulation G) (In millions)
Net Income (GAAP measure)
Less: Gain on conversion of investment in MODEC International LLC
Add back: Goodwill impairment
Adjusted segment operating profit -Energy Systems (non-GAAP measure)
Adjusted Income (non GAAP measure)
Add back: Goodwill impairment
Segment operating profit -Energy Systems (GAAP measure)

Appendix IV Reconciliation of Non-GAAP measures (as required by Regulation G)
$ 0.43 $ 0.42 $ 0.00 Adjusted income per diluted share (non-GAAP measure)
---Plus: Tax expense – American Jobs Creation Act
(0.22) --Less: Gain on disposal of investments
$ 0.65 $ 0.42 $ 0.00 Income per diluted share (GAAP measure)
Q3 2005 Q2 2005 Q1 2005 2005
$ 0.32 $ 0.35 $ 0.20 Adjusted income per diluted share (non-GAAP measure)
---Plus: Goodwill impairment
---Less: Gain on conversion of investment in MODEC International LLC
$ 0.32 $ 0.35 $ 0.20 Income per diluted share (GAAP measure)
Q3 2004 Q2 2004 Q1 2004 2004

Appendix V Reconciliation of Non-GAAP measures (as required by Regulation G) (In millions)
Less: Gain on disposal of investments, net of income taxes
Net Income, net of income taxes (GAAP measure)
Plus: Tax expense – American Jobs Creation Act
Adjusted Income (non-GAAP measure)