Embed Size (px)
Citation preview

FLYWHEELFLYWHEEL--BASED FREQUENCY REGULATION BASED FREQUENCY REGULATION DEMONSTRATION PROJECTS STATUSDEMONSTRATION PROJECTS STATUS
Matt LazarewiczMatt LazarewiczJim ArseneauxJim Arseneaux
October 17October 17--19, 2005 San Francisco, C19, 2005 San Francisco, CAA

ACKNOWLEDGMENTSACKNOWLEDGMENTS
• Funded in part by the Energy Storage Systems Program of the U.S. Department Of Energy (DOE/ESS) through Sandia National Laboratories (SNL).

Topics of DiscussionTopics of Discussion
• What is Frequency Regulation (FR)?• Flywheel Characteristics for FR• CEC/DOE and NYSERDA/DOE Projects• Demonstration System Description • Initial Performance Status• The Future

Typical “Regulation” Profile
Short term variation• ~ +/-1% to 2% of daily load• Managed via regulation• Fluctuation is net zero • Well suited for energy storage
and recycling• Typical 100-1000MW
per control area
ISO Goal:Load = Power GeneratedPower < Load:– Frequency drops under 60 Hz.Power > Load:– Frequency rises over 60 Hz.
timetime
GW
GW
GW
GW

Frequency Regulation BasicsFrequency Regulation BasicsFlash presentation at www.beaconpower.com

Trends in Wind DeploymentTrends in Wind Deployment
• Today, 1% of power is from wind
• By 2020, 6% will be wind generated, driven by state Renewable Portfolio Standards
• Wind introduces power fluctuations and intermittencies
• Will require more regulation per MW generated (CAISO has indicated as much as 4x)

Frequency Regulation Market DynamicsFrequency Regulation Market Dynamics
• Deployment of wind, driven by Renewable Portfolio Standards, will increase demand
• Older fossil fuel-powered plants, frequently used for regulation, are being taken out of service
• Emission regulations add equipment that reduces frequency regulation capability
Regulationdemand
increasing
Regulationsupply
decreasingwhile…
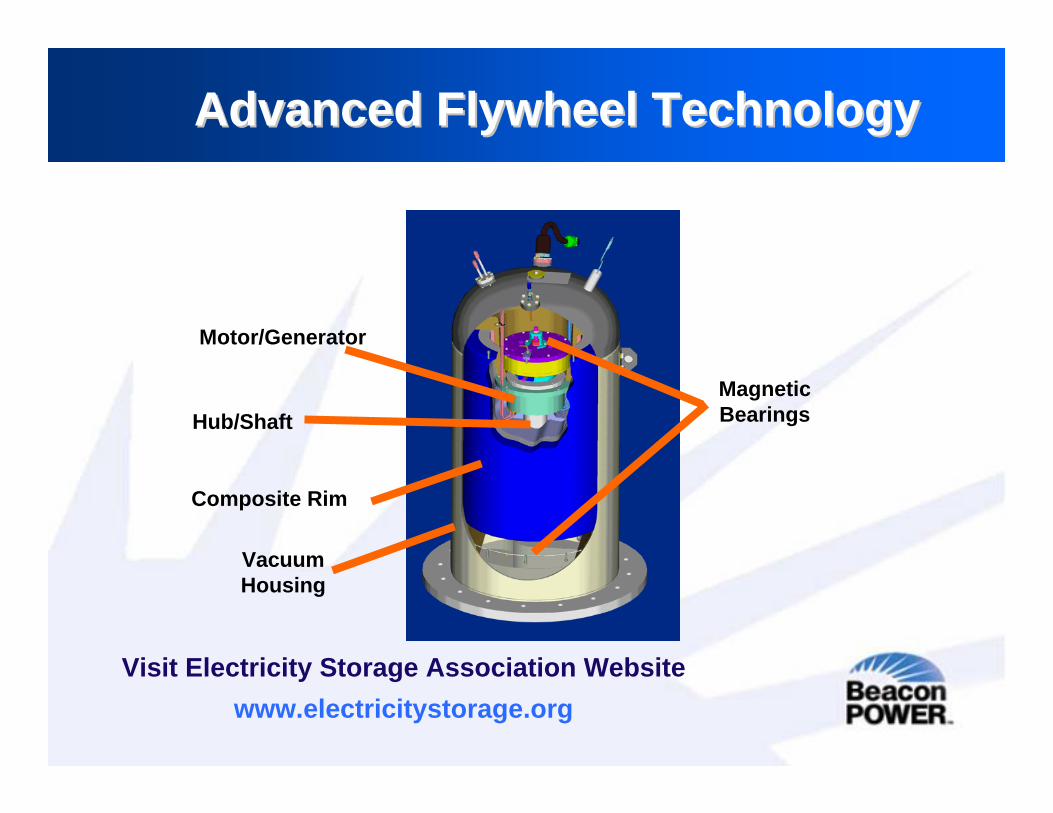
Advanced Flywheel TechnologyAdvanced Flywheel Technology
Visit Electricity Storage Association Websitewww.electricitystorage.org
Composite Rim
Magnetic BearingsHub/Shaft
VacuumHousing
Motor/Generator

Critical Design DriversCritical Design Drivers
• Output Power (Motor)• Hold-up Time (Stored Energy)• Input/output Voltage• Cyclic Life
– Quantity (Total) – Depth of Discharge– Frequency
• Continuous vs. Intermittent Duty Cycle• Physical Size & Weight• Environmental
– Temperature/Humidity– Vibration (Normal Operation)

BeaconBeacon’’s Product Evolutions Product Evolution
2kWh1 kW
2000
6kWh2 kW
2001
25kWh100 kW
2007
6kWh15 kW
2005• Telecom applications• Over 500,000 hours of
operation
• 100kW demonstration unit • 1 MW SEM
commercial unit
20062004

The Beacon Solution to Freq RegulationThe Beacon Solution to Freq Regulation
• Ten 25 kWh flywheels / 1 MW of regulation
• Fast response
• High reliability
• Competitive capital cost
• Lowest operational cost
• 20-year life
• Very low maintenance
• Sustainable advantages
• Emission-free, clean technology
Smart Energy Matrix(13,000lb of composites)

Demonstration Projects Under Contract
• California Energy Commission/DOE– 100 kW version of SEM using modified existing flywheels– DUIT facility (PG&E Substation R&D facility) in San Ramon, CA– Team with Connected Energy for communications
• NYSERDA/DOE– 100 kW version of SEM using modified existing flywheels– Power & Composite Technologies (Industrial Site), Amsterdam NY– Team with Connected Energy for communications
• NYSERDA – Universal Grid Interconnect Device Study for DG “Green Box”– Team with Connected Energy– Interface between grid and DG assets– Scaled lab demonstration

DUIT Facility in San Ramon, CADUIT Facility in San Ramon, CA
Unloaded from Truck 9/21 7AM Connected to Grid 9/21 11AMCheck out communications 9/22Weekend 9/23-25System checkout 9/26All flywheels at speed 9/27
Very fast, easy installation
Beacon’s Smart Energy Location

PCT plant in Amsterdam, NYPCT plant in Amsterdam, NY
• Delivery 4th qtr 2005• Installation in “Distribution
Cloud”• Demonstrate low cost
communication with ISO• Reactive Power testing
included in plan• Evaluate using line
frequency as regulation signal
Planned locationof Beacon FlywheelSystem

Objectives of Demonstration Projects Objectives of Demonstration Projects
– Proof of concept on ~1/10th power scale– Show ability to follow fast changing Frequency
Regulation signals– Demonstrate anti-islanding– Validate interconnection capability– Demonstrate performance & economic value– Develop and demonstrate communications with
grid operators– Collect data for product specifications– Gain industry confidence– Report results to the industry
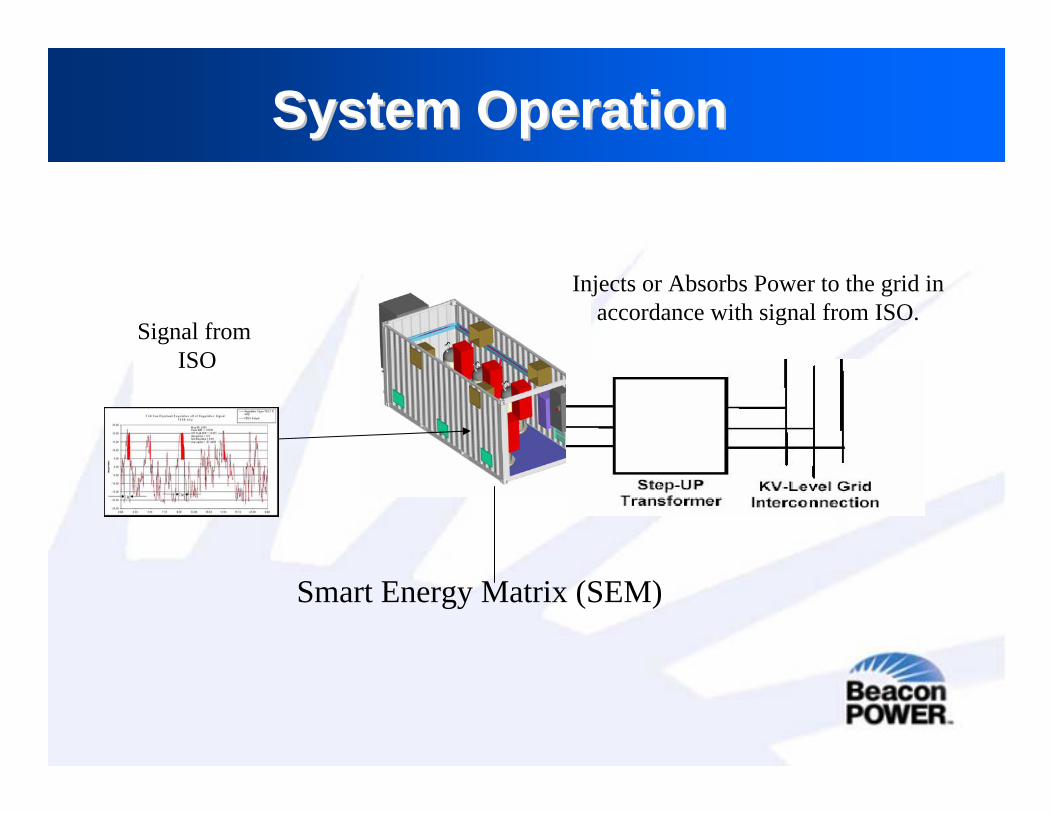
System OperationSystem Operation
Smart Energy Matrix (SEM)
Signal from ISO
Injects or Absorbs Power to the grid in accordance with signal from ISO.

Demo SchematicDemo Schematic
Flywheels
15 kW Bi-directional Inverters
-Chiller-Power for M.C.-Lights

Outside view of SystemOutside view of System

Inside view of systemInside view of system
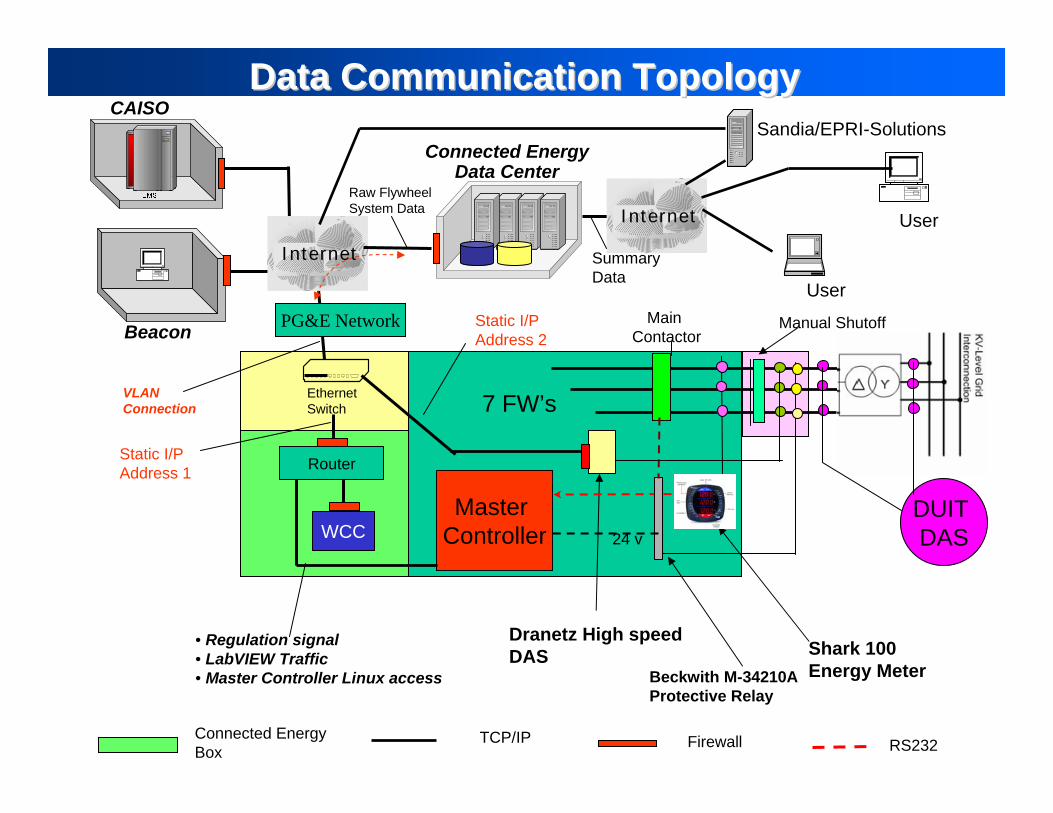
Data Communication TopologyData Communication Topology
TCP/IP RS232
WCC
Router
Internet
Internet
Connected EnergyData Center
VLANConnection
Sandia/EPRI-Solutions
User
User
Shark 100 Energy Meter
CAISO
• Regulation signal• LabVIEW Traffic• Master Controller Linux access
Beacon
Master Controller
Firewall
Dranetz High speed DAS
Beckwith M-34210A Protective Relay
Static I/P Address 1
Static I/P Address 2
Manual ShutoffMain Contactor
Connected Energy Box
24 v
7 FW’sEthernetSwitch
DUIT DAS
Summary Data
Raw FlywheelSystem Data
PG&E Network

System Graphical User InterfaceSystem Graphical User Interface
Remote Monitoring Remote Monitoring and Control of and Control of Flywheel and Flywheel and System Parameters System Parameters

Preliminary Demo Performance DataPreliminary Demo Performance Data100kW Acceptance Test Signal
-120
-100
-80
-60
-40
-20
0
20
40
60
80
100
120
0.00 10.00 20.00 30.00 40.00 50.00 60.00
Time (Minutes)
Reg
Sig
nal ~
kW
's
-130
-110
-90
-70
-50
-30
-10
10
30
50
70
90
110
Net
Pow
er ~
kW
's
Signal
Actual
Step Changes
Full ChargeLoad Bank comes on
Zero Reg Signal
~CAISO ACE Charge to full speed
Full Discharge
Set Point = -10 kWMax Reg = 100 kWFlywheels start @ 19,000 RPM
Zero Net
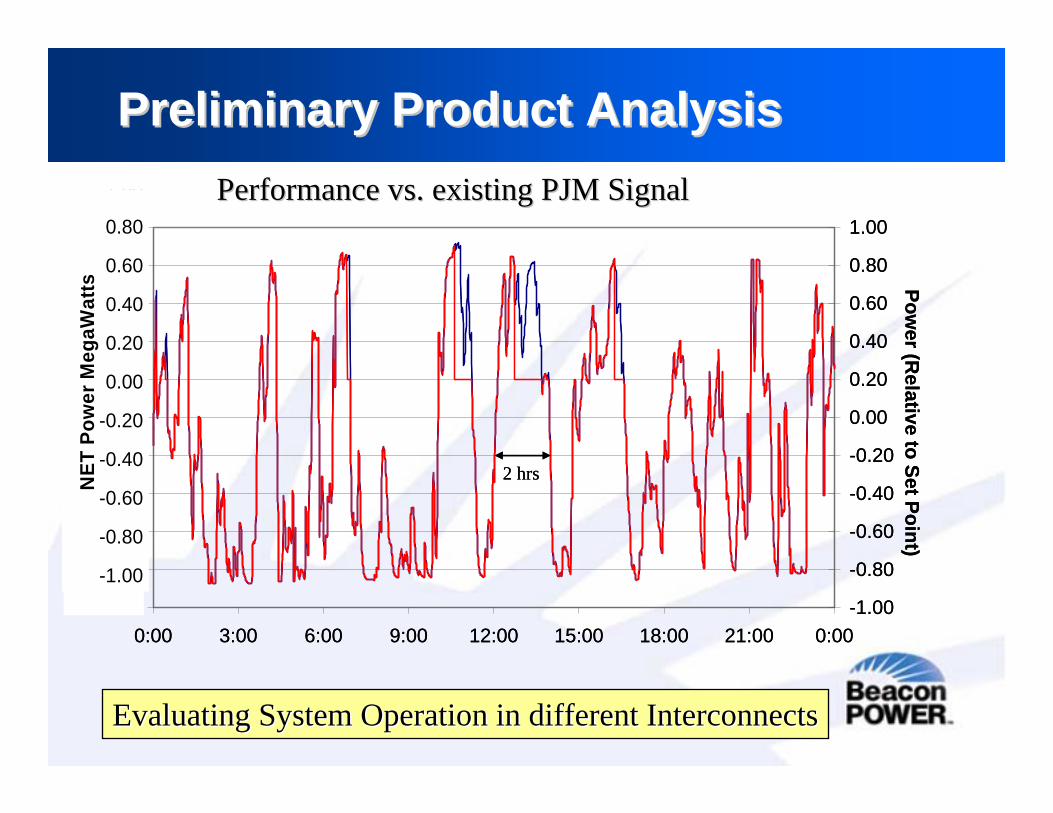
Preliminary Product AnalysisPreliminary Product Analysis
FESS follows this signal 91% of the time
-1.00
-0.80
-0.60
-0.40
-0.20
0.00
0.20
0.40
0.60
0.80
1.00
0:00 3:00 6:00 9:00 12:00 15:00 18:00 21:00 0:00
NET
Pow
er M
egaW
atts
-1.00
-0.80
-0.60
-0.40
-0.20
0.00
0.20
0.40
0.60
0.80
1.00
Power (R
elative to Set Point)
-1.00
-0.80
-0.60
-0.40
-0.20
0.00
0.20
0.40
0.60
0.80
1.00
NET
Pow
er M
egaW
atts
2 hrs
Performance vs. existing PJM SignalPerformance vs. existing PJM Signal
Evaluating System Operation in different InterconnectsEvaluating System Operation in different Interconnects

The FutureThe Future--Flywheels are here to stay!
• Flywheels are an ideal technology for Frequency Regulation
• Frequency Regulation requirements should increase– Renewable Portfolio Standards– Generator assets targeted for retirement are generally today’s
source of lower cost regulation
• New application potentials:– Growth of Distributed Generation will need high cyclic energy
storage capability– Residential renewables should benefit from no-maintenance,
“green”, working energy storage– UPS functions
Join the DUIT tour to see Demo System in operation