Embed Size (px)
Citation preview

ARTICLE IN PRESS
1352-2310/$ - se
doi:10.1016/j.at
�CorrespondE-mail addr
Atmospheric Environment 41 (2007) 5479–5495
www.elsevier.com/locate/atmosenv
Flux estimates and OH reaction potential of reactive biogenicvolatile organic compounds (BVOCs) from a mixed northern
hardwood forest
John Ortegaa, Detlev Helmiga,�, Alex Guentherb, Peter Harleyb,Shelley Pressleyc, Christoph Vogeld
aInstitute of Arctic and Alpine Research, University of Colorado, 1560, 30th St., Boulder, CO 80303, USAbAtmospheric Chemistry Division, National Center for Atmospheric Research, P.O. Box 3000, Boulder, CO 80307, USA
cDepartment of Civil and Environmental Engineering, Washington State University, Pullman, WA 99164-2910, USAdUniversity of Michigan Biological Station, Pellston, MI 49769, USA
Received 29 June 2006; received in revised form 6 December 2006; accepted 6 December 2006
Abstract
Diurnal branch-level emission rates of biogenic volatile organic compounds (BVOC) including isoprene, monoterpenes
(MT), and sesquiterpenes (SQT) were determined at the University of Michigan Biological Station for the tree species red
maple (Acer rubrum), red oak (Quercus rubra), paper birch (Betula papyrifera), white pine (Pinus strobus), and big tooth
aspen (Populus grandidentata). These emission rates were combined with detailed biomass distribution and meteorological
data and incorporated into the canopy model, model of emissions of gasses and aerosols from nature (MEGAN), for
estimating whole-canopy fluxes of isoprene. The modeled half-hour fluxes ðmgCm�2 h�1Þ and cumulative seasonal fluxes
ðmgCm�2Þ compared favorably with results from direct, canopy-level eddy covariance (EC) isoprene measurements;
modeled cumulative seasonal flux deviated less than 30% from the EC results. Significant MT emissions were found from
four of the five tree species. MT emissions from three of these were both light- and temperature-dependent and were
approximately one order of magnitude greater than light-independent MT emissions. SQT emissions were identified from
three of the five tree species. The model was modified to incorporate SQT and both light-dependent and light-independent
MT emissions for determining fluxes. Isoprene comprised 495% of the total terpenoid flux with MT and SQT comprising
4% and 0.3%, respectively. The average cumulative fluxes (in mgCm�2) from June through September were 2490 for
isoprene, 105 for MT, and 7 for SQT. A simple box model analysis was used to estimate the contribution of the isoprene,
MT, and SQT emissions to the total OH reactivity. These results confirm that isoprene dominates OH reactions especially
during daytime hours. Emissions of reactive MT and SQT increase the BVOC+OH reactivity, but are still lower than
estimates of BVOC fluxes at this site necessary for affecting OH reactivity to the significant degree suggested by recent
reports.
r 2007 Elsevier Ltd. All rights reserved.
Keywords: VOC; Oxidant; Monoterpene; Sesquiterpene; Fluxes; Biogenic emission modeling; Isoprene
e front matter r 2007 Elsevier Ltd. All rights reserved.
mosenv.2006.12.033
ing author. Tel.: +1303 492 2509; fax: +1 303 492 6388.
ess: [email protected] (D. Helmig).

ARTICLE IN PRESSJ. Ortega et al. / Atmospheric Environment 41 (2007) 5479–54955480
1. Introduction
The role of biogenic volatile organic compounds(BVOCs) in atmospheric chemistry has been widelydiscussed and summarized (e.g. Fehsenfeld et al.,1992; Fuentes et al., 2000; Monson and Holland,2001). In addition to their role in troposphericozone chemistry, there is increasing evidence thatsignificant fractions of secondary organic aerosolsare composed of BVOC reaction products (Bonnet al., 2004; Claeys et al., 2004a,b; Lim et al., 2005).Studies of oxidant chemistry in forest canopies havesuggested that there could be large emissions ofreactive BVOC that are not detected in ambient air.These highly reactive species are suspected to playsignificant roles in modifying ozone and OHconcentrations within forest canopies. Faloona etal. (2001) found that OH radical concentrations in aMichigan (MI) forest did not decay at night asrapidly as expected based on known reactionpathways and ambient BVOC measurements. Theyspeculated that there must be another OH source,possibly the ozonolysis of biogenic terpenes. DiCarlo et al. (2004) found a missing OH reactivity(defined as the calculated reactivity minus themeasured reactivity) from the same MI forest. Theydetermined that this missing OH reactivity wasproportional to ebT where the value of b was �0:1.This relationship was nearly identical to the way inwhich monoterpene (MT) vapor pressures andemissions increase exponentially with temperature.The investigators suggested that this phenomenoncould be due to emissions of highly reactive biogenicterpenes that could not be detected using standardsampling and analysis techniques. Goldstein et al.(2004) found that a thinning experiment in aCalifornia (CA) ponderosa pine forest greatlyenhanced MT emission rates as well as ozone losses.They suggested that although there were hundredsof biogenic compounds measured at the branchlevel, only a fraction were observed in forest air andmost were likely preferentially lost due to chemicalreactions rather than transported out of the canopy.In the same CA forest 3 years later, Holzinger et al.(2005) used proton transfer reaction mass spectro-metry (PTR-MS) to measure relatively high con-centrations of heavy ions (e.g. m=z ¼ 113) that hadspatial and temporal distributions consistent withexpected oxidation products of biogenic terpenes. Acommon hypothesis in these recent studies is thatthere are unaccounted-for reactive biogenic emis-sions from forest canopies that react with OH or
ozone (and thus produce OH) that have not beenadequately accounted for. With increasing interestin oxidant chemistry and aerosol formation fromforested regions, accurate measurements of thebiogenic precursors are necessary for inclusion intoatmospheric chemistry and transport models. Moreconclusive BVOC measurements that substantiatethe current state of knowledge regarding theseprocesses would be valuable.
Many compounds emitted by forest vegetation,such as reactive MT and sesquiterpenes (SQT), arereactive with oxidants and contribute to aerosolnucleation and growth (Bonn and Moortgat, 2003;Lee et al., 2006). These processes can occur withinthe canopy rendering many commonly used above-canopy flux measurements infeasible. Therefore, inorder to estimate landscape fluxes for many of thesecompounds, it is necessary to measure emissions atthe leaf or branch level and scale these values to thecanopy level by using detailed information on leafand canopy characteristics.
In this study, emission rates of isoprene, MT, andSQT were determined from intact leaves andbranches from naturally growing vegetation at amixed northern hardwood forest in Michigan.These emissions were then used in conjunction withthe canopy component of a global biogenic emissionmodel (MEGAN ¼ model of emissions of gassesand aerosols in nature; Guenther et al., 2006) toestimate canopy-level fluxes. Eddy covariance (EC)isoprene fluxes have been measured at this site since1999 (Pressley et al., 2005) and were used tocompare the two techniques. This, in turn, provideda means for estimating the uncertainties in extend-ing the scaling technique to other compounds.Fluxes of these compounds were then used toestimate the BVOCþOH reaction potentials andto determine if additional insight could be gained bycomparing results from these emission studies withother recent reports from direct ambient observa-tions.
2. Experimental
2.1. Site description
The study site was the University of MichiganBiological Station (UMBS) near Pellston, MI, USA(45 �300N, 84 �420E). The tree species sampled forthis scaling study composed the majority ð�95%Þ ofthe biomass around two flux towers on theproperty. The canopy has the biomass composition
ARTIC
LEIN
PRES
S
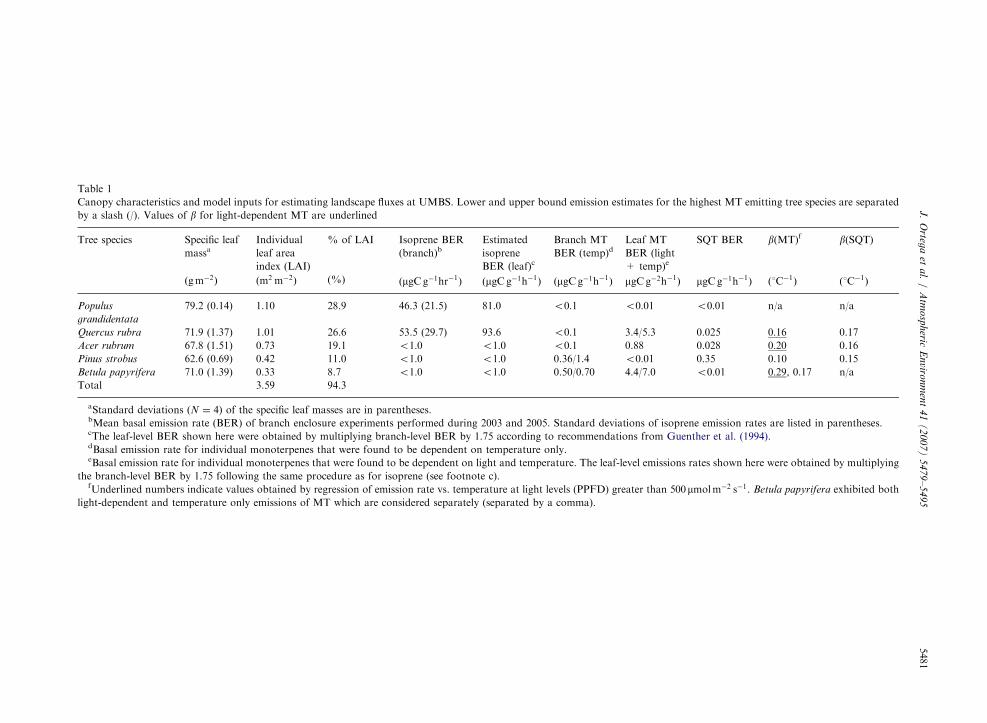
Table 1
Canopy characteristics and model inputs for estimating landscape fluxes at UMBS. Lower and upper bound emission estimates for the highest MT emitting tree species are separated
by a slash (/). Values of b for light-dependent MT are underlined
Tree species Specific leaf
massaIndividual
leaf area
index (LAI)
% of LAI Isoprene BER
(branch)bEstimated
isoprene
BER (leaf)c
Branch MT
BER (temp)dLeaf MT
BER (light
+ temp)e
SQT BER b(MT)f b(SQT)
ðgm�2Þ ðm2 m�2Þ (%) ðmgCg�1hr�1Þ ðmgCg�1h�1Þ ðmgCg�1h�1Þ mgCg�2h�1Þ mgCg�1h�1Þ ð1C�1Þ ð1C�1Þ
Populus
grandidentata
79.2 (0.14) 1.10 28.9 46.3 (21.5) 81.0 o0:1 o0:01 o0:01 n/a n/a
Quercus rubra 71.9 (1.37) 1.01 26.6 53.5 (29.7) 93.6 o0:1 3.4/5.3 0.025 0:16 0.17
Acer rubrum 67.8 (1.51) 0.73 19.1 o1:0 o1:0 o0:1 0.88 0.028 0:20 0.16
Pinus strobus 62.6 (0.69) 0.42 11.0 o1:0 o1:0 0.36/1.4 o0:01 0.35 0.10 0.15
Betula papyrifera 71.0 (1.39) 0.33 8.7 o1:0 o1:0 0.50/0.70 4.4/7.0 o0:01 0:29, 0.17 n/a
Total 3.59 94.3
aStandard deviations ðN ¼ 4) of the specific leaf masses are in parentheses.bMean basal emission rate (BER) of branch enclosure experiments performed during 2003 and 2005. Standard deviations of isoprene emission rates are listed in parentheses.cThe leaf-level BER shown here were obtained by multiplying branch-level BER by 1.75 according to recommendations from Guenther et al. (1994).dBasal emission rate for individual monoterpenes that were found to be dependent on temperature only.eBasal emission rate for individual monoterpenes that were found to be dependent on light and temperature. The leaf-level emissions rates shown here were obtained by multiplying
the branch-level BER by 1.75 following the same procedure as for isoprene (see footnote c).fUnderlined numbers indicate values obtained by regression of emission rate vs. temperature at light levels (PPFD) greater than 500mmolm�2 s�1. Betula papyrifera exhibited both
light-dependent and temperature only emissions of MT which are considered separately (separated by a comma).
J.
Orteg
aet
al.
/A
tmo
sph
ericE
nviro
nm
ent
41
(2
00
7)
54
79
–5
49
55481

ARTICLE IN PRESSJ. Ortega et al. / Atmospheric Environment 41 (2007) 5479–54955482
listed in Table 1. The overstory leaf area index(LAI) for this site is 3:8m2 m�2 with a mean canopyheight of 22m. Long-term EC isoprene fluxes weremeasured from the UMBS-flux tower from 1999until 2002 and on the PROPHET tower since 2003.More detailed information that describes this siteand the two flux towers can be found in Carrollet al. (2001) and Schmid et al. (2003).
2.2. Materials and methods
Branch-level BVOC emission rates (generallymeasured between 15 June and 15 August duringthe 2003 and 2005 growing seasons) were deter-mined from red maple (Acer rubrum), red oak(Quercus rubra), paper birch (Betula papyrifera),white pine (Pinus strobus), and big tooth aspen(Populus grandidentata). Specific leaf mass and LAIvalues listed in Table 1 represent averages from 26litter traps (0:18m2 per trap) in the 1.3 ha plot (60mradius) within the fetch of the UMBS-flux tower.These five species account for approximately 95%of the overstory leaf area, with the two dominantisoprene emitters (Q. rubra and P. grandidentata)contributing �56% of the total (see Table 1). Theprimary emphasis of the 2003 experiments was toobtain branch-level isoprene emission rates. Dy-namic enclosures (described below) were used tocontain the biomass, as 200ml samples from theenclosures were collected onto multi-stage adsor-bent cartridges (Air Toxics, Perkin Elmer) using agas-tight glass syringe. These were analyzed on-sitewithin 24 h using thermo-desorption gas chromato-graphy with flame ionization detection (GC-FID).Calibration of this GC-FID was performed using a213 ppbv 2,2-dimethyl-hexane standard (Scott Spe-cialty Gasses, Longmont, CO) at least twice perweek. Additional samples were collected in 2003 forverifying MT identifications. This was done bycollecting two emission samples from each treespecies at UMBS and storing the adsorbentcatridges on ice. They were later analyzed in ourlaboratory using the GC-FID-mass spectrometry(MS) system described by Pollmann et al. (2005).Positive identifications of the different MT and SQTwere achieved using a combination of matchingmass spectra to a NIST library and comparing GCretention times to those published by Adams (1989).
In 2005, the primary objective was to measurediurnal profiles of MT and SQT. Sampling andanalysis were performed at the site using a field-deployable system with simultaneous GC-FID and
GC-MS. The two-stage sampling/analysis systemconsisted of two pairs of cartridges containing acombination of solid adsorbents in series to trapBVOC in the volatility range from C5 (isoprene) toC15 (SQT). The first stage was used to collect hourlysamples at a sample flow rate of 150mlmin�1. Thisresulted in sample volumes of �7212 l (for MT andSQT). The first stage traps were heated and analyteswere transferred (under H2 flow) to second-stagemicrotraps (cooled to �15 �C) with subsequentrapid thermal desorption and injection onto twopairs of chromatography columns. The entireprocess of sample collection/focusing, thermaldesorption, chromatography, and data collectionwas performed in the field, thus eliminating the needfor transferring and storing samples. Ozone wasremoved from the sampling stream using a combi-nation of MnO2-coated copper screens and sodiumthiosulfate-impregnated glass-fiber filters. The de-tection limit for MT and SQT using these techni-ques was �1 ngC. This equates to a mixing ratio of�2:5 pptv for MT and SQT in a 10 l gas samplecollected from vegetation emitting at a rate of0:01mgCg�1h�1 (using a typical 50 l branch en-closure under a sweep flow rate of 15 lmin�1). Theestimated uncertainties of these emission measure-ments are �20% of MT and �35% for SQT.
Dynamic enclosures were placed on live, sunlitbranches during the middle of the growing seasonsas indicated above. The bag enclosed a volume of�50 l and was made of 0.05mm Teflon film (FEP),which is 95% transparent to photosynthetic photonflux density (PPFD). Leaf temperature, enclosureair temperature, relative humidity, PPFD, andambient ozone concentrations were measured every10 s, and average values were recorded everyminute. A high-capacity, 55 lmin�1 oil-free pump(Medo Corporation, Hannover Park, IL) was usedto provide sweep air through the enclosure at15 lmin�1. Background hydrocarbons were re-moved by placing a 0.75 l steel container filled withcharcoal (Fisher brand 05-685A, 6–14 mesh) in-line.A specially designed set of MnO2-coated copperscreens (OBE Corporation, Fredericksberg, TX)were used to eliminate ozone from the sweep air.Sodium thiosulfate-impregnated glass-fiber filterswere used immediately upstream of the adsorbentcartridges as an additional precaution againstpotential BVOC sampling losses from reactionswith ozone (Helmig, 1997). A quantitative, ppm-level internal standard composed of five aromaticcompounds was added to the enclosure sweep air at

ARTICLE IN PRESSJ. Ortega et al. / Atmospheric Environment 41 (2007) 5479–5495 5483
5mlmin�1 to monitor the recoveries of compoundsof varying volatilities. Disturbances to the leaf andneedle surfaces were minimized as much as possible.Enclosures were allowed to equilibrate approxi-mately 24 h prior to sampling. Experiments weretypically performed for 2–3 days so that diurnalemission profiles could be established. Leaf areas offresh leaves and needles were measured using a leafarea meter (Licor 3100C, Lincoln, NE) equippedwith a standard lens as well as a fine resolution lens(which was necessary for pine needles). Dry weightswere determined after placing leaves (or needles) ina drying oven at 70 �C for 24 h. Sunlit leaves fromthe top of the canopy were used to determinespecific leaf density for use in the model. During the2005 sampling period, emissions were also measuredwith a leaf cuvette using the procedures described inHarley et al. (1996). Although the quantitative datafor this study were taken from the branch enclosureexperiments, the leaf cuvette was invaluable indemonstrating the light dependencies of BVOCemissions as light and temperature could beindependently controlled.
A fast isoprene sensor (FIS) (Guenther and Hills,1998) was used to measure isoprene concentrationsfor the EC isoprene flux calculations. The Tefloninlet line (1.27 cm ID) and sonic anemometer(Applied Technologies, Inc., Longmont, CO) wereco-located towards the NW at 31m above theground (1.4 times canopy height) on the UMBS-fluxtower. Sample air was pumped to the FIS located ina shelter at the bottom of the tower. Further detailson the isoprene flux measurements are provided inPressley et al. (2005). These fluxes were used toverify the accuracy of the scaling technique.
2.3. Model description
The canopy component of a global biogenicemission model (MEGAN; Guenther et al., 2006)was used for estimating landscape fluxes of iso-prene, MT, and SQT. MT and SQT emissions areprimarily driven by temperature, which can beparameterized by a b-factor (i.e. ER / ebT). Branch-level emission rate measurements were plotted as afunction of temperature and an exponential curve fitwas used to determine the b-factors for eachterpenoid class and each tree species (see Table 1).Basal emission rates are defined as those occurringat a temperature of 30 �C and a PPFD of1000mmolm�2 s�1. These rates as well as b-valuesfrom the species studied at UMBS are listed in
Table 1. Q. rubra and A. rubrum exhibited light-dependent MT emissions while P. strobus exhibitedMT emissions that were only a function oftemperature. B. papyrifera was found to exhibitboth light-dependent and light-independent MTemissions. Since light and temperature were co-dependent variables in these experiments, the basalemission rates and b-factors for light-dependent MTemissions were obtained by first normalizing theemissions to standard light conditions and thenplotting the remaining values against temperatureand finding the best fit exponential regression curvethrough the data. The normalization was accom-plished by dividing the original emission rates by thelight correction factor for isoprene given inGuenther et al. (1993). SQT were emitted fromthree of the five tree species surrounding the toweras shown in Table 1. However, other native treespecies in the area (but not present in the footprintof the PROPHET tower) were also found to be SQTemitters. These include balsam fir (Abies balsamea),white spruce (Picea glauca), jack pine (Pinus bank-
siana), and red pine (Pinus resinosa). Americanbeech (Fagus grandifolia) contributes �5% of theleaf area in the flux footprint and was determined tobe a negligible BVOC emitter in earlier screeningexperiments. Therefore, the leaf area contributionfrom American beech was included in the scalingstudy, but assigned an emission rate of zero. Thetotal BVOC flux was estimated as
FluxBVOC;total ¼X
i
Xj
X5k¼1
Fi;j;k
" #, (1)
where i represents the various emitting species in thecanopy (e.g. pine, oak, aspen, etc.), j represents theindividual BVOC (isoprene, MT, SQT, etc.), and k
represents each of five vertical layers within thecanopy (see below). Therefore, the model was runfor each i, j combination independently, and theresults were added. Other model inputs includeabsolute humidity (g H2O per kg air), wind speedðms�1Þ, canopy type (conifer forest, mixed forest,broadleaf forest, etc.), air temperature ð�CÞ, PPFDðmmolm�2 s�1Þ, latitude, time of day, drought index,and day of year (DOY). With these inputs,emissions were calculated for shade and sun leavesat each of five levels within the canopy based onvertical temperature changes and light attenuation.Half-hourly meteorological data from 2001 wereused for this analysis and the results were comparedto EC fluxes for the same time period. The 2001

ARTICLE IN PRESSJ. Ortega et al. / Atmospheric Environment 41 (2007) 5479–54955484
data were representative of all the available years interms of date of last frost, leaf-out date, and averagedaily and cumulative seasonal isoprene fluxes.
Branch-level basal emission rates from the twodominant isoprene emitters varied between 10 and90mgCg�1 h�1. The average emission rates were53:5mgCg�1h�1 for Q. rubra (N ¼ 14, s ¼ 29:7,median ¼ 56:1), and 46:3mgCg�1h�1 for P. grand-
identata (N ¼ 10, s ¼ 21:5, median ¼ 44:9). Be-cause of self-shading and varying leaf orientationsthat occur within a branch enclosure, isopreneemission rates are lower than what would beobtained if all leaves were exposed to a PPFD of1000mmolm�2 s�1. Therefore, the average branch-level isoprene emission rates were multiplied by ascaling factor (1.75) as described in Guenther et al.(1994) to correct for this effect. The resulting valuesconstitute the leaf-level emission rates used in themodel (sixth column of Table 1). Since leaf-levelemission rates are required as model inputs, thisscaling factor was applied to both branch-levelisoprene and light-dependent MT emissions. Thiswas not necessary for light-independent emissions,where leaf orientation does not affect emissionrates.
The branch-level MT and SQT emission ratesdetermined from the 2005 measurements were usedto model whole-canopy fluxes. Emissions of MTwere always exponentially dependent on tempera-ture. Significant light-dependent MT emissions werealso observed from the broadleaf species. In thefollowing discussions, it is noteworthy that whenindividual MT are referred to as being ‘‘light-dependent’’ or ‘‘light-independent’’, the tempera-ture dependence always exists. To account for light-dependent MT emissions, the model was modifiedto include a light response similar to the isoprenelight response algorithms developed by Guenther etal. (1991). Since MT emissions from B. papyrifera
were found to be both light-dependent and light-independent, they were treated separately. Thedominant light-dependent MT emitted from alldeciduous species was trans-ocimene, primarilyfrom Q. rubra and B. papyrifera. The average ofthe b-factors was 0:10 �C�1 for the light-indepen-dent MT and 0:16 �C�1 for the SQT emissions(Table 1). P. strobus (white pine) exhibited thehighest SQT and light-independent MT emissions.The most abundant MT from P. strobus (account-ing for �74% of the total MT emissions) werea-pinene, b-pinene, camphene, d-limonene, andpara-cymene. The average SQT speciation from
P. strobus included b-cubebene, a-gurjunene,d-cadinene, a-cedrene, a-humulene, b-selinene, anda-muurolene, with the last three accounting for 77%of the total SQT emissions from this tree species.Other reactive SQT (a-farnesene and caryophyllene)were identified in emission samples from Q. rubra.
After estimating whole-canopy BVOC fluxesfrom this forest site, the OH reactivities from thevarious terpenoid compounds were estimated. Rateconstants for reaction with OH ðkOHÞ were derivedfrom published values or by estimates based onmolecular structure. For modeling purposes, a valueof 8:7� 10�11 cm3 molecule�1 s�1 was calculatedusing a weighted average of the rate constants fromthe major MT identified for light-independent MTþOH reactions. Similarly, a value of kOH ¼ 25�10�11 cm3 molecule�1 s�1 was used for the light-dependent MTþOH and SQTþOH reaction ratecoefficients. A value of kOH ¼ 9:97� 10�11 cm3
molecule�1 s�1 was chosen for isoprene. Furtherdiscussion regarding the selection of these values isincluded in Appendix A.
3. Results and discussion
3.1. Isoprene
Measured and modeled emission rates of allcompounds (isoprene, MT, and SQT) are expressedin mgCg�1 ðbiomassÞ h�1 and whole-canopy fluxesare given in either mgCm�2 h�1 for half-houraverages or in mgCm�2 (ground area) for cumula-tive multi-day fluxes. The available meteorologicaland isoprene flux data for 2001 start at DOY 158(7 June) and end at DOY 267 (24 September). Fig. 1A shows the modeled isoprene fluxes from DOY 180(29 June) through DOY 200 (19 July) together withthe EC measurements. This time period was chosenas representative of midsummer values with a rangeof different meteorological conditions, includingwarm cloud-free conditions as well as days in whichthere was significant rain. In addition, this periodhad relatively few periods of missing data. Themodeled uncertainty range was obtained by usingthe mean �1s values for basal emission rates for theisoprene emitters as indicated in Table 1. Theaverage of the modeled results is within themeasured flux uncertainty bounds (estimated to beless than �40%; Pressley et al., 2005). A closecomparison of the two data sets shows that theonset of isoprene fluxes from the forest canopyoccurs later in the day than is predicted by the

ARTICLE IN PRESS
0
2000
4000
6000
8000
10000
12000
180 182 184 186 188 190 192 194 196 198 200
Day of Year 2001
Modeled range
Eddy covariance isoprene flux
0
1000
2000
3000
4000
1086420 12 14 16 18 20 22 24
Hour of Day
-3000
-2000
-1000
0
1000
2000
3000
Re
sid
ua
l (m
ea
su
red
-mo
de
l) f
lux
Model
Measured (EC)
Residual (EC-model)
Isopre
ne flu
x (
µgC
m-2
hr-1
)A
vera
ge h
ourly flu
x (
µgC
m-2
hr-1
)
Fig. 1. (a) (Top): mean modeled half-hour isoprene fluxes with comparison to eddy covariance fluxes for DOY 180–200, 2001 (9 July–19
July). The shaded area indicates the range of modeled results using the mean �1s leaf-level basal emission rates for Quercus rubra and
Populus grandidentata. (b) (Bottom): average hour residual (measured–modeled) fluxes for each hour during the same period shown in (a).
Error bars represent �1 standard deviation.
J. Ortega et al. / Atmospheric Environment 41 (2007) 5479–5495 5485
model. Fig. 1b shows the hourly means of thesemeasured and modeled fluxes as well as the differ-ence (between measured and modeled fluxes) duringthese 20 days. The model generally overpredicts theflux during the mornings and underpredicts thefluxes in the afternoons, which is a similar finding asthat reported by Sillman et al. (2002).
Isoprene emissions are controlled by both envir-onmental (light and temperature) as well asphysiological processes. Isoprene is very volatileand is not stored to any considerable degree in theleaf tissues. Therefore, isoprene is emitted shortlyafter it is produced. Isoprene synthase is an enzymefound in the soluble form in leaf stroma as well as

ARTICLE IN PRESSJ. Ortega et al. / Atmospheric Environment 41 (2007) 5479–54955486
bound to thylakoid membranes (Wildermuth andFall, 1998). This enzyme combined with Mg2þ ionsconverts dimethylallyl diphosphate (DMAPP) intoisoprene (Fall and Wildermuth, 1998). An inductionperiod of up to 30 min is required for bothphotosynthesis and isoprene production (and there-fore emission) when a leaf is exposed to light after aperiod of darkness (Sharkey et al., 1991). Similarly,emissions can continue for over an hour after light isabruptly removed (Fall and Monson, 1992). Theseeffects demonstrate that there is a delay between theenvironmental stimuli that initiate and sustainisoprene production, and the time when emissionsactually occur. The differences in the modeled vs.measured landscape fluxes shown in Fig. 1 are likelydue to these effects. In addition, fluxes are alsoinfluenced by boundary layer development andtemperature variations within the canopy. On atypical sunny day, the analyses of surface energybudgets show that latent and sensible heat fluxesfrom the canopy lag behind increases in PPFDmeasured above the canopy (Pressley et al., 2005).Similarly, canopy components will hold heat (evenas irradiance and above-canopy air temperatureshave decreased) and positive heat fluxes willcontinue into the evening. The two aforementioned
0
500
1000
1500
2000
2500
3000
3500
4000
150 160 170 180 190 200 21
Day of Ye
Cu
mu
lative
iso
pre
ne
flu
x (
mg
C m
-2)
Fig. 2. The 2001 cumulative isoprene fluxes from 7 June (DOY 158) to 2
average) assumes the mean basal emission rates for both isoprene emitti
(black open symbols) are the same ones used for Fig. 1. The EC result
processes were not considered in this particularmodeling study. These comparisons suggest thatincorporation of both the delayed emissions fromleaf physiological processes and a more accuratedescription convective transport offer opportunitiesfor future model improvements.
Fig. 2 shows the ranges of cumulative isoprenefluxes using mean �1s values for basal emissionrates from Table 1. The mean cumulative (end-of-season) modeled flux is 2490mgCm�2. Similar toFig. 1, when the upper estimates of basal emissionrates are used, the scaling approach yields valuesclosest to the data obtained from EC. For compar-ison, the maximum estimated uncertainty of themeasured fluxes (40%) is plotted as well. Samplingperiods for which there were complete meteorolo-gical data but missing measured fluxes wereexcluded from the modeled cumulative fluxes sothat the comparisons were not biased. This is thereason for the brief periods where the data seriesbecome horizontal (most notably DOY 171 andDOY 215). Because the cumulative fluxes areadditive, time periods with missing data cannotcontribute to the cumulative flux. Therefore, themodeled and measured cumulative fluxes are mostlikely underestimated. Using the 40% uncertainty
0 220 230 240 250 260 270
ar 2001
EC Upper estimate
(3480)
EC Measured
(2490)
MEGAN Upper estimate
(2630)
MEGAN Average
(1760)
EC Lower estimate
(1490)
MEGAN Lower estimate
(880)
4 September (DOY 267). The average estimate (labeled MEGAN
ng tree species. The low and high estimates for the modeled fluxes
s include the �40% uncertainty range.

ARTICLE IN PRESSJ. Ortega et al. / Atmospheric Environment 41 (2007) 5479–5495 5487
bounds mentioned above, the 2001 measuredcumulative EC fluxes ranged between 1490 and3480mgCm�2. It is encouraging that both the dailypatterns of isoprene fluxes are captured well by themodel (Fig. 1) and that the cumulative fluxestimates (Fig. 2) are well within the uncertaintiesof the measured results.
3.2. Monoterpenes and sesquiterpenes
Three of the five tree species included in this studyexhibited light-dependent MT emissions, whichwere dominated by trans-ocimene. Fig. 3 shows anexample of measured MT emissions from an A.
rubrum tree. Emissions were scaled to a standardtemperature condition ð30 �CÞ by dividing theoriginal emissions by a temperature correctionfactor defined by Guenther et al. (1991). If theMT emissions were only temperature-dependent,these normalized values should have no furtherdependencies. However, the data clearly follow thechanges in light levels, which implies an additionallight-dependency of these emissions. This is alsodemonstrated in Fig. 4, which shows trans-ocimeneemission rates from another A. rubrum as a functionof light. This particular experiment was performedin a leaf cuvette where leaf temperature was held ata constant 30 �C.
0
1
2
3Ocimene ER
Temperature-c
PPFD
10
20
30
40
202.0 202.5 203.0
Day of Year 2
Ba
Le
Em
issio
n r
ate
(µg
C g
-1 h
r-1)
Te
mp
(°C
)
a
b
Fig. 3. Trans-ocimene emission rates from an Acer rubrum; 21–22 July 2
photon flux density, PPFD), original emission rates ð’Þ, and temperatu
temperatures for this experiment. Temperature-corrected emission r
temperature correction ðCTÞ using the MT algorithm from Guenther e
Fig. 5 shows a 10-day period (29 June–9 July2001) of modeled SQT and MT (light-dependentand light-independent) fluxes along with the con-current light and temperature conditions. Theseresults were calculated using the mean values ofthe measured branch-level emission rates given inTable 1 and the same meteorological data used forthe isoprene analysis above. Typical daytime max-imum MT fluxes are 1502180mgCm�2 h�1 com-pared to 400028000mgCm�2 h�1 from isoprene.Typical daytime fluxes of SQT are �30% and �5%of the light-independent MT and total MT fluxes,respectively. After isoprene, the light-dependent MTfluxes are the next largest contributors during fullsolar irradiance. These fluxes are approximately oneorder of magnitude greater than the light-indepen-dent MT fluxes. The cumulative MT and SQT fluxeswith lower and upper bound error estimates(derived from the uncertainties in Table 1) areshown in Fig. 6. The cumulative MT and SQTfluxes are significantly less than isoprene fluxes (105and 7mgCm�2 compared to 2490mgCm�2) andrepresent 4.2% and 0.3% of the total terpenoid fluxfrom this forest with the majority of the MTcontribution being light-dependent. It should benoted that these modeling results are based onemission measurements made during the middle ofthe summer. However, the total emissions as well as
0
200
400
600
800
1000
1200
orrected ER
203.5 204.0
005
g air temp
af temp
PP
FD
(µm
ol m
-2 s
-1)
005 at UMBS. Upper figure (a) shows light levels (photosynthetic
re-corrected emission rates ð�Þ. Lower figure (b) shows air and leaf
ates were calculated by dividing the original emissions by a
t al. (1991) and the air temperature shown in (b).

ARTICLE IN PRESS
0
500
1000
1500
2000
PP
FD
(µm
ol m
-2 h
r-1)
0
10
20
30
40
50
Air
Te
mp
era
ture
(C
)
PAR Air Temperature
0
40
80
120
160
200
180 181 182 183 184 185 186 187 188 189 190
Day of Year 2001
Flu
x (
µgC
m-2
hr-1
)
0.0
0.1
0.2
0.3
0.4
0.5
0.6
SQ
T:M
T E
R R
atioSQT flux
Avg. MT flux (T only)
Avg. MT flux (light dependent)
Ratio (SQT:MT)
a
b
Fig. 5. Modeled half-hour fluxes of MT and SQT at UMBS from 29 June to 9 July 2001. Air temperature and PPFD are in the upper
panel (a). MT and SQT fluxes are in the lower panel ((b); left-hand y-axis). SQT:MT ratios are plotted on the second (right) y-axis in the
lower panel (b).
0
2
4
6
8
10
12
14
16
18
20
0 200 400 600 800 1000 1200
PPFD (µmol m-2 s-1)
Em
issio
n r
ate
(µg
C g
-1 h
r-1)
Trans ocimene ER
Fig. 4. Trans-ocimene emission rate vs. light (PPFD) for an Acer rubrum leaf cuvette experiment (31 July 2005) at UMBS. Leaf
temperature was held at a constant 30 �C.
J. Ortega et al. / Atmospheric Environment 41 (2007) 5479–54955488
the MT and SQT speciation can change. Forexample, Pressley et al. (2004) found emission ratesfrom Douglas fir (Pseudotsuga menziesii) to decreasefrom May to September, whereas Western hemlock(Tsuga heterophylla) emissions remained relativelyconstant. Hakola et al. (2006) demonstrated thataverage MT basal emission rates from two Scots
pine (Pinus sylvestris) enclosures varied by �40%over the course of a growing season (March toOctober) with emissions being highest in late spring(May and June). Holzinger et al. (2006) showedvariable MT b-factors (as described in Section 2.3)from a ponderosa pine plantation that led tounderestimating winter and spring fluxes by up to

ARTICLE IN PRESS
0
20
40
60
80
100
120
140
150 160 170 180 190 200 210 220 230 240 250 260 270
Dayof Year 2001
Cum
ula
tive M
T a
nd S
QT
flu
x (
mgC
m-2
)
Cumulative MT flux
Cumulative SQT flux
Fig. 6. Modeled 2001 cumulative MT and SQT fluxes from 7 June (DOY 158) to 24 September (DOY 268). The shaded gray area
represents the MT flux ranges calculated from the upper and lower estimates of branch-level emission rates in Table 1 ð�27%Þ. The
uncertainty of the SQT fluxes is estimated to be �50% which is indicated by the range of the black area.
J. Ortega et al. / Atmospheric Environment 41 (2007) 5479–5495 5489
130% when using estimates based on a temperature-only relationship and a constant value of b.However, since summer fluxes contributed themajority of the cumulative amount, the annualunderestimate was closer to 30%. The midsummeremission rates and b-factors estimated here areappropriate for comparing OH reactivities (Section3.4) with previous reports from this site. However,seasonal variability of MT emissions for this site hasnot been determined. It is likely that similar changesin emissions as just described would cause annualcumulative MT fluxes from UMBS to be higherthan the estimates presented in Fig. 6.
3.3. Comparison of modeled MT fluxes to previous
measurements
The emission estimates presented here are from amixed forest where detailed biomass data areavailable. However, this region is composed ofheterogeneous vegetation types depending on soilproperties, elevation changes, and anthropogenicdisturbances. Other conifer species growing in thearea include red pine (Pinus resinosa), Easternhemlock (Tsuga canadensis), jack pine (Pinus bank-
siana), balsam fir (Abies balsamea), white spruce(Picea glauca), black spruce (Picea mariana), andEastern white cedar (Thuja occidentalis). These were
all found to be MT emitters with SQT identified inat least four of these species. Therefore, the modeledresults presented here are likely to be representativeof secondary growth mixed forests common to theregion, but other areas in this region are expected toexhibit different emission ratios of various BVOC aswell as different total BVOC fluxes. Guenther et al.(1995) predicted July mean MT fluxes of�0:1520:25 gCm�2 month�1 for Northern UnitedStates forests which translate to average hourlyfluxes of �2002350mgCm�2 h�1. Maximum dailyfluxes are expected to be approximately twice theaverage values assuming typical diurnal (sinusoidal)temperature cycles. Lee et al. (2005) measured MTfluxes in August above a Pinus ponderosa plantationin California using two different techniques andobserved MT fluxes generally between �2 and4mmolm�2 h�1 ð2402480mgCm�2 h�1Þ. Finally,Spirig et al. (2005) measured MT fluxes in Julyabove a beech and birch dominated forest in NWGermany using PTR-MS and observed maximumMT daytime fluxes between �0:4 and0:6mmolm�2 s�1 ð140022100mgCm�2 h�1Þ, whichwere approximately 25% of the isoprene fluxesat that site. Typical maximum daytime MT fluxesfrom the modeling study presented hereð�1002200mgCm�2 h�1Þ are less than those ob-served in the publications listed above. The various

ARTICLE IN PRESSJ. Ortega et al. / Atmospheric Environment 41 (2007) 5479–54955490
MT fluxes from these studies are not directlycomparable to our results since they are fromdifferent sites with different vegetation and differentlight and temperature regimes (and of coursedifferent time periods). However, our modeledresults are of a similar magnitude as fluxes reportedin these other studies, which provides greaterconfidence in the current scaling technique.Although the SQT emissions are a small percentageof the total, these results are the first estimates fromthe UMBS site.
3.4. Effect of terpenoid emissions on OH reactivity
The total OH reactivity (inverse of OH lifetime) iscalculated by (Kovacs et al., 2003)
k�OH ¼X
kOHþVOCi½VOCi þ kCO½CO
þ kSO2½SO2 þ kNO2
½NO2 þ , ð2Þ
where k�OH represents the reactivity (in units of s�1)and the quantities in brackets indicate concentra-tions. The asterisk (*) is used to differentiate thisvalue from the reaction rate coefficients with OH(kOHþVOC in units of cm3 s�1 molecule�1). Thestudies of Faloona et al. (2001) and of Di Carloet al. (2004) discussed OH reactivity from this sameforest site by considering the measured ambientconcentrations of various biogenic and anthropo-genic hydrocarbons ð½VOCiÞ in addition to CO,NO, NO2, and methane. Based on direct OHconcentration measurements and detailed reactionmechanisms, Faloona et al. (2001) suggested thatthe anomalously high nighttime OH concentrationsobserved could be due to ozonolysis of highlyreactive BVOC. Di Carlo et al. (2004) observeddisagreements between measured and predicted OHreactivity that had an exponential dependence ontemperature. This relationship closely matchedtemperature-dependent MT emissions and thus theyargued that unmeasured highly reactive BVOCcontaining at least one carbon double bondðC QCÞ were likely responsible for this observa-tion. We investigated the contribution of ourmodeled flux results to OH reactivity to determineif some of the compounds measured from enclo-sures, but not included in the aforementionedstudies, could be responsible for the missing OHreactivity. Several highly reactive MT and SQT wereobserved in the enclosure samples (e.g. trans-ocimene, a-terpinene, b-caryophyllene) but werenot included in the calculations of Di Carlo et al.
(2004) since they were not detected in ambient air.These compounds react rapidly with O3 and OH.With such short atmospheric lifetimes, it is notsurprising that some of these compounds that wereobserved from enclosures (where oxidant scrubbingwas employed) were not detected in ambient air.Without ambient VOC concentrations, direct com-parisons of OH reactivity (for these additionalidentified compounds) were not possible using Eq.(2). Therefore, we defined a BVOC reactivity rate(RBVOC in units of s�2) as
RBVOC ¼ PBVOCkOHþBVOC, (3)
where PBVOC is the BVOC production rateðmolecules cm�3 s�1Þ from the canopy andkOHþBVOC is the rate coefficient defined in Eq. (2).A box model analysis was applied to the canopyto estimate BVOC production rates from themodeled and measured fluxes. Production ratesðmolecules cm�3 s�1Þ were calculated by dividingthat BVOC fluxes ðmgCm�2s�1Þ by the verticalcolumn of 8.8m, which is portion between 50% and95% of the 22m canopy height. This regionrepresents the majority of the leaf biomass at thissite (Schmid et al., 2003). When considering totalOH reactivity (Eq. (2)), there are many complica-tions because of time-varying OH concentrations,temperature effects, and, in particular, BVOCreaction products. Carter and Atkinson (1996)characterized a significant number of the isopreneoxidation reactions and their by-products, but theatmospheric oxidation reactions of MT and SQTare much less characterized. The parent BVOCmolecules as well as reaction products can bereactive with other oxidants (O3, NO, NO2) andthese reactions can also be a source of OH radicals(Paulson and Orlando, 1996; Aschmann et al.,2002). We considered the first order reactions ofthe parent molecules (isoprene, MT, and SQT) withOH. However, OH can react with the oxidationproducts of the initial reactions, which suggests thatMT and SQT could be a greater sink for OHradicals based on the number of carbon atoms permolecule. For example, two primary products of theisopreneþOH reaction are methacrolein andmethyl vinyl ketone. These molecules as well asfurther reaction products have reaction rate coeffi-cients of kOH�10
�11 cm3 molecule�1 s�1 (Carter andAtkinson, 1996), which are of the same order ofmagnitude of the initial isopreneþOH reaction (seeTable S1 in Appendix A). The following estimatesof OH reactivity rates are conservative since MT

ARTICLE IN PRESSJ. Ortega et al. / Atmospheric Environment 41 (2007) 5479–5495 5491
and SQT have 2 or 3 times the number of carbonatoms as isoprene and can therefore potentially be acorrespondingly greater OH sink with respect togas-phase reactions.
The values calculated for reactivity rate areindependent of the OH concentration, which wasnot measured directly during the 2003 or 2005growing seasons at UMBS. The reaction rateconstants ðkBVOCþOHÞ are listed in Appendix A.Reactivity rates for MT and SQT (defined inEq. (3)) were calculated from the modeled fluxesfor each half-hour period shown in Fig. 5. Measuredhalf-hour fluxes were used to calculate the isoprenereactivity rates. Periods where measured (EC-FIS)isoprene fluxes were missing were gap-filled byinterpolating between adjacent time periods. Fig. 7shows a 5-day period (DOY 190–195) of reactivityrates plotted as a time series. It is evident thatisoprene comprises nearly all of the total reactivityduring the day. However, the addition of ocimenegreatly increases the reactivity of non-isopreneBVOC, and nighttime MT and SQT are estimatedto account for �50% of the total rate. Fig. 8shows the percentage contributions to the totalBVOC reactivity rate from each of the terpenoid
1.E-05
1.E-04
1.E-03
1.E-02
1.E-01
1.E+00
Re
activity r
ate
(s-2
)
0
500
1000
1500
2000
195 196 197
Day of Year 2
PP
FD
(µm
ol m
-2 s
-1)
a
b
Fig. 7. (a) Top: reactivity rates of isoprene ð�Þ, light-dependent MT ð&Þ
calculated using Eq. (3) for 14 July–19 July 2001. Note that the y-s
conditions for each day.
classes. During daylight hours, isoprene contri-butes over 90% of the total reactivity from thisforest. At night, MT and SQT constitute more ofthe total. This graph is somewhat deceptive becausealthough contributions of MT and SQT to thetotal are greater, the nighttime reactivity ratefrom all compounds is reduced due to lowertemperatures and absence of light. Isoprene andocimene production essentially cease at night,and light-independent MT and SQT productionrates are reduced by approximately an order ofmagnitude.
These reactivity rates (in units of s�2 from Eq. (3))and OH reactivities (Eq. (2); in units of s�1; Kovacset al., 2003; Di Carlo et al., 2004) are not directlycomparable. Although both quantities depend onthe OH reaction rate coefficients, the formerquantity depends on the BVOC production rates,and the latter depends on the ambient BVOCconcentrations. Ambient isoprene concentrationsduring this study period ranged between 10 and500 pptv at night ð�10821010 molecules cm�3Þ andwere �5 ppbv ð1011 molecules cm�3Þ during themiddle and afternoon hours of typical July days.Using these measured ambient mixing ratios (from
Isoprene
MT-Light&Temp
MT-Temp
SQT
198 199 200
001
0
5
10
15
20
25
30PPFD Temp
Te
mp
(oC
)
Total BVOC
, light-independent MT ð�Þ, SQT ðþÞ, and total BVOC (solid line)
cale is logarithmic. (b) Bottom: ambient light and temperature

ARTICLE IN PRESS
0
20
40
60
80
100
195 196 197 198 199 200
Day of Year 2001
% R
ea
ctivity MTSQT
0
20
40
60
80
100
195.0 196.0 197.0 198.0 199.0
% R
eactivity
Isoprene
a
b
Fig. 8. Modeled BVOC reactivity rates ðs�2Þ as a percentage of the total for isoprene (a), and MT, SQT (b). Each vertical gridline
represents midnight.
J. Ortega et al. / Atmospheric Environment 41 (2007) 5479–54955492
July 2001) a direct comparison is possible. Usingthese values, we estimated OH reactivity withrespect to isoprene to be �0:0121:0 s�1 at nightand �10 s�1 during the day. These values agreefavorably with the results of Di Carlo et al. (2004)who calculated reactivities (with respect to isoprene)between �0:5 and 5:5 s�1 for the temperature rangeof 9227 �C. Di Carlo et al. (2004) estimated that itwould be necessary to have mixing ratios of highlyreactive compounds (such as terpinolene) of�500 pptv in order to account for the missing OHreactivity. Resulting ambient concentrations dependon production as well as loss rates. Using the 2001measured ambient isoprene mixing ratios andassuming that MT would scale directly to themeasured emission rates of the individual BVOC,we estimate maximum midday MT mixing ratiosbetween 150 and 300 pptv for the time period shownin Fig. 7. The total MT mixing ratio is approxi-mately 5% of isoprene, and is composed predomi-nately of trans-ocimene. Because trans-ocimene isconsiderably more reactive than isoprene (see TableS1), actual ambient MT mixing ratios are expectedto be considerably less than this. Based on OHreactivity alone, the ambient MT mixing ratio
would be expected to �13
of these values (i.e.50–100 pptv). The estimated ambient MT mixingratios from this modeling study are of the sameorder of magnitude measured by Di Carlo et al.(2004). However, these inferred levels are a factor of2–10 smaller than what would be necessary toaccount for the missing OH reactivity. Faloonaet al. (2001) reported ambient nighttime mixing ratiosof the sum of MT of �55 pptv, which is consistentwith our nighttime estimates. However, in order toaccount for anomalously high OH concentrations,they estimated that a production rate of a highlyreactive terpene (such as terpinolene or ocimene) of360mgCm�2 h�1 would be necessary. This value isover 2 times the maximum fluxes estimated at thissite (1502180mgCm�2 h�1; see Fig. 5).
The inclusion of previously unaccounted-for MTand highly reactive SQT (such as b-caryophyllene,a-farnesene, and a-humulene) in the present studyincreases the level of known reactive biogeniccompounds over previous estimates. However, theyare still considerably less than what would berequired to account for either the anomalously highnighttime OH levels from terpene ozonolysis sug-gested by Faloona et al. (2001) or the missing OH

ARTICLE IN PRESSJ. Ortega et al. / Atmospheric Environment 41 (2007) 5479–5495 5493
reactivity reported by Di Carlo et al. (2004). Thisholds true even considering the uncertainty of theflux estimates reported here (approximately �27%for MT and �50% for SQT).
There are a number of uncertainties and potentialbiases in our comparison that cannot be overcomedue to limitations in the current knowledge of theBVOC oxidation chemistry and due to limitations inavailable data. As mentioned above, because of thelarger molecule size and carbon number, OHreactivities on a per-molecule basis are potentiallylarger for MT and SQT than for isoprene. On theother side, there is ample evidence that much largerfractions of MT and SQT oxidation productspartition into the aerosol phase, which will removea proportionally higher fraction of the reactionproducts from participation in gas-phase chemistry.
Each of these studies (including the currentreport) utilizes estimates or measurements of con-centrations obtained during different times of theyear and during different years. Because of theexpected variability of seasonal and interannualvariations in emission rates and ambient concentra-tions, comparisons of data sets from differentmeasurement periods will always be problematic.Other BVOC that were not considered in ourmeasurements (e.g. oxygenated BVOC) have beenshown to be emitted from vegetation at this site(Karl et al., 2003). However, their ambient con-centrations are lower than for isoprene (typicallyless than 1 ppbv), and these compounds are lessreactive towards atmospheric oxidants than terpe-noid compounds. For example, acetone has anestimated lifetime with respect to OH of 61 dayswhile isoprene, MT, and SQT have lifetimes rangingfrom minutes to hours (Atkinson and Arey, 2003and references therein). Consequently, oxygenatedcompounds, which were not included in thesemodeling results, are not expected to significantlyaffect the total OH reactivity.
4. Conclusions
Branch-level measurements of all terpenoid spe-cies (isoprene, MT, and SQT) were taken from thebiomass representing the footprint of the UMBS-flux tower and were used to model whole-canopyBVOC fluxes and OH reactivity rates from thisforest site. The isoprene emission rates in conjunc-tion with a canopy model demonstrated that theisoprene daily and seasonal fluxes compared favor-ably with the directly measured values. Modeled
results best represented EC fluxes when the upperestimates of basal emission rates were used. Thedominant MT (trans-ocimene) had a strong lightdependence. Light-dependent MT accounted for themajority of the total terpenoid fluxes. SQT fluxescontributed less than a percent to the total. Since themodeled isoprene fluxes were well within theuncertainties of the measured canopy fluxes, webelieve that extending this technique to estimate MTand SQT fluxes is appropriate. Karl et al. (2003)reported seasonal fluxes of primarily oxygenatedBVOC, but the emissions presented here provide thefirst estimates of total terpenoid fluxes from this site.These terpenoid fluxes were then used to estimatetheir influence on OH reactivity from this canopy.Since ambient measurements of SQT and many MTwere not available or even feasible, a new parameter(reactivity rate) was defined, which is representativeof the BVOCþOH reaction potentials. Reactivityrates are based on fluxes rather than ambientconcentrations. This approach could be morerelevant since it utilizes dynamic properties thatare coupled to the emission source, in contrast todetermining OH reactivity, which requires theassumption of nearly steady-state BVOC concen-trations. Ambient concentrations are dependent onlocal emissions, as well as chemical reactions andmixing within the canopy. As expected, isoprenewas the dominant contributor to the BVOCþOHreactivity rate. The maximum contribution to totalreactivity rate from the other terpenoid compoundsis estimated to be on the order of 10% during theday and can comprise the majority of the reactivityrate at night. However, the total reactivity ratedecreases by over two orders of magnitude from dayto night. Our flux estimates of MT and SQT are thefirst to be reported from this site and include highlyreactive BVOC that have not been previouslyconsidered. However, the estimated fluxes of thesecompounds are still insufficient to affect observedoxidant levels to the degree suggested by otherrecent reports. Better characterization of theBVOCþ oxidant interactions will ultimately requirekinetic and product studies of the newly identifiedBVOC, as well as concurrent measurements ofambient OH and BVOC concentrations and BVOCemission rates.
Acknowledgments
J.O. was supported by a Biosphere AtmosphereResearch and Training (BART) fellowship from the

ARTICLE IN PRESSJ. Ortega et al. / Atmospheric Environment 41 (2007) 5479–54955494
National Science Foundation InterdisciplinaryGraduate Education Research and Training (NSF/IGERT) program administered by Western Michi-gan University. Special thanks to the faculty andstaff of the UMBS for housing, resources, guidance,and support. This research was also supported byfunding from the National Science Foundation(ATM #0304704) and from the United StatesEnvironmental Protection Agency (#RD-83107901-0). Any opinions, findings, and conclu-sions expressed in this material are those of theauthors and do not necessarily reflect the views ofthese agencies. David Tanner, Jacques Hueber,Tiffany Duhl, and Jan Pollmann of INSTAARprovided assistance with instrument development,calibrations, electronics, instrument programming,machining, and fieldwork duties. The NationalCenter for Atmospheric Research is sponsored bythe National Science Foundation.
Appendix A. Supplementary data
Supplementary data associated with this articlecan be found in the online version at 10.1016/j.atmosenv.2006.12.033.
References
Adams, R.P., 1989. Identification of Essential Oils by Ion Trap
Mass Spectrometry. Academic Press, San Diego.
Aschmann, S.M., Arey, J., Atkinson, R., 2002. OH radical
formation from the gas-phase reactions of O3 with a series of
terpenes. Atmospheric Environment 36, 4347–4355.
Atkinson, R., Arey, J., 2003. Gas-phase tropospheric chemistry
of biogenic volatile organic compounds: a review. Atmo-
spheric Environment 37, S197–S219.
Bonn, B., Moortgat, G.K., 2003. Sesquiterpene ozonolysis:
origin of atmospheric new particle formation from biogenic
hydrocarbons. Geophysical Research Letters 30(11), 1585,
doi:10.1029/2003GL17000.
Bonn, B., von Kuhlmann, R., Lawrence, M.G., 2004. High
contribution of biogenic hydroperoxides to secondary organic
aerosol formation. Geophysical Research Letters 31, L10108,
doi:10.1029/2003GL019172.
Carroll, M.A., Bertman, S.B., Shepson, P.B., 2001. Overview of
the program for Research on oxidants: photochemistry,
emissions, and transport (PROPHET) summer 1998 measure-
ments intensive. Journal of Geophysical Research 106 (D20),
24275–24288.
Carter, W.P.L., Atkinson, R., 1996. Development and evaluation
of a detailed mechanism for the atmospheric reactions of
isoprene and NOx. International Journal of Chemical
Kinetics 28, 497–530.
Claeys, M., Graham, B., Vas, G., Wang, W., Vermeylen, R.,
Pashynska, V., Cafmeyer, J., Guyon, P., Andreae, M.O.,
Artaxo, P., Maenhaut, W., 2004a. Formation of secondary
organic aerosols through photooxidation of isoprene. Science
303, 1173–1176.
Claeys, M., Wang, W., Ion, A.C., Kourtchev, I., Gelencser, A.,
Maenhaut, W., 2004b. Formation of secondary organic
aerosols from isoprene and its gas-phase oxidation products
through reaction with hydrogen peroxide. Atmospheric
Environment 38, 4093–4098.
Di Carlo, P., Brune, W.H., Martinez, M., Harder, H., Lesher, R.,
Ren, X., Thornberry, T., Carroll, M.A., Young, V., Shepson,
P.B., Riemer, D., Apel, E., Campbell, C., 2004. Missing OH
reactivity in a forest: evidence of unknown reactive biogenic
VOCs. Science 304, 722–725.
Fall, R., Monson, R.K., 1992. Isoprene emission rate
and intercellular isoprene concentration as influenced by
stomatal distribution and conductance. Plant Physiology 100,
987–992.
Fall, R., Wildermuth, M., 1998. Isoprene synthase: from
biochemical mechanism to emission algorithm. Journal of
Geophysical Research 103 (D19), 25,599–25,609.
Faloona, I., Tan, D., Brune, W., Hurst, J., Barket, Jr. D., Couch,
T., Shepson, P., Apel, E., Riemer, D., Thornberry, T.,
Carroll, M.A., Sillman, S., Keeler, G.J., Sagady, J., Hooper,
D., Paterson, K., 2001. Nighttime observations of anom-
alously high levels of hydroxyl radicals above a deciduous
forest canopy. Journal of Geophysical Research 106 (D20),
24,315–24,333.
Fehsenfeld, F., Calvert, J., Fall, R., Goldan, P., Guenther, A.B.,
Hewitt, C.N., Lamb, B., Shaw, L., Trainer, M., Westberg, H.,
Zimmerman, P., 1992. Emissions of volatile organic com-
pounds from vegetation and the implications for atmospheric
chemistry. Global Biogeochemical Cycles 6, 389–430.
Fuentes, J.D., Lerdau, M., Atkinson, R., Baldocchi, D.,
Bottenheim, J.W., Ciccioili, P., Lamb, B., Geron, C., Gu,
L., Guenther, A., Sharkey, T.D., Stockwell, W., 2000.
Biogenic hydrocarbons in the atmospheric boundary layer.
Bulletin of the American Meteorological Society 81,
1537–1575.
Goldstein, A.H., McKay, M., Kurpius, M.R., Schade, G.W.,
Lee, A., Holzinger, R., Rasmussen, R.A., 2004. Forest
thinning experiment confirms ozone deposition to forest
canopy is dominated by reaction with biogenic VOCs.
Geophysical Research Letters 31, L22106.
Guenther, A., Zimmerman, P., Harley, P., Monson, R., Fall, R.,
1993. Isoprene and monoterpenes emission rate variability
model evaluation and sensitivity analysis. Journal of Geo-
physical Research 98 (D7), 12,609–12,617.
Guenther, A., Zimmerman, P., Wildermuth, M., 1994. Natural
volatile organic compound emission rate estimates for U.S.
woodland landscapes. Atmospheric Environment 28,
1197–1210.
Guenther, A., Hewitt, C.N., Erickson, D., Fall, R., Geron, C.,
Graedel, T., Harley, P., Klinger, L., Lerdau, M., McKay,
W.A., Pierce, T., Scholes, B., Steinbrecher, R., Tallamraju,
R., Taylor, J., Zimmerman. P., 1995. A global-model of
natural volatile organic-compound emissions. Journal of
Geophysical Research 100 (D5), 8873–8892.
Guenther, A., Karl, T., Harley, P., Wiedinmyer, C., Palmer, P.I.,
Geron, C., 2006. Estimates of global terrestrial isoprene
emissions using MEGAN (model of emissions of gases and
aerosols from nature). Atmospheric Chemistry and Physics 6,
3181–3210.

ARTICLE IN PRESSJ. Ortega et al. / Atmospheric Environment 41 (2007) 5479–5495 5495
Guenther, A.B., Hills, A.J., 1998. Eddy covariance measurements
of isoprene fluxes. Journal of Geophysical Research 103
(D11), 13,145–13,152.
Guenther, A.B., Monson, R.K., Fall, R., 1991. Isoprene and
monoterpene emission rate variability: observations with
eucalyptus and emission rate algorithm development. Journal
of Geophysical Research 96 (D6), 10799–10808.
Hakola, H., Tarvainen, V., Back, J., Ranta, H., Bonn, B., Rinne,
J., Kulmala, M., 2006. Seasonal variation of mono- and
sesquiterpene emission rates of Scots pine. Biogeosciences 3,
93–101.
Harley, P., Guenther, A., Zimmerman, P., 1996. Effects of light,
temperature and canopy position on net photosynthesis and
isoprene emission from sweetgum (Liquidamber styraciflua)
leaves. Tree Physiology 16, 25–32.
Helmig, D., 1997. Ozone removal techniques in the sampling
of atmospheric volatile organic trace gases. Atmospheric
Environment 31, 3635–3651.
Holzinger, R., Lee, A., Paw, K.T., Goldstein, A.H., 2005.
Observations of oxidation products above a forest imply
biogenic emissions of very reactive compounds. Atmospheric
Chemistry and Physics 5, 67–75.
Holzinger, R., Lee, A., McKay, M., Goldstein, A.H., 2006.
Seasonal variability of monoterpene emission factors for a
Ponderosa pine plantation in California. Atmospheric Chem-
istry and Physics 6, 1267–1274.
Karl T., Guenther, A., Spirig C., Hansel A., Fall R., 2003.
Seasonal variation of biogenic VOC emissions above a mixed
hardwood forest in northern Michigan. Geophysical Research
Letters 30 (23), 2186, doi:10.1029/2003GL018432.
Kovacs, T.A., Brune, W.H., Harder, H., Martinez, M., Simpas,
J.B., Frost, G.J., Williams, E., Jobson, T., Stroud, C., Young,
V., Fried, A., Wert, B., 2003. Direct measurements of urban
OH reactivity during Nashville SOS in summer 1999. Journal
of Environmental Monitoring 5, 68–74.
Lee, A., Schade, G.W., Holzinger, R., Goldstein, A.H., 2005. A
comparison of new measurements of total monoterpene flux
with improved measurements of speciated monoterpene flux.
Atmospheric Chemistry and Physics 5, 505–513.
Lee, A., Goldstein, A.H., Keywood, M.D., Gao, S., Varutbang-
kul, V., Bahreini, R., Ng, N.L., Flagan, R.C., Seinfeld, J.H.,
2006. Gas-phase products and secondary aerosol yields
from the ozonolysis of ten different terpenes. Journal of
Geophysical Research 111 (D7), D07302, doi:10.1029/
2005JD006437.
Lim, H.J., Carlton, A.G., Turpin, B.J., 2005. Isoprene forms
secondary organic aerosol through cloud processing: model
simulations. Environmental Science and Technology 39,
4441–4446.
Monson, R.K., Holland, E.A., 2001. Biospheric trace gas fluxes
and their control over tropospheric chemistry. Annual Review
of Ecological Systems 32, 547–576.
Paulson, S.E., Orlando, J.J., 1996. The reactions of ozone with
alkenes: an important source of HOx in the boundary layer.
Geophysical Research Letters 23 (25), 3727-3730.
Pollmann, J., Ortega, J., Helmig, D., 2005. Sampling of atmo-
spheric sesquiterpenes: sampling losses and mitigation of
ozone interference. Environmental Science and Technology
39, 9620–9629.
Pressley, S., Lamb, B., Westberg, H., Guenther, A., Chen, J.,
Allwine, E., 2004. Monoterpene emissions from a Pacific
northwest old-growth forest and impact on regional biogenic
VOC emission estimates. Atmospheric Environment 38,
3089–3098.
Pressley, S., Lamb, B., Westberg, H., Flaherty J., Chen, J., Vogel,
C., 2005. Long-term isoprene flux measurements above a
northern hardwood forest. Journal of Geophysical Research
110 (D7), D07301, doi:10.1029/2004JD005523.
Schmid, H.P., Su, H.-B., Vogel, C.S., Curtis, P.S., 2003.
Ecosystem-atmosphere exchange of carbon dioxide over a
mixed hardwood forest in northern lower Michigan. Journal
of Geophysical Research 108 (D14), 4417, doi:10.1029/
2002JD003011.
Sharkey, T.D., Loreto, F., Delwiche, C.F., 1991. The biochem-
istry of isoprene emission from leaves during photosynthesis.
In: Sharkey, T.D., Mooney, H.A., Holland, E.A. (Eds.),
Trace Gas Emissions by Plants. Academic Press, San Diego,
pp. 153–184.
Sillman, S., Carroll, M.A., Thornberry, T., Lamb, B.K.,
Westberg, H., Brune, W.H., Faloona, I., Tan, D., Shepson,
P.B., Sumner, A.L., Hastie, D.R., Mihele, C.M., Apel, E.C.,
Riemer, D.D., Zika, R.G., 2002. Loss of isoprene and sources
of nighttime OH radicals at a rural site in the Unites States:
results from photochemical models. Journal of Geophysical
Research 107 (D5), 4043, doi:101.1029/2001JD000449.
Spirig, C., Neftel, A., Ammann, C., Dommen, J., Grabmer, W.,
Thielmann, A., Schaub, A., Beauchamp, J., Wisthaler, A.,
Hansel, A., 2005. Eddy covariance flux measurements of
biogenic VOCs during ECHO 2003 using proton transfer
reaction mass-spectrometry. Atmospheric Chemistry and
Physics 5, 465–481.
Wildermuth, M.C., Fall, R., 1998. Biochemical characterization
of stromal and thylakoid-bound isoforms of isoprene
synthase in willow leaves. Plant Physiology 116, 1111–1123.