Embed Size (px)
Citation preview

Page 1
Copyright © 2009 Lambda Research Corporation. All Rights Reserved.
www.lambdares.com
TRACEPRO®
TUTORIAL
Fluorescence
Requirements
Models: FluorescenceExampleBegin.oml
Properties: FluorescenceExampleProperties.txt
Editions: TracePro Expert
IntroductionTracePro Expert is capable of modeling fluorescent material. Fluorescent material absorbs light in one wavelength band (excitation wavelengths) and emits light in another, longer, wavelength band (emission wavelengths). TracePro performs fluorescence modeling by using a combination of Fluorescence Properties and a specialized two stage ray tracing sequence.
Stage 1 of the ray trace
Stage 2 of the ray trace
Create Model
Calculate Fluorescence & Create Fluorescent Source
Perform Analyses
Ray trace light that illuminates fluorescent material
Ray trace light emitting from fluorescent material
In the first stage of the ray trace, excitation rays illuminate the fluorescent material. The rays must be in the excitation portion of the fluo-rescent material spectrum and the model geometry must allow the fluorescent material to be illuminated. A byproduct of this first stage of the ray trace is that TracePro automatically creates source files which contain rays generated by the fluorescing material. The second stage of the ray trace uses the newly created source files to trace the fluorescing rays themselves. TracePro allows you to choose whether the two stages of the ray trace should be performed together (where TracePro starts the second stage of the ray trace immediately after the first stage is complete) or separately (where the you can use the stored fluorescent source files to perform the second stage of the ray trace at a later time).
Figure 1. Fluorescence modeling sequence showing two stage ray trace

Page 2 www.lambdares.com
TRACEPRO®
TUTORIAL Fluorescence Example
Fluorescence Properties
Fluorescence characteristics are modeled using a devoted set of Fluorescence Properties in TracePro. This allows users to define fluorescence properties separately from material properties and then apply fluorescence properties in differing amounts to different materials. Since Fluorescence Properties are defined separately from Material Properties, fluorescence is defined in the Fluorescence Property Editor (Define|Edit Property Data|Fluorescence Properties). Clicking on the Add Property button creates a new fluorescence property with the following characteristics that you can define:
1) Quantum Efficiency value2) Peak molar extinction value3) In the Excitation Table: a. Wavelength (this is added via the Add button b. Temperature (this is added via the Add button c. Relative Absorption (these values are directly editable) d. Relative Excitation (these values are directly editable)4) In the Emission Table: a. Wavelength (this is added via the Add button) b. Temperature (this is added via the Add button) c. Relative Emission (these values are directly editable)NOTE: If you have any trouble editing these values, make sure that the property is unlocked for editing.
The relative absorption, relative excitation, and relative emission values are normalized. An example Absorption/Excitation tab is shown in Figure 2, and an example Fluorescence Emission Table is shown in Figure 3.
Figure 2. Example Absorption/ExcitationTable.

TRACEPRO®
TUTORIAL Fluorescence Example
Page 3 www.lambdares.com
Figure 3. Example Fluorescence Emission Table
It is customary, in measuring flourescence spectra, to express the peak molar extinction in base 10 rather than base e. The base 10 absorption coefficient is then
m10 (l) = ab(l)KpeakCmolar
where Kpeak is the peak molar extinction corresponding to the value of 1 in the relative absorption ab(l), and Cmolar is the molar concentration in the particular sample. The transmittance through a sample of thickness t is then
t =10 -m10t
The absorption coefficient used in a non-fluorescent material property in TracePro is related to the base 10 absorption coefficient by
ma = ma 1n10.
This is used for Lambert/Beer Law absorption, in whch the transmittance through a thickness t is
t = e -m t
The optics absorption coefficient ma is computed internally in TracePro for use in the raytrace. The same applies to the relative excita-tion values.
a
10
a
a

Page 4 www.lambdares.com
TRACEPRO®
TUTORIAL Fluorescence Example
Raytrace Options
The generation of fluorescence rays can be enabled via a checkbox in the Raytrace Options dialog, Options tab. Accompanying the Fluorescence checkbox is an Insert File Source checkbox and a dropdown list with the choices Generate emission sources only and Immediately trace emission wavelengths. The Insert File Source checkbox allows you to link the generated fluorescence source files to your model; this link will be saved with the model. The choice in the drop-down list dictates whether the two stages of the fluorescence raytrace are performed separately or together.
Fluorescence ray trace
A fluorescence ray trace is done in two stages:
Stage 1: Initial rays are traced in the TracePro model. Any Discrete wavelengths defined in the Wavelength tab of the Apply Properties / Surface Source dialog box (that also happen to be within the excitation band of fluorescent materials in the model) will be involved in the fluorescence calculation. The end result of this stage is that source files containing fluorescent ray data are created.
Stage 2: Fluorescence rays are traced from the previously generated source files at the emission wavelengths defined in the Apply Properties / Fluorescence dialog box.

TRACEPRO®
TUTORIAL Fluorescence Example
Page 5 www.lambdares.com
Figure 4. Fluorescence modeling sequences showing where data is drawn from each step in the process.
Ray Trace uses Discrete Wavelengths defined in Analysis/Raytrace
Fluorescent Data defined in Fluorescent Property Definition: Excitation & Emission Tables
Ray Trace uses Emission Wavebands defined in Analysis/Raytrace
Create Model
Calculate Fluorescence & Create Fluorescent Source Files
Perform Analyses
Ray trace light that illuminatesfluorescent material
Ray trace light emanating from fluorescent material
You can trace fluorescence rays in either of two ways:
1) Immediately trace emission wavelengthsIn this method, at the conclusion of the first stage of the raytrace (the excitation raytrace), the second stage (the emission raytrace) will automatically begin, so that emission rays are “mixed in” with the excitation rays. All irradiance map features, candela plots, flux report, etc. report the fluorescence wavelength results along with the excitation wavelength results.
2) Generate emission sources onlyIn this method, the emission ray files are generated, but the emission rays will not be traced. You can trace them later at your discretion, by:
inserting the emission source file(s) into the model (or any model you choose) a. adding the discrete wavelengths corresponding to the fluorescence wavebands to the Discrete wavelengths in the b. Wavelengths tab of the Raytrace Options dialog boxremoving the excitation wavelengths from the list of discrete wavelengths (optional: these would be absorbed by the c. fluorescent material, but you may want to keep them for other reasons)modifying any surface sources in the model to have zero rays, or removing the surface sources completely, or excluding d. individual surface sources from the TracePro source tree (optional: you may want to keep surface sources in the analysis)unchecking the Fluorescence option in the Raytrace Option dialog boxe. initiating a ray trace making sure that Source Files are enabled in the tracef.
TRACEPRO®
TUTORIAL Fluorescence Example
Page 6 www.lambdares.com
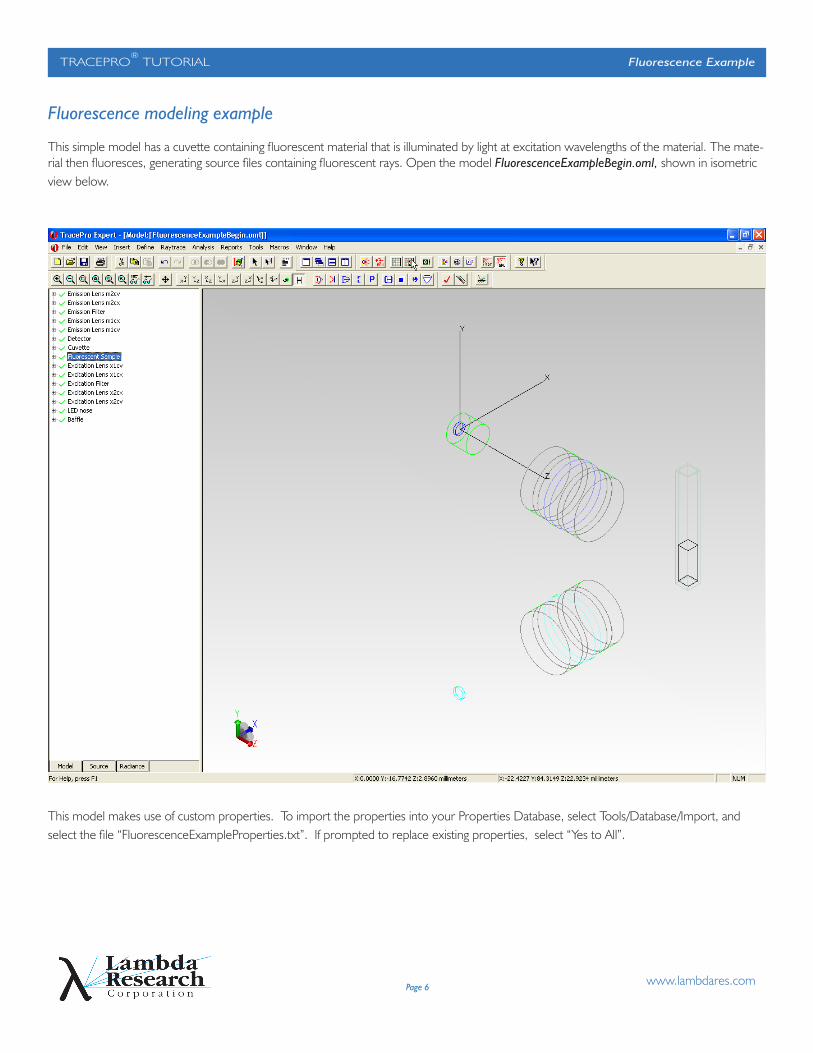
Fluorescence modeling example
This simple model has a cuvette containing fluorescent material that is illuminated by light at excitation wavelengths of the material. The mate-rial then fluoresces, generating source files containing fluorescent rays. Open the model FluorescenceExampleBegin.oml, shown in isometric view below.
This model makes use of custom properties. To import the properties into your Properties Database, select Tools/Database/Import, and select the file “FluorescenceExampleProperties.txt”. If prompted to replace existing properties, select “Yes to All”.

TRACEPRO®
TUTORIAL Fluorescence Example
Page 7 www.lambdares.com
The cuvette consists of a glass envelope and water with a fluorescent dye inside. to add fluorescent properties to the contents of the cuvette, we first select the object Fluorescent Sample in the model Tree, then select Define/Apply Properties, Material tab, and select a fluorescing property to apply. We will select the Alexa Fluor® 488 Dye from the Invitrogen_OrganicDyes as shown.
Enter the Quantum Efficiency, Peak Molar Extinction and Molar Concentration as shown in the dialog box.
Enter the emission wavelength range from .493 to .588 um with 5 bands selected. Set the wavelength ranges from 0 to .493 and from .588 to INF to have 0 bands.

TRACEPRO®
TUTORIAL Fluorescence Example
Page 8 www.lambdares.com
Before closing the Apply Properties dialog box, click the View Data button. This will open the Fluorescence Property Editor and display the properties of the Alexa Fluor® 488 dye. Select the Excitation Table tab at the bottom of the editor. By scrolling down in the table you can see that the Relative Excitation of this material has its peak (a value of approximately1.0) at a wavelength of 0.499 mm as shown. We will use this wavelength for the excitation ray trace.

TRACEPRO®
TUTORIAL Fluorescence Example
Page 9 www.lambdares.com
Select the Emmision Table tab in the editor and note that the material fluoresces between wavelengths of about 0.475 to 0.675 mm (a por-tion of the table is shown below).
TRACEPRO®
TUTORIAL Fluorescence Example
Page 10 www.lambdares.com
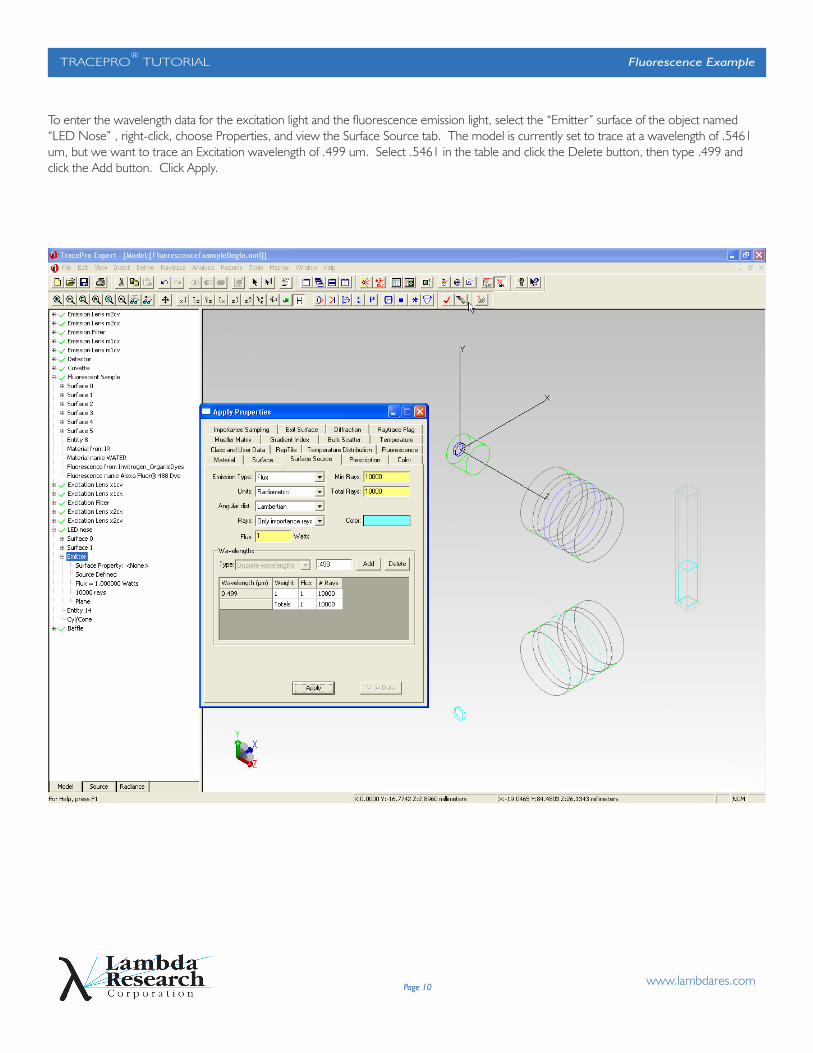
To enter the wavelength data for the excitation light and the fluorescence emission light, select the “Emitter” surface of the object named “LED Nose” , right-click, choose Properties, and view the Surface Source tab. The model is currently set to trace at a wavelength of .5461 um, but we want to trace an Excitation wavelength of .499 um. Select .5461 in the table and click the Delete button, then type .499 and click the Add button. Click Apply.

TRACEPRO®
TUTORIAL Fluorescence Example
Page 11 www.lambdares.com
Select the Options tab of the Raytrace Options dialog box (Raytrace Menu) and click the Fluorescence checkbox. In the list under the check-box, ignore the Insert File Source checkbox and select Immediatley trace emission wavelengths, and click Apply to set the selections. The dialog box should appear as below. By making this selection, we are choosing the two stages of the fluorescence ray trace to be run right after one another. We will trace rays at the excitation wavelength, TracePro will generate fluorescing sources corresponding to the data in the Fluorescence emission wavebands and then immediatly perform a second ray trace to trace the fluorescing rays.
Now we are ready to do the Fluorescence ray trace. Close all dialog boxes and windows if you have not already done so.

TRACEPRO®
TUTORIAL Fluorescence Example
Page 12 www.lambdares.com
To begin the ray trace, select Raytrace/Trace Rays. TracePro traces the excitation rays and saves the source of the emitted fluorescent rays in binary source files with extension “*.src”. The Message/Macro Window indicates that the File Sources were created for the Fluorescence emission rays. In the second stage of the raytrace, rays are emitted from the Fluorescence Emission File Sources.
Viewing the model after the rays have been traced is not very useful, there are so many rays that the model is difficult to see.

TRACEPRO®
TUTORIAL Fluorescence Example
Page 13 www.lambdares.com
However, you can reduce the number of rays shown in the model by utilizing the ray Sorting dialog (Analysis/Ray Sorting). Setting the Start-ing Rays to Display to 1% will give you a model layout that looks like this.

TRACEPRO®
TUTORIAL Fluorescence Example
Page 14 www.lambdares.com
AnalysisWe are mostly interested in rays that hit the detector. We can show these rays by first selecting the Detector surface on the Detector object, then selecting Analysis/Ray Sorting to open the Ray Sorting dialog. For Sort Type, select Selected Surface, and then click Update. Make sure that the % Starting Rays to Display is set to 100. The display will appear as in the figure below. We have traced only a few rays for this example, so only a few rays are shown hitting the detector. An accurate simulation would require many more rays.
We can display all output analyses in TracePro as for any other ray trace (an irradiance map, flux report, incident ray table, ...etc), but at this point there are so few rays to display, it will not serve any purpose. Next we will concentrate on forcing more rays to reach the detector.

TRACEPRO®
TUTORIAL Fluorescence Example
Page 15 www.lambdares.com
Adding importance samplingWe can increase the number of detected rays by simply tracing more rays in the excitation ray trace, but we can also specify importance sampling for the fluorescence emission rays to get better sampling at the detector. This means that whenever a ray in the excitation ray trace (stage 1 of the fluorescence ray trace) generates a fluorescence ray for a file source, one or more importance sampled rays will be generated also. To generate importance-sampled fluorescence emission rays, we must apply importance sampling to the object* that has the fluorescence property applied to it. To do this select the object named Fluorescent Sample in the Model Tree. Select Define/Apply Properties, Importance Sampling tab. We wish to importance sample towards the lenses leading to the detector, so enter the importance sampling target data shown in, and click Apply.
* The importance sampling should be applied to the object itself (not just individual surfaces of the object) because fluorescence is an object (not a surface) property.
TRACEPRO®
TUTORIAL Fluorescence Example
Page 16 www.lambdares.com
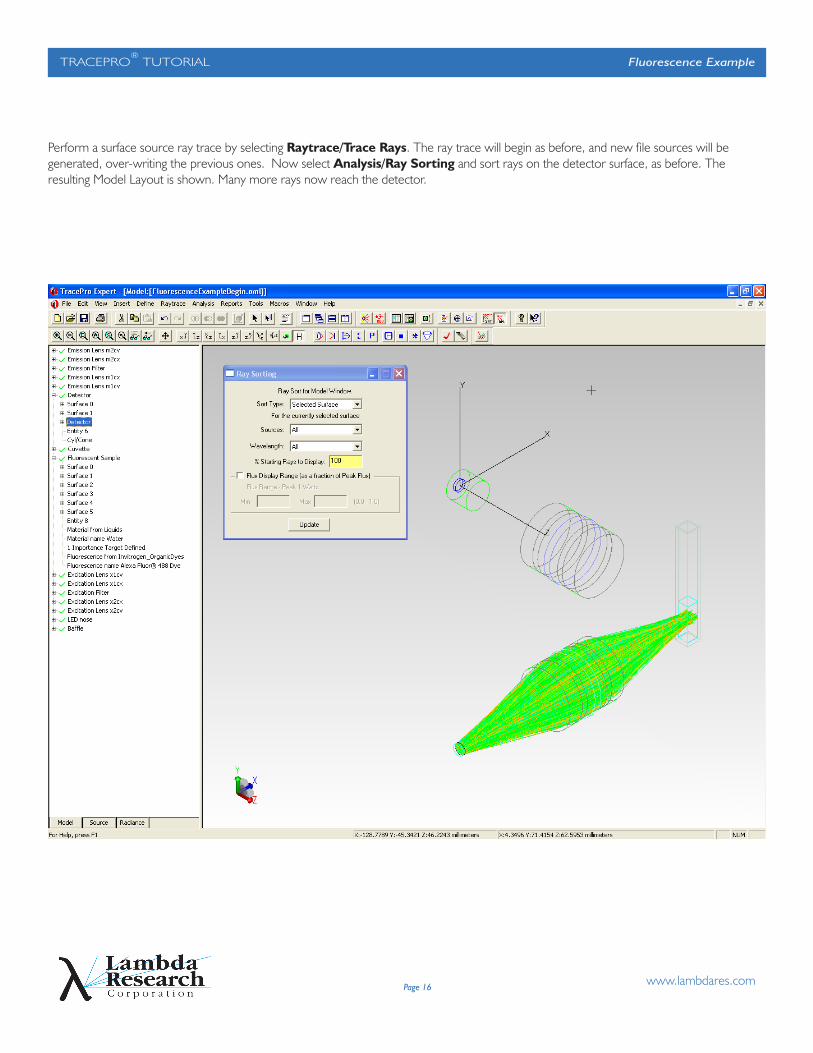
Perform a surface source ray trace by selecting Raytrace/Trace Rays. The ray trace will begin as before, and new file sources will be generated, over-writing the previous ones. Now select Analysis/Ray Sorting and sort rays on the detector surface, as before. The resulting Model Layout is shown. Many more rays now reach the detector.

TRACEPRO®
TUTORIAL Fluorescence Example
Page 17 www.lambdares.com
A log scale irradiance map shows that over 1000 rays now reach the Detector surface on the Detector.