Embed Size (px)
Citation preview

Flume Width and
Water Depth Effects in
Sediment-Transport
ExperimentsGEOLOGICAL SURVEY PROFESSIONAL PAPER 562-H

Flume Width and Water Depth Effects in Sediment-Transport ExperimentsBy GARNETT P. WILLIAMS
SEDIMENT TRANSPORT IN ALLUVIAL CHANNELS
GEOLOGICAL SURVEY PROFESSIONAL PAPER 562-H
UNITED STATES GOVERNMENT PRINTING OFFICE, WASHINGTON : 1970
UNITED STATES DEPARTMENT OF THE INTERIOR
WALTER J. HIGKEL, Secretary
GEOLOGICAL SURVEY
William T. Pecora, Director
For sale by the Superintendent of Documents, U.S. Government Printing Office Washington, D.C. 20402 - Price 55 cents (paper cover)

CONTENTS
Abstract _ _______________________________Introduction. _____________________________Equipment and measurements_____________
Flume______________________________Water supply and discharge measurement- Sediment infeed_ ______________________Sediment-transport measurement- _______Sediment.____________________________Depth measurement_________________Velocity._____________________________Slope__ _____________________________Bed-form characteristics._______________
Procedure__ _ ____________________________Results.._________________________________
General- _____.!__--__-____-___________
Page HI
1222222244445
Results ContinuedWater discharge.___________Mean velocity____________Slope.______--_-__-_-__-__Stream power._____________Bed forms.__-_-_-_--_----_
Bed-form heights. ______Bed-form wavelengths. __ Travel velocity.________
Resistance factors_______Sidewall correction procedure-
Test one.._ ____________Test two----....._-_.
Conclusions. ___________________References. _ ___-_-.____._______
Page
H688
1320202121222425262929
ILLUSTRATIONS
Page
FIGURE 1. Photographs of flume and associated equipment__.__._________________-______-_____--_--------_-_-_-__ H32-17. Graphs showing
2. Size distribution of sand__________________...__._.____.________________________---_-_-____---- 43. Relation of unit water discharge to unit sediment-transport rate______________________-___-_----_-_ 74. Mean velocity-unit transport relations.__________________________--_-__----------------_--------- 95. Mean velocity-unit transport relations----.-----.------------------------------------------------ 106. Slope-transport relations.___________________________-_________---_-_------------_-------------- 117. Adjustment factors to correct slope for sidewall effect._____-_______________-_-____------_---------- 128. Unit stream power-unit sediment-transport relations showing flume-width effect. _________________ 149. Adjustment factors to correct stream power for sidewall effect..__________________-__--_-__.------_-- 16
10. Single curve giving adjustment in slope, stream power, or shear stress to correct for flume sidewall influence. 1711. Unit transport rate adjustment factors to correct for flume sidewall eflfect____--___-_----------------- 1812. Unit stream power-unit sediment-transport relations in an infinitely wide channel.-----.-------------- 1913. Variation of total sediment-transport rate with different water depths, for constant stream power ____ 1914. Dune-height adjustment factors to correct for flume-width effect._______________--_-___-_----------- 2015. Flume-width effects on friction factor-transport relations.-__-__-___---_---------------------------- 2316. Velocity-slope test of sidewall correction procedure_____-_-___------------------------------------- 2717. Slope-transport rate test of sidewall correction procedure..__-_______-__---------------------------- 28
TABLES
TABLES 1, 2. Summary of experimental data:1. English units---.-.-.--.2. Metric units.-______-_..
PageH33
35


SEDIMENT TRANSPORT IN ALLUVIAL CHANNELS
FLUME WIDTH AND WATER DEPTH EFFECTS IN SEDIMENT-TRANSPORT EXPERIMENTS
By GARNETT P. WILLIAMS
ABSTRACT
This paper reports 177 flume experiments made in channels of different widths and water depths, the purpose being to find how the flume width and flow depth influence experimental results. No attempt was made to derive a sediment-transport formula. Sediment transport rates, grain size (.nearly uniform-sized par ticles with a 1.35 mm median diameter), water depth, .and chan nel width were controlled; the dependent variables were water discharge, mean velocity, slope (energy gradient), and bed-form characteristics. The flume widths were 0.25, 0.5, 1.0, and 2.0 ft. For each of these widths a series of runs (from slow to fast transport rates) was made at depths of 0.1, 0.3, 0.5, and 0.7 ft, that is at depths of about 20 to 160 grain diameters.
The narrower flume widths affected some variables signi ficantly, as explained below, but in a channel 2 ft wide flume sidewall effects very nearly or completely disappeared. Relations from the narrower channels, where wall effects were pronounced, could therefore be compared to the relations for wide channels in which wall effects were absent.
The channel width did not affect the unit water discharge-unit sediment-transport relations, at constant water depth. The rela tion between mean velocity and sediment-transport rate there fore was not affected by the flume width, because for a given width and depth the mean velocity varies directly with the dis charge. Water depth influenced these relations in that # greater discharge, and, at low transport rates, a faster velocity was needed to move sediment at a given rate as depth increased.
The slope or energy gradient decreased as the channel became wider, for a given unit transport rate and water depth. This means that any factors involving slope, such as stream power and shear stress, showed the same trend. By measuring the change in these dependent variables with channel width it was possible to get an empirical adjustment equation to correct the slope, stream power, and shear stress for the flume sidewall effect. Multiplying the laboratory value of slope, unit stream power, or shear stress by the adjustment factor
where D is water depth and W is flume width, gives the slope power, or shear for a wide channel (no sidewall influence) for the same water depth and unit sediment-transport rate.
Adjustment factors also are given for correcting the unit sediment-transport rate for sidewall effects, taking transport
rate as a dependent variable and stream power as the flow quan tity which governs transport rate.
For a given stream power or bed shear stress in wide channels (negligible wall effects) the sediment-transport rate increased fourfold to sixfold as the water depth was decreased from 0.7 to 0.1 ft. The curves suggest that this depth effect may disappear at depths of about 1.0 to 1.5 ft.
The flume width influenced the bed-form characteristics in various ways. Bed forms in wide channels can have heights and travel rates quite different from those observed in narrow chan nels. Except for runs at the 0.1-ft depth, bed forms did not be come three dimensional (curving from wall to wall) until the flume was widened to 1 ft (for fast transport rates) or 2 ft. Thus the disappearance of sidewall effects on the measured value of the energy gradient corresponded approximately with the ap pearance of three-dimensional bed forms.
Two different tests of the validity of the Johnson-Brooks side- wall correction procedure showed that for the present movable- bed data the degree of agreement between predicted and measured flow depths varied with the hydraulic or transport con ditions. Best agreement (predicted depths within about ±30 per cent of measured depths) usually occurred with channels ^ 1 ft wide and for runs which did not have extremely rough beds. A review of the literature suggests that for many rigid-boundary flows this sidewall correction procedure is reasonably reliable.
INTRODUCTION
The movement of solid particles by flowing water affects pollution, the rate at which land is eroded, the filling of reservoirs, and many related problems. Sedi ment transport is difficult to study in nature because of the problem of accurately measuring the travel rates of sand and gravel during most flow conditions. Many investigators have therefore resorted to artificial watercourses (flumes) in the laboratory. Flume experi ments use water and sediment in quantities small enough to control, and this valuable control of variables means a better understanding of the role of individual factors.
Each laboratory, understandably, has built equip ment to suit its particular interests, capacity, and needs. The sediment-transport experiments reported in the lit erature therefore differ in type and size of apparatus
Hi

H2 SEDIMENT TRANSPORT IN ALLUVIAL CHANNELS
used, experimental procedure, and in other respects. Consequently the data from any one investigation us ually do not agree with the data of others. The present study explores the questions of how the results of sedi ment-transport experiments can be affected by flume width and water depth two features which usually have varied randomly from one study to the next. An equally important purpose of the investigation was to make some progress toward relating flume data to natural-river conditions by evaluating flume sidewall effects. This study makes no attempt to derive or test a sediment-transport formula.
The encouragement and advice of Ealph A. Bagnold have been an invaluable support throughout this entire investigation. I am grateful to William W. Emmett, Harold P. Guy, Everett V. Eichardson, Neil L. Cole- man, Edward J. Gilroy, Emmett M. Laursen, Jacob Davidian, and William H. Kirby for helpful sugges tions or generous assistance.
EQUIPMENT AND MEASUREMENTS
FLUME
Williams (1967) described in detail the 52-ft-long nonrecirculating flume (fig. 1) used for the experiments. The flume could be tilted from horizontal to a maximum slope of about 0.035 ft per ft, and the maximum usable width was 3.9 ft. For most of the experiments both walls were of transparent plastic (Plexiglas), although for some tests at widths of 0.25 and 0.5 ft one wall consisted of smooth plywood. The smooth wood surface probably was not appreciably rougher than the plastic.
WATER SUPPLY AND DISCHARGE MEASUREMENT
Three pipelines (diameters 8, 6, and 4 inches) sup plied water to the flume. Water destined for the 6- and 4-inch lines went from the sump to a constant-head tank and then flowed through the pipelines to the flume. For the 8-inch line a second pump sent water directly from the sump to the stilling tank at the head of the flume. A valve in each pipeline regulated the flow rate.
Elbow meters precalibrated at the Georgia Institute of Technology measured the discharge in the 6- and 4-inch lines. Another calibration of the meters in place (Washington, D.C.) near the end of the investigation showed that they were accurate to ±1.8 percent. The 8-inch line had a factory-calibrated orifice plate. For four runs at the very lowest discharges (depth 0.1 ft in a 0.25 ft-wide channel), the discharge had to be measured volumetrically. Maximum available dis charges were 3.5, 2.0, and 0.8 cfs (cubic feet per second) in the 8-, 6-, and 4-inch lines, respectively.
SEDIMENT INFEED
In the early stages of the investigation a submerged elevator just upstream from the flume test section fed sediment into the stream. This feed method was only partly satisfactory. Although the sand entered the test section at a constant rate, a minor amount of sediment leakage along the sides of the elevator prevented a computation of the exact sediment infeed rate. Sec ondly, faster sediment-transport rates could not be studied because the 4-ft-long by 2.5-ft-deep sand supply was used up before a run could be completed. Changing to a vibrating feeder (fig. 1) partway through the study eliminated these problems, 'and this "drop-in" feed method turned out to be much better than the elevator system. The slowest infeed rates required a second vi brating feeder, very small, and this is not shown in figure 1.
SEDIMENT-TRANSPORT MEASUREMENT
The water-sediment mixture leaving the flume fell into a sediment-collection box (figure 1). Water escaped through screens along the top of the box while all the sand settled to the bottom. Weighing the box and its contents periodically in place gave the sediment-trans port rate (total sediment load) in submerged weight.
During the early stages of the study, the volume of the collection box (which sat on a platform scale) was 9 cubic feet, but this box proved to be too small for transport rates greater than about 0.2 Ib per sec-ft. The 44-cubic-foot collection box adopted partway through the investigation was much better. This larger box hung from a crossbeam, and the scale sat to one side of the box; one support of the crossbeam rested on the scale platform, and the recorded weight was adjusted by an appropriate factor to get the actual weight of the box and its contents.
SEDIMENT
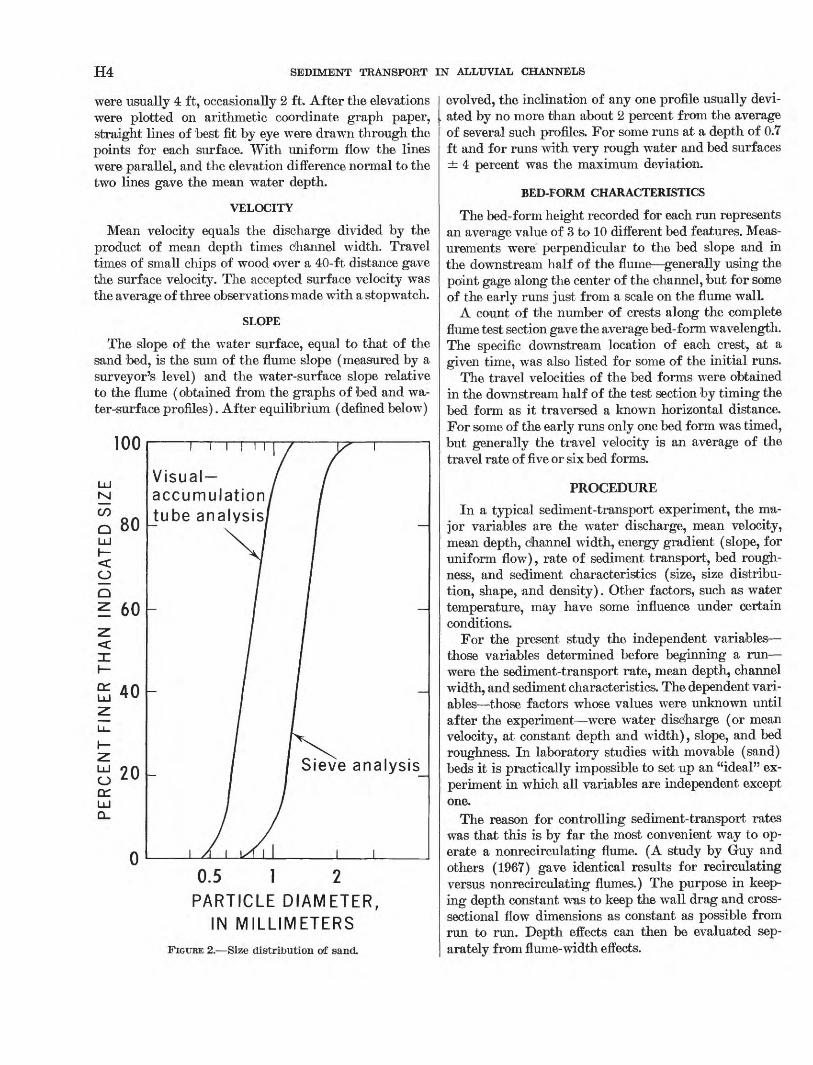
The quartz sand used for the experiments was fairly uniform in size (2 percent <0.8 mm and 2 percent >2.0 mm) with a median sieve diameter of 1.35 mm (fig. 2). Transported material trapped in the collection box had virtually the same size distribution as the material re maining on the flume bed. The average fall velocity for 75 randomly selected grains was 14.5 centimeters per second at a water temperature of 31.5° C. Most of the grains were not particularly spherical, and their edges were of intermediate roundness.
DEPTH MEASUREMENT
Elevations of the water- and bed-surfaces were meas ured to the nearest 0.001 ft with a point-gage at regular intervals along the test section, beginning at station 3.0 ft and ending at station 49.0 ft. The horizontal intervals

FLUME WIDTH AND WATER DEPTH EFFECTS H3
FIGURE 1. Flume and associated equipment. A, General view looking downstream with elevator feed system in use. B, Upstream view showing elevator feed system and preliminary channel. C, Measurement of sediment-transport rates with collection box resting on scale platform. D, General view looking downstream with "drop-in" feed system. E, Upstream view of "drop-in" feeder. F, Measurement of sediment-transport rates using the suspended collection box.
H4 SEDIMENT TRANSPORT IN ALLUVIAL CHANNELS
were usually 4 ft, occasionally 2 ft. After the elevations were plotted on arithmetic coordinate graph paper, straight lines of best fit by eye were drawn through the points for each surface. With uniform flow the lines were parallel, and the elevation difference normal to the two lines gave the mean water depth.
VELOCITY
Mean velocity equals the discharge divided by the product of mean depth times channel width. Travel times of small chips of wood over a 40-ft distance gave the surface velocity. The accepted surface velocity was the average of three observations made with a stopwatch.
SLOPE
The slope of the water surface, equal to that of the sand bed, is the sum of the flume slope (measured by a surveyor's level) and the water-surface slope relative to the flume (obtained from the graphs of bed and wa ter-surface profiles). After equilibrium (defined below)
100
rsj CO
<o
80
60
40
LUo ccLU Q_
0
Visual- accumulation tube analysis
Sieve analysis
0.5 1 2PARTICLE DIAMETER,
IN MILLIMETERSFIGURE 2. Size distribution of sand.
evolved, the inclination of any one profile usually devi ated by no more than about 2 percent from the average of several such profiles. For some rui is at a depth of 0.7 ft and for runs with very rough water and bed surfaces ± 4: percent was the maximum deviation.
BED-FORM CHARACTERISTICS
The bed-form height recorded for each run represents an average value of 3 to 10 different bed features. Meas urements were perpendicular to the bed slope and in the downstream half of the flume generally using the point gage along the center of the channel, but for some of the early runs just from a scale on the flume wall.
A count of the number of crests along the complete flume test section gave the average bed-form wavelength. The specific downstream location of each crest, at a given time, was also listed for some of the initial runs.
The travel velocities of the bed forms were obtained in the downstream half of the test section by timing the bed form as it traversed a known horizontal distance. For some of the early runs only one bed form was timed, but generally the travel velocity is an average of the travel rate of five or six bed forms.
PROCEDURE
In a typical sediment-transport experiment, the ma jor variables are the water discharge, mean velocity, mean depth, channel width, energy gradient (slope, for uniform flow), rate of sediment transport, bed rough ness, and sediment characteristics (size, size distribu tion, shape, and density). Other factors, such as water temperature, may have some influence under certain conditions.
For the present study the independent variables those variables determined before beginning a run were the sediment-transport rate, mean depth, channel width, and sediment characteristics. The dependent vari ables those factors whose values were unknown until after the experiment were water discharge (or mean velocity, at constant depth and width), slope, and bed roughness. In laboratory studies with movable (sand) beds it is practically impossible to set up an "ideal" ex periment in which all variables are independent except one.
The reason for controlling sediment-transport rates was that this is by far the most convenient way to op erate a nonrecirculating flume. (A study by Guy and others (1967) gave identical results for recirculating versus nonrecirculating flumes.) The purpose in keep ing depth constant was to keep the wall drag and cross- sectional flow dimensions as constant as possible from run to run. Depth effects can then be evaluated sep arately from flume-width effects.

FLUME WIDTH AND WATER DEPTH EFFECTS H5
There was no convenient way of regulating the water temperature. It varied little if at all during a single run but ranged from 8° to 28 °C during the investi gation. The study by Colby and Scott (1965) suggests that such temperature changes should not significantly influence the transport rates of coarse sand and that temperature effects on transport rate are relatively minor compared to the effects of mean velocity and shear. However, no one has yet made a carefully con trolled comprehensive study with different grain sizes to determine what influence water temperature has on sediment-transport rates.
An individual run began with the sand bed scraped to approximately a flat surface. The flume slope was set at the estimated probable equilibrium slope. The next step was to start the steady sediment infeed, thus fixing the unit sediment-transport rate for the run. At the same time the water discharge was turned on and ad justed to get the desired depth. The range of acceptance for water depth was about ±7 percent of the desired mean depth. I then took repeated water and bed surface profiles, and if necessary changed the discharge and (or) the flume tailgate-setting to get a uniform flow of the desired depth. The requirements for equilibrium were (a) constant slope with time and (b) no net gain or loss of sand in the flume with time. With the elevator feed system both of these requirements were judged by com paring successive sets of profiles and successive transport measurements, as with recirculating flumes. The drop-in feed method made possible an additional verification, namely sediment input rate=sediment output rate. The run and measurements of the basic variables began after equilibrium conditions with uniform flow developed.
Sediment-transport measuring periods were always long enough for many bed forms to migrate out of the flume. These relatively long collecting periods assured a reliable measurement of the sediment-transport rate.
The final values of depth and of slope relative to the flume in nearly all cases are an average of several sets of profiles.
Eeproducibility of runs was good.A few runs using the drop-in feed method for situa
tions studied earlier with the rising-platform system showed that the feed method did not significantly in fluence the experimental results.
The experiments for each channel width and mean depth consisted of a series of runs from slow to fast sediment-transport rates. This was done for four con stant water depths, at a fixed width. The whole process was then repeated for a different channel width, using the same depths as before. Transport rates and water discharges were reckoned in terms of unit (foot) width for comparison purposes. I systematically widened the
373-261 O 70 2
channel and made more runs until reaching the limits of the equipment or until the chief dependent variables (unit discharge and slope) no longer changed signifi cantly with increasing flume width for a given water depth and unit transport rate.
The depths and widths studied were:
Width (ft.) 0.25 0.5 1.0 2.0 3.9
Depth (ft.)0.1, 0.3, 0.5, and 0.7 0.1, 0.3, 0.5, and 0.7 0.1, 0.3, 0.5, and 0.7 0.1, 0.3, 0.5, and 0.7 0.7 (fiveruns).
No attempt was made to directly determine threshold flow conditions at which sediment transport would just begin.
RESULTS
GENERAL
Tables 1 and 2 at the end of the paper give all the experimental data, arranged in order of increasing sedi ment-transport rates for each set of channel dimensions. All measurements except for water temperature were taken in English-system units, so table 2 is merely the basic data converted into metric units.
For every run the sediment moved only as bedload, according to visual observations. The results may have been different for grains transported in suspension, and experiments of the present type should be repeated with finer (and coarser) grains and probably with hetero geneous mixtures too.
At the fastest transport rates (flat-bed stage) the grains, according to visual estimation, moved within a zone no more than about 1 centimeter high (about 8 grain diameters) regardless of water depth. The height of this layer of moving grains decreased as transport rate decreased.
The many data obtained in this study could be ana lyzed in various ways, but the discussion here will deal mainly with plots of the individual variables, in an at tempt to isolate flume-width and water-depth effects.
Any influence of the channel width should be dis closed by plotting each of the dependent variables (wa ter discharge, mean velocity, slope, and bed-form char acteristics) as functions of the independent variable, sediment-transport rate, for a constant depth. The same plots for a constant width should reveal the effect of water depth. Such diagrams are intended only to relate a dependent variable to the independent variables, as is customary with experimental data. The purpose is not to recommend any one of the dependent variables by itself as an important indicator of sediment-trans port rate.
H6 SEDIMENT TRANSPORT IN ALLUVIAL CHANNELS
WATER DISCHARGE
GENERAL
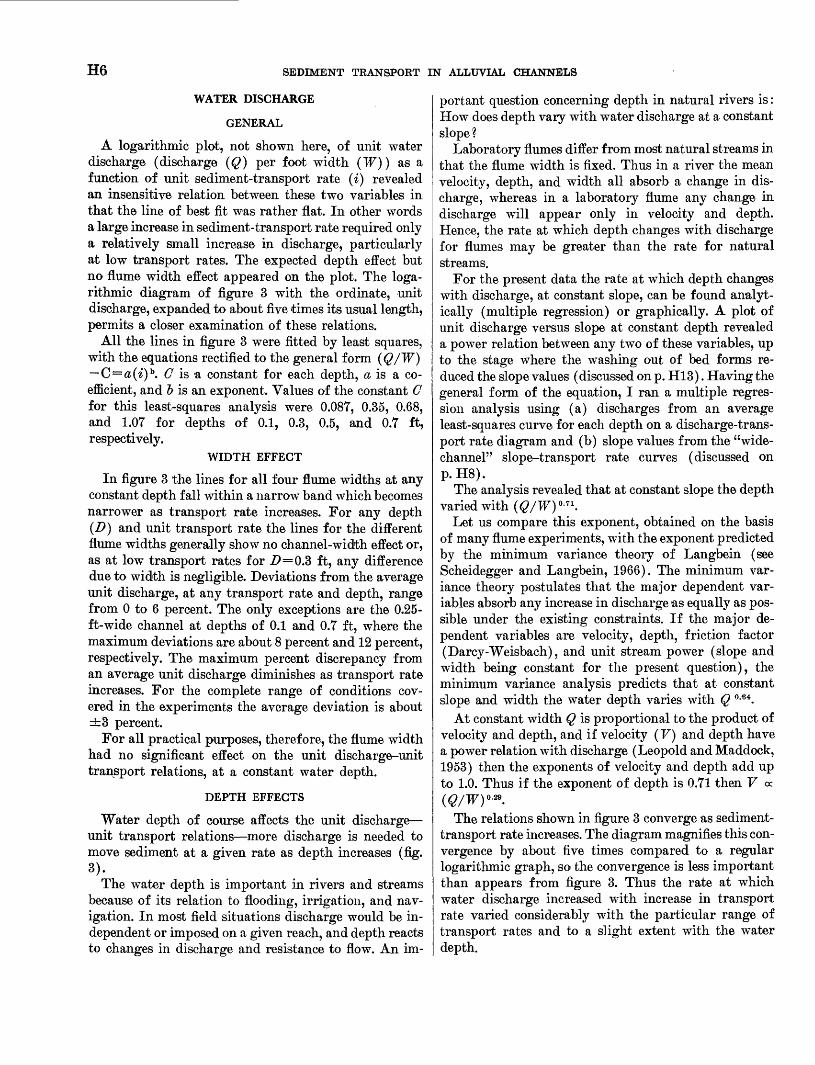
A logarithmic plot, not shown here, of unit water discharge (discharge (Q] per foot width (TF)) as a function of unit sediment-transport rate (i) revealed an insensitive relation between these two variables in that the line of best fit was rather flat. In other words a large increase in sediment-transport rate required only a relatively small increase in discharge, particularly at low transport rates. The expected depth effect but no flume width effect appeared on the plot. The loga rithmic diagram of figure 3 with the ordinate, unit discharge, expanded to about five times its usual length, permits a closer examination of these relations.
All the lines in figure 3 were fitted by least squares, with the equations rectified to the general form (Q/W] C=a(i) b. O is -a constant for each depth, a is a co efficient, and & is an exponent. Values of the constant O for this least-squares analysis were 0.087, 0.35, 0.68, and 1.07 for depths of 0.1, 0.3, 0.5, and 0.7 ft, respectively.
WIDTH EFFECT
In figure 3 the lines for all four flume widths at any constant depth fall within a narrow band which becomes narrower as transport rate increases. For any depth (Z>) and unit transport rate the lines for the different flume widths generally show no channel-width effect or, as at low transport rates for Z>=0.3 ft, any difference due to width is negligible. Deviations from the average unit discharge, at any transport rate and depth, range from 0 to 6 percent. The only exceptions are the 0.25- ft-wide channel at depths of 0.1 and 0.7 ffc, where the maximum deviations are about 8 percent and 12 percent, respectively. The maximum percent discrepancy from an average unit discharge diminishes as transport rate increases. For the complete range of conditions cov ered in the experiments the average deviation is about ±3 percent.
For all practical purposes, therefore, the flume width had no significant effect on the unit discharge-unit transport relations, at a constant water depth.
DEPTH EFFECTS
Water depth of course affects the unit discharge unit transport relations more discharge is needed to move sediment at a given rate as depth increases (fig. 3).
The water depth is important in rivers and streams because of its relation to flooding, irrigation, and nav igation. In most field situations discharge would be in dependent or imposed on a given reach, and depth reacts to changes in discharge and resistance to flow. An im
portant question concerning depth in natural rivers is : How does depth vary with water discharge at a constant slope ?
Laboratory flumes differ from most natural streams in that the flume width is fixed. Thus in a river the mean velocity, depth, and width all absorb a change in dis charge, whereas in a laboratory flume any change in discharge will appear only in velocity and depth. Hence, the rate at which depth changes with discharge for flumes may be greater than the rate for natural streams.
For the present data the rate at which depth changes with discharge, at constant slope, can be found analyt ically (multiple regression) or graphically. A plot of unit discharge versus slope at constant depth revealed a power relation between any two of these variables, up to the stage where the washing out of bed forms re duced the slope values (discussed on p. H13) . Having the general form of the equation, I ran a multiple regres sion analysis using (a) discharges from an average least-squares curve for each depth on a discharge-trans port rate diagram and (b) slope values from the "wide- channel" slope-transport rate curves (discussed on p.H8).
The analysis revealed that at constant slope the depth varied with (0/TF) 0 - 71 .
Let us compare this exponent, obtained on the basis of many flume experiments, with the exponent predicted by the minimum variance theory of Langbein (see Scheidegger and Langbein, 1966). The minimum var iance theory postulates that the major dependent var iables absorb any increase in discharge as equally as pos sible under the existing constraints. If the major de pendent variables are velocity, depth, friction factor (Darcy-Weisbach), and unit stream power (slope and width being constant for the present question), the minimum variance analysis predicts that at constant slope and width the water depth varies with Q °-64 .
At constant width Q is proportional to the product of velocity and depth, and if velocity ( V) and depth have a power relation with discharge (Leopold and Maddock, 1953) then the exponents of velocity and depth add up to 1.0. Thus if the exponent of depth is 0.71 then V ex
The relations shown in figure 3 converge as sediment- transport rate increases. The diagram magnifies this con vergence by about five times compared to a regular logarithmic graph, so the convergence is less important than appears from figure 3. Thus the rate at which water discharge increased with increase in transport rate varied considerably with the particular range of transport rates and to a slight extent with the water depth.

FLUME WIDTH AND WATER DEPTH EFFECTS H7
UNIT SEDIMENT-TRANSPORT RATE, IN KILOGRAMS (IMMERSED WEIGHT) PER SECOND PER METER WIDTH
0.001 0.01 0.1 1.0 10.0
- 300.0
0.2 -
10.0 0.1'
0.0001 0.001 0.01 0.1 1.0 10.0
UNIT SEDIMENT-TRANSPORT RATE, IN POUNDS (IMMERSED WEIGHT) PER SECOND PER FOOT WIDTH
FIGTTBE 3. Relation of unit water discharge to unit sediment-transport rate, at constant water depth(ordinate scale magnified about fivefold).

H8 SEDIMENT TRANSPORT IN ALLUVIAL CHANNELS
MEAN VELOCITY
WIDTH EFFECT
For any constant flume width and water depth the mean velocity varies directly with the discharge. Thus a regular logarithmic plot (not included here) showed that mean velocity was not very sensitive to changes in sediment-transport rate, as was true with discharge.
Figure 4, with the mean-velocity scale magnified about five times, shows the velocity-transport relations for the various channel widths at constant water depth. For any one depth there is no distinction on the basis of flume width. The single line of best-fit for each depth was fitted by least squares. The range of scatter in ve locity values is ±6 percent, for any transport rate and depth, except for Z? = 0.1 ft where the velocity for some runs is 12 percent greater than that indicated by the curve. As with the unit discharge-unit trans port relations, then, the flume width had no significant influence on the velocity-transport relations, at a con stant water depth.
DEPTH EFFECT
Figure 5 contains the four lines of best fit from fig ure 4, to see if water depth affects the velocity-trans port relations. The strange result is that water depth had a pronounced influence at low transport rates but this influence gradually diminished as transport rate increased. At mean velocities greater than about 4 fps (feet per second) the depth effect disappeared for all practical purposes. At slower mean velocities, those common in flume studies, the curves diverge widely on the basis of water depth.
The depth effect shown here at low mean velocities agrees qualitatively with the remarks of Colby (1964). Colby analyzed the influence of depth on the mean ve locity-sediment transport relation but confined his attention to medium and fine sands. His graphs can not readily be compared to the present data because of the uncertainties in extrapolating his curves to the coarse sand range.
SLOPE
WIDTH EFFECT
Figure 6 shows the flume width effects on the slope- transport relations for each of the four constant water depths. Where the relations follow a power law, that is at intermediate transport rates, the lines for all widths and depths were fitted by least squares with the con straint that for a given depth the lines for all four widths are mutually parallel. The curved lines at the extremes of the transport range were fitted by eye.
The slope or energy gradient ($) is the loss of energy
(in foot-pounds per pound of fluid) to overcome fric tion per unit length of stream. As the channel becomes wider at a constant depth the sidewalls retard a lesser proportion of the cross-sectional flow area. This lesser retardation means a lesser rate of energy loss, that is, a flatter slope. The decrease in slope that occurred with increasing flume width (fig. 6) was greatest between the 0.25- and 0.5-ft-wide channels and gradually dimin ished in wider channels. According to the least-squares analyses, the slope values in the 2-ft-wide channel were 0.0, 2.1, 2.9, and 7.7 percent less than those in the 1-ft- wide channel for depths of 0.1, 0.3, 0.5 and 0.7 ft, re spectively (at any constant transport rate within the least-squares range). This result suggests that further increases in flume width would bring even lesser changes (if any) in slope values.
To find the slope in an infinitely wide channel, for a given depth and unit sediment-transport rate, S was plotted as a function of W/D. More precisely, instead of W/D the abscissa was a parameter
X=
because in this manner X=l when W/D= infinity. Then a simple extrapolation of the curve from the four experimental points such that the curve levelled off at X= 1 gave the value of S in an infinitely wide channel, for the given depth and unit transport rate. This method indicated that slope values in a channel of infinite width were about 1, 4, and 5 percent less than the slopes in the 2-ft-wide channel for depths of 0.3, 0.5, and 0.7 ft, iespectively. (The five runs at W= 3.9 ft for D=0.7 ft were omitted in this analysis because of the very limited range of transport rates covered by these runs.) The dashed lines in figure 6 represent these extrapolated slope-transport relations for infinitely wide channels.
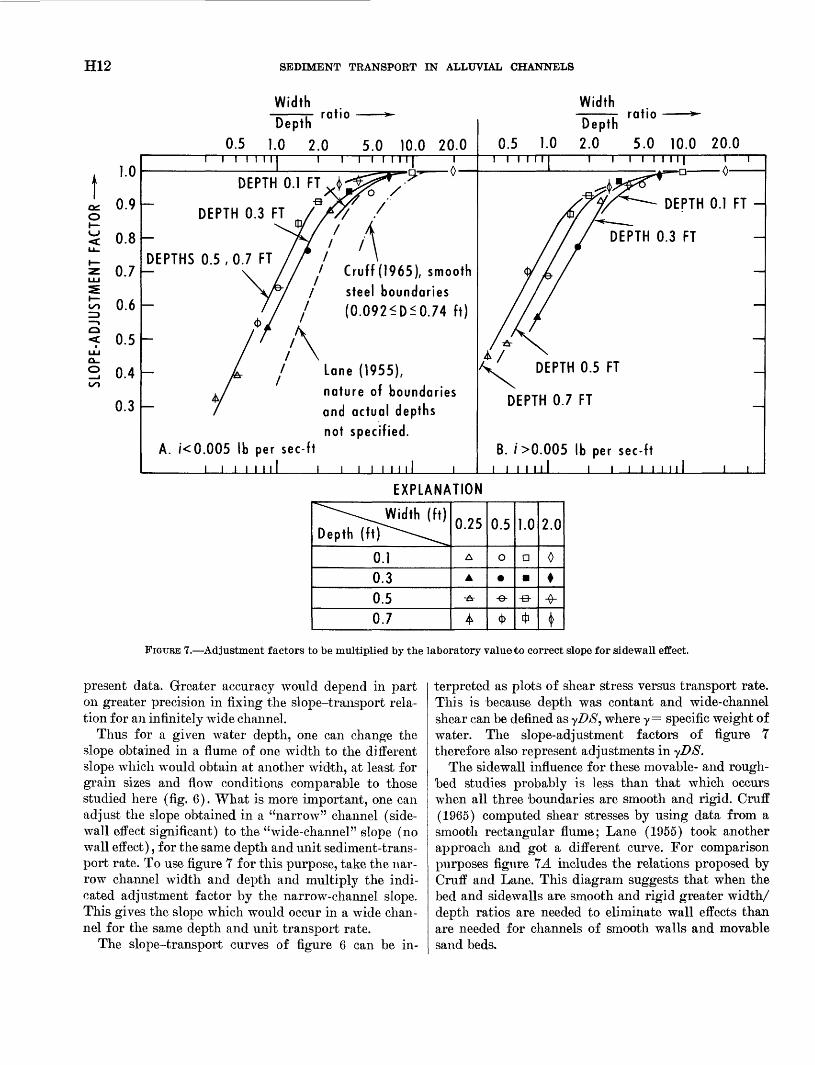
How much adjustment should be made to the slope value found in a narrow channel (laboratory flume) to find the slope that would pertain to the same depth and sediment-transport rate in a wide channel (for example, a natural river)? In the absence of any theory which corrects the equilibrium slope for the sidewall (flume width) effect the present data provide the necessary "adjustment factors." For example, at a depth of 0.5 ft and unit transport rate of 0.01 Ib per sec-ft, the slope in the 0.5-ft-wide channel was 0.00326 whereas in a channel of infinite width the slope would be 0.00224. One must therefore adjust the narrow channel slope by a factor of S;S or 0.69. Figure 7, based on computa tions made in this manner, shows adjustment curves for each of the four depths. All lines on figure 7 were fitted by eye.

UNIT
SED
IMEN
T-TR
ANSP
OR
T RA
TE,
IN K
ILO
GRA
MS
(IMM
ERSE
D W
EIG
HT)
PER
SECO
ND P
ER M
ETER
WID
TH
0.00
1 0.
01
0.1
1.0
10.0
UNIT
SED
IMEN
T-TR
ANSP
OR
T RA
TE,
IN K
ILO
GRA
MS
(IMM
ERSE
D W
EIG
HT)
PER
SECO
ND P
ER M
ETER
WID
TH
0.00
1 0.
01
0.1
1.0
10.0 -
200.
0
0.00
01
0.00
1 0.
01
0.1
1.0
10.0
UNIT
SED
IMEN
T-TR
ANSP
OR
T RA
TE,
IN P
OUN
DS (
IMM
ERSE
D W
EIG
HT)
PER
SECO
ND P
ER F
OOT
WID
TH
0.00
01
0.00
1 0.
01
0.1
1.0
10.0
UNIT
SED
IMEN
T-TR
ANSP
ORT
RAT
E, I
N PO
UNDS
(IM
MER
SED
WEI
GHT
) PE
R SE
COND
PER
FOO
T W
IDTH
FIG
TOE
4._M
ean
velo
city
-uni
t tr
ansp
ort
rela
tion
s,
at
cons
tant
wat
er
dept
h (m
ean-
velo
city
sc
ale
mag
nifi
ed
abou
t fi
vefo
ld).
w CO

H10 SEDIMENT TRANSPORT IN ALLUVIAL CHANNELS
oz o
z <
8.0
7.0
6.0
5.0
= 4.0
j jr
!- 3.0
2.0
UNIT SEDIMENT-TRANSPORT, IN KILOGRAMS (IMMERSED WEIGHT) PER SECOND PER METER WIDTH
______0.001_________O.QI__________0.1__________U)_________10.0 | I | I r=\ 300.0
DEPTH 0.3 FT
DEPTH 0.1 FT
200.0
oz o
100.0
90.0
80.0
70.0
60.0
50.0
40.0
1.00.0001 0.001 0.01 0.1 1.0 10.0
UNIT SEDIMENT-TRANSPORT RATE, IN POUNDS (IMMERSED WEIGHT) PER SECOND PER FOOT WIDTH
FIGURE 5. Mean velocity-unit transport relations showing depth effect (mean-velocity scale magnified about fivefold).
The lines on the slope-transport diagrams (fig. 6) seem to diverge at the lowest sediment-transport rates and then remain equidistant from one another at trans port rates greater than about 0.005 Ib per sec-ft. The appropriate adjustment factor therefore depends in part on the sediment-transport rate. One set of curves (fig. IB) suffices for rates greater than about 0.005 Ib per sec-ft. For lesser rates a slightly different adjustment factor for each transport rate should be given, accord ing to figure 6; however, because of the greater chance
of error in slope measurements at extremely flat slopes only one set of curves (fig. 7J.), representing average adjustment factors for any transport rate less than about 0.005 Ib/sec-ft, is given here. This introduces some possible error for the extreme conditions of deep depths (0.5, 0.7 ft) in very narrow channels (0.25, 0.5 ft) at extremely low transport rates (<0.001 Ib per sec-ft). Aside from these rare conditions the wide-chan nel slopes obtained by the adjustment factors of figure 7 are accurate to within about dr five percent for the

FLUME WIDTH AND WATER DEPTH EFFECTS
UNIT SEDIMENT-TRANSPORT RATE, IN KILOGRAMS (IMMERSED WEIGHT) PER SECOND PER METER WIDTH 0.0001 0.001 0.01 0.1 1-0 10.0
Hll
o o
Width 1.0 ft
Widths 2.0 and 3.9 ft
0.0001 0.001 0.01 0.1 1.0 10.0
UNIT SEDIMENT-TRANSPORT RATE, IN POUNDS (IMMERSED WEIGHT) PER SECOND PER FOOT WIDTH
FIGURE 6. Slope-transport relations showing influence of flume width.
H12 SEDIMENT TRANSPORT IN ALLUVIAL CHANNELS
Width
Depthratio
0.5 1.0 2.0 5.0 10.0 20.0
Width
Depthratio
0.5 1.0 2.0 5.0 10.0 20.0 0.9
0.8
0.7
0.6
< 0.5LLJ
0.4
0.3
I i i i i 11 i i i i i 11
DEPTH 0.1 FT-B
DEPTH 0.3 FT
DEPTHS 0.5,0.7 FT
DEPTH 0.1 FT
DEPTH 0.3 FT
/ Cruff(1965), smooth
/ steel boundaries(0.092<D<0.74 ft)
/ Lane (1955),
nature of boundaries and actual depths
not specified. A. K0.005 Ib per sec-ft
_______I I I I I I I I I 1 I I I I I I I L
DEPTH 0.5 FT
DEPTH 0.7 FT
B. />0.005 Ib per sec-fti i
EXPLANATION
Depth (ft)Width (ft)
0.10.3
0.5
0.7
0.25 0.5 1.0 2.0
FIGURE 7. Adjustment factors to be multiplied by the laboratory value to correct slope for sidewall effect.
present data. Greater accuracy would depend in part on greater precision in fixing the slope-transport rela tion for an infinitely wide channel.
Thus for a given water depth, one can change the slope obtained in a flume of one width to the different slope which would obtain at another width, at least for grain sizes and flow conditions comparable to those studied here (fig. 6). What is more important, one can adjust the slope obtained in a "narrow" channel (side- wall effect significant) to the "wide-channel" slope (no wall effect), for the same depth and unit sediment-trans port rate. To use figure 7 for this purpose, take the nar row channel width and depth and multiply the indi cated adjustment factor by the narrow-channel slope. This gives the slope which would occur in a wide chan nel for the same depth and unit transport rate.
The slope-transport curves of figure 6 can be in
terpreted as plots of shear stress versus transport rate. This is because depth was contant and wide-channel shear can be defined as yDS, where y= specific weight of water. The slope-adjustment factors of figure 7 therefore also represent adjustments in yDS.
The sidewall influence for these movable- and rough- bed studies probably is less than that which occurs when all three boundaries are smooth and rigid. Gruff (1965) computed shear stresses by using data from a smooth rectangular flume; Lane (1955) took another approach and got a different curve. For comparison purposes figure 1A includes the relations proposed by Gruff and Lane. This diagram suggests that when the bed and sidewalls are smooth and rigid greater width/ depth ratios are needed to eliminate wall effects than are needed for channels of smooth walls and movable sand beds.
FLUME WIDTH AND WATER DEPTH EFFECTS H13
DEPTH EFFECT
The slope-transport curves of figure 6 could be used to obtain a depth effect for a constant flume width, but the resulting relation would include the effect of a changing discharge. A more pertinent question about natural streams is: How does depth vary with slope at constant water discharge? The multiple regression analysis mentioned earlier disclosed that for the present data depth varied with /S^-28, at a constant discharge. The negative exponent means that for a given discharge the depth decreases if the slope steepens.
What value would the minimum variance theory assign to this exponent? If the major dependent vari ables are velocity, depth, friction factor, and unit stream power (discharge and channel width being con stant), the minimum variance theory predicts that depth varies with /S^0- 27 , for a constant discharge and width.
The slope values at depths of 0.3 and 0.5 ft (fig. 6) show a curious change in trend at high transport rates (0.2 to 0.5 Ib per sec-ft). In this range of transport rates the slopes tend to become constant (or even decrease slightly) as transport rate increases. At higher trans port rates the slopes resume increasing. Brooks (1958) reported a similar pattern for slope values; however, he used fine sands, for which the nonuniqueness of slope values covered a much wider range of transport rates. For the coarse sand used here the relatively short range of transport rates affected by the nonuniqueness reduces the importance of this phenomenon.
A nonuniqueness not uncommonly appears in natural streams having beds of medium and fine sand (Dawdy, 1961). There, however, the effect shows up in the water depth rather than in the slope because a river slope usually stays virtually constant.
There probably are not enough runs at the pertinent sediment-transport rates to determine how, if at all, the channel width affected the nonuniqueness in slopes. There is a depth effect in that the phenomenon is absent at D= 0.1 ft but shows up at D= 0.3 ft.
One feature of the bed configuration should be men tioned at this time. The bed forms progressed from dunes to antidunes to flat bed as transport rate in creased. (With finer sands the only flat-bed stage that has been reported for flume studies occurs between the dune and antidune ranges rather than after the anti- dunes.)
The flat-bed stage arrived gradually: as i increased, the flat bed occupied a greater upstream portion of the flume, with antidunes occupying a correspondingly shorter and shorter reach at the downstream end. The washed-out or flat-bed zone upstream had a shallower depth and flatter slope than the downstream antidune
373-2610 70 3
reach. (In some ways this is similar to the "sand wave" described by Vanoni and Brooks, 1957, p. 41.) For this particular range of transport rates, therefore, a uniform flow over the full flume test section was not possible. The slope profiles drawn for these runs were single "aver age" straight-line profiles representing the whole flume, and discharge was regulated on the basis of these average profiles. (In tables 1 and 2 such runs are labelled "antidune" runs, and only those runs where antidunes disappeared completely are called "flat bed" runs.)
The dip in slope values shown in figure 6 occurs pre cisely in the range of "nonuniform" flow, where both antidunes and flat bed existed simultaneously in the flume. Slopes resumed their "normal" rate of increase with transport rate only after the flat bed occupied the full flume length.
The major findings about flume width and depth effects on the energy gradient are as follows:1. A lesser slope evolved as the channel become wider,
for the same unit transport rate and depth. Such a trend might have been predicted, but the present study actually measures this change. The resulting adjustment factors give slope values in an infinitely wide channel, the proportion of the energy gradient due to sidewall effects in narrow channels, and a means of correlating slopes from flumes of different widths.
2. Flume width did not affect the rate of change of slope with change in unit sediment-transport rate as long as water depth remained constant.
3. For depths ranging from 0.1 to 0.7 ft the sidewall effects became virtually insignificant at a flume width of 2ft.
4. The large difference in roughness between bed and sidewalls seems to contribute to an elimination of wall effects at lesser width/depth ratios than in flumes of smooth rigid boundaries.
5. At constant unit discharge, depth varied with /S~°- 28 . The minimum variance theory predicts this same relation.
6. The nonuniqueness of slope values associated with. the washing out of bed forms seems to be less impor tant with coarse sands than with medium and fine sands.
STREAM POWER
GENERAL
Stream power (Bagnold, 1966) is the rate at which a stream loses energy per unit boundary area. The power per unit bed area, «, is equal to yQS/W. Figure 8 shows the unit stream power-unit transport rela tions for the present data.

w
>QS
UN
IT S
TREA
M P
OW
ER -r- ,
IN
POUN
DS P
ER S
ECO
ND P
ER F
OO
T
P
o
.
ro
y
o
p
.-
r°
wro
<
-n
Oo
O
L_
w
iO
o
o
UN
IT S
TREA
M P
OW
ER
^, I
N KI
LOG
RAM
S PE
R SE
COND
PER
MET
ER
W

PLUME WIDTH AND WATER DEPTH EFFECTS HIS
The graphs reveal that the change in trend at high transport rates which appeared on the slope-transport diagrams (fig. 6) disappears on the power-transport plots. This is because a discharge slightly greater than expected accompanied the lesser slope values for the pertinent transport rates, in order to maintain the same constant water depth. The result is a unique relation between stream power and sediment transport for a con stant water depth, regardless of bed configuration.
The unit stream power-unit transport relations for the three deeper depths (and approximately for Z?=0.1 ft) follow a power law over most of the range of transport rates covered. As with the discharge- transport and slope-transport relations, flume width did not affect the rate of increase in unit power with increase in transport rate, at constant water depth. The straight-line portions for the three greater depths in figure 8 and nearly all of the relation for D=0.1 ft, were fitted by least squares by using the constraint that the lines for all widths at a given depth are mutually parallel. The curved lines at the lowest transport rates on all four diagrams were fitted by eye.
Unit stream power varied with the 0.61 power of unit transport rate, at constant channel width, within the range of transport rates covered by the least-squares analysis (0.005 ^^ 1.0 Ib per sec-ft and 0.3 ^D^ 0.7 ft). If we consider stream power as the independent variable then i ocw1 - 64 .
WIDTH EFFECT
The transportation of an imposed sediment load re quires a certain basic stream power or work rate. In narrow channels the sidewalk take up a significant part of the total available power. Consequently, narrow chan nels need a greater stream power (c/) the basic work rate required to move the sediment load plus the power used up on the sidewalls.
For the present study the data permit a determina tion of these two powers for a given depth and width. Moreover, the unit power measured in a narrow channel can be corrected to yield the lesser power needed to move the same unit transport rate in a wide channel at the same depth. This can be done because the sidewall effect disappeared at the 2-ft width, according to the least-squares computations, except for Z?=0.7 ft. For Z?=0.7 ft the same extrapolation method as on the slope-transport relations was used. The dashed line in figure 8 represents this extrapolated relation for Z?=0.7 ft in an infinitely wide channel.
Figure 9 gives the adjustment factors to correct unit stream power for the flume sidewall effect, at a con stant depth and unit transport rate. These factors rep resent simply the wide-channel unit power < > divided
by the narrow-channel value «>'. For any given channel width and depth, multiply the narrow-channel unit power by the adjustment factor shown in figure 9 to find the unit power needed to transport the same unit sediment load in an infinitely wide channel, at the same water depth.
Figure 9 shows that the stream power adjustment factor depends primarily on the width/depth ratio, as expected, but that the adjustment also varies slightly with both water depth and sediment transport rate.
In fact, since unit discharge Q/W did not vary significantly with flume width (fig. 3) one might ex pect that the unit power yQS/W adjustment factors would be the same as the slope-adjustment factors of figure 7. A comparison of figures 7 and 9 shows that the two diagrams are indeed virtually the same. The chief exception is for a depth of 0.1 ft, where narrow chan nels need a greater adjustment for to than for slope. This is probably due to the slightly different unit dis charge-unit transport relation that appeared for the 0.25-ft-wide channel at this depth (fig. 3).
A minor difference between the power- and slope- adjustment factors is that with stream power the side- wall influence, according to figures 7 and 9, may be eliminated at slightly lesser W/D ratios. There seems to be no ready explanation for this.
For practical purposes it might be better to ignore the minor influence of sediment-transport rate and to concentrate on the general surilarity in the adjustment factors of slope, shear stress, and stream power (figs. 7 and 9). Because all these curves have the same shape, a simple curve-fitting procedure will permit one curve to describe all the data. For the present data the plot which brings all the points reasonably close to a single curve is the adjustment factor as a function of (W/D)T/D. Figure 10, which has all the slope (or shear) and stream power adjustment factors (figs. 7 and 9) for the complete range of transport rates studied, shows this plot. Figure 10, in other words, includes the same data as figures 7 and 9 but with (W/D)i/D rather than W/D on the abscissa. One advantage to this type of diagram is that no interpolation is needed to get the adjustment factors for widths and depths intermediate between those studied here (for example, a depth of 0.4 ft and (or) width of 0.75 ft).
The single greatest deviation of the curve from a measured adjustment factor is 26 percent, but in 73 percent of the cases the discrepancy between the meas ured values and the curve is ^ 5 percent, the arithmetic average. Data for the deeper water depths in narrower channels tend to show the largest deviations, owing to the steepness of the curve for these widths and depths (%. 10).

H16 SEDIMENT TRANSPORT IN ALLUVIAL CHANNELS
Widthratio
Depth
0.5 1.0 2.0 5.0 10.0 20.0
DEPTH 0.1 FT
DEPTH 0.3 FT
5.0 10.0 20.0
DEPTH 0.1 FT
DEPTH 0.3 FT
DEPTH 0.5,0.7 FT
A. l<0.005 Ib per sec-ft
DEPTH 0.5 FT
DEPTH 0.7 FT
B. />0.005 Ib per sec-ftI I t I M I I L I I I I I I I I
EXPLANATION
Width (ft)
Depth (ft)
0.10.3
0.50.7
0.25 0.5 1.0 2.0
FIGURE 9. Adjustment factors to be multiplied by the laboratory value to correct stream power for sidewall effect
The equation of the general adjustment-factor curve of figure 10 is
X* Y=-
where Y is the adjustment factor for slope, stream power, or shear stress and X is (W/D)^/D. This equation reduces to
Y==1+0.18 wv
The coefficient (0.18) has dimensions of length (feet), and the adjustment factor Y is dimensionless.
Using coefficients of 0.10 and 0.24 in place of 0.18 produces two curves which include nearly all of the
plotted points. The coefficient of 0.18 was determined by least-squares from the data of the narrower chan nels, as the predicted adjustment factors for these data (steep portion of curve in fig. 10) are the most sensitive to changes in the coefficient. (For the wider channels small changes in the "coefficient have a negligible in fluence on the predicted adjustment factor.)
With the above formula the adjustment factor varies not only with the width/depth ratio but also with the actual magnitudes of width and depth for the same W/D ratio. (The separate adjustment curves, such as those in fig. 9, show this same feature.) For example, at a width/depth ratio of 3 the adjustment factor com puted from the general equation progresses from 0.82 at a depth of 0.1 ft to 0.94 for #=0.3 ft to 0.96 for

FLUME WIDTH AND WATER DEPTH EFFECTS H17
<a:
oQ_
o£ i t/}
Q_O
0.0
(W/D)jD, IN (FEET)"2
0.5 1.0 1.5 2.0 2.5 3.0 3.5 4.0 4.5 5.0 5.5 6.0 6.5 7.0=1
ADJUSTMENT FACTOR=Y=+ 0.18( W 2
EXPLANATION
Sample use of tick-marks
Slope (or shear) adjustment factor: _
/<0.005lb per sec-ft^
/>0.005lb per sec-ff°
Stream power adjustment factor:
/<0.005Ib per sec-fU
/>0.005lb per sec-ftp
FIGURE 10. Adjustment factors to be multiplied by the laboratory value of slope (energy gradient), unit stream power, or shear stress to correct for the flume sidewall effect.
Z> = 0.5 ft, the width in each case being three times the depth. Similarly, at a width/depth ratio of 5 the calcu lated adjustment factor is 0.93 for Z>=0.1 ft (TF=0.5 ft), 0.98 for Z>=0.3 ft, and 0.99 for Z> = 0.5 ft. More ad justment is needed, in other words, as water depth de creases, for a given W/D ratio.
The above equation for finding the necessary adjust ment in the "narrow-flume" value of slope, shear stress, or unit stream power is one of the main results of this study. The formula may or may not apply to other flow conditions and sediments.
The unit power may often be independent or constant, and one would like to know how to adjust the sediment- transport rate (considered as a dependent variable) to correct for the sidewall influence. Figure 8 also pro vides the information needed for these adjustment fac tors. The adjustment to transport rate varies depending on the specific unit power, in addition to depth and
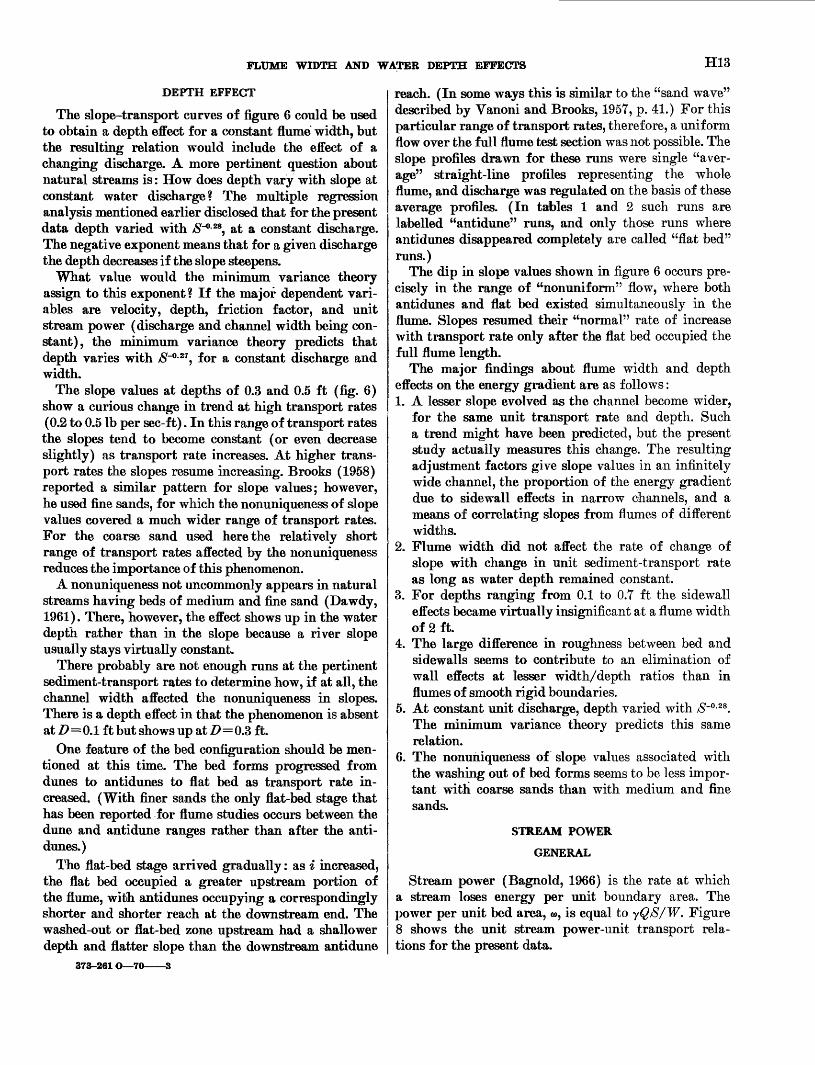
width/depth ratio. Figure 11 shows the necessary ad justment in unit sediment-transport rate for various values of unit stream power. (Fig. 11 therefore does not reflect the control of variables for the experiments it comes from the measured power transport relations but pretends that stream power was independent and transport rate was dependent.)
One of the most striking revelations of figure 11 is that the unit sediment-transport rate in a wide channel can easily be 2 to 5 times greater than in a narrow channel, for the same unit stream power and water depth. Also the sidewall effect is much more pronounced at low flow rates (low values of stream power).
DEPTH EFFECT
In addition to flume-width effects the present data reveal the influence of water depth on the power-trans port relation. The discussion here deals with the more
HIS SEDIMENT TRANSPORT IN ALLUVIAL CHANNELS
« = 0.03 Ib per sec-ft
x 0.06<«l1.0lb per sec-ft
3.0
2.0
1.02.0 5.0 10.0
Width/Depth ratio » 20.0
DEPTH 0.1 FT
DEPTH 0.3 FT
I \ I1111 «= 0.2 Ib per sec-ft
DEPTH 0.7 FT
«= 0.1
Ib per sec-ft
" = 0.05 Ib per sec-ft
0.155 «i3.0lb persec-
10.0
5.0
2.0
0.5
DEPTH 0.5 FT
1.0 2.0 5.0 Width/Depth ratio -
1.0 10.0
oa.
« = O.llb per sec-ft
« = 0.08 Ib per sec-ft
I I I I I I I i^ 1 \ « = 0.1 Ib per sec-ft
V% - «=0.06lb per :-ftsec-
5.0
2.0 ^
0.5 1.0 2.0 ~ ' ------ 1-0
Width/Depth ratio ^ Width/Depth ratio ^
FIGUBE 11. Unit transport rate adjustment factors to be multiplied by the laboratory value to correct for flume sidewall effect.
common field situations where stream power is usually the imposed or independent variable and depth and transport rate are dependent.
Figure 12 shows the power-transport curves for "wide" channels (wall effect negligible) for the four flow depths studied. For a given unit power the trans port rate increased as depth decreased. This means that power for power a shallow stream transports sediment at a faster rate than a deeper stream, within the range of depths studied here. The transport rate increased four to six times as depth was decreased from 0.7 to 0.1 ft (that is, from about 160 to 20 gram diameters), for a given stream power.
The depth effect in the power-transport relations diminished as the water became deeper. The curves of figure 13, prepared from figure 12, suggest that at some depth greater than 0.7 ft (probably around 1.0 to 1.5 ft) the unit transport rate may no longer decrease with increase in depth, for a given stream power.
The transport rate at zero depth should be zero. For this reason it seems unlikely that the transport rate could go on increasing at depths much below 0.1 ft. The curves showing the depth effect at depths less than 0.1 ft (about 20 grain diameters) therefore might be simi
lar to the broken extensions shown in figure 13 (R. A. Bagnold, written commun., 1968).
Bagnold (1966, p. 19), in comparing shallow depths where saltating grains reach the water surface to large depths where the saltation height is a negligible por tion of the flow depth, predicted strictly on theoretical grounds that the bedload transport rate at the shallow depth would be three times the rate at the greater depth, for a given stream power. Figures 12 and 13 suggest that a factor of about 4 to 6 applies to the present data, except for very low flow rates.
For unit stream powers from 0.1 to 1.0 Ib per sec-ft (that is, for most of the conditions covered in the ex periments), the unit sediment transport rate changed at the same rate with depth, regardless of the stream power (fig. 13).
Further experimentation with grains larger and smaller than 1.35 mm would be useful in determining whether the depth effect as observed here is influenced by such features as (a) depth/grain-size ratio, as con trasted to depth alone, (b) bed-form heights relative to water depth, and (c) the ratio of bedload to sus pended load.

FLUME WIDTH AND WATER DEPTH EFFECTS H19
o2 10
UNIT SEDIMENT-TRANSPORT RATE, IN KILOGRAMS (IMMERSED WEIGHT) PER SECOND PER METER WIDTH 0.001 0.01 0.1 1.0 10.0
o z o
1.0
0.1
T I
DEPTH 0.5 FT
I
DEPTH 0.3 FT_
I
10.0
oz o
1.0o o
0.1
fc 0.01 r 0.0001 0.001 0.01 0.1 1.0 10 ,_§ UNIT SEDIMENT-TRANSPORT RATE, IN POUNDS (IMMERSED WEIGHT) PER SECOND PER FOOT WIDTH §
FIGUBE 12. Unit stream power-unit sediment-transport relations in an infinitely wide channel.
UNIT SEDIMENT-TRANSPORT RATE, IN KILOGRAMS (IMMERSED WEIGHT) PER SECOND PER METER WIDTH
0.001 0.01 0.1 1.0 \ \ r
< > = 0.1 Ibs per sec-ft
(= 0.067 kg per sec-m)
30.0
- 25.0
I<*>= 1.0 Ibs per sec-ft
(= 0.67 kg per sec-m)
T
1.0
0.9
0.8
0.7
0.6
0.5
0.4
0.3 -w= o.05 Ibs per sec-ftS*
Q« _(= 0.034 kg per sec-m)
0.11-
00.001 0.01 0.1 1.0
UNIT SEDIMENT-TRANSPORT RATE, IN POUNDS (IMMERSED WEIGHT) PER SECOND PER FOOT WIDTH
FIGUBE 13. Variation of total sediment-transport rate with different water depths, for constant stream power.
- 20.0 ~
- 15.0 -
- 10.0
- 5.0

H20 SEDIMENT TRANSPORT IN ALLUVIAL CHANNELS
BED FORMS
The sizes, shapes, and travel rates of the sand features which form on a streambed influence the level to which the water will rise in a channel of fixed width and slope, the navigability of a watercourse, and the depth to which bridge piers must extend.
The types of bed configuration (Kennedy, 1966) which appeared with increasing sediment-transport rates were flat bed (at very low transport rates, for some runs only), dunes, antidunes (always moving down stream) , and flat bed (sheet flow).
This order of appearance differs from that found with medium and fine sands (Simons and others, 1965). With increasing transport rate medium and fine sands produce a bed of ripples, ripples on dunes, dunes, flat bed, antidunes, and chutes and pools. The chief differ ences between such sands and the present coarse mate rial are that with the latter (a) the bed often remained flat at the very lowest transport rates (possibly because the run began with an artificially flattened bed), (b) no ripples formed, and (c) a flat-bed stage came after rather than before the antidune stage.
No dunes occurred at a depth of 0.1 ft. At widths of 1 and 2 ft the runs at slow transport rates for Z> = 0.1 ft produced bars which alternated or meandered from wall to wall (see Williams, 1967, p. B21).
In the 0.25- and 0.5-ft-wide channels, the bed forms at all depths were mostly two dimensional, except for the antidunes at J9 = 0.1 ft in the 0.5-ft-wide channel. At widths of 1 ft or more, the bed forms for the three deeper water depths were two dimensional during slow transport rates but gradually became three dimensional (curving from wall to wall) as transport rates increased. Thus the disappearance of sidewall effects on such fac tors as slope and stream power corresponded roughly with the onset of three dimensionality in the 'bed forms.
The following analyses are based on graphs (not included here) of the individual bed-form character istics as function of the independent variable unit sedi ment-transport rate.
BED-FORM HEIGHTS
1. General. Neither flume width nor water depth af fected the rate of growth of bed-form height with increasing unit transport rate. Dune heights, for example, increased with 1̂0 28. The specific height corresponding to any unit transport rate, however, usually changed significantly with flume width and depth.
2. Width effect. Least-squares lines of best fit for the dune height-unit transport relations (keeping the lines for the various flume widths parallel to one another for each depth) showed that dune heights
increased as the channel became wider, for a given unit transport rate and depth. For the 0.3 and 0.5 ft depths this width effect disappeared in the two wider channels. For J9=0.7 ft the width effect ap peared to be almost eliminated at TF=2.0 ft, but this conclusion is only tentative because dunes in the five runs in the 3.9-ft-wide channel seemed to be higher than those in the narrower channels.
Figure 14 gives the necessary adjustment fac tors to correct dune height for the channel width effect (0.3^Z>^0.5 ft). Notice that this effect can be substantial. Dunes in the 0.25-ft-wide channel were only about half as high as those in the 1- and 2-ft-wide channels, for a given unit transport rate and water depth.
Flume width had no significant influence on an tidune heights. This is strange in view of the channel width effect on dunes.
3. Depth effect. Dune heights increased considerably with increase in water depth, at constant flume width and unit sediment-transport rate. The least- squares lines indicate that in the 2-ft-wide chan nel, where sidewall effects were negligible (or at least minor, such as for J9=0.7 ft), dune heights increased with Z>°-74, for any selected unit sediment- transport rate.
Narrower channels gave slightly different ex ponents. In the 0.25-, 0.5- and 1.0-ft-wide chan
nels dune heights grew about with the 1.0,1.0, and 0.7 powers of water depth, respectively, at con stant unit transport rate. Thus the exponent de creased slightly as the channel became wider.
Antidune heights at constant unit transport rate increased with water depth for depths at 0.1 to 0.5 ft, especially in going from the 0.1- to the 0.3-ft depth. Heights for Z>=0.7 ft, however, were not significantly different from those at Z>=0.5 ft, for the same unit transport rate.
2.5<LL.
z 2.0LU
g 1.5
< 1.0i :E o
DEPTH 0.5 FT . DEPTH 0.3 FT
EXPLANATION
.-10.25 ^ J| 0.5*.£ i.o
i 2.0
Depth"o.T
A
in ft ~6T
A
&
a- -0-
0.5 1.0WidthDepth
2.0
ratio -
5.0 10.0
FIGURE 14. Dune-height adjustment factors to -be multiplied by the laboratory value to correct for flume-width effect.
FLUME WIDTH AND WATER DEPTH EFFECTS H21
BED-FORM WAVELENGTHS
1. Width effects. The flume width did not influence the bed-form wavelength-unit transport relation for a given water depth. However, the channel width may have had an effect (data are inconclu sive) in that the effect of water depth on the wave lengths seemed to vary with the flume width, as will be mentioned below.
2. Depth effects. For unit transport rates less than about 0.01 Ib per sec-ft (about half the range covered) the water depth had no influence on the bed-form (dune) wavelengths. As transport rate increased, however, a depth effect became more and more pronounced, at least in the two narrower channels: bed-form wavelengths increased with increase in water depth. The plots suggested that this effect may not exist for channel widths ^1 ft, at depths of 0.3 to 0.7 ft. But there are not enough runs in this range to say with certainty. Even in the wider channels the wavelengths for Z>=0.1 ft (anti- dunes) were considerably shorter than those for greater depths, at any selected unit transport rate.
Antidunes tended to form at lesser unit trans port rates as water depth decreased, at least in the two narrower channels. In fact at Z>=0.1 ft anti- dunes always formed at slower transport rates, regardless of channel width. (By the same token the flat-bed stage which followed also came at slower unit transport rates.) For depths between 0.3 and 0.7 ft the data for the 1- and 2-ft-wide channels are inconclusive on this issue.
TRAVEL VELOCITY
1. General Bed forms travelled faster with increasing sediment-transport rate. The rate of dune move ment increased about with i ° 7S , with no significant difference due to depth or width. For antidunes the exponent was less, about 0.7 to 0.4, depending on the flume width.
2. Width effects. Least-squares lines for the travel ve locity-sediment transport relations (keeping the lines for all four widths parallel to one another, for a given depth) revealed a definite width ef fect: dunes in the two narrower channels, where sidewall effects were significant, travelled faster than dunes in wider channels, for a given water depth and unit sediment-transport rate. For depths of 0.3 and 0.5 ft the order of magnitude of this in creased travel velocity was about 1.5 times. Side- wall effects disappeared at the two wider channels for depths of 0.3 and 0.5 ft but were still present for Z>=0.7 ft, according to the least-squares lines. The travel velocities for Z> = 0.7 ft showed more
scatter than those at lesser depths, so the sidewall effect may or may not have been eliminated at D~ 0.7 ft.
Plots of the calculated travel-velocity adjust ment factors as a function of TF/Z>, for depths of 0.3 and 0.5 ft, showed too much scatter to permit drawing reliable curves.
Analyzing antidune travel velocities by least- squares was not feasible because of the small num ber of antidune runs for 'any one width and depth combination. But the scatter on the plots was gen erally small enough for representative lines to be fitted by eye, These lines suggest the following: (a) no width effect occurred at Z>=0.1 ft and (b) a width, effect occurred for the three deeper depths in that the rate at which antidune travel-velocities in crease with i probably decreased as the- channel widened, for 0.25 ^TF^l.O ft.
3. Depth effects. For a given channel width and unit sediment-transport rate, dunes travelled faster as water depth decreased. The dune travel velocity increased about with D'1 - 5 for wide channels where sidewall effects were negligible (W= 1.0 ft and 2.0 ft for the two shallower depths, and assumed to be W=2.0 and 3.9 ft for Z> = 0.7 ft). The exponent was less in narrower channels, however. For the 0.5- ft-wide channel dune travel velocity increased about with. D^ 2 , while for TF=0.25 ft the ex ponent was about 1.0.
Antidune travel rates showed no depth effect for 0.3 ^Z>^0.7 ft. However, at Z>=0.1 ft the anti- dunes for a given transport rate movednearly twice as fast as those at the greater depths, at least in the two narrower channels.
The effects of flume width and water depth on bed- form characteristics, at constant unit sediment-trans port rate, are summarized as follows:1. In the two narrower channels where sidewall effects
were significant, dune heights were less but these dunes travelled faster, for a given depth, Anti- dunes heights and bed-form wavelengths remained virtually the same regardless of channel width. Data are inconclusive concerning flume width effects on the travel velocities of antidunes.
2. With increase in water depth at constant flume width the dunes grew higher and travelled at a slower rate. Antidune heights also increased with depth, with the possible exception of depths from 0.5 to 0.7 ft. Travel rates of antidunes showed no marked depth effect for the three greater depths, but antidunes at Z> = 0.1 ft travelled faster than those at deeper depths. No depth influence on bed- form wavelengths appeared for transport rates less
H22 SEDIMENT TRANSPORT IN ALLUVIAL CHANNELS
-than about 0.01 Ib per sec-ft, but as-i increased beyond this value (involving some dune runs and all antidune runs) the wavelengths probably in creased with water depth, at constant transport rate.
The width and depth effects mentioned above suggest that many bed-form characteristics meas ured in narrow flumes probably cannot be applied with assurance to wide channels.
Why did the dunes grow higher as the flume be came wider, at constant unit transport rate and depth? The most likely reason is that the increase in width brings a different velocity distribution within the cross-sectional flow area. Rouse (1961, p. 276-277) shows that in narrow rectangular chan nels the velocity near the bed increases more rapidly with height and the maximum velocity oc curs closer to the bed than in wide channels. These velocity characteristics would restrict bed-forms to lower heights in narrow channels.
Higher dunes by themselves should cause a steeper slope, if the bed roughness alone governed the slope (transport rate and depth constant). But the general trend with increasing width was a lesser slope, in spite of the higher dunes. Hence the greater width pre dominated over the increase in bed roughness, in re gard to the slope that evolved. A wider channel at the same depth meant a proportionally smaller retarda tion of the flow by the sidewalls, as discussed earlier.
RESISTANCE FACTORS
GENERAL
The resistance factor or friction factor as an indicator of boundary resistance is important in river and canal hydraulics because this resistance directly affects the size of the cross-sectional flow area and the rate at which a channel conveys water.
Table 1 includes two commonly-used resistance fac tors: Manning n (=1.49 R^^^/V) and Darcy-Weis- bach / ( = 80RS/V2 ) , in which R is the hydraulic radius and g is the acceleration due to gravity. (The values of n and / in metric units are the same as those for English units.) Both of these resistance factors changed in the same way as functions of the independent variable i, so only one of them need be examined here.
WIDTH EFFECT
Figure 15 shows how the Darcy-Weisbach friction factors changed with flume width, for a constant depth and unit transport rate. The straight portions of the lines were fitted by least-squares with the constraint that the lines for the various widths be mutually parallel,
for any one depth. The curved lines at fast transport rates were fitted by eye.
At a constant depth the relations for all widths are similar in that the friction factor gradually increased as bed forms grew higher. This trend extended over about the first two-thirds of the range of transport rates studied. The highest friction factors (greatest bed re sistance) occurred when antidunes covered the full flume test section. The friction factor began declining when antidunes started washing out at the upstream end of the test section, even though the remaining antidunes in the downstream zone were higher than in runs at lesser transport rates.
With further increase in transport rate, the decline in friction factor continued as antidunes occupied a lesser and lesser zone downstream, and in fact the de cline continued during the subsequent flat-bed stage throughout the remainder of the range of transport rates investigated.
The friction factor began decreasing at transport rates slightly less than those rates at which the change in trend of slope values occurred (compare fig. 6 to fig. 15). At still faster transport rates the friction factor declined regardless of how slope was changing. The friction factor at constant depth and width varies with /SyF2, and at fast transport rates V2 increased with i faster than S changed with *.
Since the channel width did not affect the mean veloc ity, for a given transport rate and depth, any changes in the friction factor due to flume width must be due to the changes in the hydraulic radius and the slope. Figure 15 shows that the Darcy-Weisbach friction fac tor increased as the channel became wider, for a constant depth and unit transport rate. Thus with increase in flume width the hydraulic radius increased more sub stantially than the slope decreased. The R and S values in tables 1 and 2 verify this.
Knowing the effect of flume width on the variables R, &, and F, it was possible to compute the friction fac tors for an infinitely wide channel. Mean velocity was the same for any flume width, at a given depth and transport rate> so the best-fit curves of figure 4 provided values of V. The hydraulic radius in an infinitely wide channel equals the mean depth D. Figure 6 was the most convenient source for the wide-channel slopes, although the slope-adjustment factors of figures 7 or 10 could be used as well. For each selected transport rate and depth the appropriate R, S, and V values provided the friction factor in an infinitely wide channel (dashed lines in fig. 15).
The empirical system used here to correct friction fac tors for the sidewall effect keeps the same depth for both the narrow flume and the infinitely wide channel.

FLUME WIDTH AND WATER DEPTH EFFECTS H23
UNIT SEDIMENT-TRANSPORT RATE, IN KILOGRAMS(IMMERSED WEIGHT) PER SECOND PER METER WIDTH
0.001 0.01 0.1 1.0
Of.O
J. 0.02 -
0.1
0.05
0.02
0.01
0.1
0.05
Q;02
a.oi0.0001
dunes antidunes -flat bed
DEPTH 0.3 FT
flatbed antidunes flat bed
Infinitely wide -...channel
Oil FT
o.oor o.oi o.iUNfT SEDIMENT-TRANSPORT KA.TB, IN POUNDS
(tM-WEISID WEIGHT) PER SECOND PER FOOT
1.0
EXPLANATION
Depth (ft}Width (ft)
0.10.30.5
0.25 0.5 1.0 2.0 3.9
FIGURE 15. Flume-width, effects on friction factor-transport relations.

H24 SEDIMENT TRANSPORT IN ALLUVIAL CHANNELS
Mean velocity also stays the same, but the two channels have different slopes. Some investigators regularly use a theoretical method to adjust friction factors for the sidewall effect. This system, known as the sidewall cor rection method (see Vanoni and Brooks, 1957), keeps both velocity and slope the same for the two channels and changes only the hydraulic radius. The section "Sidewall correction procedure" deals with the sidewall correction method in more detail.
DEPTH EFFECT
An increase in depth at any fixed width and transport rate brought an increase in R, a decrease in S (fig. 6), and an increase in V (fig. 5). The change of the quotient JKS/V2 with depth should therefore be calculable from a knowledge of how R, S, and V changed with depth, at a fixed transport rate and flume width. An easier method simply compares the curves for the various depths for any chosen width, as taken from figure 15.
Such a comparison shows that there is little if any significant difference between the friction factor-trans port relations for the three greater depths. The curves for all three depths reach their peak and begin declining at about the same unit transport rate. The trends of S alone (fig. 6) indicate this might be expected for depths of 0.3 and 0.5 ft but would not be expected for Z>=0.7 ft, because at the latter depth no dip or nonuniquiness in slope values appeared. More runs at Z>=0.7 ft would be needed to clarify this point.
At low transport rates the friction factors for Z>=0.1 ft are about 1.5 times greater than those for the other three depths. Antidunes at Z>=0.1 ft began washing out at much lesser transport rates, however, so the curve begins to decline correspondingly earlier (about one log cycle of transport rates sooner). At transport rates of about 0.1 Ib per sec-ft or a little less, the friction factors for all depths are nearly the same, differing by a factor of about 1.2.
The labelling of the bed configuration in figure 15 (with flat-bed zones determined from narrow-channel data) shows a feature mentioned in the bed-form discus sion: antidunes and the subsequent flat-bed stage appeared at slower unit transport rates as depth decreased.
The scatter on the friction factor-transport diagrams prevents drawing conclusions more specific than those mentioned here.
SIDEWALL CORRECTION PROCEDURE
The results presented thus far show that flume width can have a considerable influence in sediment-transport experiments. Clearly, a reliable means of evaluating and eliminating sidewall effects would be a very useful tool
indeed. Whenever possible such tools should be sup ported by theory rather than being empirical rules based on limited observations. Several "theories" or formulae for sidewall correction have been proposed but are not very popular.
The few investigators in the United States who use a sidewall correction prefer a method which has evolved gradually over the past 55 years. Schoklitsdh (1914) outlined the foundation of this particular sidewall cor rection method. After about 20 years two more papers appeared, almost simultaneously: Horton (1933) in November of 1933 and Einstein (1934) in February of 1934. Though starting from different viewpoints and prepared independently of one another, these two pa pers arrived at the same general formula. Oolebatch (1941), apparently unaware of the Schoklitsch and Ein stein papers, proposed a variable correction factor to Horton's equation. These correction factors presumably apply to canals and ditches cut in earth and rock and have received very little attention. Also in 1941, Ein stein gave an example showing 'how to apply his 1934 treatment to flume studies of sediment transport (Ein stein, 1942). Johnson (1942) took Einstein's equation and added the refinements of (a) showing how to com pute the hydraulic radius of smooth sidewalls and (b) changing the basic friction fonnula from that of Man ning to that of Darcy-Weisbach in order to include a viscosity factor. Brooks simplified the procedure, and it is explained in detail by Vanoni and Brooks (1957).
The method as proposed applies only to fully rough flow, where the bed resistance coefficient stays constant for varying flow conditions (Reynolds number) for a given bed roughness. The general approach is to imag- inarily divide the cross-sectional flow area into three subsections, each representing a separate "channel" in which only one particular boundary (bed or sidewall) affects the flow. You assume that the mean velocity and energy gradient for each subchannel equal the mean velocity and energy gradient for the entire flume. The calculations involve any of the resistance formulae (for example, Darcy-Weisbach or Manning), with variables F, £, JR, and the resistance coefficient. The goal is the friction factor and hydraulic radius of just the bed; for this bed section you can then compute any other quantity involving the hydraulic radius or depth, such as the discharge. Any such factor supposedly is free of sidewall influence.
Many people do not use the sidewall correction pro cedure, partly from theoretical objections but primarily because of the scarcity of data showing whether or not the method gives accurate answers. Some advocates of the procedure claim as one verification of its validity the results of flume experiments with a fixed, rough
FLUME WIDTH AND WATER DEPTH EFFECTS H25
bottom and smoother sidewalls (for example, the tests of Johnson, 1944). Runs at various depths in such tests give different composite resistance coefficients but al most identical values of the predicted "wide-channel" friction factor.
The literature contains at least five instances where authors devoted specific attention to testing this side- wall correction method.
Colebatch (1941) made from one to three runs in each of three types of board-and-dirt model channels and concluded that the method (Horton's formula) gave errors up to ±15 percent of the composite resistance coefficient.
Hay wood (1940, 1942) analyzed data from two en vironments: (a) eight natural drainage ditches with boundaries that had a uniform roughness at low stage and a different but also uniform roughness along the banks (higher flow depths) and (b) a rectangular flume with smooth walls and sand-roughened bottom. Hay- wood remarked that the data check very closely the lines predicted by the sidewall correction formula, and he decided that the method (that is, the composite resist ance equation of Einstein's 1934 paper) was "suffi ciently accurate."
Yassin (1953) studied uniform but different fixed roughnesses on a flume bed and sidewalls. He first de termined the resistance coefficients of various boundary surfaces individually, for a range of flow conditions. Then he installed channels of composite roughnesses (for example, bed rough and sidewalls smooth), using the surfaces whose coefficients he had measured in the initial tests. Yassin found that the sidewall correction equation, with the separately-measured boundary re sistance-coefficients, gave theoretical values of the com posite resistance coefficient which agreed with the measured coefficients to within about ±5 percent.
Taylor (1961) did flume experiments on flow over a fixed cobblestone bed. He found that by applying the sidewall correction procedure the resulting bed friction factor-relative bed roughness relation agreed quite well with the relation predicted by the Karman-Prandtl re sistance equation for rough, two-dimensional channels. In spite of this good agreement, Taylor expressed seri ous misgivings about the theoretical considerations on which the sidewall correction method is based, and con sequently he cautioned against applying the method to situations where it is not previously known to work.
The available evidence therefore favors use of the sidewall correction procedure, at least for fixed-bound ary situations and for flow conditions common in laboratories.
The present movable-bed tests either eliminated side- wall effects or came close enough to doing so to permit a safe extrapolation to infinitely wide channels. These wide-channel relations can test the sidewall correction method for the sediment-transport experiments reported herein. For this purpose the present data were analyzed in two ways.
TEST ONE
The sidewall correction procedure specifies that the velocity and slope for a narrow channel will be the same as for an infinitely-wide channel but that a different depth (/?&) will evolve for the wide channel. The method predicts the value of /?&. Needed for the first test was a master graph showing the wide-channel velocity-slope relations for the four depths studied. For any combina tion of V and /S (for example from a narrow-channel experiment) one could then interpolate on the wide- channel graph to get the applicable depth in a wide channel. This depth should equal /?& as given by the sidewall correction method.
Specifically, the steps in this test were:1. Plot slope as a function of mean velocity for a con
stant depth, to show the influence of flume width.2. Apply a least-squares fit to the points for each width-
depth combination. (The runs at D=0.1 ft showed no width effect, so only one line was fitted to all of these points.)
3. Determine by extrapolation the slope-velocity rela tion for an infinitely wide channel, for each water depth. The procedure here was firstly to select any velocity on the S-V diagram and plot slope values as a function of the corresponding W/D ratios. The resulting graphs verified a power law between these variables. Assuming that for a given depth the channel could eventually become so wide that further increases in width would no longer affect the slope, the applicable function was of the form
S=A
W/Z>J
where A and B are the coefficient and exponent to be determined. As W/D approaches infinity the right-hand side of this equation approaches A. Thus in an infinitely wide channel the value A represents the slope corresponding to the given velocity and depth.
The procedure for getting the wide-channel S-V relation for each depth was therefore to (a) choose a velocity, (b) read the values of 8 from the least- squares S-V lines for the successive W/D values,

H26 SEDIMENT TRANSPORT IN ALLUVIAL CHANNELS
and (c) perform a final least-squares analysis with
variables log S and log1+ W/D,
Such an analysis produced the coefficient A (equal to the wide-channel slope) for the given, velocity and depth. The wide-channel S-V relation could then be drawn by using the same inclination ob tained in step two for the narrow-channel relations. For each depth the procedure had to be done twice, as the power relation between slope and velocity changed inclination at higher velocities.
4. Make a single graph containing the four wide channel slope-velocity curves (one curve for each depth).
5. Draw lines for intermediate depths on this graph by interpolation.
6. For each individual run, take the slope and velocity values and consult the above graph to find the depth that would obtain in an infinitely wide channel for this same slope and velocity.
7. Compare each such depth (Dmelis ) to that predicted by the sidewall correction procedure (/?&).
Figure 16 shows the results of this test, with the dis crepancy ratio Dme&s/Ri plotted as a function of sedi ment-transport rate. Euns at Z> = 0.1 ft could not be tested because the wide channel depths would be less than 0.1 ft, and there was no reliable way of finding £>meas for such depths.
The 142 runs involved in this test had discrepancy ratios ranging from 0.41 to 1.90; the median was 0.98, the arithmetical average 1.01, and the standard devia tion 0.29. Thus about 67 percent of the discrepancy ratios fall between 0.72 and 1.30.
The agreement varies with the hydraulic and (or) sediment-transport conditions. At the lowest transport rates (flat slopes, low mean velocities) the discrep ancy ratios range from about 1.0 to 1.9, with a slight tendency for the poorest agreement to be associated with the two narrowest channels. The ratios improve considerably at intermediate transport rates. Agree ment becomes poorest at those rather fast transport rates at which bed forms (antidunes) reach their great est heights. At this stage the most discrepant values again seem to be associated with the narrower chan nels. The predicted depths show immediate improve ment as soon as the flat-bed stage arrives.
Over some of the range of conditions studied the agreement is good. This tends to support those investi gators who believe in the sidewall correction method.
Some possible causes of the poorer agreement where it occurs, in no special order of probability, are:(a) imprecise measurements (such as might occur for
very flat slopes, especially at deeper depths where bed and water-surface irregularities are higher) ;
(b) effect of bed configuration (for example, well-de veloped antidunes) that is, large differences in relative roughness between bed and sidewalls;
(c) effect of sediment in motion;(d) the method used to analyze the slope-velocity data;(e) defects in the theory of the sidewall correction
procedure.I tried a variation of this test by obtaining the wide-
channel velocity-slope relations in a different way, so as to avoid extrapolating the 8-V data. The procedure here for each depth was to choose values of unit trans port rate and for a given transport rate take (a) the slope from the S-4 relation for infinitely wide channels (fig. 6) and (b) the corresponding velocity from the least-squares lines on the velocity-transport graphs (fig. 4). Repeating for the other depths gave the wide-chan nel velocity-slope relations. Then for each run an inter polation on this master graph gave the wide-channel depth corresponding to each narrow-channel velocity and slope, as before. The results of this test showed no significant differences from the first velocity-slope test.
TEST TWO
The second major test of the sidewall correction pro cedure involved only the slope and sediment-transport rate. Mean velocity, as seen earlier, did not change with flume width for a constant depth. That is, for a given unit transport rate and depth the wide-channel V was the same as the narrow-channel V. The assumption in this test is that if the sidewall correction procedure changes the hydraulic conditions (depth and unit dis charge) then no simultaneous change should be made in the unit sediment-transport rate. In other words, the same unit transport rate applies to both the narrow flume and the infinitely wide channel (Johnson, 1942).
The master chart for this test therefore was the wide- channel slope-transport relations (from fig. 6). For each individual run the question asked was: what is the wide-channel depth corresponding to the narrow- channel slope and transport rate? This depth should equal /?&, the depth predicted by the sidewall correction procedure.
Figure 17 shows the results of this second major test of the sidewall correction method. The agreement between predicted and "observed" depths is better here than with the first test. Of the 133 runs which could be tested, the discrepancy ratios ranged from 0.47 to 1.95;

FLUME WIDTH AND WATER DEPTH EFFECTS H27
UNIT SEDIMENT-TRANSPORT RATE, IN KILOGRAMS (IMMERSED WEIGHT) PER SECOND PER METER WIDTH
0.001 0.01 0.1 1.0
2.0
1.0
0.5
«« 2 -oE <*
o
11 2.0 o < i nIREPANCY R
o :Ln <
*S)
O
2.0
1.0
1 1 1 1 EXPERIMENTAL DEPTH 0.7 FT
A _
1 1 1 1
1 1 1 1
- ^ EXPERIMENTAL DEPTH 0.5 FT A- A
« A4 A
: ** e ^" ~ ** e^ _ **S * : A ^ _
1 1 1 1
1 1 1 1
EXPERIMENTAL DEPTH 0.3 FT
"*V* -H-V*. ;/* ,JA «-tfti>- -t«-^ A
i i i i.0001 0.001 0.01 0.1
UNIT SEDIMENT-TRANSPORT RATE, IN POUNDS (IMMERSED WEIGHT) PER SECOND PER FOOT WIDTH
1.0
EXPLANATION
Depth
Width (ft)0.25 0.5 .0 2.0 3.9
0.30.5
0.7
FIGURE 16. Velocity-slope test of sidewall correction procedure (Vanoni and Brooks, 1957).

H28 SEDIMENT TRANSPORT IN ALLUVIAL CHANNELS
UNIT SEDIMENT-TRANSPORT RATE, IN KILOGRAMS(IMMERSED WEIGHT) PER SECOND PER METER WIDTH
0.001 0.01 0.1 1.0
«/)o
E O
1cH
O
> V. 2 < OuQV. I/
2
2.0
1.0
0.5
-QO£
i 2.03
c 1 0i i.v
= 0.5_ _l£J2i
2.0
1.0
0.5
1 1 1 1 EXPERIMENTAL DEPTH 0.7 FT
$
-A x ^""^Ty:* ~& Q _ I A A 0 i
i- A A _:
i i i i
i i i iEXPERIMENTAL DEPTH 0.5 FT ~
- A A A A^ e e -
A A
1 1 1 1
1 1 1 1
EXPERIMENTAL DEPTH 0.3 FT
E * *A A / i
1 1 1 10.0001 0.001 0.01 0.1
UNIT SEDIMENT-TRANSPORT RATE, IN POUNDS (IMMERSED WEIGHT) PER SECOND PER FOOT WIDTH
1.0
EXPLANATION
Depth (ft)Width (ft)
0.30.50.7
0.25 0.5 2.0 3.9
FIGURE 17. Slope-transport rate test of sidewall correction procedure (Vanoni and Brooks, 1957).

FLUME WIDTH AND WATER DEPTH EFFECTS H29
the median was 1.09 and the arithmetical average 1.05. The standard deviation of 0.22 means that about 67 percent of the discrepancy ratios fall between 0.82 and 1.27.
To a lesser extent the same tendencies noticed with the first test show up here. The predicted depths are slightly small at low transport rates. Where bedforms attain their greatest heights the predicted depths are a little too large, and this trend disappears as soon as the flat-bed stage appears.
The two tests applied here to the sidewall correction method do not rigidly prove or disprove its validity. On balance, however, the degree of agreement as shown in figures 16 and 17 together with the studies of Hay- wood, Yassin, and Taylor support using the pro cedure. With sediment-transport studies the procedure may be more reliable with smooth rather than with very rough beds.
The wide-channel slopes, stream powers, and shear stresses for the present flume experiments can easily vary by a factor of 3 from the narrow-channel values (see figs. 6 and 8), at a given depth and unit transport rate. If these factors involving slope are considered constant (independent) then the depths and unit trans port rates vary severalfold from narrow to wide chan nels. Hence if data from narrow flumes are to be related to wide streams some sort of sidewall correction must be applied. At the present time the only feasible ways to do this are to use either a sidewall correction pro cedure, for example the one described most recently by Vanoni and Brooks (1957) for adjusting the hydraulic radius, or empirical correction factors of the sort given in the present study.
CONCLUSIONS1. Flume width had no measurable influence on the unit
discharge-unit sediment-transport relations and the mean velocity-transport relations, at constant water depth.
2. The energy gradient (slope), unit stream power, and shear stress decreased as the flume became wider, for a constant depth and unit sediment-transport rate. For experimental depths from 0.1 to 0.7 ft, a 2-ft-wide flume was wide enough to eliminate sidewall effects on the slope, power, and shear stress. (Values of these variables in the 2-ft-wide channel were within 0 to 5 percent of the values estimated for an infinitely wide channel.)
3. Multiplying the laboratory value of slope, unit stream power, or shear stress by the adjustment factor
1
gives the slope, power, or shear for a wide channel (no sidewall effect), for the same water depth and unit sediment-transport rate.
4. Depths from 0.1 to 0.7 ft affected the unit stream power-unit sediment-transport relations in that for a given stream power the transport rate increased about fourfold to sixfold as depth decreased from 0.7 to 0.1 ft.
5. Bedforms in narrow channels (widths less than 1 ft) differed in various ways from those in wider channels, for the same unit transport rate and depth.
6. For a given depth and unit transport rate the Darcy- Weisbach friction factor increased as the flume became wider, and this increase can be determined from a knowledge of the flume width effects on the individual variables R, $, and V.
7. Five studies by other investigators, together with the present data, support the use of the sidewall correction procedure (Vanoni and Brooks, 1957)
for relating flume data to infinitely wide channels, at least for most of the common laboratory flow conditions. The procedure may not be reliable, however, for those particular sediment-transport rates associated with high antidunes. Further checks should be made of the sidewall correction procedure to determine the range of widths and depths and the boundary roughnesses to which the method applies.
REFERENCESBagnold, R. A., 1966, An approach to the sediment transport
problem from general physics: U.S. Geol. Survey Prof. Paper 422-1, 37 p.
Brooks, N. H., 1958, Mechanics of streams with movable beds of fine sand: Am. Soc. Civil Engineers Trans., v. 123, p. 526-594.
Colby, B. R., 1964, Discharge of sands and mean-velocity rela tionships in sand-bed streams: U.S. Geol. Survey Prof. Paper 462-A, 47 p.
Colby, B. R., and Scott, C. H., 1965, Effects of water temper ature on the discharge of bed material: U. S. Geol. Survey Prof. Paper 462-G, 25 p.
Colebatch, G. T., 1941, Model tests on Liawenee Canal roughness coefficients: Journal of the Institution of Engineers Aus tralia Trans., v. 13, no. 2, p. 27-32.
Gruff, R. W., 1965, Cross-channel transfer of linear momentum in smooth rectangular channels: U.S. Geol. Survey Water- Supply Paper 1592-B, 26 p.
Dawdy, D. W., 1961, Depth-discharge relations of alluvial streams discontinuous rating curves: U.S. Geol. Survey Water-Supply Paper 1498-C, 16 p.
Einstein, H. A., 1934, Der Hydraulische Oder Profil-Radius: Schweizerische Bauzeitung, v. 103, no. 8, p. 89-91.
1942, Formulas for the transportation of bed load: Am. Soc. Civil Engineers Trans., v. 107, p. 561-577.

H30 SEDIMENT TRANSPORT IN ALLUVIAL CHANNELS
Guy, H. P., Rathbun, R. E., and Richardson, E. V., 1967, Recir- culation and sand-feed type flume experiments: Am. Soc. Civil Engineers Proc., v. 93, no. HY5, p. 97-114.
Hay wood, O. G., Jr., 1940, Flume experiments on the transpor tation by water of sands and light weight materials: Ph.D thesis, Massachusetts Inst Technology, 122 p.
1942, Discussion of "Formulas for the transportation ofbed load:" Am. Soc. Civil Engineers Trans., v. 107, p. 583-590.
Horton, R. E., 1933, Separate roughness coefficients for channelbottom and sides: Engineering News-Record, Nov. 30, 1933,p. 652-653.
Johnson, J. W., 1942, The importance of considering sidewallfriction in bed-load investigations: Civil Engineering, v.12, p. 329-331.
1944, Rectangular artificial roughness in open channels: Am. Geophys. Union Trans., 25th Annual Meeting, part VI, p. 906-912.
Kennedy, J. F., Chairman, 1966, Nomenclature for bed forms in alluvial channels, Report of the task force on bed forms in alluvial channels: Am. Soc. Civil Engineers Proc., v. 92, no. HY3, p. 51-64.
Lane, E. W., 1955, Design of stable channels: Am. Soc. Civil Engineers Trans., v. 120, p. 1234-1279.
Leopold, L. B., and Maddock, T., Jr., 1953, The hydraulic geom etry of stream channels and some physiographic implica tions: U.S. Geol. Survey Prof. Paper 252, 57 p.
Rouse, H., 1961, Fluid mechanics for hydraulic engineers: New York, Dover Pubs.., Inc., 422 p.
Scheidegger, A. E., and Langbein, W. B., 1966, Probability con cepts in geomorphology: U.S. Geol. Survey Prof. Paper 500-C, 14 p.
Schoklitsch, A., 1914, Uber Schleppkraft und Geschiebebewe- gung: Leipzig and Berlin, W. Englemann, 66 p.
Simons, D. B., Richardson, E. V., and Nordin, C. F., Jr., 1965, Sedimentary structures generated by flow in alluvial chan nels, in Soc. Econ. Paleontologists and Mineralogists, Pri mary sedimentary structures and their hydrodynamic in terpretation a symposium: Soc. Econ. Paleontologists and Mineralogists Spec. Pub. 12, p. 34-52, 253-264.
Taylor, R. H., Jr., 1961, Exploratory studies of open-channel flow over boundaries of laterally varying roughnesis: Calif. Insit. Technology Div. of Engineering, Report no. KH-R-4, 65 p.
Vanoni, V. A., and Brooks, N. H., 1957, Laboratory studies of the roughness and suspended load of alluvial streams: Calif. Inst. Technology Sedimentation Laboratory, Report E-68, 121 p. (also published as U.S. Army Corps of Engineers, M.R.D. Sediment Series 11,121 p.).
Williams, G. P., 1967, Flume experiments on the transport of a coarse sand: U.S. Geol. Survey Prof. Paper 562-B, 31 p.
Yassin, A. M., 1953, Mean roughness coefficient in open channels with different roughnesses of bed and side walls: Mitt, aus der Versuchsanstalt fur Wasserbau und Erdbau, Eidg. Tech. Hoch. Zurich, no. 27, 90 p.

TABLES

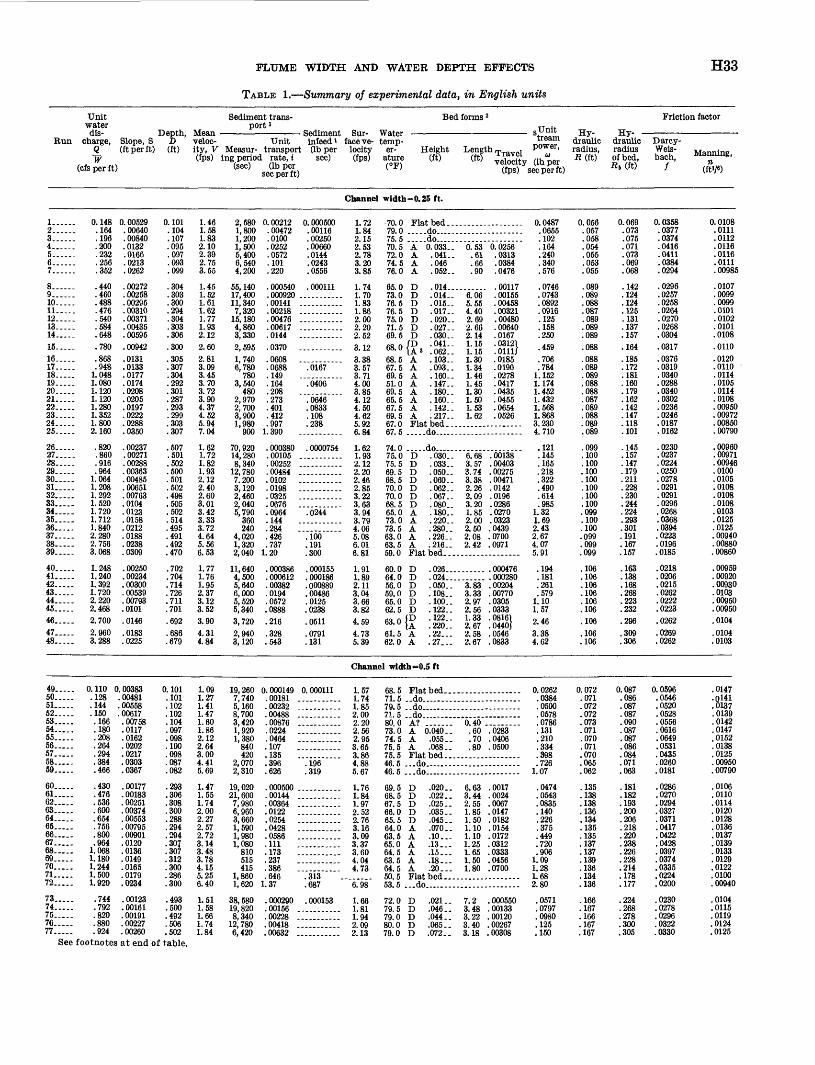
FLUME WIDTH AND WATER DEPTH EFFECTS
TABLE 1. Summary of experimental data, in English units
H33
Unit water dis-
Run charge, Slope, S Q (ft per ft) W
(cfs per ft)
Depth,
(ft)
Sediment trans port »
veloc- Unit ity, V Measur- transpor (fps) ing period rate, i
(sec) (Ib per sec per ft;
- Sediment infeed »
t (Ib per sec)
I
Sur face ve
locity (fps)
Bed forms 2Wnt-rrtemp
er- Height ature (ft)
0 Unit"tream
T ontrth pOWBr,?m Travel u (lt) velocity (Ibper
(fps) sec per ft)
Hy draulic radius, JZ (ft)
Friction factor
draulic radius of bed, Rt (ft)
Darcy- Weis- bach, Manning,
n (ftV6)
Channel width =0.25 ft.
1 ....2......3.. 4... ...5 ._6 7
8 9 ...10.. 11. . 12 13..... 14 15-....16..... 17. .18 19..... 20 21..... 22..... 23.. 24.....25-....
26. . 27.....28 29..... 30..... 31..... 32.. 33 ..34. .35 ..36 37.....38 39
40 41. . 42..... 43.. 44 45.....46 47.....48
0.148 .164 .196 .200 .232 .256 .352
.440
.460
.488
.476
.540
.584
.648
.780
.868
.948 1.048 1.080 1.120 1.120 1.280 1.352 1.800 2.160
.820 .860 .916 .964
1.064 1.208 1.292 1.520 1.720 1.712 1.840 2.280 2.756 3.068
1.248 1.240 1.392 1.720 2.220 2.4682.7002.960 3.288
0. 00529 .00640 .00840 .0132 .0166 .0213 .0262
.00272
.00258
. 00295
. 00310
.00371
.00435
.00595
. 00942
.0131
.0133
.0177
.0174
.0208
.0205
.0197
.0222
.0288
.0350
.00237 .00271 .00288 . 00363 .00485 .00651 .00763 .0104 .0123 .0158 .0212 .0188 .0238 .0309
.00250
. 00234 . 00300 . 00539 .00793 .0101.0146.0183 .0225
0.101 .104 .107 .095 .097 .093 .099
.304
.303
.300
.294
.304
.303
.306
.300
.305
.307
.304
.292
.301
.287
.293
.299 .303 .307
.507 .501 .502 .500 .501 .502 .498 .505 .502 .514 .495 .491 .492 .470
.702
.704
.714
.726
.711
.701
.692
.686
.679
1.46 1.58 1.83 2.10 2.39 2.75 3.55
1.45 1.52 1.61 1.62 1.77 1.93 2.122.602.81 3.09 3.45 3.70 3.72 3.90 4.37 4.52 5.94 7.04
1.62 1.72 1.82 1.93 2.12 2.40 2.60 3.01 3.42 3.33 3.72 4.64 5.56 6.53
1.77 1.76 1.95 2.37 3.12 3.523.904.31 4.84
2,580 1,800 1,200 1,500 5,400 6,540 4,200
55, 140 17, 400 11,340 7,320
15,180 4,860 3,3302,5951,740 6,780
780 3,540
480 2,970 2,700 3,900 1,980
900
70, 920 14, 280 8,340
12, 780 7.200 3,120 2,460 2,040 5,790
360 240
4,020 1,320 2,040
11, 640 4,500 5,640 6,000 5,520 5,3403,7202,940 3,120
0. 00212 .00472 .0100 .0252 .0572 .101 .220
.000540
. 000920
. 00141
.00218
. 00476
. 00617
.0144
.0370
.0608
.0688
.149
.164
.208
.273
.401
.412
.997 1.390
. 000380 . 00105 .00252 .00484 .0102 .0198 .0325 .0676 .0964 .144 .284 .426 .737
1.20
. 000386
. 000612
.00382
.0194
.0572
.0888
.216
.328
.543
0. 000500 .00116 .00250 . 00660 .0144 .0243 .0556
.000111
.0167
.0406
.0646
.0833
.108
.238
. 0000754
.0244
.100
.191
.300
. 000155
.000186
.000889
.00486
.0125
.0238
.0511
.0791
.131
1.72 1.84 2.15 2.53 2.78 3.20 3.85
1.74 1.70 1.83 1.86 2.00 2.20 2.523.123.38 3.57 3.71 4.00 3.85 4.12 4.50 4.62 5.92 6.84
1.62 1.93 2.12 2.20 2.46 2.85 3.22 3.63 3.94 3.79 4.06 5.08 6.01 6.81
1.91 1.89 2.11 3.04 3.66 3.824.594.73 5.39
70.0 Flatbed...79.0 do
70.5 A 0.033- 72.0 A .041.. 74.5 A .046 76.0 A .052..
65.0 D .014 73.0 D .014.. 76.5 D .015.. 76.5 D .017.. 75.0 D .020.. 71.5 D .027- 69.5 D .030.. figo /D .041- 68-°tA3 .062.. 68.5 A .103- 67.5 A .093.. 69.5 A .160.. 51.0 A .147- 69.5 A .ISO- 65. 5 A .160.. 67.5 A .142.. 69.5 A .217.. 67.0 Flat bed. ..67.5 .....do .
74.0 .... .do ...75.0 D .030.. 75.5 D .033.. 69.5 D .050.. 68.5 D .060.. 70.0 D .062.. 70.0 D .067.. 68. 5 D .080.. 65.0 A . ISO- 73. 0 A .220.. 73.5 A .280.. 63.0 A .226- 63.5 A .216- 59.0 Flatbed....
60.0 D .026....64.0 D .024....56.0 D .050.. 59.0 D .108- 65.0 D .100.. 62.5 D .122..
63-°(A !220- 61.5 A .22... 62.0 A .27...
0.53 .61 .66 .90
6.06 5.55 4.40 2.69 2.66 2.14 1.15 1.15 1.30 1.34 1.46 1.45 1.30 1.50 1.53 1.62
6.68 3.57 3.74 3.38 2.26 2.09 3.20 1.85 2.00 2.50 2.08 2.42
3.83 3.332.97 2.56 1.33 2.67 2.58 2.67
0.0256 .0313 .0384 .0476
.00117
.00155
.00458
. 00321
.00480
.00640
.0167
. 03121
. 0111J
.0185
.0190
.0278
.0417
.0435
.0455
.0654
.0526
.00138
.00403 . 00275 .00471 .0142 .0196 .0286 .0270 .0323 .0439 .0700 .0971
. 000476
.000280
.00204
.00770
.0305
.0333
. 0816)
. 0440)
.0546
.0833
0. 0487 .0655 .102 .164 .240 .340 .576
.0746
.0743
.0892
.0916
.125
.158
.250
.459
.706
.784 1.152 1.174 1.452 1.432 1.568 1.868 3.230 4.710
.121
.145
.165
.218
.322
.490
.614
.985 1.32 1.69 2.43 2.67 4.07 5.91
.194
.181
.261
.579 1.10 1.572.463.384.62
0.056 .057 .058 .054 .055 .053 .055
.089
.089
.088
.087
.089
.089
.089
.088
.088
.089
.089
.088
.088
.087
.089
.088
.089
.089
.099
.100
.100
.100
.100
.100
.100
.100 .099 .100 .100 .099 .099 .099
.106
.106
.106
.106
.106
.106
.106
.106
.106
0.069 .073 .075 .071 .073 .069 .068
.142
.124
.124
.125
.131
.137
.157
.164
.185
.172
.181
.160
.179
.162
.142
.147
.118
.101
.145
.157
.147
.179
.211
.228
.230
.244
.224
.293 .301 .191 .167 .157
.163
.138
.168
.268
.223
.232
.296
.309
.306
0.0358 .0377 .0374 .0416 .0411 .0384 .0294
.0296
.0257
.0258
.0264
.0270
.0268
.0304
.0317
.0376
.0319
.0340
.0288
.0340
.0302
.0236
.0246
.0187
.0162
.0230
.0237
.0224
.0250
.0278
.0291
.0291
.0296
.0268
.0368
.0394 .0223 .0196 .0185
.0218
.0206
.0215
.0262
.0222
.0223
.0262
.0269
.0262
0. 0108 .0111 .0112 .0116 .0116 .0111 . 00985
.0107
.0099
.0099
.0101
.0102
.0101
.0108
.0110
.0120
.0110
.0114
.0105
.0114
.0108
. 00950
. 00972
.00850
.00790
.00960
.00971
.00946
.0100
.0105
.0108
.0108
.0108
.0103
.0125
.0125 . 00940 .00880 . 00860
.00959
.00920
.00930
.0103
.00950
. 00950
.0104
.0104
.0103
Channel width =0.5 ft
49..... 50.__- 51 52 .. 53.....54 55 56 57 58 59
60 61.....62 63 64..... 65..... 66 67 68 69 70 71 72 ,.
73 74 75 76 77-....
0.110 .128 .144 .150 .166 .180 .208 .264 .294 .384 .466
.430
.476
.536
.600
.654
.756
.800
.964 1.068 1.180 1.244 1.500 1.920
.744
.792
.820
.880
.924
0.00383 .00481 .00558 .00617 .00758 .0117 .0162 .0202 .0217 .0303 .0367
.00177
. 00183
.00251
. 00374
.00553
.00795
.00901
.0120
.0136
.0149
.0165
.0179
.0234
. 00123
.00161 . 00191 .00227 .00260
0.101 .101 .102 .102 .104 .097 .098 .100 .098 .087 .082
.293
.306
.308
.300
.288
.294
.294
.307
.307
.312
.300
.286
.300
.493
.500
.492
.506
.502
1.09 1.27 1.41 1.47 1.60 1.86 2.12 2.64 3.00 4.41 5.69
1.47 1.55 1.74 2.00 2.27 2.57 2.72 3.14 3.48 3.78 4.15 5.25 6.40
1.511.58 1.66 1.74 1.84
19, 260 7,740 5,160 8,700 3,420 1,920 1,380
840 420
2,070 2,310
19, 020 21, 600 7,980 6,960 3,660 1,590 1,980 1,080
810 515 415
1,860 1,620
38,580 19, 820 8,340
12, 780 6,420
0. 000149 . 00181 .00232 .00488 .00876 .0224 . 0464 .107 .135 .396 .626
. 000500
.00144 . 00364 .0122 .0254 .0428 .0586 .111 .173 .237 .386 .646
1.37
.000290
. 00156
.00228
.00418
.00632 .
0. 000111
.196
.319
.313
.687
. 000153
1.57 1.74 1.85 2.00 2.20 2.56 2.95 3.65 3.86 4.88 5.67
1.76 1.84 1.97 2.52 2.76 3.16 3.09 3.37 3.60 4.04 4.73
6.98
1.66 1.81 1.94 2.09 2.13
68.5 Flatbed....71.5 ..do .....79.5 ..do .71.5 ..do.... ... ...80.0 A? .......73.0 A 0.040.. 74.5 A .055.. 75.5 A .068-- 75.5 Flatbed .46.5 ... do. . 46.5 --do. . .
69.5 D .020.. 68.5 D .022.. 67.5 D .025.. 66.0 D .035.. 65.5 D .045.. 64.0 A .070.. 63.5 A .10... 65.0 A .13.. . 64. 5 A .15.. . 63.5 A .18-. . 64.5 A .20... 50.5 Flatbed....53.5 ...do ....
72.0 D .021- 79.5 D .046.. 79.0 D .044.. 80.0 D .065.. 79.0 D .072-
0.40 ..60 .70 .80
6.63 3.44 2.55 1.85 1.50 1.10 1.10 1.25 1.65 1.50 1.80
7.2 3.48 3.22 3.40 3.18
.0283
.0406
.0500
.0017
.0024
.0067
.0147
.0182
.0154
.0172
.0312
.0333
.0456
.0700
. 000550
.00133
. 00120
.00267
.00308
0. 0262 .0384 .0500 .0578 .0786 .131 .210 .334 .398 .726
1.07
.0474
.0543
.0835
.140
.226
.375
.449
.720
.906 1.09 1.28 1.68 2.80
.0571
.0797
.0980
.125
.150
0.072 .071 .072 .072 .073 .071 .070 .071 .070 .065 .062
.135
.138
.138
.136
.134
.135
.135
.137
.137
.139
.136
.134
.136
.166
.167
.166
.167
.167
0.087 .086 .087 .087 .090 .087 .087 .086 .084 .071 .063
.181
.182
.193
.200
.206
.218
.220
.238
.226
.228
.214
.178
.177
.224
.268
.278
.300
.305
0. 0596 .0546 .0520 .0528 .0556 .0616 .0649 .0531 .0435 .0260 .0181
.0286
.0270
.0294
.0327
.0371
.0417
.0422
.0428
.0397
.0374
.0335
.0224
.0200
.0230
.0278
.0296
.0322
.0330
.0147
.0141
.0137
.0139
.0142
.0147
.0152
.0138
.0125
.00950
.00790
.0106
.0110
.0114
.0120
.0128
.0136
.0137
.0139
.0133
.0129
.0122
.0100
.00940
.0104
.0115
.0119
.0124
.0125See footnotes at end of table.

H34 SEDIMENT TRANSPORT IN ALLUVIAL CHANNELS
TABLE 1. Summary of experimental data, in English units Continued
Unit water
At*
Run charge, Slope, S Q (ft per ft) W
(cfs per ft)
(ft)
Sediment trans port *
veloc- Unit infeed 1 faceve- ity, V Measur- transport (Ib per locity (fps) ing period rate, i sec) (fps)
(sec) (Ib per sec per ft)
Bed forms 2
temp er- Height
ature (ft) (°F)Lftfth Travel w velocity
(fps)
Unit
power, a
(Ib per sec per ft)
Hydraulic
radius, U(ft)
Hy- -draulic radius of bed, tf i (ft)
Friction factor
Darcy- Weis- bacb,
/Manning,
n (ft1/6)
Channel width =0.5 ft Continued
78....-79.....80 81.....82. .83 84 85 86
87 88. .89 90. 91. .92 93 94
.9761.1401.3601.5801.6761.7201.8562.503.40
1.1501.2401.3201.4501.7422.122.583.30
.00300.00458.00639.00931.0111.0141.0141.0144.0230
.00115
.00127
.00145. 00211.00324.00456.00951.0135
.500.493.505.512.492.504.480.515.443
.700
.702
.715
.711
.702
.722
.694
.693
1.952.312.693.083.403.413.864.847.67
1.641.771.852.042.482.943.724.76
6,2403,0002,040
8403,120
4905,5801,980
960
55,80014,40012,90018,00014,6406,9003,4202,250
.00706
.0224
.0540
.0964
.173
.196
.352
.5191.95
.000350
.000816
.00121.00532.0181.0434.184.526
.0834
.169
.2531.00
.000184
.000248
.000695.00229.00916.0212.0875.268
.. 2.28
.. 3.00
.. 3.37. 3.79
4.20.. 4.01
4.855.327.85
1.791.891.922.222.803.434.295.44
77.5 D .061..76.5 D .082..79.0 D .079..79. 5 A? .136..52.0 A .22...79.5 A .25...49.5 A .20...52.5 A .25...48.0 Flatbed...
61.0 D .027...65.5 D .041..73.5 D .060..75.0 D .083..75.0 D .087..57.0 D .104..54. 5 A .25...53. 5 A .22...
2.52 .003672.17 .02272.18 .02761.90 .03001.94 .'03851.95 .03502.07 .05102.27 .0770
....... .0006885. 9 . 0005895.71 .0008222.96 .002322.34 .005902.36 .01782.26 .03412. 44 . 0561
.183
.326
.541.916
1.151.511.632.234.88
.0825
.0981
.119
.191
.352
.6031.532.77
.167
.166
.167
.168.166.167.164.167.161
.184
.185
.186
.186
.184
.185
.183
.183
.312
.324
.339.362.348.381.339.304.205
.242
.234
.260
.328
.341
.360
.425
.403
.0340
.0366
.0379.0425.0411.0521.0400.0265.0162
.0202
.0193
.0203
.0243
.0250
.0251
.0324
.0281
.0127
.0132
.0134.0142.0139.0157.0138.0112.00870
.01000
.0098
.0100
.0109
.0111
.0111
.0125
.0116
Channel width= 1.0 ft
95.. 96. .97 98 99.....100 101 102 103 104 105
106- ..107 108 .109 .110 111 112 .113....114 .115....116 117. 118- -119....120 121 122....123 .124. 125 .126 .127 .128 129. 130....131.-.132. 133. 134... .135. 136....137. 138 139....140....
141 142 143. 144....145....146 147....
0.115.127.142.158.154.166.191.220.233.292.400
.405.440.440.438.452.470.498.503.512.530.551.570.650.741.760.760.794.860
1.051.121.301.97
.768
.845
.795
.866
.905
.960
.9581.051.101.321.641.872.49
1.171.241.321.421.642.262.79
0.00407.00411.00495.00590.00751.0108.0128.0151.0199.0222.0331
.00110.0012.00136.00162. 00182. 00200. 00210. 00211.00236. 00272.00318. 00397. 00509. 00557. 00594. 00592.00643. 00721. 00824.0109.0129.0162. 00106. 00137. 00133. 00144. 00172. 00184.00216. 00251.00314.00416.00842.0118.0113
.00081
.00079
.00131
.00178
.00272
.00454
.00955
0.093.100.100.102.101.095.101.099.094.097.094
.297
.314
.313
.294
.294
.300
.303
.304
.295
.294
.290
.288
.287
.297
.293
.296
.306
.307
.324
.321
.324
.323.503.509.485.505.517.512.502.517.504.510.486.480.477
.696
.711
.703
.716
.707
.695
.645
1.241.271.411.551.531.751.892.222.483.014.26
1.361.401.411.491.541.571.641.651.741.801.901.982.262.492.592.572.592.803.243.494.016.101.531.661.641.721.751.871.912.032.182.593.373.905.22
1.681.741.881.982.323.254.33
226, 62017, 94010, 1405,4002,4601,4401,6842,183
960473
1,630
24, 18026,04023,82023,40012,24014,0406,3602,4005,0403,6202,3402,1601,9802,1301,1401,2001,353
960720510900270
172, 50014, 0409,180
10,0208,460
18, 4203,8406,3002,6401,8002,8201,3801,380
186,72086, 520
106,80028, 38014,4003,2402,160
0. 000541.00145.00291.00593.00935.0198.0344.0577.112.168.500
.000250
. 000310.
. 000540.
.00107 .
.00171 .
.00256 .
.00361 .
.00375 -
.00585 .
.00925 .
.0109 .. 0160 ..0316 .. 0383 ..0434 ..0475 ..0480 ..0688 ..0972 ..163 ..3131.09.000434.00203 ..00207 ..00288 -.00479 ..00610 ..00716 ..0113 ..0197.0333.135.322.605
.000467
.00143
.00323
.00583
.0201
.0806
.307
0. 000519
.519
.3281.06
.000437
.138
.325
.550
. 000465
.00135
.00322
.00563
.0200
.0813
.319
1.66. 1.68. 1.89. 2.08. 2.22. 2.41. 2.67- 2.86. 3.39- 3.85
5.22
. 1.561.671.761.851.872.062.162.102.142.302.312.502.922.923.003.053.053.333.673.744.65
1.761.911.921.972.022.252.202.38
. 2.54
. 3.143.774.455.63
1.821.832.042.162.533.604.36
57.0 Flatbed....65.5 ...do 66.5 ...do........70.0 do... 54.5 A.........53.5 A .021..63.5 A .042..60.0 A .083..74.5 A .053..76.5 A .073..66.5 Flatbed
70.5 do 73.0 D .021 67.5 Flatbed....65.5 D .042..61. 5 D .042-65.0 D .053-63. OD .063..64.0 D .042-63. OD .053-64.0 D .053-61.0 D .053-61.0 D .063-60.5 D .073-54.0 D .167-68. 5 A .150-71. 5 A .150-60. OD .125..71.0 A .167..74. 5 A .250-77.0 A .250-68. 5 A .21...67.5 Flatbed....66. OD .044-70. OD .083-79. OD .042-73.0 D .104-74.5 D .063..74. OD .042-64.0 D .063..65.5 D .167-69.5 D .167-69.5 D .167-66.0 A .18.-.66.0 A .28...66.5 A .27
71.5 D .050..61.0 D .064-70.5 D .083..69.0 D .082-66.0 D .154..66.0 A .134..68.0 A .273..
0.50 ..........50 .0200.60 .0216.70 .0300
1.00 .06830.60 .0683
...... .00070
8. 9 . 00175. 8 . 00274. 8 . 00154. 3 , 00353. 6 . 00503. 5 . 00272. 3 . 00752. 4 . 01172. 0 . 01581. 8 . 02671. 3 . 02501. 4 . 02001. 3 . 02501. 5 . 03841. 5 . 00831. 6 . 04001. 6 . 03501.73 .0500
10. 7 . 0004215. 2 . 00123. 9 . 000703. 7 . 00172. 8 . 00182. 9 . 00222. 5 . 00202. 0 . 00722.2 .00631. 8 . 02171.88 .03072.19 .04172.56 .0546
7. 9 . 0003125. 3 . 0007543. 7 . 001632. 6 . 002184. 5 . 003761. 9 . 02632. 3 . 0403
0. 0292.0325.0438.0581.0724.112.152.206.289.404.826
.0277
.0332
.0372
.0443
.0513
.0585
.0655
.0661
.0755
.0899
.109
.141
.206
.258
.281
.280
.318
.386
.539
.7601.051.99.0507.0723.0661.0780.0972.110.129.165.215.342.861
1.371.75
.0591
.0611
.108
.158
.278
.6401.66
0.078.083.083.085.084.080.084.083.079.081.079
.186
.193
.193
.185
.185
.188
.189
.189
.186
.185
.183
.183
.182
.186
.185
.186
.190
.190
.197
.196
.197
.197
.252
.252
.246
.251
.254
.253
.250
.254
.250
.252
.246
.245
.244
.291
.294
.292
.295
.293
.290.282
0.091.092.092.094.094.090.095.093.089.090.086
.221
.238
.244
.232
.235
.243
.242
.244
.238
.241
.239
.245
.243
.248
.245
.248
.260
.259
.268
.272
.270
.240
.348
.364
.346
.358
.386
.377
.380
.397
.394
.398
.396
.398
.344
.382
.365
.450
.504
.518
.491.490
0.0531.0546.0533.0537.0692.0727.0775.0647.0660.0511.0371
.0284
.0307
.0339
.0347
.0367
.0393
.0360
.0374
.0371
.0398
.0417
.0475
.0469
.0430
.0422
.0430
.0467
.0449
.0396
.0452
.0406
.0221
.0294
.0323
.0313
.0314
.0367
.0343
.0379
.0400
.0424
.0403
.0470
.0489
.0260
.0215
.0198
.0278
.0346
.0381
.0320.0370
0. 0140.0142.0141.0142.0161.0163.0170.0155.0155.0137.0117
.0117
.0123
.0129
.0130
.0133
.0138
.0133
.0135
.0134
.0139
.0142
.0152
.0151
.0145
.0139
.0146
.0151
.0148
.0140
.0148
.0144
.0105
.0127
.0132
.0129
.0130
.0141
.013601430147
.0151
.0147
.0159
.0163
.0119
.0111
.0106
.0126
.0141
.0148
.0135.0144
Channel width=2.0 ft
148 149 ISO-
IS! 152 153
0.120.146.175
.180
.260
.320
0. 00489.00569.00816
.0117
.0172
.0234
0.098.091.091
.089
.093
.099
1.221.601.92
2.022.803.23
56,28019,56011,550
6,0003,945
900
0. 00170.00354.0119
.0272
.0775
.188
0.00330.00782.0241
.0574
.164
.403
1.851.982.30
2.583.174.23
80.0 B 0.12...78.0 B .03 77 n (B .03... 77>0 U* .02 80.0 A .06 80.0 A .08...79.0 Flatbed....
11.0 .........5.3 0.001484. 1 . 0041) 0.5 .022 (0. 6 . 0220.82 .039
0. 0366.0518.0891.131.278.465
0.089.083.083
.082
.085.090
0.094.087.087
.086
.089.095
0. 0751.0475.0472
.0606
.0480.0520
0. 0170.0133.0133
.0150
.0134.0142
See footnotes at end of table.

FLUME WIDTH AND WATER DEPTH EFFECTS
TABLE 1. Summary of experimental data, in English units Continued
H35
Unit water
Sediment trans port 1
Bun charge, Slope, S Q (ft per ft)W
(cfs per ft)
D veloc- Unit infeed i (ft) ity, V Measur- transport (Ib per
(fps) ing period rate, i sec) (sec) (Ib per
sec per ft)
Sur- Water - Bed forms 2
faceve- temp- locity er- Height Lengtl
(fps) ature (ft) (ft) 1 Travel velocity
(fps)
UnitTTTT_stream -LJ.J-
power, draulic a radius,
(Ib per R (ft) sec per ft)
TT,.Hy draulic radius of bed, -R& (ft)
Friction factor
Darcy- Weis- bach, Manning,
(ftV«)
Channel width =2.0 ft Continued
154 155. 156 .157158 1159 .
160 161 162....163 164....165 .166
167. 168 169 170....171 172
.428
.450
.500
.590
.8451.105
.780
.855
.8801.1101.291.6051.710
1.1201.2851.3701.4051.8002.290
. 00118
.00154
.00210
.00330
. 00714
.0113
.00106
.00097
.00137
.00281
.00445
.00643
. 00877
.00060
.00080
. 00147
. 00172
.00280.00560
.287
.293
.286
.290
.289
.293
.478
.490
.496
.496
.483
.490
.452
.692.681.711.700.702.66
1.491.541.752.042.923.77
1.631.751.772.242.673.283.78
1.621.891.932.012.563.47
23, 34048,900
5,7007,7706,5102,605
83,94053,9407,8607,6503,8303,5951,150
103,08032,70011, 9404,4401,205
585
. 000670
.00120
.00420
.0124
.0700
.192
. 000710
.00131
.00305
.0141
.0362
.100
.197
.000585. 00150.00410. 00730.0296.116
.00139
. 00239. 00859.0250.150.437
.00150
.00248
.00599
.0288
.0713
.194
.413
.00120. 00280.00799.0150.0583.275
1.941.972.222.703.334.40
1.891.922.052.622.963.774.55
1.761.952.042.222.803.96
75.0 D 0.78.0 D .
029..035..
83.0 D .049..83.0 D . ....07083.0 A .11...76.5 A .18...
74.5 D .040..79. 5 D .,054..80.0 D .072..76.5 D .11...79.0 D .13...80.0 A .16...79.0 A .20
72.5 D .071..80.0 D . 068..77.5 D .09...82.0 D .11 82.0 D .13 81.0 A? .16...
6.23.282.38
1.31.46
5.83.633.103.422.532.22.1
3.753.53.13.63.12.5
.00132
.00204
.00334
.00920
.0278.0322
.000489
. 00105
.00160
.00408
.0200
.0228
.0400
.000494
.00104. 000651.00188.00398.0343
.0315
.0432.0655.121.376.781
.0516
.0517
.0751
.194
.358
.644
.936
.0419
.0641.126.151.314.800
.223
.226.222.225.224.226
.324
.329
.331
.331
.327
.329
.311
.408
.405
.415
.412
.412.399
.247
.258.254.263.264.267
.396.388.416.434.431.436.403
.500
.492
.589
.590
.595
.574
.0305
.0378.0392.0459.0482.0462
.0332.0268.0373.0477.0526.0506.0492
.0240
.0233
.0421
.0451
.0454
.0478
.0127
.0141.0143.0155.0159.0155
.0141.0126.0149.0169.0177.0174.0169
.0124.0122.0165.0170.0170.0174
Channel width=3.9ft
173 174....175 176 177
1.291.281.361.431.47
0.00096. 000912. 00115. 00191. 00214
0.730.705.708.694.67
1.771.821.922.062.20
20,82016, 53012,48015,6004,290
0. 00156. 00205.00367.00830.0112
0. 00644.00800.0152.0308.0420
2.002.012.22
2.68
82.5 D .77.0 D .83.5 D .81.5 D .79.0 D .
07...13...13...15...18
3.6 0.0005664.34.22.53.0
. 000556
.000790
.00114
.00287
0. 0772.0730.0974.170.197
0.531.519.521.512.498
0.650.622.635.640.616
0. 0419.0368.0419.0594.0568
0. 0171.0160.0170.0202.0196
1 Immersed weight. Letter A in height column indicates bed forms were antidunes; B, bars; D, dunes.
Both dunes and antidunes occurred.Both bars and antidunes existed, simultaneously.
TABLE 2. Summary of experimental data, in metric units
[Precision of measurements indicated by table 1, not table 2]
Bun
Unit water
discharge, Q W
(liters per sec per m)
Sediment transport >
Depth, velocity, Slope, D V Measuring
S (cm) (cm per period sec) (sec)
Unit transport
rate, i (kg per sec per
m)
Bed forms 2
Sediment Surface Water infeed » velocity, tempera- (kg per (cm per ture Height Length
sec) sec) (°C) (cm) (cm)
Travel velocity, (cm per
sec)
Unit stream power, Hydraulic Hydraulic
<a radius, radius of (kg per R bed, R t sec per (cm) (cm)
m)
Channel width 7.5 cm
I.........2.........345. ...... .6. 7.
8 ......9. .10.......11 12 13 .14... .15.. ......16........17.. 18........19........20........21........22.. 23........24........25........
26. ....27 ..28.. ...29........30........
13.815.218.218.621.623.832.8
40.842.845.444.250.254.260.272.480.6QQ fl
97.4100.4104.0104.0119.0125.6167.2200.6
76.279.885.089.698.8
0. 00529 .00640 .00840 .0132 .0166 .0213 .0262
.00272
.00258
.00295
.00310
.00371
.00435
.00595
.00942.0131 .0133 .0177 .0174 .0208 .0205 .0197 .0222 .0288 .0350
.00237
.00271
.00288
.00363
.00485
3.1 3.2 3.3 3.0 3.0 2.8 3.0
9.3 9.2 9.1 9.0 9.2 9.2 9.49.09.5 9.5 9.5 9.0 9.0 9.0 9.0 9.0 9.0 9.5
15.5 15.3 15.3 15.2 15.2
44.5 48.0 56.0 64.0 73.0 84.0
108.0
44.0 46.5 49.0 49.5 54.0 59.0 64.579.085.5 94.0
105.0 113.0 113.5 119.0 133.0 138.0 181.0 214.5
49.5 52.5 55.5 59.0 64.5
2,580 1,800 1,200 1,500 5,400 6,540 4,200
55,140 17,400 11,340 7,320
15, 180 4,860 3,3302,5951,740 6,780
780 3,540
480 2,970 2,700 3,900 1,980
900
70, 920 14, 280 8,340
12, 780 7.200
0. 00315 .00702 .0149 .0375 .0851 .150 .327
.000803
. 00137
.00210
. 00324
.00708
. 00918
.0214
. 0551 .0905 ..102 .222.244 .310 .406 .597 .613
1.484 2.068
. 000565 . 00156 .. 00375 ., 00720 .. 0152 .
0. 000227 . 000526 . 00113 .00299 .00653 .0110 .0252
. 0000503
. 00758
.0184
.0293
.0378
.0490
.108
.0000342
52.5 56.0 65.5 77.0 84.5 97.5
117.5
53.0 52.0 56.0 56.5 61.0 67.0 77.095.0
103.0 109.0 113.0 122.0 117.5 125.5 137.0 141.0 180.5 208.5
49.5 59.0 64.5 67.0 75.0
21.2 Flatbed.....26.2 ...do.... ..24.2 ...do .21.6 A 1.0 22.2 A 1.2.... 23.6 A 1.4.... 24.6 A 1.6
IB 9 T* f\ A.
22.8 D 0.4... . 24.8 D 0.4... . 24.8 D 0.6 . 23.8 D 0.6 . 22.0 D 0.8 20.8 D 1.0. 200 (D 1.2 20-° U8 1.8 . 20.2 A 3.2 19.6 A 2.8 20.8 A 4.8 10.6 A 4.4.... 20.8 A 5.4. 18.8 A 4.8. 19.8 A 4.4. 20.8 A 6.6.... 19.6 Flatbed.....19.8 ... do..... ..
23.2 ...do.... ..24.0 D 1.0..-. 24.2 D 1.0 20.8 D 1.6. 20.4 D 1.8
16 19 2027
185 169 134 82 81 65 35 35 40 41 45 44 40 46 47 49
204 109 114 103
0.78 .95
1.17 1.45
.036
.047
.14 * .098
.15
.20
.51
.95)
.34j .56 .58 .85
1.27 1.33 1.39 1.99 1.60
.042
.12
.084
.14
0. 0725 .0975 .152 .244 .357 .506 .857
.111
.111
.133
.136
.186
.235
.372
.6831.051 1.167 1.714 1.747 2.161 2.131 2.333 2.780 4.806 7.008
.180 .216 .246 .324 .479
1.7 1.7 1.8 1.6 1.7 1.6 1.7
2.7 2.7 2.7 2.7 2.8 2.8 2.82.62.6 2.8 2.8 2.6 2.6 2.6 2.8 2.6 2.8 2.8
3.0 3.0 3.0 3.0 3.0
2.1 2.2 2.3 2.1 2.2 2.2 2.0
4.3 3.8 3.8 3.8 4.0 4.2 4.85.05.6 5.2 5.6 4.8 5.4 5.0 4.4 4.4 3.6 3.0
4 4. 4.8 4.5 5.5 6.4
See footnotes at end of table.

H36, SEDIMENT TRANSPORT IN ALLUVIAL CHANNELS
TABLE 2. Summary of experimental data, in metric units Continued
Run
Unit water
discharge, Q W
(liters per sec per m)
Slediment transport
Slope, Depth, velocity, S D V Measuring
(cm) (cm per period sec) (sec)
Unit Sediment Surface Water transport infeed > velocity, tempera- rate, i (kg per (cm per ture (kg per sec) sec) (°C) sec per
m)
Bed forms 2
Height Length Travel velocity,
(cm) (cm) (cm per sec)
Unit stream Hydraulic Hydraulic power, radius, radius of
a R bed, Rb (kg per (cm) (cm) sec per
m)
Channel width 7.5 cm Continued
31 ..32........33.. 34........35........36 .. 37 38 39. . 40 41.. ..42........43-.. .44... .45........46.. ..47.. ...48-. ...
49 50. ...51- .52 53. .54 55 56 ...57 58........59
60 ..61 ..62 63 64.. ......65 66 ..67 68 69 70 71 72. ....
' .-.....74 ....
'6 77 78 79-.-....80 81 82.. ...83 .......84 85 86
87 88 89 . 90... .Q192.._.....93 .....94. .
112. 2120. 0141. 2159. 8159. 0171. 0211. 8256. 0285.0116.0115. 219Q /L
159.8206.2
250.8275.0305.5
10.211.813.414.015.416.819.424.627.435.643.2
40.044.249.855.860.870.274.489.699.2
109.6115. 6139. 4178. 4
fid 9
73.676.281.885.890.6
106.0126. 4146. 8155. 8159. 8172. 4OQO O
315. 8
106. 811 c O
1 DA Q
161. 8197. 0OOQ fi
306. 6
.00651
.00763
.0104
.0123
.0158
.0212
.0188
.0238
.0309
.00250
.00234
.00300
.00539
.00793
.0101
.0146
.0183
.0225
0. 00383 .00481 .00558 . 00617 .00758 .0117 .0162 .0202 .0217 .0303 .0367
.00177
.00183
.00251
.00374
.00553
.00795
.00901
.0120
.0136
.0149
.0165
.0179
.0234
.00123
.00161
.00191
.00227 .00260 .00300 .00458 .00639 . 00931 .0111 .0141 .0141 .0144 .0230
.00115
. 00127
.00145
. 00211
.00324
.00456
.00951
.0135
15.4 15.2 15.4 15.5 15.5 15.0 16.0 15.0 14.5 21.4 21.4 21.8 22.2 21.6 21.421.021.0 21.0
3.1 3.1 3.1 3.1 3.2 3.0 3.0 3.0 3.0 2.6 2.4
8.9 9.3 9.4 9.2 8.8 9.0 9.0 9.5 9.5 9.5 9.0 8.8 9.2
15.0 15.2 15.0 15.4 15.3 15.2 15.0 15.4 15.5 15.0 15.5 14. ft 15.5 13.5
21.4 21.4 21.8 21.6 21.4 22.0 21.0 21.0
73.0 79.0 91.5
104.0 101.5 113.5 141.5 169.5 199.0 54.0 53.5 59.5 72.0 95.0
107.5119.0131.5147.5
33.0 38.5 43.0 45.0 49.0 56.5 64.5 80.5 91.5
134.5 173.5
45.0 47.0 53.0 61.0 69.0 78.5 83.0 95.5
106.0 115.0 126.5 160.0 195.0
46.0 48.0 50.5 53.0 56.0 59.5 70.5 82.0 94.0
103.5 104.0 117.5 147.5 234.0
50.0 54.0 56.5 62.0 75.5 89.5
113.5 145.0
3,120 2,460 2,040 5,790
360 240
4,020 1,320 2,040
11,640 4,500 5,640 6,000 5,520 5,3403,7202,940 3,120
19,260 7,740 5,160 8,700 3,420 1,920 1,380
840 420
2,070 2,310
19,020 21,600 7,980 6,960 3,660 1,590 1,980 1,080
810 515 415
1,860 1,620
38,580 19, 820 8,340
12, 780 6,420 6,240 3,000 2,040
840 3,120
490 5,580 1,980
960
55,800 14,400 12,900 18,000 14,640 6,900 3,420 2,250
.0295
.0484
.101
.143
.214
.423
.634 1.097 1.786 .000574 .000911 .00568 .0289 .0851 .132.321.488 .808
0. 000222 .00269 .00345 .00726 .0130 .0333 .0690 .159 .201 .589 .931
.000744
.00214
.00542
.0182
.0378
.0637
.0872
.165
.257
.353
.574
.961 2.039
.000432
.00232
.00339
.00622
.00940
.0105
.0333
.0804
.143
.257
.292
.524
.772 2.902
.000521
.00121
.00180
.00792
.0269
.0646
.274
.783
.0111
.0454
.0866
.136
.0000703
.0000843
.000403
.00220
. 00567
.0108
.0232
.0359
.0594
Channel width
0. 0000503
.0889
.145
.142
.312
.0000694
.0378
.0767
.115
.454
.0000834
.000112
.000315
.00104
.00415
.00962
.0397
.122
87.0 98.0
110.5 120.0 115.5 123.5 155.0 183.0 207.5 58.0 57.5 64.5 92.5
111.5 116.5140.0144.0 164.5
15.0 cm
48.0 53.0 56.5 61.0 67.0 78.0 90.0
111.5 117.5 148.5 173.0
53.5 56.0 60.0 77.0 84.0 96.5 94.0
102.5 109.5 123.0 144.0
213.0
50.5 55.0 59.0 63.5 65.0 69.5 91.5
102.5 115.5 128.0 122.0 148.0 162.0 239.5
54.5 57.5 58.5 67.5 85.5
104. *> 131.0 166.0
21.2 21.2 20.2 18.4 22.8 23.0 17.4 17.6 15.2 15.6 17.8 13.4 15.0 18.4 17.017.216.4 16.6
20.2 22.0 26.4 22.0 26.8 22.8 23.8 24.2 24.2 8.0 8.0
20.8 20.4 19.8 19.0 18.6 17.8 17.4 18.2 18.0 17.6 18.0 10.4 12.0
22.2 26.4 26.2 26.8 26.0 25.4 24.8 26.0 26.4 11.0 26.6 9.8
11.6 8.8
16.0 18.6 23.0 23.8 24.0 14.0 12.6 12.0
D 1.8 . D 2.O.... D 2.4.... A 5.4.... A 6.8.... A 8.6.... A 6.8.... A 6.6. TOlnf V,0H
D 0.8- D 0.8-- D 1.6 D 3.2-- D 3.0-... D 3.8---.
JD 3.8---. U 6.8 A 6.8..- A 8.2-..
Flatbed .....do ...... ....do .....do A? ...... .A 1.2 A 1.6 A 2.0 Flatbed--.
...do ... ....
...do ....
D 0.6. D 0.6.-.- D 0.8---. D 1.0-- D 1.4---. A 2.2.... A 3.0--. A 4.0... . A 4.6---- A 5.4.-- A 6.0.- Flatbed--.
...do .
D O.6.... D 1.4--.. D 1.4... _ D 2.0 .. D 2.2-- D 1.8 D 2.4-..- D 2.4---- A? 4.2 A 6.8-.. A 7.6.-.. A 6.O.... A 7.6-.-.TF1 Q * VmH
D 0.8... D 1.2.... D 1.8. D 2.6..... D 2.6 D 3.2 A 7.6...- A 6.8.
69 64 98 56 61 76 63 74
117101 9178 41 81 79 81
12 .18 21 24
202 105 78 56 46 34 34 38 50 46 55
219 106 98
104 97 77 66 66 58 59 59 63 69
180 174 90 71 72 69 74
.43
.60
.87
.82 .98
1.34 2.13 2.96
.015
.0085
.062
.23
.93 1.01 2.49) 1.34) 1.66 2.54
.86 1.24 1.52
,052 .073 .20 .45 .55 .47 .52 .95
1.01 1.39 2.13
.017
.041
.037
.081
.094
.11
.69
.84
.91 1.17 1.07 1.55 2.35
.021
.18
.025
.071
.018
.54 1.04 1.71
.729
.914 1.466 1.964 2.515 3.616 3.973 6.056 8.794 .289 .269 .388 .862
1.637 2.3363.6605.029 6.875
0. 0390 .0571 .0744 .0860 .117 .195 .312 .497 .592
1.080 1.592
.0705
.0808
.124
.208
.336
.558
.668 1.071 1.348 1.622 1.905 2.500 4.166
.0850
.119
.146
.186
.223
.272
.485
.805 1.363 1.711 2.247 2.425 3.318 7.261
.123
.146
.177
.284
.524
.897 2.277 4.122
3.0 3.0 3.0 3.0 3.0 3.0 3.0 3.0 3.0 3.2 3.2 3.2 3.2 3.2 3.23.03.0 3.0
2.2 2.2 2.2 2.2 2.0 2.0 2.0 2.0 2.0 2.0 2.0
4.1 4.2 4.2 4.2 4.0 4.2 4.0 4.0 4.0 4.0 4.0 4.0 4.0
5.1 5.1 5.1 5.1 5.1 5.1 5.0 5.0 5.0 5.0 5.0 5.0 5.0 5.0
5.6 5.6 5.6 5.6 5.6 5.6 5.5 5.5
7.0 7.0 7.4 7.0 9.0 9.0 6.0 5.0 5.0 5.0 4.2 5.1 8.2 6.8 7.09.09.5 9.5
2.7 2.6 2.7 2.7 2.5 2.5 2.5 2.5 2.5 2.0 2.0
5.5 5.5 5.9 6.0 6.2 6.6 6.5 7.0 7.0 7.0 6.5 5.5 5.5
6.8 8.2 8.5 9.1 9.3 9.5 9.8
10.4 11.0 10.5 11.5 10.5 9.5 6.0
7.4 7.2 8.0
10.0 10.4 11.0 13.0 12.5
Channel width 30.5 cm
95 .96 ..97 98 99 100 101 102 ....103... 104.......
10.611.813.214.614.415.417.820.421.627.2
0.00407 .00411 .00495 . 00590 . 00751 .0108 .0128 .0151 .0199 .0222
2.8 3.0 3.0 3.2 3.0 3.0 3.0 3.0 3.0 3.0
38.0 39.0 43.0 47.0 46.5 53.5 57.5 67.5 75.5 91.5
226,620 17,940 10,140 5,400 2,460 1,440 1,684 2,183
960 473
0.000805 .00216 .00433 .00882 .0139 .0295 .0512 .0859 .167 .250
0. 000235 50.5 51.0 57.5 63.5 67.5 73.5 81.5 87.0
103.5 117.5
13.818.6 19.2 21.0 12.6 11.8 17.6 15.6 23.6 24.8
T?1at Vtari
... do - .
...do ...... do... j^A 0.6. A 1.2 .. A 2.6. A 1.6..- A 2.2-.--
15 .15 18 21 3018
.61
.66
.91 2.08 2.08
0.0434 .0484 .0652 .0865 .108 .167 .226 .307 .430 .601
2.4 2.5 2.5 2.6 2.6 2.4 2.6 2.6 2.4 2.4
2.8 2.8 2.8 2.8 2.8 2.8 2.8 2.8 2.8 2.8
See footnotes at end of table.
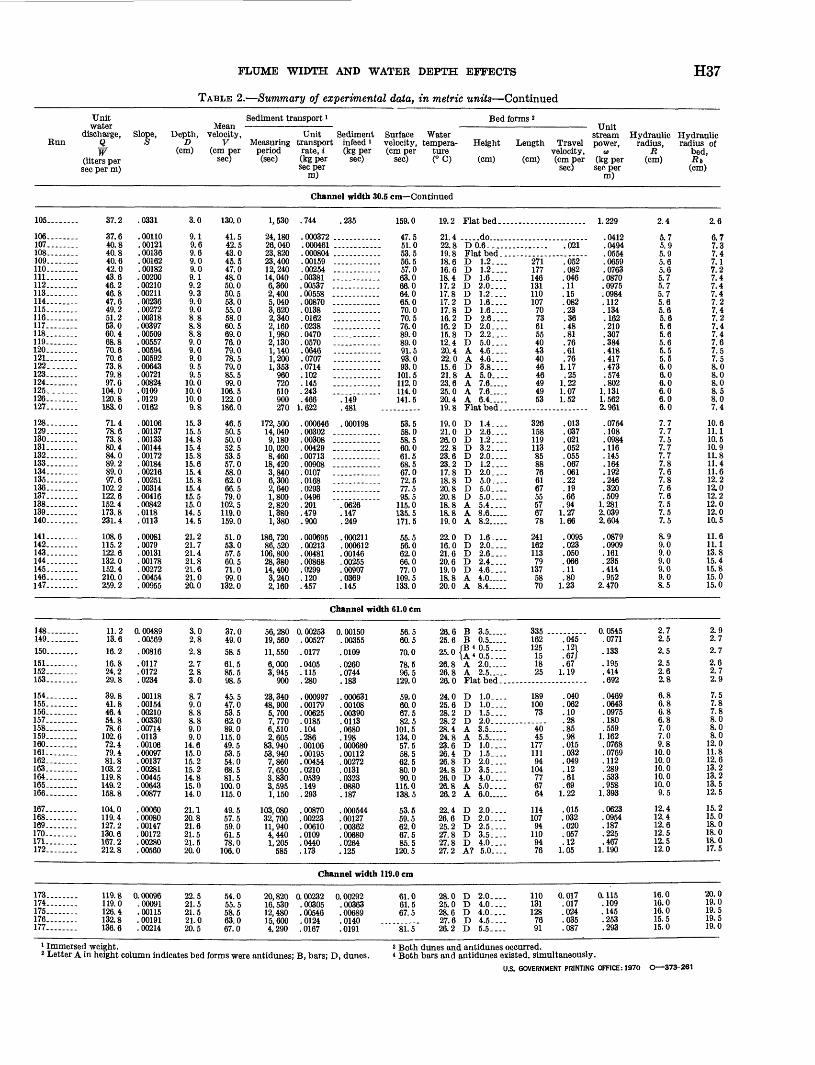
FLUME WIDTH AND WATER DEPTH EFFECTS H37
TABLE 2. Summary of experimental data, in metric units Continued
Bun
Unit water
discharge, Q w
(liters per sec per m)
Sediment transport '
Slope, Depth, velocity, S D V Measuring
(cm) (cm per period sec) (sec)
Unit Sediment transport infeed ' rate, i (kg per (kg per sec) sec per
m)
Bed forms 2
Surface Water velocity, tempera- Height Length (cm per ture
sec) (° C) (cm) (cm)
Travel velocity, (cm per
sec)
Unit stream Hydraulic Hydraulic power, radius, radius of
<a R bed, (kg per (cm) Rt sec per (cm)
m)
Channel width 30.5 cm Continued
105. .-.
106 .107 108 109 110 .111- .112.......113 114......115--....116-.. ...117 118 - 119 ....120 121 122......123 ..124- 125.-. 126 127.. ..
128.. .129 ISO-IS! ...132. .133 . 134 135 136 . 137 138 139 140
141 142 143. 144 -.145 .idfi147
37.2
37.640.840.840.642.043.646.246.847.649.251.253.060.468.870.670.673.879.897.6
104.0120. 8183. 0
71 478.673.880.484.089.289.097.6
102.2122.6152. 4173. 8231. 4
108.6115. 2122. 6132. 0152 4210. 0259. 2
.0331
.00110
.00121
.00136
.00162
.00182 .00200 .00210 .00211 .00236 .00272 .00318 .00397 .00509 .00557 .00594 .00592 .00643 .00721 .00824 .0109 .0129 .0162
.00106
.00137
.00133
.00144
.00172
.00184
.00216
.00251
.00314
.00416
.00842
.0118
.0113
.00081
.0079
.00131
.00178
.00272
.00454
.00955
3.0
9.1 9.6 9.6 9.0 9.0 9.1 9.2 9.3 9.0 9.0 8.8 8.8 8.8 9.0 9.0 9.0 9.5 9.5
10.0 10.0 10.0 9.8
15.3 15.5 14.8 15.4 15.8 15.6 15.4 15.8 15.4 15.5 15.0 14.5 14.5
21.2 21.7 21.4 21.8 21.6 21.0 20.0
130.0
41.5 42.5 43.0 45.5 47.0 48.0 50.0 50.5 53.0 55.0 58.0 60.5 69.0 76.0 79.0 78.5 79.0 85.5 99.0
106.5 122.0 186.0
46.5 50.5 50.0 52.5 53.5 57.0 58.0 62.0 66.5 79.0
102.5 119.0 159.0
51.0 53.0 57.5 60.5 71.0 99.0
132.0
1,530
24,180 26,040 23, 820 23,400 12,240 14,040 6,360 2,400 5,040 3,620 2,340 2,160 1,980 2,130 1,140 1,200 1,353
960 720 510 900 270
172, 500 14,040 9,180
10,020 8,460
18, 420 3,840 6,300 2,640 1,800 2,820 1,380 1,380
186, 720 86, 520
106,800 28, 380 14,400 3,240 2,160
. 744 . 235
.000372 .............000461 ..... ..000804 .............00159 .............00254 .............00381 --------.00537 .............00558.00870 ---.....0138 .-.. ..0162 ... .... -.0238 ..- -.0470 - .--.-..0570 ----------.0646 ----------.0707 . ....0714 .............102 .............145 ..--.....243 ............. 466 . 149
1. 622 . 481
. 000646 . 000198
.00302 ............0030800429f\A7io
nnontt.0107 ... --.0168 ... .0293 ... ....
(\AQfi
. 201 . 0626
. 479 . 147
.900 .249
. 000695 . 000211
. 00213 . 000612
. 00481 . 00146
. 00868 . 00255
. 0299 . 00907
. 120 . 0369 . 457 . 145
159.0
47.5 51.0 53.5 56.5 57.0 63.0 66.0 64.0 65.0 70.0 70.5 76.0 89.0 89.0 91.5 93.0 93.0
101.5 112.0 114.0 141.5
53.5 58.0 58.5 60.0 61.5 68.5 67.0 72.5 77.5 95.5
115.0 135.5 171.5
55.5 56.0 62.0 66.0 77.0
109.5 133.0
19.2 Flatbed.
21.4 .... .do...... ..22.8 D0.6-. 19.8 Flatbed.-.-.18.6 D 1.2 16.6 D 1.2. ... 18.4 D 1.6 17.2 D 2.0 17.8 D 1.2. 17.2 D 1.6. 17.8 D 1.6. 16.2 D 2.6. 16.2 D 2.0. 15.8 D 2.2. 12.4 D 5.0- 20.4 A 4.6- 22.0 A 4.6- 15.6 D 3.8-.-- 21.8 A 5.0-... 23.6 A 7.6- 25.0 A 7.6 20.4 A 6.4 19.8 Flatbed..
19.0 D 1.4. 21.0 D 2.6 26.0 D 1.2. 22.8 D 3.2-... 23.6 D 2.0- 23.2 D 1.2.--. 17.8 D 2.0. 18.8 D 5.0 20.8 D 5.0- ... 20.8 D 5.0. 18.8 A 5.4. 18.8 A 8.6. . 19.0 A 8.2
22.0 D 1.6- 16.0 D 2.0- 21.6 D 2.6. 20.6 D 2.4.-.. 19.0 D 4.6.-- 18.8 A 4.0- 20.0 A 8.4
271 177 146 131 110 107
70 73 61 55 40 43 40 46 46 49 49 53
326 158 119 113 85 88 76 61 67 55 57 67 78
241 162 113 79
137 58 70
.021
.052
.082 .046 .11 .15 .082 .23 .36 .48 .81 .76 .61 .76
1.17 .25
1.22 1.07 1.52
.013
.037
.021
.052
.055
.067
.061
.22
.19
.66
.94 1.27 1.66
.0095
.023
.050
.066
.11
.80 1.23
1.229
.0412
.0494
.0554
.0659
.0763 .0870 .0975 .0984 .112 .134 .162 .210 .307 .384 .418 .417 .473 .574 .802
1.131 1.562 2.961
.0754
.108
.0984
.116
.145
.164
.192
.246
.320
.509 1.281 2.039 2.604
.0879
.0909
.161
.235
.414
.952 2.470
2.4
5.7 5.9 5.9 5.6 5.6 5.7 5.7 5.7 5.6 5.6 5.6 5.6 5.6 5.6 5.5 5.5 6.0 6.0 6.0 6.0 6.0 6.0
7.7 7.7 7.5 7.7 7.7 7.8 7.6 7.8 7.6 7.6 7.5 7.5 7.5
8.9 9.0 9.0 9.0 9.0 9.0 8.5
2.6
6.7 7.37.4 7.1 7.2 7.4 7.4 7.4 7.2 7.4 7.2 7.4 7.4 7.6 7.5 7.5 8.0 8.0 8.0 8.5 8.0 7.4
10.6 11.1 10.5 10.9 11.8 11.4 11.6 12.2 12.0 12.2 12.0 12.0 10.5
11.6 11.1 13.8 15.4 15.8 15.0 15.0
Channel width 61.0 cm
148 149 150----..151 152.... 153 .
154. 155 156 157 158 159. 160 .161. ......162 163 .164 165 166
167. 168 169 170 171 172.
11.213.616.216.824.229.8
39.841.846 454.878.6
102.672.479.481.8
103.2119. 8149. 21 CO Q
104.0119 4127. 2130. 6167. 2212. 8
0.00489 .00569.00816.0117 .0172 .0234
.00118
.00154
.00210
.00330
.00714
.0113
.00106
.00097
.00137
.00281
.00445
.00643
.00877
.00060
.00080
.00147
.00172
.00280
.00560
3.02.82.82.7 2.8 3.0
8.7 9.0 8.8 8.8 9.0 9.0
14.6 15.0 15.2 15.2 14.8 15.0 14.0
21.1 20.8 21.6 21.5 21.5 20.0
37.0 49.058.561.5 85.5 98.5
45.5 47.0 53.5 62.0 89.0
115.0 49.5 53.5 54.0 68.5 81.5
100.0 115.0
49.5 57.5 59.0 61.5 78.0
106.0
56, 280 19,56011, 5506,000 3,945
900
23,340 48,900 5,700 7,770 6,510 2,605
83, 940 53,940 7,860 7,650 3.830 3,595 1,150
103, 080 32,700 11, 940 4,440 1,205
585
0. 00253 0. 00150 . 00527 . 00355. 0177 . 0109. 0405 . 0260 . 115 . 0744 .280 .183
. 000997 . 000631
. 00179 . 00108
. 00625 . 00390
. 0185 . 0113 . 104 . 0680 . 286 . 198 . 00106 . 000680 . 00195 . 00112 . 00454 . 00272 . 0210 . 0131 . 0539 . 0323 . 149 . 0880 . 293 . 187
. 00870 . 000544 . 00223 . 00127 . 00610 . 00362 . 0109 . 00680 . 0440 . 0264 . 173 . 125
56.5 60.570.078.5 96.5
129.0
59.0 60.0 67.5 82.5
101.5 134.0 57.5 58.5 62.5 80.0 90.0
115.0 138.5
53.5 59.5 62.0 67.5 85.5
120.5
26.6 B 3.5 25.6 B 0.5 250 IB < 0.5 25-°U«0.5. 26.8 A 2.0 26.8 A 2.5
24.0 D 1.0. 25.6 D 1.0- 28.2 D 1.5. 9ft 9 T\ 9 fl
28.4 A 3.5- 24.8 A 5.5 23.6 D 1.0. 26.4 D 1.5 . 26.8 D 2.0. 24.8 D 3.5. 26.0 D 4.0 - 26.8 A 5.0-... 26.2 A 6.0
22.4 D 2.0. 26.6 D 2.0. 25.2 D 2.5. 27.8 D 3.5. 27.8 D 4.0. ... 27.2 A? 5.0
335 .162 125
15 18 25
189 100 73
40 45
177 111 94
104 77 67 64
114 107
94 110 94 76
.045
.121
.B7J
.67 1.19
.040
.062
.10
.28
.85
.98
.015
.032
.049
.12
.61
.69 1.22
.015 .032 .020 .057 .12
1.05
0. 0545 .0771.133.195 .414 .692
.0469
.0643
.0975
.180
.559 1.162 .0768 .0769 .112 .289 .533 .958
1.393
.0623
.0954
.187
.225
.467 1.190
2.7 2.52.52.5 2.6 2.8
6.8 6.8 6.8 6.8 7.0 7.0 9.8
10.0 10.0 10.0 10.0 10.0 9.5
12.4 12.4 12.6 12.5 12.5 12.0
2.9 2.72.72.62.7 2.9
7.5 7.8 7.8 8.0 8.0 8.0
12.0 11.8 12.6 13.2 13.2 13.5 12.5
15.2 15.0 18.0 18.0 18.0 17.5
Channel width 119.0 cm
173 174 175 176 177 .
119. 8119.0126.4132. 8136. 6
0.00096 .00091 .00115 . 00191 .00214
22.5 21.5 21.5 21.0 20.5
54.0 55.5 58.5 63.0 67.0
20, 820 16, 530 12, 480 15,600 4.290
0. 00232 0. 00292 . 00305 . 00363 . 00546 . 00689 . 0124 . 0140 . 0167 . 0191
61.0 61.5 67.5
81.5
28.0 D 2.0.-. 25.0 D 4.0- 28.6 D 4.0- 27.6 D 4.5- 26.2 D 5.5-
110 131128
76 91
0.017 .017 .024 .035 .087
0.115 .109 .145 .253 .293
16.0 16.0 16.0 15.5 15.0
20.0 19.0 19.5 19.5 19.0
1 Immersed weight.2 Letter A in height column indicates bed forms were antidunes; B, bars; D, dunes.
3 Both dunes and antidunes occurred.4 Both bars and antidunes existed, simultaneously.
US. GOVERNMENT PRINTING OFFICE: 1970 O 373-261