Embed Size (px)
Citation preview

JPL Publication 83-44
Fluidized Bed Coal Desulfurization Final Report
Maddury Ravindram
LNASA-CR-173102) FLUIDIZEE COALBED 183-35064 DESULFURIZATION Final Report (JetPropulsion Lab) 97 p HC A05HM AOI
CSCL 07D nclas G325 42167
August 1983
RVSA National Aeronautics and Space Administration
Jet Propulsion LaboratoryCalifornia Institute of TechnologyPasadena California
JPL Publication 83-44
Fluidized Bed Coal Desulfurization Final Report
Maddury Ravindram
August 1983
PJASA National Aeronautics and Space Administration
Jet Propulsion Laboratory California Institute of Technology Pasadena California
Reference to any specific commercial product process or service by trade name or manufacturer does not necessarily constitute an endorsement by the US Government or Jet Propulsion Laboratory California Institute of Technology
Work was conducted through NASA Task RE-73 NASA RTOP No BR-404-00-73-02-39
ABSTRACT
Preliminary studies on Fluidized Bed Coal Desulfurization were conducted at the Jet Propulsion Laboratory California Institute of Technology under the NRC-NASA Associateships Program and JPL Directors Discretionary Fund for the period December 14 1981 through December 14 1982
Laboratory scale experiments were conducted on two high-volatile bituminous coals in a bench scale batch fluidized bed reactor Chemical pre-treatment and post-treatment of coals were tried as a means of enhancing desulfurizashytion Sequential chlorination and dechlorination-cum-hydrodesulfurization under modest conditions relative to the water-slurry process were found to result in substantial sulfur reductions of about 80 Sulfur forms as well as proximate and ultimate analyses of the processed coals are included -
These studies indicate that a fluidized bed reactor process has considerable potential for being developed into a simple and economic process for coal desulfurization
iii
PREFACE
The work described in this report was performed in the Control and Energy Conversion Division of the Jet Propulsion Laboratory California Institute of Technology Pasadena California 91109 under a JPL Directors Discretionary Fund (DDF) grant during the period December 14 1981 through December 14 1982 while Dr M Ravindram was a NRC NASA Senior Resident Research Associate at JPL
iv
ACKNOWLEDGMENTS
The author is indebted to Dr John J Kalvinskas for his constant help and unceasing efforts to make the formers stay at the Jet Propulsion Laboratory enjoyable and professionally meaningful
The author is grateful to the National Research Council and the National Aeronautics and Space Administration for awarding a Senior Resident Research Associateship under the NRC-NASA Associateships Program and to the Indian Institute of Science for awarding the necessary leave
The author is also thankful to the Jet Propulsion-Laboratory for providing financial assistance (DDF grant) and physical facilities to carry out this work and to the California Institute of Technology for providing graduate student assistance
Finally it is a pleasure to acknowledge the spontaneous assistance extended by the administrative secretarial and other staff in the Thermochemical Research and Systems Section
V
FOREWORD
This report is based on the experimental results of Fluidized Bed Coal Desulfurization studies conducted at the Jet Propulsion Laboratory under a DDF grant during the period December 14 1981 through December 14 1982 The study covers chlorination dechlorination and hydrodesulfurization of two high volatile bituminous coals in a laboratory-scale batch fluidized bed reactor A follow-on program is planned that addresses itself to parametric estimation and detailed kinetics studies on coal desulfurization in a fluidized bed reactor
vi
CONTENTS
Page
I INTRODUCTION 1
II SUMMARY 2
III CONCLUSIONS AND RECOMMENDATIONS 3
IV COAL DESULFURIZATION 4
V SULFUR IN COAL 6
VI CHEMICAL COAL CLEANING METHODS 8
A COAL DESULFURIZATION BY CHLORINE 9
B COAL DESULFURIZATION IN THE SOLID PHASE 11
VII LABORATORY SCALE COAL DESULFURIZATION EXPERIMENTS IN A BATCH-FLUIDIZED BED REACTOR 13
A SELECTION OF COALS 13
B EQUIPMENT OPERATING PROCEDURES AND METHODS OF ANALYSES 13
1 Equipment 13
2 Fluidization Experiments 18
3 Desulfurization Experiments 21
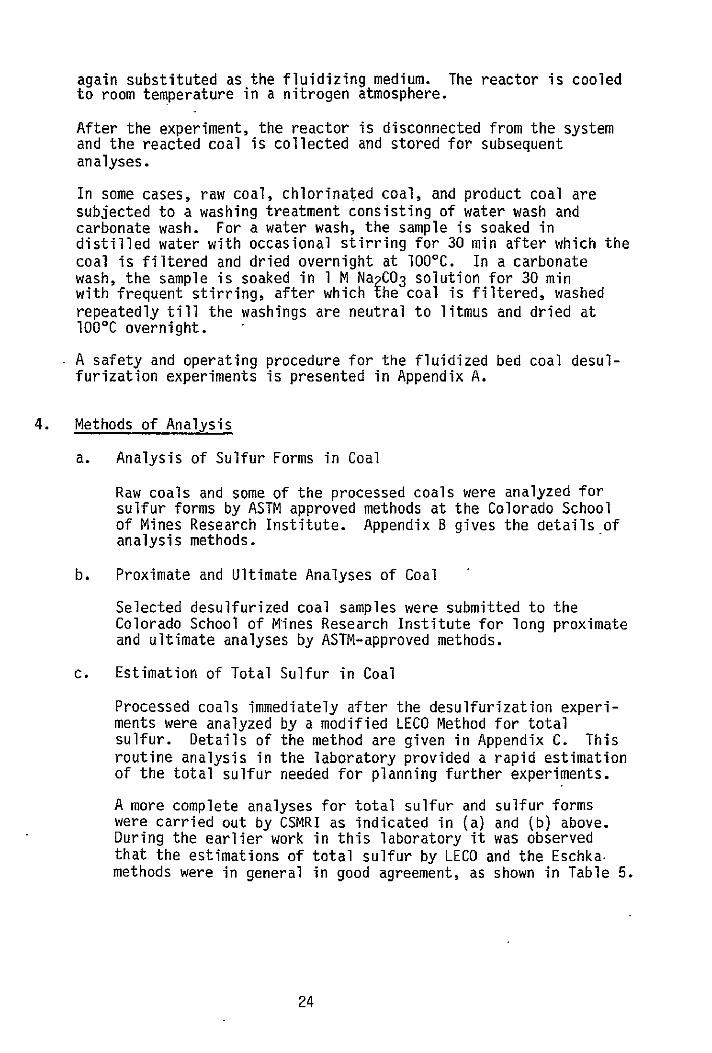
4 Methods of Analysis 24
a Analysis of Sulfur Forms in Coal 24
b Proximate and Ultimate Analyses of Coal 24
c Estimation of Total Sulfur in Coal 24
d Surface Area and Pore Volume of Coal 26
e Analysis of Scrubber Solution 26
f Coal Characterization Using Scanning Electron
Microscopy 28
VIII RESULTS AND CONCLUSIONS 43
A PSOC 282 COAL 43
1 Chlorination 43
vii
Page
2 Dechlorination 50
3 Hydrodesulfurization 50
B PSOC 276 COAL 52
IX SCANNING ELECTRON MICROSCOPY (SEM) EXAMINATION OF COAL SURFACE 53
A SEM PHOTOGRAPHS 53
B EDAX SPECTRA 54
C CONCLUSIONS 54
X RESULTS OF CSMRI ANALYSES 55
A TOTAL SULFUR AND SULFUR FORMS 55
1 PSOC 282 Coal 55
2 PSOC 276 Coal 55
3 Comparison of CSMRI and LECO Analyses 58
B PROXIMATE AND ULTIMATE ANALYSES 58
1 PSOC 282 Coal 58
2 PSOC 276 Coal 61
C CONCLUSIONS 61
XI REFERENCES 63
APPENDICES
A Operating Procedure for the Laboratory Scale Batch Fluidized Bed Reactor System for Coal Desulfurization 65
B Analytical Procedure to Determine Sulfur Forms in Coal (ASTM Method) 73
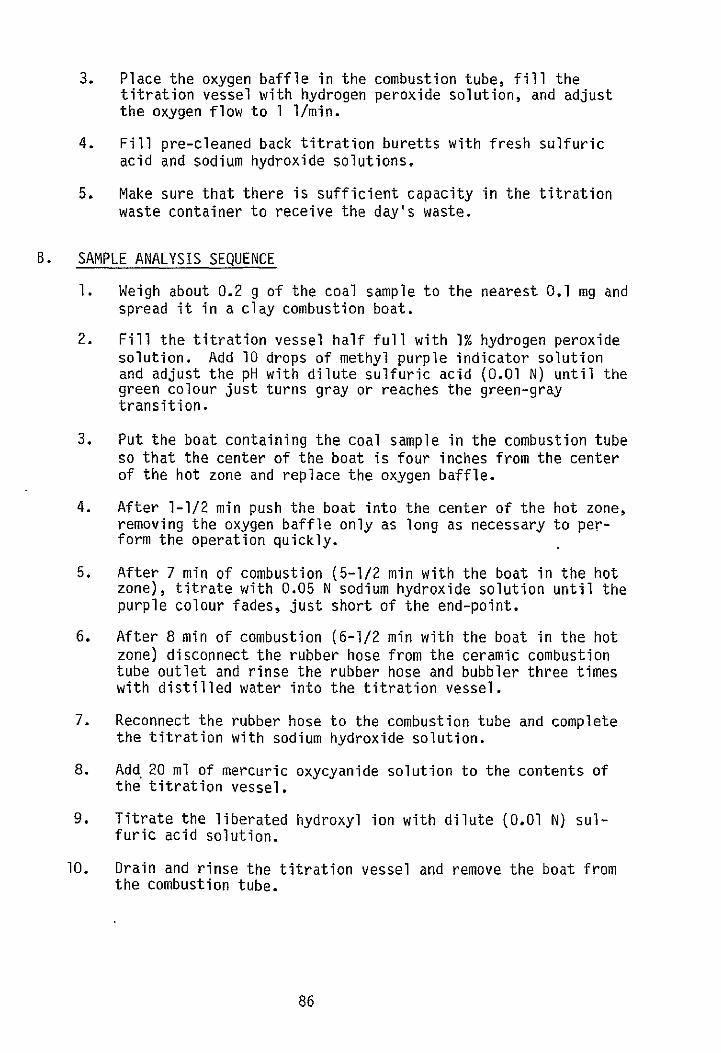
C Modified LECO Method for Total Sulfur and Chlorine Determination in Coal 83
D Surface Area and Pore Volume Determination by Low Temperature Nitrogen Adsorption 89
viii
Figure Page
1 Batch Fluidized Bed ReactorSystem for Coal Desulfurization 16
2 Fluidized Bed Reactor 17
3 Fluidization Characteristics of Coal 19
4 Fluidization Characteristics of Coal 20
5 Process Flow Diagram for Laboratory Scale Fluidized Bed Coal Desulfurization 23
6 Typical EDAX Spectrum of Coal 30
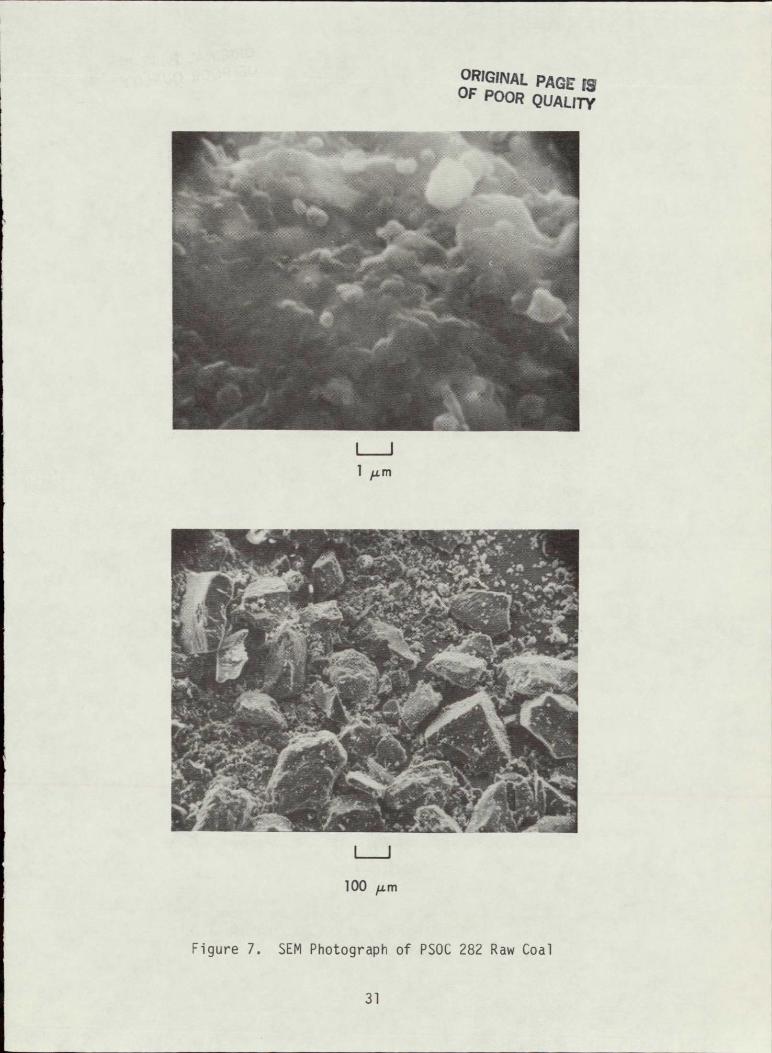
7 SEM Photograph of PSOC 282 Raw Coal 31
8 SEM Photograph of PSOC 282 Washed with IM Na2CO3 Solution 32
9 SEM Photograph of PSOC 282 Treated Coal (Run No 0032) 33
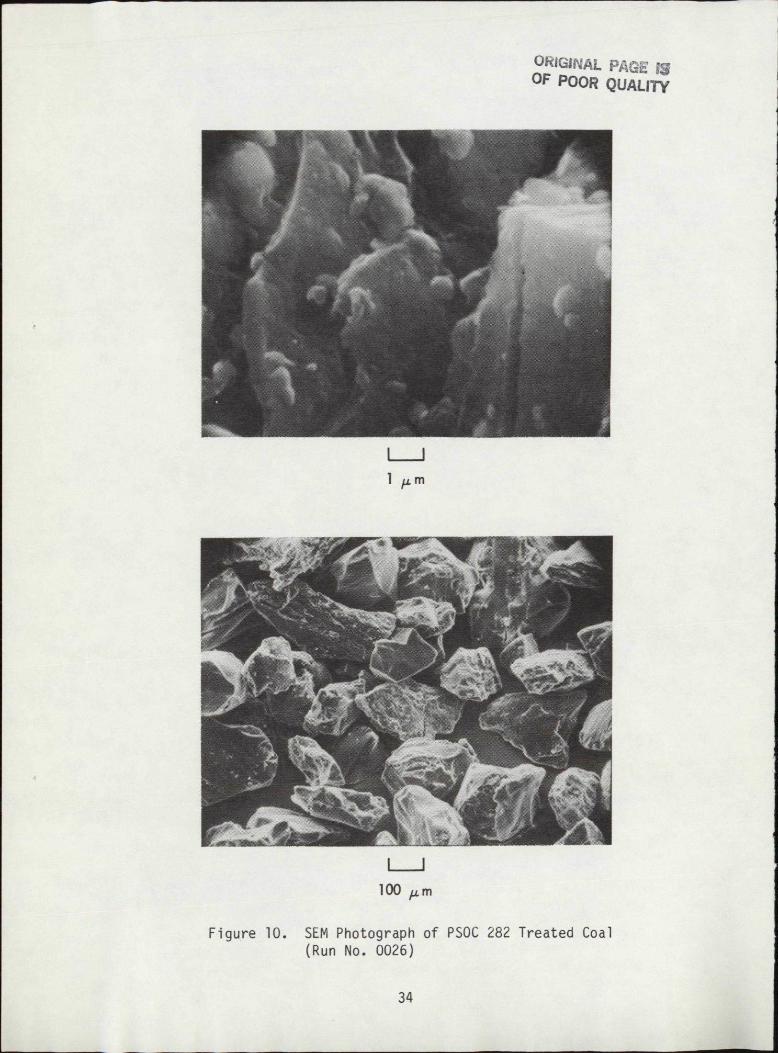
10 SEM Photograph of PSOC 282 Treated Coal (Run No 0026) 34
11 SEM Photograph of PSOC 282 Treated Coal (Run No 0027) 35
12 SEM Photograph of PSOC 282 Treated Coal (Run No 0039) 36
13 SEM Photograph of PSOC 276 Raw Coal 37
14 SEM Photograph of PSOC 276 Treated Coal (Run No 0046) 38
15 EDAX Spectrum of Coal 39
16 EDAX Spectrum of Coal 40
17 EDAX Spectrum of Coal 41
18 EDAX Spectrum of Coal 42
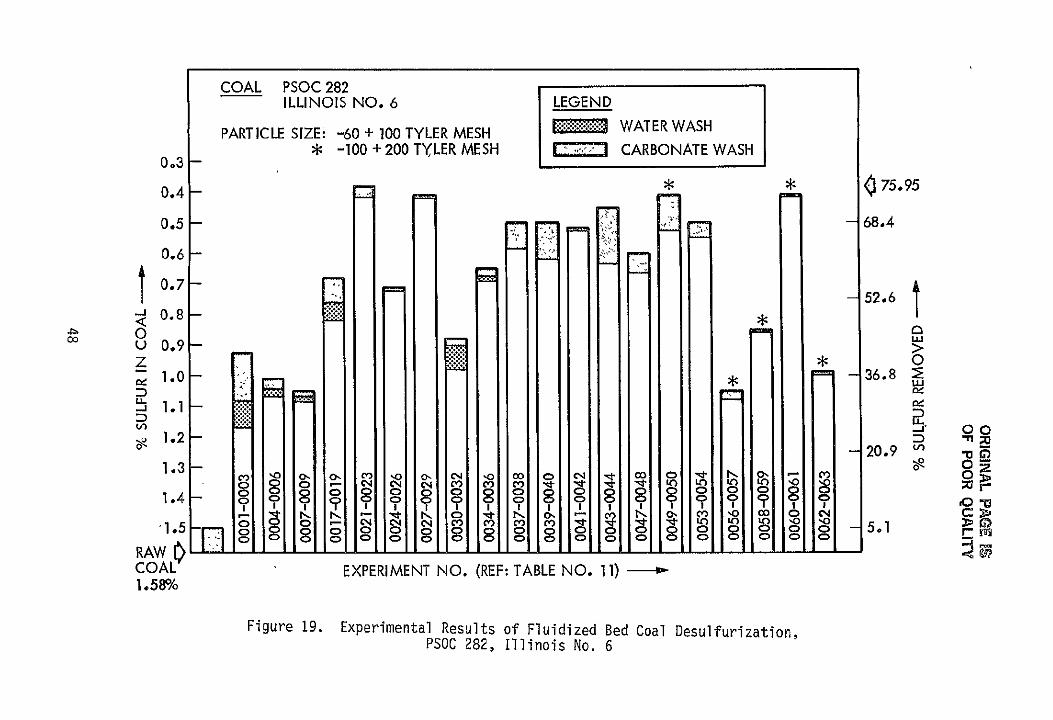
19 Experimental Results on Fluidized Bed Coal Desulfurization 48
20 Experimental Results on Fluidized Bed Coal Desulfurization 49
ix
Table Page
1 Characteristics of Raw Coals Employed in the Studies 14
2 Proximate and Ultimate Analyses of Raw Coals Employed in the Studies 15
3 Calculated and Observed Values of Minimum Fluidization Velocity (Umf) 22
4 Actual Flow Rates Employed in the Experiments 22
5 LECO Acid-Base Analysis vs Eschka Analysis for Total Sulfur 25
6 Specific Surface Area and Pore Volume of Raw Coals Employed in the Study 27
7 Experimental Conditions and Results 44
8 Experimental Conditions and Results 47
9 Total Sulfur and Forms of Sulfur in Selected Product Coals (PSOC 282) 56
10 Total Sulfur and Forms of Sulfur in Selected Product Coals (PSOC 276) 57
11 Comparison of Total Sulfur Estimation by Eschka
and LECO Methods 59
12- Proximate and Ultimate Analyses of Selected Product Coals 60
13 Effective Molecular Areas of Various Adsorbates 93
x
I INTRODUCTION
The Jet Propulsion Laboratory (JPL) initiated development of the Chlorinolysis Process for Coal Desulfurization in 1976 under the JPL Directors Discreshytionary Fund The preliminary results of coal desulfurization by chlorinshyolysis attracted Bureau of Mines funding for a four-month laboratory screening study of 12 bituminous subbituminous and lignite coals obtained from the Eastern Midwestern and Western regions of the United States (Ref 1) The follow-on work in Phases II and III (Ref 2 and 3) was funded by the United States Department of Energy (DoE) and included substantial modification and development of the process to provide process improvements and reduced process costs
Following Phase II and Phase III a subsequent DoE-funded study titled Coal Desulfurization by Chlorinolysis-Production and Combustion Test Evaluation of Product Coals (Ref 4) was conducted to determine the ignition and burning characteristics of these coals at the Pennsylvania State plane flame furnace These combustion test evaluations represent a first to any of the chemical coal cleaning processes
The current Fluidized Bed Coal Desulfurization Program was conducted under the JPL Directors Discretionary Fund Two coals PSOC 276 (Pittsburgh coal from Harrison County Ohio) and PSOC 282 (Illinois No 6 coal from Jefferson County Illinois) were chosen for the study The study included several chlorination dechlorination and hydrodesulfurization tests in a laboratory scale fluidized bed reactor Some of the product coals as well as raw and chlorinated coals were subjected to washing treatments This report includes the results of the laboratory fluidized bed reactor tests the influence of process parameters and product evaluation by LECO analyses for total sulfur in the laboratory and more complete analyses carried out by the Colorado School of Mines Research Institute (CSMRI) which were conducted from December 14 1981 through December 14 1982
II SUMMARY
This is the final report for the Fluidized Bed Coal Desulfurization studies conducted at the Jet Propulsion Laboratory California Institute of Technology at Pasadena California under a JPL Directors Discretionary Fund (DDF) grant for the period December 14 1981 through December 14 1982
The scope of the work consisted of several phases (1) design and fabrication of a laboratory-scale fluidized bed reactor system for coal desulfurization (2) laboratory-scale tests consisting of sequential chlorination dechlorinashytion andor hydrodesulfdrization on two high-volatile bituminous coals and (3) assessment of the influence of pre-treatments to raw coals and chlorinated coals and post-treatment of processed coals on the extent of sulfur removed
Laboratory-scale screening tests with PSOC 276 and PSOC 282 coals were used to investigate (1) the feasibility of coal desulfurization in the solid state (2) the effect of reaction time and temperature on chlorination (3) the effect of employing a mixture of nitrogen and chlorine during chlorination (4)the effect of reaction time and temperature during hydrodesulfurization and dechlorination (5)the influence of an alkaline wash to raw coal chlorinated coals and hydrodesulfurized coals and (6) the specific advantages of coal desulfurization in a gas fluidized bed reactor as compared to the chlorinolysis process employing coal-water slurries
Results of the studies indicate that (1) the two coals studied could be desulfurized to approximately the same levels achieved in the chlorinolysis process by reacting dry coal in a sequential manner with chlorine nitrogen andor hydrogen Up to 80 sulfur reductions could be achieved in conshysiderably reduced times of reaction as compared to the chlorinolysis process (2)Prolonged chlorination or chlorination at higher temperatures did not result in any enhanced desulfurization over chlorination for 15 min at 100degC In fact chlorination for even 5 min resulted in substantial sulfur reducshytion The exothermicity of coal-chlorine reaction made it possible to mainshytain the reactor at about 100degC without any external source of heating (3) Employing a mixture of nitrogen and chlorine in the ratio of 41 during chlorination results in significant sulfur removal in the process Conshysequently considerably lower chlorine concentrations could be employed(4) Hydrodesulfurization of chlorinated coals at 700C for 30 min was more efficient in removing the sulfur from coal as compared to simple dechlorinashytion employing nitrogen Hydrodesulfurization for as short a period as 10 min results in significant sulfur reductions (5)Pretreatment of raw and chlorinated coals as well as processed coals with I M Na2CO3 solution for 30 min substantially reduces sulfur emissions in combustion as indicated by LECO analysis for total sulfur (6) Coal desulfurization in the solid state in a gas fluidized bed reactor has a tremendous potential over the chlorinshyolysis process employing coal-water slurries such as reduced reaction times lower chlorine requirement lower cost of processing and a simple process with fewer processing steps
2
III CONCLUSIONS AND RECOMMENDATIONS
1 Preliminary experimental results on coal desulfurization in a fluidized bed reactor have demonstrated the potential of the process in providing a simple and cost effective method of converting high sulfur coals to environmentally acceptable solid fuels for the power plants and utilityboilers
2 The results indicate that coal desulfurization achieved in the fluidized bed process is comparable to that achieved in a coal-water slurry system
3 Chlorination times as low as five minutes were found to result in desulshyfurization levels of about 60 This represents a substantial reduction in the chlorination time as compared to the slurry process and hence the reactor cost
4 Because dry coal is used as the feed to the fluidized bed reactor the coal sulfur leaves as gaseous species from the chlorination reactor which is likely to result in reduced chlorine requirement in the process This was also evident from the fact that a mixture of nitrogen and chlorine in the proportion of 41 during chlorination did not signifishycantly reduce the extent of coal desulfurization Because chlorine cost represents a substantial portion of the overall process cost the reduced chlorine requirement will have a significant effect on the process economics
5 Dechlorination and hydrodesulfurization of the chlorinated coal has been demonstrated in 10 minutes in the fluidized bed reactor which represents a substantial reduction over the time required in the slurry process
6 A fluidized bed reactor provides good mixing of the coal particles and contact between the gas-solid phase thereby facilitating better process control and isothermal operation
7 Thermal efficiency of the overall process will be high because all the reaction steps are brought about in the solid phase itself
8 The reduction in processing steps and improved process control should result in enhanced product yields and lower costs
9 While the feasibility of bringing about coal desulfurization in a fluidized bed has been clearly demonstrated extensive development is required to establish the optimum range of operating conditions
10 Further fundamental work is required on fluidized bed coal desulfurizashytion to understand the basic chemistry and kinetics of the reactions involved in the process
3
IV COAL DESULFURIZATION
The ever increasing demand for energy uncertainties associated with resources of petroleum and natural gas inherent problems with nuclear power plants and current unfavourable economics of solar energy and biomass utilishyzation have been primary contributory factors for the renaissance of coal as a sustainable energy resource for the next decade and beyond However utilization of coal for power generation and process heat isbeset with environmental problems The major problem with coal combustion units is that associated with sulfur dioxide emissions although emissions of nitrogen oxides particulates and trace elements also contribute to environmental degradation Inthe last decade several alternatives for controlling sulfur dioxide emissions from coal combustion units have been proposed These can be broadly classified as
(1) Use of low sulfur content coals
(2) Pre-combustion physical and chemical coal cleaning
(3) Retention of sulfur in the ash during combustion
(4) Post-combustion flue-gas cleanup
Reserves of coal that contain sufficiently low concentrations of sulfur to enable them to meet the present emission standard of 12 lb S02106 Btu (which corresponds to 07 wt sulfur in coal with a heating value of 12000 Btulb) are both limited and restricted to specific geographical locashytions Infact only 123 of US coal reserves are within this compliancelevel The major recoverable fractions of Eastern and Midwestern US coals contain more than 2 wt sulfur
Precombustion physical coal cleaning to remove mineral matter is widelypracticed inthe coal industry By the conventional float-sink methods as much as 60 of the pyritic sulfur in coal is also removed However a significant portion of coal is also rejected along with the high density material of high sulfur content In addition physical methods are not effective in removing organic sulfur content of coal which incertain cases may constitute 50 of the sulfur in coal Thus to decrease the sulfur conshytent in coal to acceptable levels it is necessary to remove both pyritic and organic sulfur fractions by chemical methods During the last decade several chemical coal cleaning methods have been proposed However a majority of these methods are applicable for the removal of only pyritic sulfur and no chemical coal desulfurization process uniformly applicable for the removal of both inorganic and organic sulfur fractions in coal is as yet available commercially
Retention of sulfur during combustion employing dolomite limestone etc in fluidized bed combustion units is studied widely Chemical modification of coal and incorporation of alkaline earth metals into the coal matrix as a means of retaining sulfur in the ash have also been proposed
4
Among the post-combustion gas-cleaning methods the most widely adopted one isflue gas desulfurization (FGD) employing wet scrubbers However scrubbers generate large quantities of sludge which must be disposed of -economically Also inmany instances scrubbers are unreliable requiring excessive maintenance Consequently the cost of a FGD facility represents a substantial proportion of the equipment cost of a coal-fired power plant and this proportion was found to increase as the size of the plant decreases thereby making FGD prohibitively expensive for small utility boilers Dry scrubbers overcome some of the problems associated with wet scrubbers
The economical production of coals that comply with environmental regulations for SO2 emissions remains the main incentive for the development of chemical coal cleaning processes However many of the chemical treatment methods remove only up to 40 of the organic sulfur which limits their application In addition while the New Source Performance Standards (NSPS) of 12 lb S02106 Btu could be met by most of the chemical coal cleaning methods a majority of these methods may not be effective inmeeting the revised NSPS of 1979 which stipulates 90 reduction in potential S02 emissions However recent research effort in chemical coal cleaning has resulted inthe development of processes capable of removing sulfur levels exceeding 90 wt DOE is currently evaluating three processes as prime candidates for coal desulfurization JPLs Low-Temperature Chlorinolysis process TRWs Gravimelt process and General Electrics Microwave process However commercialization of chemical coal cleaning technology may be delayed by economic factors
JPL initiated work on coal beneficiation and coal desulfurization a few years ago An outgrowth of this activity isthe JPL Low-Temperature Chlorinolysis Process for coal desulfurization The initial laboratory studies indicated that the process was capable of removing up to 70 total sulfur from an Illinois No 6 bituminous coal Since then the process has been considerably modified A recent process modification involves aqueous phase chlorination followed by solid phase dechlorination andor hydrodesulfurization which is capable of removing up to 90 of the total amount of sulfur
5
V SULFUR IN COAL
Sulfur in coal exists primarily in two forms inorganic and organic in
almost equal proportions The average sulfur content in coals varies from 05 to 7 depending on the source and location of the deposit
The major constituent of inorganic sulfur is iron sulfide FeS 2 commonly known as pyrite although it may occur in different crystalline states such as pyrite (cubic) and marcasite (orthorhombic) The other forms of inorganic sulfur in coal are sulfate sulfur and elemental sulfur which are normally present in very low concentrations Sulfate sulfur occurs mainly as gypsum and iron sulfate the latter resulting from the oxidation of pyrites during storage and exposure The low concentration of sulfate sulfur together with its solubility in water makes it of little consequence during coal cleaning The concentration of elemental sulfur in coal is also very small Pyrite in general is believed to be present as a discrete phase in coal which incishydentally facilitates its removal by float-sink methods However with very fine particles even complete pyritic sulfur removal is not possible
Organic sulfur in coal is thought to be uniformly distributed and firmly bound to the coal matrix Limited information exists on the specific organic sulfur compounds and their distribution in various coals It is generally accepted that a major proportion of organic sulfur in coal is made up of the following functional groups
(1) Aliphatic or aromatic R-SH Thiols (Mercaptans Thiophenols) Ar-SH
(2) Aliphatic or aromatic sulfides R-S-R and mixtures of these (Thioethers) Ar-S-Ar
R-S-Ar
(3) Aliphatic or aromatic disulfides R-S-S-R and mixtures of these (Bisthioethers) Ar-S-S-Ar
R-S-S-Ar
(4) Heterocyclic compounds of the thiophenic type (Dibenzothiophene) S
Analysis of coals for organic sulfur fractions has shown that lignite and high-volatile bituminous coals contain relatively higher concentration of thiols and also that higher ranked coals have a higher proportion of thiophenic sulfur More extensive classification and characterization of coals particularly for organic sulfur components and their quantitative distribution are needed In general there is a lack of understanding of the chemical reactions involving organic sulfur in the different chemical coal cleaning processes which is partly due to the nonavailability of anashylytical techniques for the direct determination of organic sulfur Recent studies on desulfurization of model organic sulfur compounds of the type
6
believed to be present in coal by some of the proposed processes have shown that many of these compounds are unreactive and that more fundamental research work is needed to understand the nature of the precise organicsulfur species in coal and their reactivities under different desulfurization conditions
VI CHEMICAL COAL CLEANING METHODS
Among the various methods that have been proposed for controlling the S02 emissions from coal fired power plants precombustion coal desulfurization offers several potential advantages over flue gas desulfurization In the past decade several processes have been proposed for extracting pyritic and organic sulfur from coal There are also as many processes that are modifishycations of a process or a combination of different processes However most of these could be classified into a few groups based on the chemistry of the reactions involved in the process
(1) oxidation reactions
(2) displacement reactions
(3) reduction reactions
A further classification is also possible depending on whether the reactions are brought about in the liquid phase or in the solid phase However very few studies of the latter type are reported In general in the liquid phase methods the sulfur in coal is transformed into a soluble form
The exposure of coal to air results in a slow oxidation of pyrite to the sulfate which is water soluble A majority of the processes reported for the removal of pyritic sulfur in coal are aimed at enhancing this natural process of oxidation Oxidatants ranging from metal ions (Fe3+) to strong acids (HN0 3) oxygen air S02 C12 H202 NO2 etc have been employed for this purpose The PTEC oxydesulfurization process AMES wet oxidation process LEDGEMONT oxygen leaching process ARCO-promoted oxydesulshyfurization process TRW Meyers desulfurization process and JPL chlorinolysis process among others all involve oxidizing the sulfur fraction in coal to sulfuric acid or to a soluble sulfate There is a wide variability in processing conditions and in the removal efficiencies among the various processes The JPL Low Temperature Chlorinolysis process is however one of the few processes capable of removing both inorganic and organic sulfur from coal
Processes based on the displacement of sulfur such as the Battelle Hydroshythermal process TRW Gravimelt process and the General Electric Microwave process involve heating coal with sodium hydroxide to remove the sulfur in the form of sulfides and polysulfides The TRW Gravimelt process in addition to removing sulfur also removes substantial quantities of mineral matter from coal However one major disadvantage of using caustic is that the excess sodium retained in coal may cause severe ash slagging problems in the boiler
Among the processes based on reduction mention may be made of the IGT flash desulfutization process for producing chars The process involves prelimshyinary air oxidation of coal to facilitate sulfur removal in the subsequent hydrodesulfurization step A sulfur acceptor such as calcium oxide or iron oxide was found to limit the hydrogen consumption during the latter step
8
Many of the chemical coal cleaning processes described above were found to be effective for the almost total removal of pyritic sulfur and partial removal of organic sulfur On the basis of total sulfur removals claimed most of these processes are capable of desulfurizing a large number of coals to meet the 1971 US NSPS for S02 emissions (12 lb10 6 Btu) while only a few may be able to satisfy the revised 1979 standard which stipulates 90 reducshytion inpotential S02 emissions to the atmosphere irrespective of the initial sulfur content of coal There also exists some uncertainty regardingthe extent of organic sulfur removal achieved inthese processes primarilybecause of the lack of precise analytical methods for the direct detershymination of organic sulfur in coal In practice the actual reduction in organic sulfur may be much lower than claimed Consequently there is a need for a better understanding of the sulfur forms in coal and a more realistic appraisal of the cost and efficiency of the chemical coal cleaning processes
A COAL DESULFURIZATION BY CHLORINE
Chlorination of coal was initially studied for producing non-cakingcoals and chlorohydrocarbons Coal desulfurization by chlorination was first reported in 1964 when coal was chlorinated in an aqueous media at 25degC Only poor sulfur removal was achieved Subsequent studies on desulfurization by gas phase chlorination of coal at high temperaturesand elevated pressures resulted in better sulfur removals However the sulfur reductions were accompanied by higher coal losses and highchlorine retention in product coals
Development of the chlorinolysis process for coal desulfurization beganin 1976 at JPL There are two basic variations of the process althoughboth are based on the oxidation of sulfur by chlorine The original version employed methyl chloroform as the reaction medium duringchlorination which was later substituted by water A more recent version of the process consists of
(1) Chlorination of an aqueous coal slurry (watercoal 21) at 600C for 45 min (SCl 2 18 by wt)
(2) Filtration - wash of chlorinated coal (coalwater 12)
(3) Dechlorination of dry coal with N2 at 400C for 1 h
(4) Advanced dechlorination with H2 at 650 0C for 1 h1
The chemistry of the process is somewhat complex but based on the sulfur bond scission inorganic compounds may be illustrated as follows
1This step enhances the total sulfur removal to the level of 90
9
ORIGINAL PAGE W OF POOR QUALITY
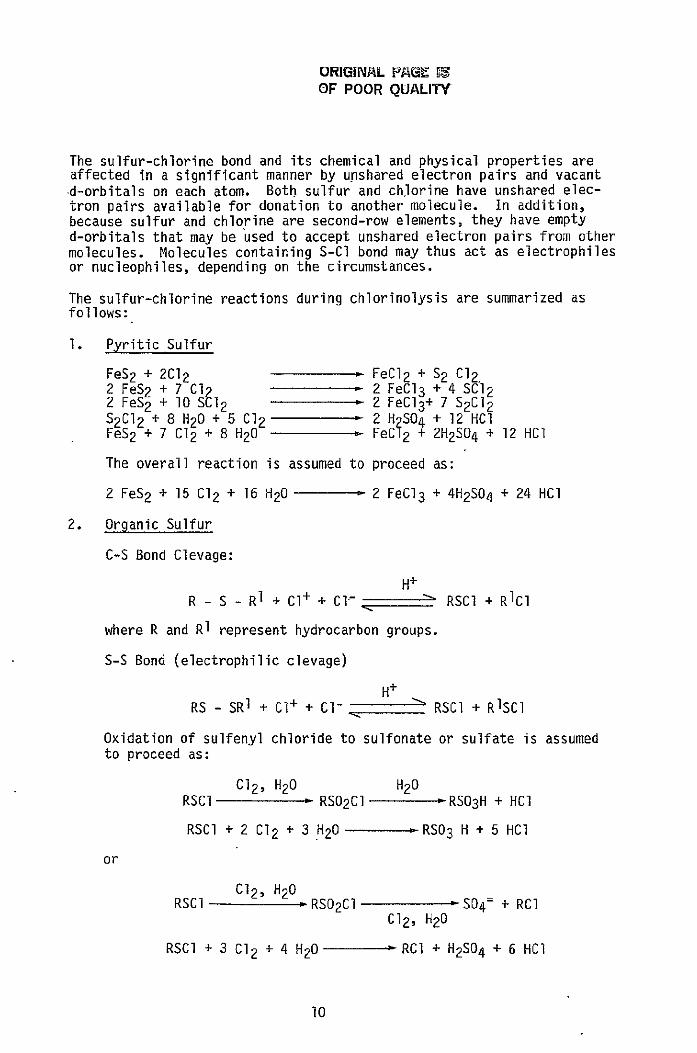
The sulfur-chlorine bond and its chemical and physical properties are affected in a significant manner by unshared electron pairs and vacant d-orbitals on each atom Both sulfur and chlorine have unshared elecshytron pairs available for donation to another molecule In addition because sulfur and chlorine are second-row elements they have empty d-orbitals that may be used to accept unshared electron pairs from other molecules Molecules containing S-Cl bond may thus act as electrophiles or nucleophiles depending on the circumstances
The sulfur-chlorine reactions during chlorinolysis are summarized as follows
1 Pyritic Sulfur
FeS 2 + 2C12 - FeC12 + S2 C12
2 FeS2 + 7 T 2 FeC13 + 4 SC12 2 FeS2 + 10 Si12 2 FeCl3+ 7 S2CI2 S2CI2 + 8 H20 + 5 Cl2 2 H2S04 + 12 HCI FeS 2 + 7 C12 + 8 H20 FeCI2 + 2H2SO4 + 12 HCI
The overall reaction isassumed to proceed as
2 FeS 2 + 15 Cl2 + 16 H20 - 2 FeCl3 + 4H2S04 + 24 HCI
2 Organic Sulfur
C-S Bond Clevage
H+
-R - S - RI + Cl+ + Clr RSCI + RIcI
where R and R1 represent hydrocarbon groups
S-S Bond (electrophilic clevage)
RS - SRI + C1+ + Cl- H RSCI + RIsCI
Oxidation of sulfenyl chloride to sulfonate or sulfate is assumed to proceed as
C12 H20 H20
RSCI RS02CI - RS03H + HCI
RSCI + 2 Cl2 + 3 H20 - RS0 3 H + 5 HCI
or
C12 H20 RSC1 RS0 2CI - SD4 + RCI
C12 H20
RSCI + 3 Cl2 + 4 H20 - RCI + H2SO4 + 6 HCI
10
All these reactions are exothermic in nature and proceed favorshyably atlow temperatures In the presence of water and excess chlorine sulfur dichloride is readily converted to sulfuric and hydrochloric acids
B COAL DESULFURIZATION IN THE SOLID PHASE
Coal desulfurization by treatment with different gases at elevated temperatures was reported by several investigators (Ref 5 through 8) Early interest in such treatments was mainly for the production of metallurgical coke Sulfur removal during carbonization was studied in both inert and reactive environments such as oxygen hydrogen steam etc Iron pyrites decomposes when heated releasing half of its sulfur while one-fourth to one-third of the organic sulfur is converted to hydrogen sulfide (Ref 9 and 10)
Snow (Ref 11) treated coal in various reactive gases and found hydrogen to be most effective Pyrite reacts with hydrogen in two stages The first stage of conversion of pyrite to ferrous sulfide begins at about 400degC while the subsequent reaction leading to the formation of elemenshytal iron takes place at much higher temperatures However hydroshydesulfurization of coal is strongly inhibited by the presence of hydroshygen sulfide in the gas-phase (Ref 12 through 14)
Treating coal with hydrogen at high temperatures (gt900C) is very effective in the removal of organic sulfur but the accompanying coal losses are substantial
Several investigators have reported desulfurization of coal with oxygen and oxygen carriers and found that mainly pyritic sulfur was removed under the oxydizing atmosphere One exception is the KVB or Guth process (Ref 15) where the oxidation of sulfur compounds is brought about in the solid phase by using NO2 followed by a caustic wash to remove up to 40 of organic sulfur NO2 is reported to selectively oxidize part of the pyritic and organic sulfur in coal Block et al (Ref 16) reported that 87 pyritic sulfur was removed in a fluidized bed reactor at 6000C Sinha and Walker (Ref 17) reported that 90 of pyritic sulfur was removed in 10 min at 4500C while Jacobs and Mirkus (Ref 18) in their studies on fluidized beds using steam-air mixtures found 60 to 70 sulfur reductions in 20 to 60 min at 510C Huang and Pulsifer (Ref 19) found that the mechanism and extent of sulfur removal depends essentially on temperature and gaseous environment At temperatures below 6000C desulfurization is achieved mainly by pyrolysis and release of volatile matter while above 6000C hydrogen directly reacts with organic sulfur
Thus in principle pyritic sulfur can be removed by oxidation and organic sulfur by reduction However neither of these methods is used to any great extent because of significant losses in coal heating value
11
The earliest application of chlorine to remove sulfur from pyrites in the solid phase dates back to 1939 (Ref 20) The authors reported an 85 removal of sulfur by treating FeS 2 with Cl2 at 300 to 400C Another investigation claims that chlorine removes 95 of the sulfur from pyrites at 600 (Ref 21)
The present investigation was undertaken to study the feasibility of bringing about the desulfurization reactions in the solid phase by reacting gaseous chlorine with dry coal Because the sulfur-chlorine reactions are exothermic a fluidized bed reactor was chosen for the study as it is known to facilitate good solids mixing and isothermal operation The main objectives of this investigation are
(1) To study the effect of sequential chlorination dechlorination andor hydrodesulfurization of selected coals on total sulfur reductions in a fluidized bed reactor
(2) To assess the influence of a wash of raw chlorinated and desulshyfurized coals on the sulfur remaining in the product coals
12
VII LABORATORY SCALE COAL DESULFURIZATION EXPERIMENTS IN A BATCH-FLUIDIZED BED REACTOR
A SELECTION OF COALS
Two bituminous high volatile coals were selected for the present study PSOC 276 (Ohio No 8) and PSOC 282 (Illinois No 6) These were extensively studied in the laboratory-scale and bench-scale Chlorinolshyysis experiments
Five tons each of these coals obtained from the mine site as part of the earlier progtam were ground and classified by the Corosil Corporation Corona California For the laboratory scale experiments the ground coals were sieved to the required size using a Sweco Vibro-Energy separator equipped with 60 100 and 200 mesh stainless steel screens
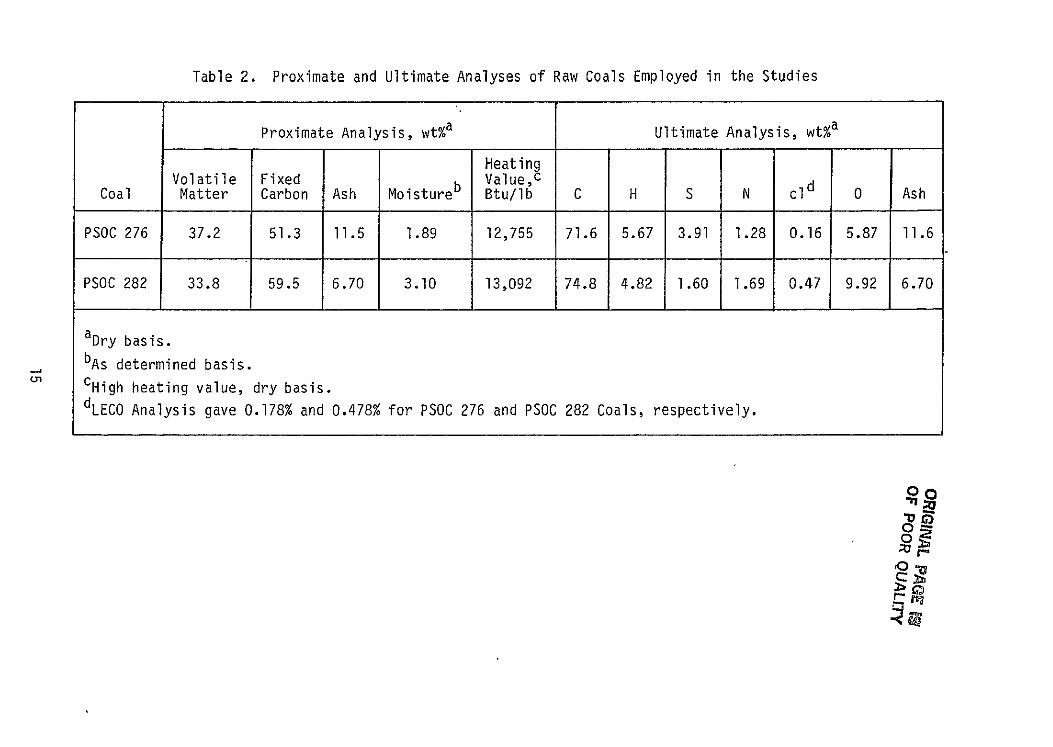
Results of sulfur forms and proximate and ultimate analyses by the ASTM approved methods at the Colorado School of Mines Research Institute are presented in Tables 1 and 2
B EQUIPMENT OPERATING PROCEDURES AND METHODS OF ANALYSES
1 Equipment
A schematic of the experimental setup employed in the present study is shown in Figure 1 Figure 2 presents details of the fluidized bed reactor The experimental set-up essentially consists of a preheater reactor proper reflux condenser and a scrubber along with appropriate devices for measuring gas flows and for controlling temperature
The preheater which is made of 12 in ID x 30 in stainless steel tube is wound externally with a heating tape One end of the preheater is connected to the reactor while the other end is connected to the gas inlet line Temperature in the preheater is maintained at 501C by a transformer and the temperature is measured by a chromel-alumel thermocouple connected to a Hoskins Pyrometer
The reactor is made of 1 in ID x 24 in quartz tube A porous silica plate fused to the bottom end of the reactor serves as a gasdistributor and support for the solids in the reactor One end of the reactor is connected to the preheater while the other end is connected to solids disengaging section The reactor is provided with a thermowell and tappings for pressure drop measurement The bottom half of the reactor is enclosed in close fitting Thermcraft RH 212 Electric Heaters (264 W 575 V) Temperature in the reactor was controlled by connecting the heaters and a PtPt+13 Rh thermocouple to an OMEGA Model 49 ON-OFF Proportioning Temperature
13
Table 1 Characteristics of Raw-Coals Employed in the Studies
Forms of Sulfur wt ab Total PSOC No
Coal Type Seam County State
Size Tyler Mesh Organic Pyritic Sulfate Total
Sulfur wtbc
High Volatile bituminous Pittsshy
276 burgh coal from -60 + 100 117 263 006 387 375Harrison County Ohio George Town No 24 Mine
High volatile bituminous Illinois
No 6 coal from 158282 100 075 043 036 154Jefferson County -60 + Illinois No 6 Mine (Washed)d
a Determined by the Colorado School of Mines Research Institute (CSMRI)
b Dry basis
c LECO analysis
d Unwashed coal had 22 wt total sulfur
Controller This was later replaced by a Wheel Co Model 401 ON-OFF Temperature Controller Temperature in the reactor was also recorded separately by means of an iron-constantan thermocouple connected to a Honeywell recorder
The reactor outlet is connected to a reflux condenser for collecting any volatile components that may be present in the outshylet gases
The outlet gases from the reactor were scrubbed with 1 M Na2-CO3 solution before they were finally vented into the atmosphere
The reactor system after assembly was checked for leaks flow-meter calibration and satisfactory performance of heaters and tempershyature controller
14
Table 2 Proximate and Ultimate Analyses of Raw Coals Employed in the Studies
Proximate Analysis wta Ultimate Analysis wta
Coal Volatile Matter
Fixed Carbon Ash Moisture b
HeatingValuec BtuIb C H S N cld 0 Ash
PSOC 276 372 513 115 189 12755 716 567 391 128 016 587 116
PSOC 282 338 595 670 310 13092 748 482 160 169 047 992 670
aDry basis
bAs determined basis
CHigh heating value dry basis dLECO Analysis gave 0178 and 0478 for PSOC 276 and PSOC 282 Coals respectively
00
Zn
R
V F
SJ
BS
REGULATOR
MANUAL VALVE FLOW METER
STANDARD GLASS JOINT
BALL AND SOCKET JOINT
V V
- - -----shy
12
SJ
10
BS
13
F F 11
v 41 8
1 2 30z
LEGENDM 1 CHLORINE CYLINDER 2 NITROGEN CYLINDER 3 HYDROGEN CYLINDER 4 PREHEATER (12 ID x 30 SS TUBE) 5 HEATINGTAPE 6 TEMPERATURE INDICATOR7i TEMPERATURE INDICATOR CUM
ON-OFF CONTROLLER 8 SWEGE-LOCK JOINT
9 10 11
12 13 14 15 16
VENT
14
ELECTRICAL HEATERS REACTOR r wa POROUS SILICA DISTRIBUTOR THERMOCOUPLE MANOMETERREFLUX CONDENSER RECEIVING FLASK SCRUBBER
Figure 1 Batch Fluidized Bed Reactor System for Coal Desulfuization
00
ORIGINAL PAGE riOF POOR QUALITY
THERMOCOUPLE ENTRY POINT
6 MANOMETER6 TAPPING
IQUARTZ TUBE
18
SUPPORT FOR HEATER
MEDIUM POROSITY SINTERED SILICA DISTRIBUTOR
4
MANOMETER TAPPING
4I12
Figure 2 Fluidized Bed Reactor
17
2 Fluidization Experiments
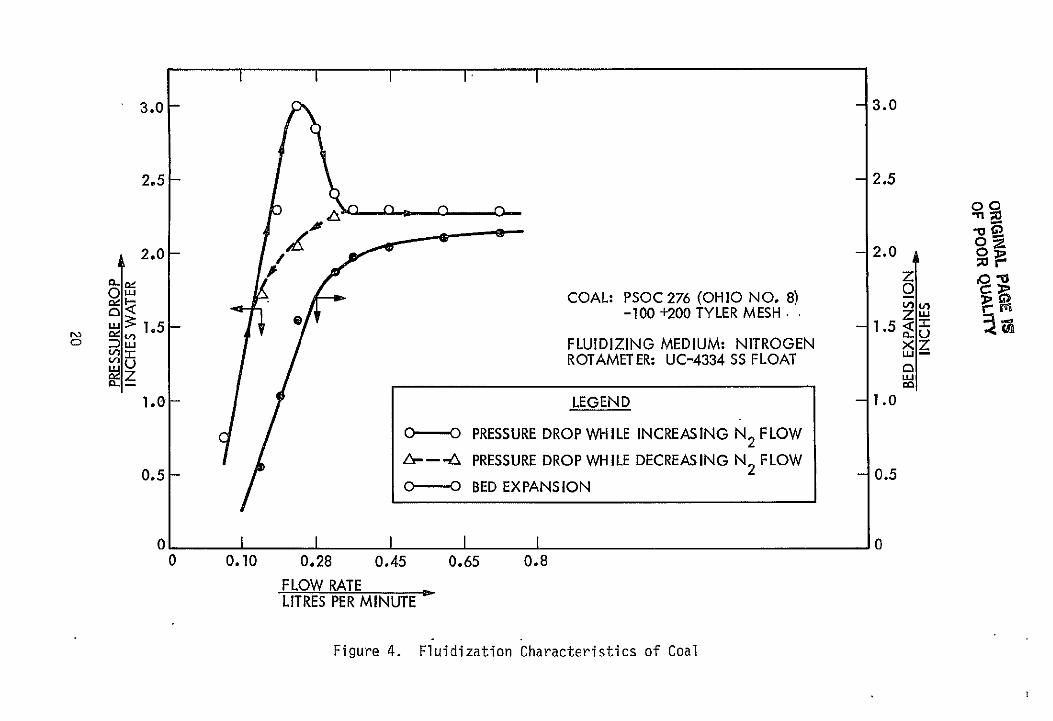
Initially fluidization characteristics of coal were assessed For this purpose graded sizes (-60 + 100 and -100 + 200 Mesh) of PSOC 276 and PSOC 282 coals were employed in the fluidization experishyments 50 g of dry coal of a known particle size were taken in the reactor and the flow rate of nitrogen was gradually increased The onset of fluidization and solids mixing in the reactor were visually observed Pressure drop and bed expansion at each flow rate were noted A constant pressure drop and vigorous mixing of solids in the bed were taken as indicative of fluidization The
pressure drop was also noted while the flow rate was decreased The experiments were repeated using hydrogen as the fluidizing medium Representative plots of pressure drop versus volumetric flow rate are presented in Figures 3 and 4 The minimum fluidizashytion velocity was also calculated using the following equation applicable for small particles
dp2 (Ps - Pg)9 Umf = 165011
where
Umf = minimum fluidization velocity cms
dp = mean particle diameter cm
Ps = solids density gcm 3
P9 = fluid density gcm 3
g = local acceleration due to gravity cms2
P = fluid viscosity gcm s
From the minimum fluidization velocity the corresponding volumetric
flow rate was calculated as follows
Q = Umf x A
where
Q = volumetric flow rate cm3s
A = cross sectional-area of the bed cm2
18
I I I I I I
30 shy
25-
C-c20- 0 LU
LUj COAL PSOC 276 (OHIO NO 8) tI015 -60 +100 TYLER MESH QZ --FLUIDIZING MEDIUM NITROGEN
ROTAMETER UC-4334 SS FLOAT
10 LEGEND
0-- PRESSURE DROP WHILE INCREASING N2 FLOW
05 - 6---A PRESSURE DROP WHILE DECREASING N FLOW
0-O BED EXPANSION
0 I 08 I I 08 05
0 010 028 045 065 08 095 FLOW RATE LITRES PER MINUTE
Figure 3 Fluidization Characteristics of Coal
30
25
20OZ0
15 R
10
05
0
O
o
30 - 30
25 25
00
0
20
LU -
u nZ
1O
mg
15lt1
COAL PSOC276 (OHIO NO8)-100 +200 TYLER MESH
FLUIDIZING MEDIUM NITROGEN ROTAMETER UC-4334 SS FLOAT
LEGEND -
20
z
z
Z shy
tu
10
0
0-
--- A
O----O
PRESSURE DROP WHILE INCREASING N2 FLOW
PRESSURE DROP WHILE DECREASING N2 FLOW
BED EXPANSION
0I 0 010
I I 028 045
FLOW RATE LITRES PER MINUTE
I 065 08
0
Figure 4 Fluidization Characteristics of Coal
The minimum fluidization velocities calculated using the above equation and those computed frompressure drop data are presentedin Table 3 For the size fractions employed there was no signifishycant carryover of coal particles in the exit stream The actual flow rates employed in the desulfurization experiments are presented in Table 4
3 Desulfurization Experiments
The desulfurization experiments consisted of successive chlorinashytion dechlorination andor hydrodesulfurization of selected coals for varying time intervals and temperatures inthe fluidized state The effect of employing a mixture of nitrogen and chlorine (41) and pre- and post-treatments to coals were also assessed A process flow diagram of the treatments is presented in Figure 5
The experimental procedure is as follows 50 g of coal of the required particle size are loaded into the reactor and fluidized with nitrogen After ensuring that the entire system is funcshytioning properly and the preheater has reached the required temperature the chlorination experiment is started by substitutingchlorine as the fluidizing medium at the predetermined flow rate During the initial stages of chlorination the temperature of the bed rose sharply However the vigorous mixing of the solids in the reactor prevented local hot spots With proper insulation the reactor temperature could be maintained uniformly at about 1000C without supplying any additional heating During preliminary runs using coal as received (without drying) itwas observed that the bed tends to consolidate as a consequence of the exothermic sulfurshychlorine reaction resulting in defluidization and pressure buildupin the reactor This problem was overcome by employing dried coal (dried at 100 overnight) in all the subsequent experiments The chlorination experiments lasted from 5 to 15 min Unreacted chlorine and the products of chlorine-sulfur reactions are absorbed in I M Na2CO3 solution in the scrubber
After chlorination nitrogen is substituted as the fluidizingmedium and the reactor temperature is set to the required level After the reactor attained the required temperature (400 to 6000C)dechlorination is carried out for time intervals varying from 10 to 60 min
For the hydrodesulfurization step the reactor temperature is set to the required level while still being fluidized with nitrogen After the reactor attained the required temperature hydrogen is substituted as the fluidizing medium and the hydrodesulfurization of coal is carried out for time intervals ranging from 10 to 30 min in the temperature range of 500 to 7000C
After completing the hydrodesulfurization experiment the heaters are switched off hydrogen flow is stopped and nitrogen isonce
21
Table 3 Calculated and Observed Values of Minimum Fluidization Velocity Umf
Calculated Umf
Mean cms Observed Umf cms
Size Particle Nitrogen Hydrogen Fraction Diameter
Tyler Mesh cm N2 C12 H2 PSOC 276 PSOC 282 PSOC 276 PSOC 282
-60 + l00- 001995 199 268 398 181 214 272 272
-100 + 200 001115 062 084 126 076 079 103 103
Table 4 Actual Flow Rates Employed in the Experiments -60 + 100 Tyler Mesh
Fluidizing Gas Flow Rate Imin
Chlorine 0610
Nitrogen 0600
Hydrogen 0900
22
ORIGINAL PAGE F OF POOR QUALITY
DRY CHLORINE GAS POWDERED CHLORINATIONC COAL 50-1000C 1 ATM
5-15 MIN SC12f 52C12 FLUIDIZED BED REACTOR 2
CHLORINATED COALS -_ WATEPNa2CO__
AMBIENT I ATM WASTE WATER 30 MIN INCLUDING HCI
2t 4 SULFATES AND CHLORIDESSODIUM SULFIDE SULFATE etc
DECHLORINATIONO NITROGEN 300-500-C I ATM
10-60 MIN HCI (g)FLUIDIZED BED REACTOR
1 HYDROGEN
HYDRODESULFURIZATIONO HD G 500-7000C 1 ATM
10-60 MIN H2S FLUIDIZED BED REACTOR 2shy
7------------- WATERNa 2CO3I WASHING AND DRYING
L-------- H2S0 4 SOLUBLE SULFATES
SULFIDES etc DESULFURIZED COAL
LABORATORY GLASS EQUIPMENT FOR THESE PROCESSES ISSHOWN IN FIGURE ] OPTIONAL
Figure 5 Process Flow Diagram for Laboratory Scale Fluidized Bed Coal Desulfurization
23
again substituted as the fluidizing medium The reactor is cooled to room temperature in a nitrogen atmosphere
After the experiment the reactor is disconnected from the systemand the reacted coal is collected and stored for subsequent analyses
In some cases raw coal chlorinated coal and product coal are subjected to a washing treatment consisting of water wash and carbonate wash For a water wash the sample is soaked in distilled water with occasional stirring for 30 min after which the coal is filtered and dried overnight at 100degC In a carbonate wash the sample is soaked in I M Na2C03 solution for 30 min with frequent stirring after which the coal isfiltered washed repeatedly till the washings are neutral to litmus and dried at 100C overnight
A safety and operating procedure for the fluidized bed coal desulshyfurization experiments ispresented inAppendix A
4 Methods of Analysis
a Analysis of Sulfur Forms in Coal
Raw coals and some of the processed coals were analyzed for sulfur forms by ASTM approved methods at the Colorado School of Mines Research Institute Appendix B gives the details of analysis methods
b Proximate and Ultimate Analyses of Coal
Selected desulfurized coal samples were submitted to the Colorado School of Mines Research Institute for long proximate and ultimate analyses by ASTM-approved methods
c Estimation of Total Sulfur in Coal
Processed coals immediately after the desulfurization experishyments were analyzed by a modified LECO Method for total sulfur Details of the method are given in Appendix C This routine analysis in the laboratory provided a rapid estimation of the total sulfur needed for planning further experiments
A more complete analyses for total sulfur and sulfur forms were carried out by CSMRI as indicated in (a) and (b)above During the earlier work in this laboratory it was observed that the estimations of total sulfur by LECO and the Eschkashymethods were in general in good agreement as shown in Table 5
24
Table 5 LECO Acid-base Analysis vs Eschkaa Analysis for Total Sulfur
Total Sulfur by Eschka Difference
wt LECO - Eschka
154 -012
154 +002
154 -006
154 -023
057 -009
088 -016
158 +014
061 +002
029 -007
122 +002
055 -002
078 000
Run Nob
B14
L2
B17
L9
L42
B22
B38
L30
L38
L44
L48
L49
Total Sulfur by LECO wt
142
156
148
131
048
072
172
063
022
124
053
078
a Conducted by CSMRI
b From Phase III Report (Ref 3)
25
d Surface Area and Pore Volume of Coal
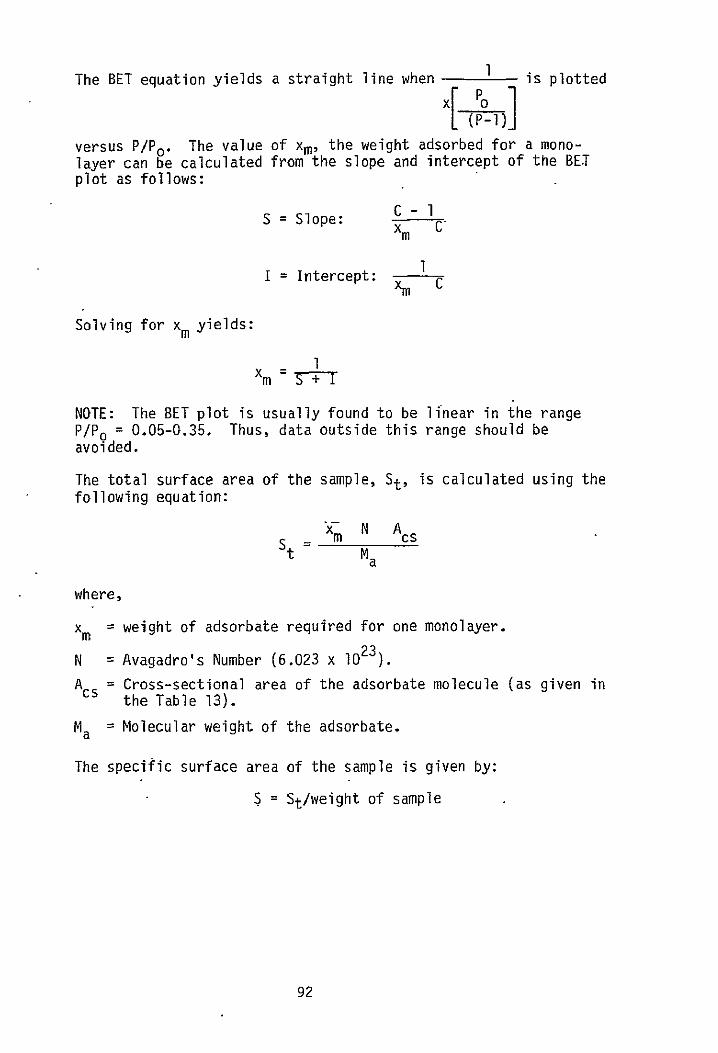
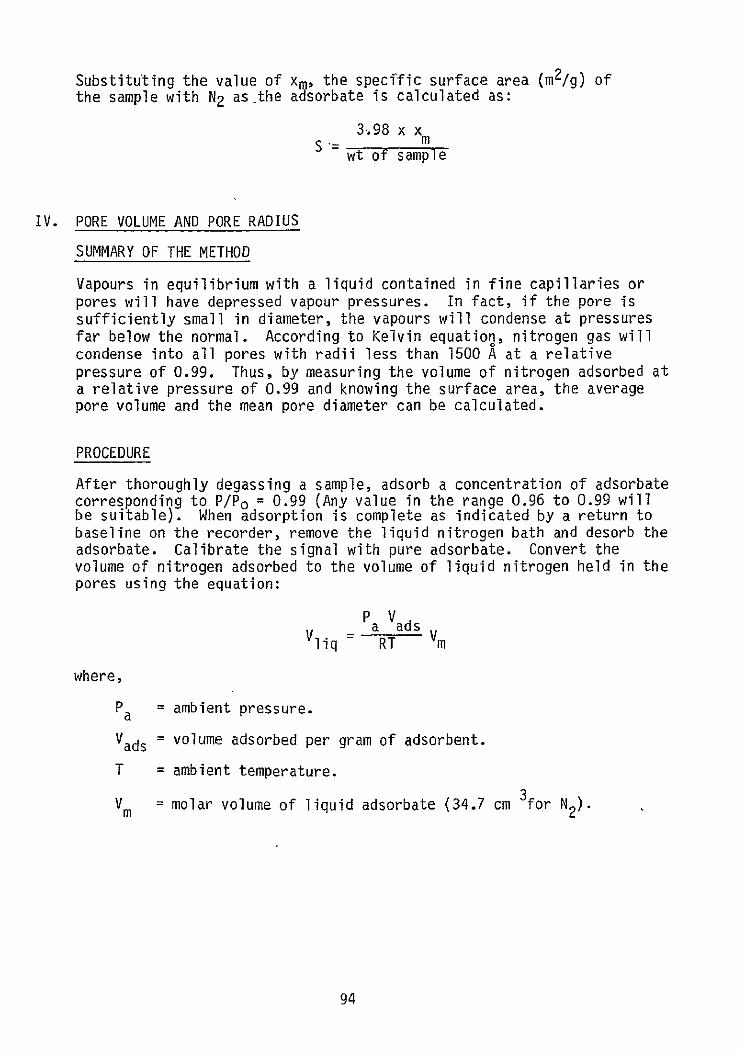
Specific surface area and pore volume of raw coals were determined by low-temperature nitrogen adsorption employing a Quantasorb Sorption System Surface area and pore volume were calculated by applying the BET equation as described in Appendix D The results are presented in Table 6 While the surface areas of raw coals appear to be low it is generally observed that employing nitrogen as an adsorbate results in the estimation of low surface areas as compared to carbon dioxide due to the presence of a majority of micropores in coal In addition it was reported that during desulfurizashytion new pores are created in coal resulting in a pronounced increase in the surface area of processed coals
e Analysis of Scrubber Solution
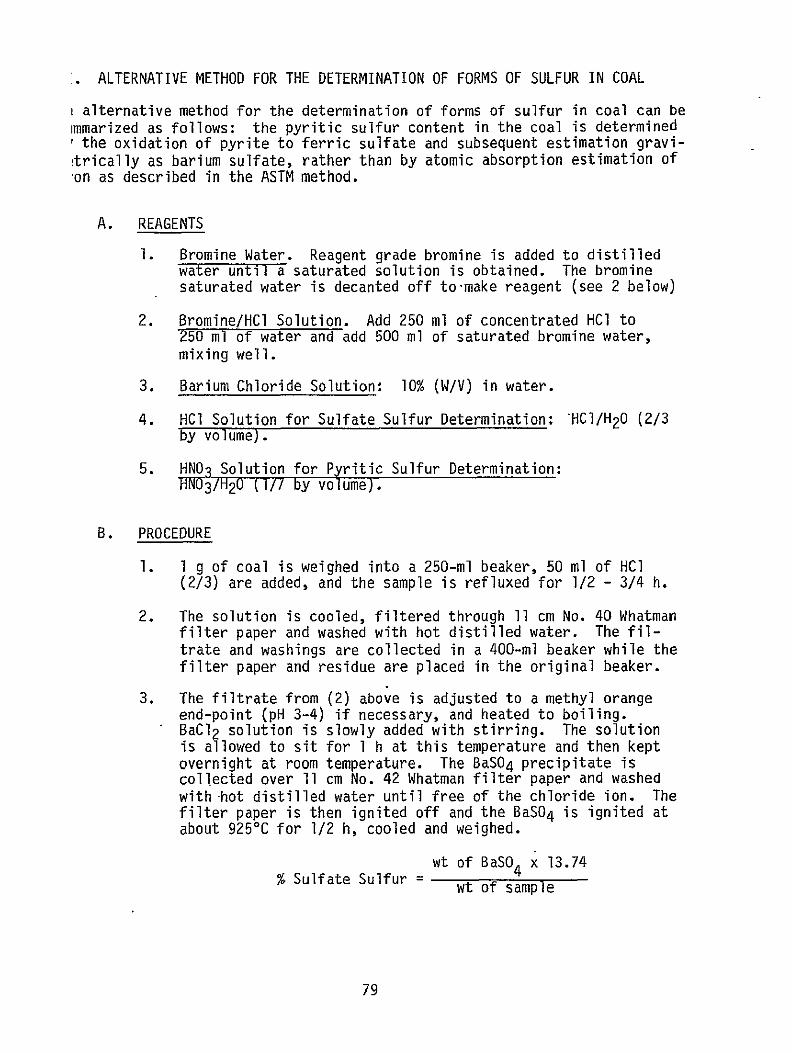
In an attempt to estimate the amount of sulfur removed as gaseous species along with the reactor outlet gases the scrubber solution after the experiment was analyzed in some instances by precipitating BaSO4 However total sulfur estimated by this method accounted to only 20 of that estimated by the LECO analysis of product coals The apparent discrepancy might be due to the nature of sulfur species present in the outlet gases and their decomposition rates
It is known that chlorine gas readily reacts with pyrite forming ferrous chloride and sulfur monochloride (S2 C12) as follows
Fe S2 + 2 C12 -- Fe C12 + S2 C12
In the presence of excess chlorine the products of reaction are ferric chloride and sulfur dichloride as given by the following equation
2 Fe 52 + 7 C12 - 2 Fe C13 + 4 SC1 2
Sulfur monochloride is quite stable at room temperatures but a reversible breakdown starts at about 1000C and beyond 300C complete breakdown takes place as
S2 C12S 2 + C12
Sulfur monochloride is slowly hydrolysed by water at room temperature as follows
S2 C12 + 2 H20 - 2 HCl + S02 + H2S
In solution SO2 and H25 further react to form elemental sulfur and polythionic acids However in the presence of excess chlorine S2 C12 decomposes forming sulfuric and hydrochloric acids as
26
Table 6 Specific Surface Area and Pore Volume of Raw Coals Employed in the Study
Ym Mean Size
Fraction Sg Specific Surface Area
V5 Pore V lume
Pore Diametera
Coal Tyler Mesh m2g cm3g A
PSOC 276 -60 + 100 720 00160 445
PSOC 282b -60 + 100 601 00127 436
a 2x Vg
For a Spherical Pore Y m
-
S
bFuller Jr E L (ACS Advances inChemistry Series Vol 192 1961)
reported a BET surface area of 26 m2g by nitrogen adsorption for a bituminous Illinois No 6 coal from Sahara Mine whereas the same coal by carbon dioxide adsorption gave a surface area of 128 m2g
27
S2 C12 + 5 C12 + 8 H20- 2 H2 S04 + 12 HIC
As the scrubber solution contains Na2CO3 H2S is likely to react forming Na2S as follows
Na2 CO3 + H2S - NaS + CO2 + H20
Sulfur dichloride also undergoes similar hydrolysis reactions and is readily decomposed on contact with water
The complex series of reactions taking place may be the reason for underestimating sulfur removal in the process by the analysis of scrubber solution for SO4
f Coal Characterization Using Scanning Electron Microscopy (SEM)
An examination of the microstructure of coal is of interest in understanding its properties Details of size shape orienshytation and distribution factors for pyrite certain pyrite and marceral groupings or other coal constituents (such as mineral matter) are useful in supporting coal cleaning processes Recent studies on coal structure using Scanning Electron Microscopy (SEM) have shown that interrelationships exist between marcerals and inorganic phases such as FeS2 This form of characterization complements optical microscopy and conventional transmission electron microscopy (TEM) that have been used to classify and study coal constituents
SEM offers a means of visualizing features hundreds and thousands of Angstroms in diameter in a three dimensional form that is not available by any other technique Although the nature of coal surface precludes any precise quantitative measurements with SEM useful qualitative conclusions could be drawn regarding the effect of various treatments on the gross structural properties of coal
By using SEM equipped with an Energy Dispersive X-ray Analysis (EDAX) system microscale structural and chemical analysis of coal could be achieved A more detailed description of the applicability of these methods can be found in Reference 22
The SEM and EDAX of raw and product coal particles were examined using AMR (Advanced Metals Research Corporation) Model 900 SEM fitted with EDAX Model XC-12-164
The images of the particles were obtained using secondary electrons Because coal is a light element composed primarily of carbon the electrons in the impinging beam interact more diffusely with coal than with a metal Consequently it becomes much harder to obtain a sharp image at higher magnifishycations Tierefore best resolution is normally obtained at about 1000 A whereas most of the coal pore structure is comshyposed of micropores (less than 15 A)
28
In addition to the production of backscattered electrons the interaction of the impinging electron beam also yields x-rays There are two electron beam-solid interactions that lead to the production of x-rays (1) core-scattering which results in the emission of a continuous spectrum and (2) inner shell ionization which yields the characteristic spectrum The characteristic spectrum allows the qualitative identification of the elements present in the sample The basic function of EDAX is to collect all of the x-rays produced analyze their energies and present the results in a convenient form on a Cathode ray tube The EDAX is calibrated using the x-rays generated by aluminum and zirconium or zirconium and gold to fix the energy scale Once calibrated the element corresponding to any peak can be readily identified A facsimile of some typical EDAX spectra are shown in Figure 6 For any given sample usually 15 to 25 separate particles were examined and the picture of the most representative one was taken The EDAX spectra usually requires about 100 to 1000 seconds of data acquisition to yield an acceptable signal to noise ratio The SEM photographs and EDAX spectra of raw and processed coals are presented in Figures 7 to 14 and 15 to 18 respectively
29
C1
Au (Ma) S
Al Si (Si
K
Au6 (L9
Si
Al$
N KFe
00
02
I
0
I
2
I I
4 6 ENERGY (keV)
I
8
I
10
I I II
A HIGHLY CHLORINATED COAL A HIGH SULFUR BITUMINOUS COAL
Figure 6 Typical EDAX Spectrum of Coal
ORIGINAL PAGE 18OF POOR QUALITY
iIltFm
100 ILm
Figure 7 SEM Photograph of PSOC 282 Raw Coal
31
ORIGINAL PAGE IS OF POOR QUALITY
LW
100m
Figure 8 SEM Photograph of PSOC 282 Washed with 1 M Na2CO3 Solution
32
ORIGINAL PAGE 1jOF POOR QUALITY
I m
100
Figure 9 SEM Photograph of PSOC 282 Treated Coal (Run No 0032)
33
ORIGINAL PAGE IS OF POOR QUALITy
L_
100 m
Figure 10 SEM Photograph of PSOC 282 Treated Coal (Run No 0026)
34
ORIGINAL PAG OF POOR QUALTy
L_J
U m
100 F
Figure 11 SEM Photograph of PSOC 282 Treated Coal (Run No 0027)
35
ORIGINAL PAGE i9 OF POOR QUALITY
1 m
L_
100 Im
Figure 12 SEM Photograph of PSOC 282 Treated Coal
(Run No 0039)
36
ORIGINAL PAGE I$OF POOR QUALITY
L__
100 Im
Figure 13 SEM Photograph of PSOC 276 Raw Coal
37
ORIGINAL PAGE 19 OF POOR QUALITY
L__
L__ 100 Im
Figure 14 SEM Photograph of PSOC 276 Treated Coal (Run No 0046)
38
ORIGINAL PAGE S OF POOR QUALITY
PSOC 282 RAW COAL
PSOC 282 COAL WASHED WITH IMNa2CO3 SOLUTION
Figure 15 EDAX Spectrum of Coal
39
OF pOOR QUALTYORIGWNAL PA(t IS
PSOC 282 TREATED COAL (RUN NO 0023)
PSOC 282 TREATED COAL (RUN NO 0026)
Figure 16 EDAX Spectrum of Coal
40
ORIGINAL PAGE IS OF POOR QUALITY
PSOC 282 TREATED COAL (RUN NO 0027)
PSOC 282 TREATED COAL (RUN NO 0039)
Figure 17 EDAX Spectrum of Coal
41
ORIGINAL PAGE 19 OF POOR QUALITY
PSOC 276 RAW COAL
PSOC 276 TREATED COAL (RUN NO 0046)
Figure 18 EDAX Spectrum of Coal
42
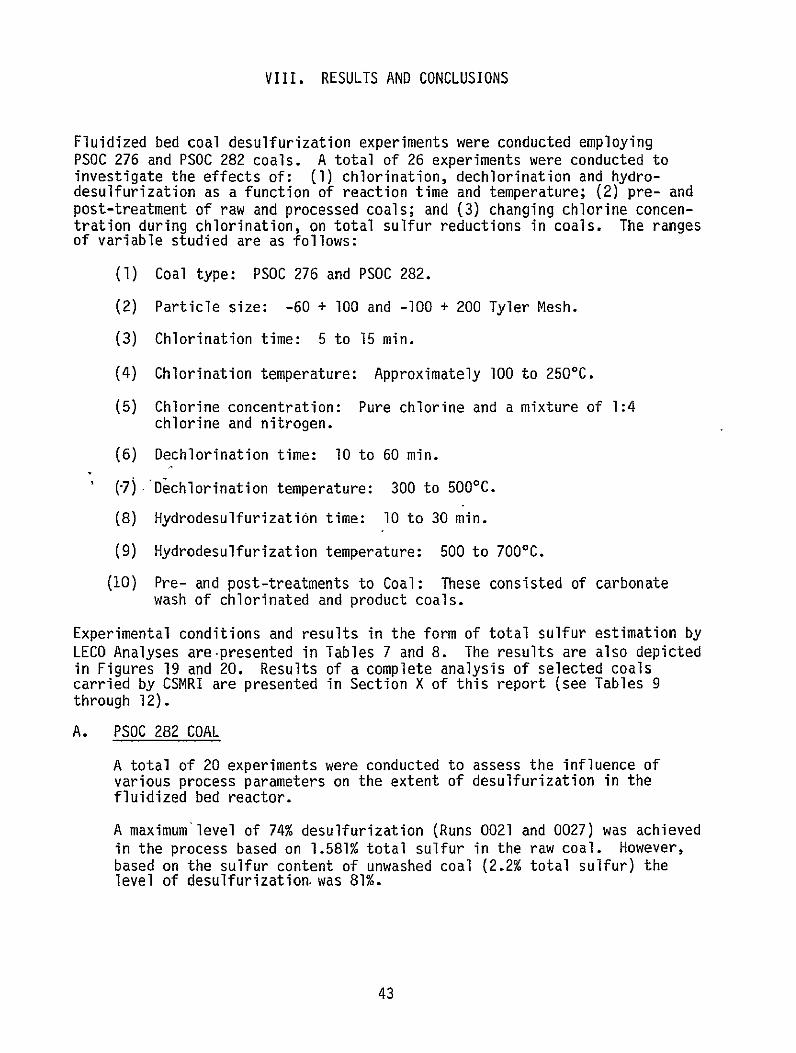
VIII RESULTS AND CONCLUSIONS
Fluidized bed coal desulfurization experiments were conducted employing PSOC 276 and PSOC 282 coals A total of 26 experiments were conducted to investigate the effects of (1) chlorination dechlorination and hydroshydesulfurization as a function of reaction time and temperature (2)pre- and post-treatment of raw and processed coals and (3)changing chlorine concenshytration during chlorination on total sulfur reductions in coals The ranges of variable studied are as follows
(1) Coal type PSOC 276 and PSOC 282
(2) Particle size -60 + 100 and -100 + 200 Tyler Mesh
(3) Chlorination time 5 to 15 min
(4) Chlorination temperature Approximately 100 to 250degC
(5) Chlorine concentration Pure chlorine and a mixture of 14 chlorine and nitrogen
(6) Dechlorination time 10 to 60 min
(-7) Dechlorination temperature 300 to 500C
(8) Hydrodesulfurization time 10 to 30 min
(9) Hydrodesulfurization temperature 500 to 7000C
(10) Pre- and post-treatments to Coal These consisted of carbonate wash of chlorinated and product coals
Experimental conditions and results in the form of total sulfur estimation by LECO Analyses arepresented in Tables 7 and 8 The results are also depicted in Figures 19 and 20 Results of a complete analysis of selected coals carried by CSMRI are presented in Section X of this report (see Tables 9 through 12)
A PSOC 282 COAL
A total of 20 experiments were conducted to assess the influence of various process parameters on the extent of desulfurization in the fluidized bed reactor
A maximum level of 74 desulfurization (Runs 0021 and 0027) was achieved in the process based on 1581 total sulfur in the raw coal However based on the sulfur content of unwashed coal (22 total sulfur) the level of desulfurization was 81
43
Table 7 Experimental Condition and Results
COAL PSOC 282 Illinois No 6 (-60 + 100 Tyler Mesh) Total Sulfur 1581 (Wt)a
Total Advanced Sulfur
Experiment Dechlorination Dechlorination in Desul-No Chlorination Intermediate Wash with Nitrogen with Hydrogen Post-Treatment Producta furization
0001 15 min ambient - 30 min 400C - 1170 261 0002 15 min ambient - 30 min 400C - water wash 1082 316 0003 15 min ambient - 30 min 400C - carbonate washb 0925 415
0004 15 min ambient - 60 min 400 106 327 0005 15 min ambient - 60 min 4001C water wash 104 342 0006 15 min ambient - 60 min 4000C carbonate wash 101 359
0007 15 min ambient - 30 min 5000C 107 322 0008 15 min ambient - 30 min 5001C water wash 106 327 0009 15 min ambient - 30 min 500C carbonate wash 105 328
0010 carbonate washb 150 51
0017 15 min 1000C - - 30 min 6000C 082 484 0018 0019
15 min 1000C 15 min 1000C
--
--
30 min 6001C 30 min 6000C
water wash carbonate wash
076 068
521 572
0020 15 min 1000C 0021 0022 0023
15 min 100degC 15 min 1001C 15 min 100
carbonate washb carbonate washb carbonate washb
--- 0
30 min 600degC 30 min 600degC 30 min 600C
water wash carbonate wash
041 041 038
741 741 760
0024 15 min 100degC water wash - 30 min 600-C 072 546
0026 15 min 1001C water wash --
0 30 min 6000C 30 min 600 0C
water wash carbonate wash
072 071
546 551
0027 15 min 1000C carbonate wash - 30 min 7000C 041 741
0028 15 min 1O0C carbonate wash - 30 min 700C water wash 041 741 0029 15 win 100 carbonate wash - 30 min 700degC carbonate wash 041 741
Table 7 Experimental Condition and Results (Continued)
COAL PSOC 282 Illinois No 6 (-60 + 100 Tyler Mesh) Total Sulfur 1581 (Wt)a
Total Advanced Sulfur
Experiment Dechlorination Dechlorination in Desul-No Chlorination Intermediate Wash with Nitrogen with Hydrogen Post-Treatment Producta furization
0030 - 3D min 600C 0976 383 0031 - 30 min 600C water wash 0902 429 0032 30 min 600C carbonate wash 0883 441
0033 0034
15 min 1001C 15 min 1000C carbonate wash -
-
30 min 500degC carbonate wash -shy
0690 563 0035 15 min 100C carbonate wash - 30 min 500C water wash 0677 572 0036 15 min 100degC carbonate wash - 30 min 500C carbonate wash 0552 587
0037 5 min 1000C carbonate wash - 30 min 7001C 0581 632 0038 5 min 100 C carbonate wash - 30 min 700degC carbonate wash 0498 685
0039c 0040c 15 min 100degC 15 min 100C
--
30 min 700C 30 min 700C carbonate wash
0614 0496
611 686
0041d 0042d
15 min 100C 15 min 100-C
carbonate wash carbonate wash
--
30 min 700C 30 min 70000 carbonate wash
0517 0517
673 673
0043 15 min 100C carbonate wash - 10 min 700C - 0632 600 0044 15 min 100 carbonate wash - 10 min 70000 carbonate wash 0449 716
0047 5 min I00C carbonate wash - 10 min 7000 - 0662 581 0048 5 min 1000C carbonate wash - 10 min 700degC carbonate wash 0600 620
0049e 15 min 100degC carbonate wash - 30 min 700C - 0521 670
0050e 15 min 10degC carbonate wash - 30 min 700degC carbonate wash 0409 741
0 0053 15 min 250C carbonate wash - 30 min 700C - 0 547 654
0 r 0054 15 min 2500 carbonate wash - 30 min 700 carbonate wash 0500 684 t __
Table 7 Experimental Condition and Results (Continued)
COAL PSOC 282 Illinois No 6 (-60 + 100 Tyler Mesh) Total Sulfur 1581 (Wt)a
Total Advanced Sulfur
Experiment Dechlorination Dechlorination in Desul-No Chlorination Intermediate Wash with Nitrogen with Hydrogen Post-Treatment Producta furization
0055 15 min 1000C - 109 292
0056e 15 min IO0C - 30 min 4000C - 1076 319
0057e 15 min O00C - 30 min 4000C - carbonate wash 1052 335
0058e 15 min 100C - 30 min 4000C 30 min 7000C 0849 463 0059e 15 min IO0C - 30 min 4000C 30 min 7000C carbonate wash 0850 462
0060e 15 min 1000C carbonate wash 30 min 700C 0412 739 0061e 15 min 100 carbonate wash - 30 min 7000C carbonate wash 0410 741
0062e 5 min IOuC - 10 min 7000C 0990 374 0063e 5 min 10000 - 10 min 700C carbonate wash 0985 377
aLECO analysis
bSoaked in 10 Na2CO3 solution for 30 min followed by washing with distilled water until free of alkali then dried
CCoal initially washed with 10 Na2CO3 solution and dried
d0dChlorination with a 41 mixture of nitrogen and chlorine c -00 + 200 Tyler Mesh
Table 8 Experimental Condition and Results a
COAL PSOC 276 Ohio No 8 (-60 + 100 Tyler Mesh) Total Sulfur 375 (Wt)
Total Advanced Sulfur
Experiment Dechlorination Dechlorination in Desul-No Chlorination Intermediate Wash with Nitrogen with Hydrogen Post-Treatment Producta furization
0011 15 min 1O0C - 30 min 400C 30 min 600C 260 306
0012 15 min IO0C - 30 min 400C 30 min 6000C water wash 233 379 0013 15 min ]OOC - 30 min 4000C 30 min 6000C carbonate washb 223 405
0045 15 min 1000C carbonate washb - 30 min 700C 0708 811 0046 15 min 1000 carbonate washb - 30 min 700 carbonate wash 0699 813 0051c 15 min 100 carbonate wash - 30 min 700C 1113 703
0052c 15 min IO00C carbonate wash - 30 min 700degC carbonate wash 0943 749
0064 5 min 100C - - 281 274
0065 30 min IO00C - 30 min 600C 30 min 700C 211 437 0066 30 min 100degC - 30 min 6000C 30 min 700C carbonate wash 167 555
0067 5 min 1000C - 10 min 6000C 10 min 7000C 2750 267 0068 5 min 100C - 10 min 6000C 10 min 7000 carbonate wash 1870 501
0069 5 min lO00C carbonate wash 10 min 600degC 10 min 700degC 147 608 0070 5 min IO0C carbonate wash 10 min 600C 10 min 7000C carbonate wash 146 609
aLECO analysis
bSoaked in 10 Na2CO3 solution for 30 min followed by washing with distilled water until free of alkalai then dried
c-lO00 + 200 Tyler Mesh
C 0 r
00
COAL PSOC 282 ILLINOIS NO 6 LEGEND
03 shy
04 -
PARTICLE SIZE -60 + 100 TYLER MESH -100 + 200 TYLER MESH
I WATER WASH CARBONATE WASH
7595
05 - 684
06
00 0
08 -09 -
07-526
gt
10
D-jS11 D
1213-
14
RAW
-
Cg amp
-0 e0 o0clt
0
o 0C
ogt000
o ot
cs N 0 -
)
- 368
209
51
Z 00Adeg
COAL 158
EXPERIMENT NO (REF- TABLE NO 11) --
Figure 19 Experimental Results of Fluidized Bed Coal Desulfurization PS0C 282 Illinois No 6
COAL PSOC 276 OHIO NO 8
05 PARTICLE SIZE -60 + 100 TYLER MESH -100 + 200 TYLER MESH
1811
10 -LEGEND
WATER WASH CARBONATE WASH
-733
15 - - 600
0U Z 20
L-4670 467
tL
Ln 25 - 333 Ds
nCo
30 200 M
35 RAW
-C
00 Ii
01 to
to
r
COAL 375o
Figure 20
- EXPERIMENT NO (REF TABLE NO 12)
Experimental Results of Fluidized Bed Coal Desulfurization PSOC 276 Ohio No 8
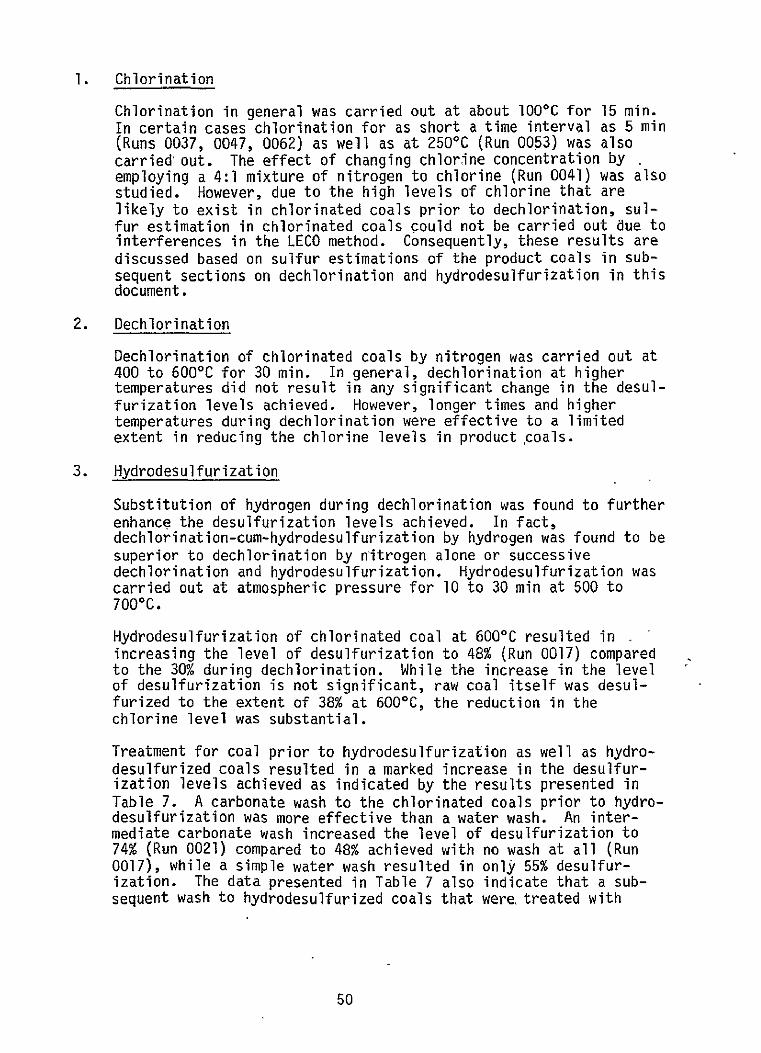
1 Chlorination
Chlorination in general was carried out at about 100C for 15 min In certain cases chlorination for as short a time interval as 5 min (Runs 0037 0047 0062) as well as at 2500 C (Run 0053) was also carried out The effect of changing chlorine concentration by employing a 41 mixture of nitrogen to chlorine (Run 0041) was also studied However due to the high levels of chlorine that are likely to exist in chlorinated coals prior to dechlorination sulshyfur estimation in chlorinated coals could not be carried out due to interferences in the LECO method Consequently these results are discussed based on sulfur estimations of the product coals in subshysequent sections on dechlorination and hydrodesulfurization in this document
2 Dechlorination
Dechlorination of chlorinated coals by nitrogen was carried out at 400 to 600C for 30 min In general dechlorination at higher temperatures did not result in any significant change in the desulshyfurization levels achieved However longer times and higher temperatures during dechlorination were effective to a limited extent in reducing the chlorine levels in product coals
3 Hydrodesulfurization
Substitution of hydrogen during dechlorination was found to further enhance the desulfurization levels achieved Infact dechlorination-cum-hydrodesulfurization by hydrogen was found to be superior to dechlorination by nitrogen alone or successive dechlorination and hydrodesulfurization Hydrodesulfurization was carried out at atmospheric pressure for 10 to 30 min at 500 to 7000C
Hydrodesulfurization of chlorinated coal at 6000C resulted in increasing the level of desulfurization to 48 (Run 0017) compared to the 30 during dechlorination While the increase in the level of desulfurization is not significant raw coal itself was desulshyfurized to the extent of 38 at 6000C the reduction in the chlorine level was substantial
Treatment for coal prior to hydrodesulfurization as well as hydroshydesulfurized coals resulted in a marked increase in the desulfurshyization levels achieved as indicated by the results presented in Table 7 A carbonate wash to the chlorinated coals prior to hydroshydesulfurization was more effective than a water wash An intershymediate carbonate wash increased the level of desulfurization to 74 (Run 0021) compared to 48 achieved with no wash at all (Run 0017) while a simple water wash resulted in only 55 desulfurshyization The data presented in Table 7 also indicate that a subshysequent wash to hydrodesulfurized coals that weretreated with
50
carbonate prior to hydrodesulfurization did not significantly enhance the level of desulfurization The substantial reduction in sulfur levels in coals as a consequence of carbonate treatment to chlorinated coals is likely due to the removal of organic sulfur by alkali Alkali treatment of coal results in the removal of both pyritic and organic forms of sulfur more so if the coal is inishytially subjected to an oxidation treatment The minor reductions in sulfur levels achieved by subjecting product coals to a carshybonate wash may be the result of trapping sulfur in the ash during combustion by sodium ions that might have been retained in the coal It is believed that alkaline metals such as sodium calcium etc either chemically bound to coal or in a physical mixture with coal are capable of reducing potential sulfur emissions during coal combustion by trapping the sulfur in the ash as sulfate
Treating raw coal with carbonate solution prior to desulfurization resulted in achieving a desulfurization level of 61 (Run 0039)
Because gaseous chlorine was employed as the fluidizing medium chlorine requirement in the process could be reduced by either reducing the time of reaction or by reducing the chlorine concenshytration in the feed by diluting it with an inert gas Both these alternatives were found to result in high levels of desulfurshyization By chlorinating for only 5 min (Run 0037) as much as 63 desulfurization was achieved while a mixture of 41 nitrogen and chlorine during chlorination (Run 0039) resulted in 61 desulfurization
Even the time of hydrodesulfurization can be reduced without sacrishyficing the level of desulfbrization as indicated by Run 0043 in which 60 desulfurization was achieved Reduction of the time of chlorination and hydrodesulfurization by as much as one-third (Run 0047) resulted in 58 desulfurization The data clearly shows that shorter reaction times and lower reactant concentrations can be used while still achieving higher levels of desulfurization However a more detailed parametric study is needed to establish optimum conditions of operation
Higher temperature during chlorination did not result in any significant enhancement of the level of desulfurization as indicated by Run 0053 in which 250C during chlorination resulted in only 65 desulfurization
Particle size also did not have a significant effect within the range of particle sizes studied (Compare Runs 0027 and 0060 for -60 +100 mesh and -100 +200 mesh respectively)
51
B PSOC 276 Coal
A limited number of experiments was conducted employing PSOC 276 coal The maximum level of desulfurization achieved was once again 81 (Run 0045) The general trend was the same as with PSOC 282 coal in that
(1) Substitution of hydrogen during dechlorination markedly improved
the level of desulfurization
(2) Particle size did not have any effect in the range of sizes studied
(3) Even 5 min of chlorination and 10 min of dechlorination cumshyhydrodesulfurization resulted in 60 desulfurization
(4) Carbonate wash prior to hydrodesulfurization significantly enhanced the level of desulfurization
(5) Longer times of chlorination and dechlorination did not enhance desulfurization
52
IX SCANNING ELECTRON MICROSCOPY (SEM) EXAMINATION OF COAL SURFACE
During desulfurization treatments coal undergoes various chemical changes which will also be reflected in changes in the gross physical structure One convenient method of assessing the physical changes undergone by coal surface is Scanning Electron Microscopy (SEM) Due to the imaging process inherent with SEM coal particles can be examined at magnifications up to 10000 times while maintaining a sufficiently large depth of field to render a three-dimensional quality to the image However the technique is-limited to an examination of the exterior surface of the particles and precludes any quantitative measurements Even so such information should provide a good qualitative indication of the changes undergone by the particle interior
By using SEM along with EDAX (Energy Dispersive Analyzer for X-Rays) it is possible to obtain a relative comparison of the levels of sulfur and mineral components in coal While this information is qualitative it nevertheless provides a basis for quickly comparing the levels of common mineral components and sulfur in coal and the effect of different treatments to coal
A SEM PHOTOGRAPHS
PSOC 276 and PSOC 282 raw coals as well as product coals from some typical experiments were examined by SEM (see representative photographs at 100 and 10000 magnification in Figures 7 through 14)
Figures 7 and 13 show the SEM photographs of PSOC 282 and PSOC 276 coals respectively Both photographs show the same general features The coal particles are covered and interspaced by several smaller particles which appear to adhere to the larger particles The dimensions of the coal particles range from 50 to 200m while a majority of the small particles are of the order of lvm or smaller It is possible that the small particles are formed during the process of grinding and are not removed during sieving
Washing PSOC 282 raw coal with 1 M Na2CO3 solution appears to have removed a majority of the small particles from the coal surface As the reduction in sulfur by the carbonate wash is only about 5 it is reasonable to assume that the smaller particles may essentially consist of mineral matter besides pyrites
Figures 9 through 12 and Figure 14 present the SEM photographs of desulfurized coals These photographs in general show that the desulfurization treatments resulted in a substantial cleaning of the coal surface not achieved by a carbonate wash They also show that not only are the coal surfaces clean but they also appear to be etched Some of the particles also appear to have developed fissures While the raw coal particle surfaces are smooth the product coal particle surfaces appear to be rough with noticeable cracks These features are indicative of the removal of some portions from the coal surface as well as a breakdown of structure in some cases during the desulfurization treatments
53
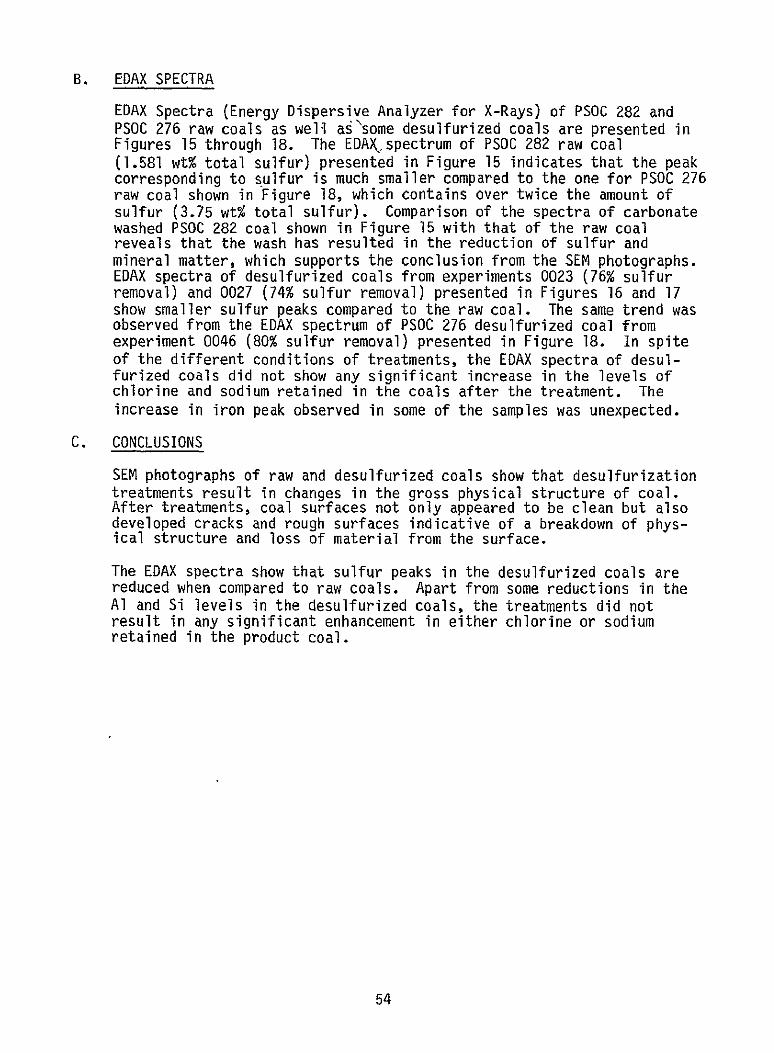
B EDAX SPECTRA
EDAX Spectra (Energy Dispersive Analyzer for X-Rays) of PSOC 282 and PSOC 276 raw coals as well assome desulfurized coals are presented in Figures 15 through 18 The EDAkspectrum of PSOC 282 raw coal (1581 wt total sulfur) presented in Figure 15 indicates that the peak corresponding to sulfur is much smaller compared to the one for PSOC 276 raw coal shown in Figure 18 which contains over twice the amount of sulfur (375 wt total sulfur) Comparison of the spectra of carbonate washed PSOC 282 coal shown in Figure 15 with that of the raw coal reveals that the wash has resulted in the reduction of sulfur and mineral matter which supports the conclusion from the SEM photographs EDAX spectra of desulfurized coals from experiments 0023 (76 sulfur removal) and 0027 (74 sulfur removal) presented in Figures 16 and 17 show smaller sulfur peaks compared to the raw coal The same trend was observed from the EDAX spectrum of PSOC 276 desulfurized coal from experiment 0046 (80 sulfur removal) presented in Figure 18 In spite of the different conditions of treatments the EDAX spectra of desulshyfurized coals did not show any significant increase in the levels of chlorine and sodium retained in the coals after the treatment The increase in iron peak observed in some of the samples was unexpected
C CONCLUSIONS
SEM photographs of raw and desulfurized coals show that desulfurization treatments result in changes in the gross physical structure of coal After treatments coal surfaces not only appeared to be clean but also developed cracks and rough surfaces indicative of a breakdown of physshyical structure and loss of material from the surface
The EDAX spectra show that sulfur peaks in the desulfurized coals are reduced when compared to raw coals Apart from some reductions in the Al and Si levels in the desulfurized coals the treatments did not result in any significant enhancement in either chlorine or sodium retained in the product coal
54
X RESULTS OF CSMRI ANALYSES
A TOTAL SULFUR AND SULFUR FORMS
Ten coal samples from typical experiments were analyzed at the ColoradpSchool of Mines Research Institute (CSMRI) for total sulfur and sulfur forms by ASTM-approved methods Ingeneral the total sulfur estimashytions by LECO acid-base analysis were in agreement with the CSMRI values Some anomalies were observed in the CSMRI results on sulfur forms such as an increase in organic sulfur fraction in coal after desulfurization in spite of substantial reductions intotal sulfur pyritic sulfur and sulfate sulfur This anomaly ismore likely to be due to the analytical bias rather than by any transformation of pyritic sulfur to organic form Inview of the fact that organic sulfur is calshyculated by difference any errors inestimating total iron and pyritic iron could lead to such anomalies Therefore more precise methods for characterizing sulfur distribution incoal as well as for the direct estimation of organic sulfur are needed
1 PSOC 282 Coal
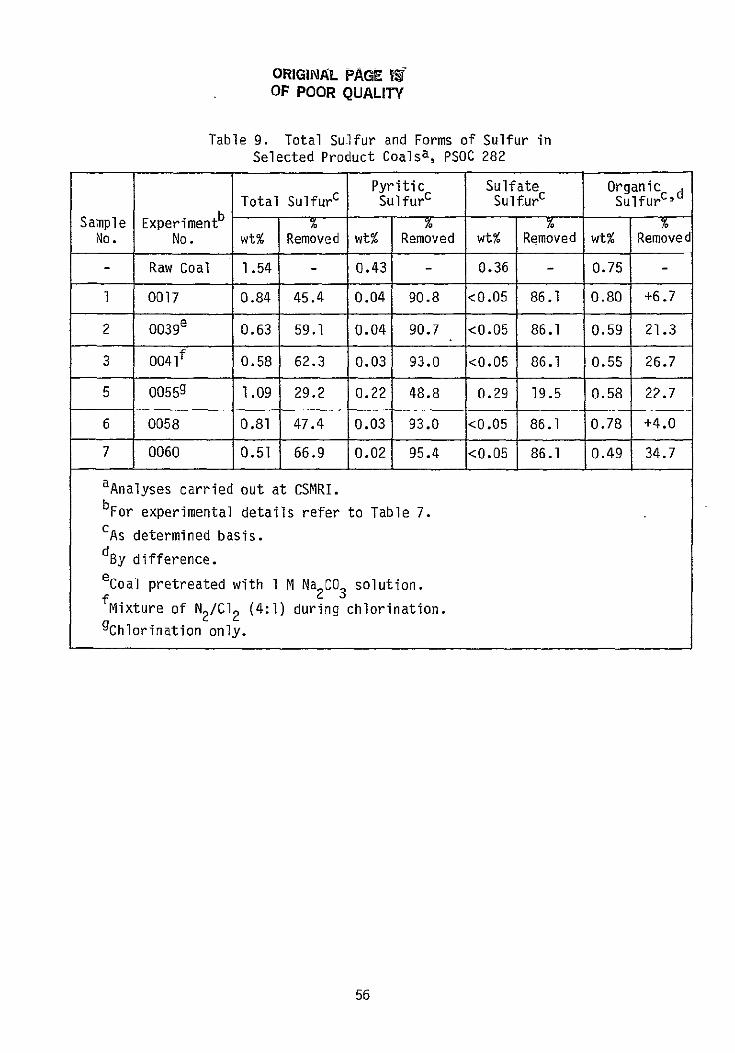
Samples from six typical experiments were analyzed for total sulfur and sulfur forms at CSMRI The results are presented in Table 9 Pyritic sulfur reductions were uniformly above 90 except in the case where the coal was only chlorinated (48) Sulfate sulfur reductions were also high Organic sulfur reductions varied from 21 to 34 except in two cases where there was an apparent increase Insamples from experiments 0017 and 0039 (where the coals were not subjected to any post or intermediate washing treatshyments) the pyritic sulfur was reduced by 90 Thus itappears that the sulfur is removed as gas-phase species and lends support to the proposed mechanism This is also evident from the results of experiment 0055 inwhich coal was only chlorinated resulting in 49 pyritic sulfur reduction Consequently in the proposed process an intermediate wash between chlorination and dechlorinashytion andor hydrodesulfurization steps appears to be totally unnecessary thereby simplifying the process considerably
2 PSOC 276 Coal
Four samples from typical experiments were analyzed at CSMRI for total sulfur and sulfur forms The results are presented in Table 10 Again there was some analytical bias inorganic sulfur estimations
In experiment 0045 inwhich maximum desulfurization of 82 was achieved the reductions inpyritic sulfate and organic sulfur were 99 100 and 43 respectively
55
ORIGINAL PAGE gr OF POOR QUALITY
Table 9 Total Sulfur and Forms of Sulfur in Selected Product Coalsa PSOC 282
Pyritic Sulfate Organic cc Sulfur Sulfurc dTotal Sulfurc Sulfur
Sample Experimentb
No No wt Removed wt Removed wt Removed wt Removed
- Raw Coal 154 - 043 - 036 - 075 shy
0017 084 454 004 908 lt005 861 080 +67
2 0039 e 063 591 004 907 lt005 861 059 213
3 0041f 058 623 003 930 lt005 861 055 267
5 0055g 109 292 022 488 029 195 058 227
6 0058 081 474 003 930 lt005 861 078 +40
7 0060 051 669 002 954 lt005 861 049 347
aAnalyses carried out at CSMRI
bFor experimental details refer to Table 7
CAs determined basis
dBy difference
ecoal pretreated with 1 M Na CO solution
fMixture of N2C12 (41) during chlorination
gChlorination only
56
ORIGINAL PAGE 18
Table 10 Total Sulfur and Forms of Sulfur in OF POOR QUAL1TY
Selected Product Coalsa PSOC 276
Total Sulfurc PyriticSulfurc
Sulfate Sulfurc
Organicc dSulfur d
Sample Experimentb No No wt Removed wt Removed wt Removed wt Removed
- Raw Coal 387 - 263 - 006 117 -
4 0045 070 819 003 988 lt005 067 427
8 0064e 281 274 072 726 102g - 107 85
9 0067 229 408 013 950 lt005 - 216
10 0069 f 173 553 004 985 lt005 - 169g
aAnalyses carried out at CSMRI
bFor experimental details refer to Table 8 cAs determined basis dBy difference
eChlorination only
f5 min chlorination and 10 min dechlorination and hydrodesulfurization
gAnamolous results showing a substantial increase
57
Inexperiments 0064 0067 and 0069 the coal was chlorinated for 5 min and dechlorinatedhydrodesulfurized for I0min Chlorination alone for as short a time as 5 min removes as high as 73 of the pyritic sulfur Results of these experiments inwhich coals were not subjected to any washing treatment lend support to the contenshytion that the sulfur is removed in the gas-phase and no intershymediate washing step is necessary
PSOC 276 coal is desulfurized to a greater extent compared to PSOC 282 coal Even 5 min chlorination followed by 10 min of dechlorination has resulted in 99 reduction in pyritic sulfur
3 Comparison of CSMRI and LECO Analyses
Table 11 presents the results of CSMRI and LECO analyses for total sulfur in the present investigation The values are in agreement with an average deviation of 88
B PROXIMATE AND ULTIMATE ANALYSES
Four samples of chlorinated coals and chlorinated and desulfurized coals were analyzed at CSMRI for long proximate and ultimate analyses The results are presented in Table 12
1 PSOC 282 COAL
Proximate and ultimate analyses of raw coal coal chlorinated at I0CC for 15 min and chlorinated coal hydrodesulfurized at 700C for 30 min are presented in Table 12
By chlorination only the ash carbon hydrogen sulfur and nitrogen contents slightly decreased while the oxygen content remained unchanged There was a significant drop in heating value and subshystantial increase in chlorine content (129 compared to 047 in raw coal)
Dechlorination-cum-hydrodesulfurization resulted in a slight increase in the ash content and heating values The volatiles decreased considerably (from 338 in raw coal to 59) fixed carbon value increased substantially (872 compared to 595 in raw coal) carbon content increased from 748 to 858 hydrogen content decreased from 48 to 2 and nitrogen content remained almost unchanged Hydrogen treatment resulted in a substantial decrease inthe sulfur content (16 to 049) and dxygen content (10 to 263) The chlorine content after the dechlorinationshycum-hydrodesulfurization treatment was almost the same as in the raw coal
58
ORIGINAL PACE 1 OF POOR QUALITY
Table 11 Comparison of Total Sulfur Estimation by Eschka and LECO Methods
ample Experiment I Eschka b LECO Difference No INoa Analysis DeviationAnalysis Eschka-LECO
PSOC 282 COAL (Illinois No 6)
- Raw Coal 154 158 -004 -25
1 0017 084 082 +002 +24
2 0039 063 0-61 +002 +33
3 0041 058 052 +006 +115
5 0055 109 shy
6 0058 081 085 -004 -47
7 0060 051 041 +010 +244
PSOC 276 COAL (Ohio No 8)
- Raw Coal 387 375 +012 +32
4 0045 070 071 -001 -14
8 0064 281 shy
-9 0067 229 275 -046 -167
10 0069 173 147 +026 +176
PERCENT AVERAGE DEVIATION 88
aFor experimental details refer to Tables -7and 8
bAnalyses carried out at CSMRI
CAnalyses carried out at JPL
59
Table 12 Proximate and Ultimate Analyses of Selected Product Coalsa
Ash Volatile
Matter Fixed
Carbon Heating Value
Btulb Carbon
Coal Sample
No Experiment
Nob Moisturec
AD ryd ADAD Dry AD Dry AD Dry
PSOC 282 0 Raw Coalf 31 - 670 - 3380 - 5950 - 13092 - 748
PSOC 282 A 0055 361 588 610 3450 3580 5600 5810 10752 11150 6240 6270
PSOC 282 B 0060 213 678 693 5 77 590 8530 8720 13372 13666 8400 8580
PSOC 276 0 Raw Coalf 189 - 1150 - 3720 - 5130 - 12755 - 7160
PSOC 276 C 0064 273 1040 1070 3530 3630 5160 5300 11165 11478 6360 6540
PSOC 276 D 0069 131 1280 1300
Hydrogen
709 718
Sulfur
7880 7980
Nitrogen
12580 12744
Chlorine
7910 8010
Oxygen e C
aAnalysis carried out at CSMRI bFor experimental details
refer to Tables 7 and 8 CAs determined basis
Sample No 0
A
B
AD -
422
220
Dry 482
396
__
200
AD
-
116
048
Dry
160
120
049
AD
--goa
127
160
Dry
169
132
164
AD
-
1240
050
Dry
047
1290
051
AD
-
1270
444
Dry
1000
982
263
a
r
dDry basis
f y difference
0
C
-
470
567
452
-
284
391
292
-
111
128
114
-
443
016
455
-
1290
587
1080
tFrom Phase III Report
(Ref 3) D 221 209 163 165
_
138 140 013 013 275 163
ORIGINAL PAGE iS OF POOR QUALITY
As a result of the desulfurization process there is a net increase inthe ash content and heating values a substantial increase in fixed carbon and carbon values and a significant decrease inthe volatile matter hydrogen sulfur and oxygen contents Nitrogen and chlorine values remained essentially unchanged
2 PSOC 276 COAL
Proximate and ultimate analyses of PSOC 276 raw coal coal chlorishynated at 100C for 5 min and chlorinated coal dechlorinated at 600C for 10 min and hydrodesulfurized at 700 for 10 min are presented in Table 12
As a consequence of chlorination there-was an initial decrease in ash content heating value carbon and nitrogen The chlorine content increased substantially (from 016 to 455) After dechlorination and hydrodesulfurization there was a net increase in the ash content (115 to 130) fixed carbon (513 to 788) carbon (716 to 801) and nitrogen (128 to 14) The increase innitrogen content inthis case may be due to successive dechlorshyination and hydrodesulfurization instead of dechlorination-cumshyhydrodesulfurization as in the case of PSOC 282 coal The volatile matter decreased from 372 to 72 hydrogen decreased from 567 to 21 sulfur decreased from 391 to 163 and oxygen decreased from 587 to 163 The heating value and chlorine content remained unchanged Infact the chlorine content of the desulshyfurized coal is even slightly lower than the raw coal
Ingeneral the desulfurization treatments resulted in a slight net increase in ash content and heating value a substantial increase in fixed carbon and carbon values and an equally substantial reduction in volatile matter hydrogen sulfur and oxygen contents
CONCLUSIONS
Proximate and ultimate analyses of raw chlorinated and dechlorinated andor hydrodesulfurized coals revealed that the desulfurization processresults inproduct coals with increased fixed carbon and carbon contents and substantially reduced volatiles hydrogen and oxygen contents There was a net increase in ash content and heating values
The nitrogen and chlorine contents remained essentially unchanged
dThe results show that further reductions are possible inchlorinerequirement inthe process and that the use of chlorine inthe process Mas not resulted inany increased chlorine levels inthe product coals T is is significant because of environmental implications and corrosion
intermediate wash torconsiderations The results also indicate that an chlorinated coals may be totally unnecessary thereby making the processsimpler and more economical than present processes
61
XI REFERENCES
Kalvinskas John J et al Final Report for Phase I - Coal Desulfurization by Low Temperature Chlorinolysis JPL Publication bull78-8 November 23 19l7
Kalvinskas John J et al Final Report - Coal Desulfurization by Low Temperature Chlorinolysis Phase II JPL Publication 80-15 January 15 1980
Kalvinskas John J et al Final Report - Coal Desulfurization by Low Temperature Chlorinolysis Phase III JPL Publication 81-82 March 1 1981
Kalvinskas John J and Dave Daly Final Report - Coal Desulfurization by Chorinolysis - Production and Combustion Test Evaluation of Product Coals L Publication 82-2 April 30 1982
Haldipur G et al Desulfurization of Coal in Fluidized Bed Reactor Coal Desulfurization - Chemical and Physical Methods edited by Thomas D Wheelock ACS Symp Series 1977
Boodman N S et al Fluid-Bed CarbonizationDesulfurization of
Illinois Coal by the Clean Coke Process PDU Studies loc cit (Ref 5)
Fleming D K et al Hydrodesulfurization of Coals loc cit (Ref 5)
Thiessen G Pyrolytic Reactions of Coal Chem Coal Util Suppl Vol 340 1963
Powell A R Ind Eng Chem 12 1069 1077 (1920)
Ibid JACS 45 1 (1923)
Snow R D Ind Eng Chem 24 903 (1932)
Grey C A et al IEC Prod Res Dev 9 357 (1970)
Maa P S et al Fuel 54 62 (1975)
Batchelor J D et al Ind Eng Chem 52 161 (1960)
Guth E D Oxidative Coal Desulfurization Using Nitrogen Oxides TheKVB Process Proceedings Symposium On Coal Cleaning to Achieve Energy and Environmental Goals Hollywood Florida September 1978
Block S S et al Fuel 54 113 (1975)
Sinha R K and Walker P L Fuel 51 125 329 (1972)
Jackobs J K and Mirkus J D Ind Eng Chem 50 24 (1958)
CEDING PAGE BLANK NOT FILMED 63 ITshy
ly 111I1
19 Huang Edmund Tao Kang and Pulsifer Allen H Coal Desulfurization During Gaseous Treatment loc cit (Ref 5)
20 Ezdakov V I Chlorination of Pyrite Trudy Uzbekskogo GosudarstUniv Sbornik Rabot Khim 15 131 (1939)
21 - Chlorine removes 95 of the sulfur from FeS2 at 600 J Ind Chem Soc News Ed B 8T(1945-
22 Goldstein J I and Yakowitz H Edited Practical Scanning Electron Microscopy Plenum Press New York NY (19b)
64
APPENDIX A
perating Procedure for the Laboratory Scale Batch Fluidized
Bed Reactor System for Coal Desulfurization
65
OPERATING PROCEDURE FOR THE LABORATORY SCALE BATCH FLUIDIZED BED REACTOR SYSTEM FOR COAL DESULFURIZATION
INTRODUCTION
is standard operating procedure outlines the conditions required for the Fe operation of the laboratory scale batch fluidized bed reactor system for al desulfurization shown in Figure I
OPERATING RULES AND CONDITIONS
eration of the batch fluidized bed reactor system is subject to specific les and conditions Prior to beginning an experimental run the following Rps must be completed
(1) The reactor and accessories must be connected in the sequence shown
in Figure 1
(2) The entire system must be leakproof
(3) A complete description of an experimental run must be made available to the operator
(4) Excess chlorine gas during chlorination must be scrubbed with sodium carbonate solution
(5) Hydrochloric acid gas and hydrogen sulfide gas generated during dechlorination and hydrodesulfurization respectively must be scrubbed with sodium carbonate solution
[ PERSONNEL SAFETY
sonnel operating the batch-fluidized bed reactor system should be equipped bh
(1) Protective garments such as a laboratory coat and rubber or asbestos gloves
(2) Protective eye glasses
(3) Proper respiratory equipment such as gas masks for toxic gases and coal dust
(4) Fire extinguishing equipment in proper working condition and a water shower
PRECEDING PAGE BLANK NOT FILMHED
67 0a(41WBhlJ SD
IV EQUIPMENT SAFETY
To ensure safe conditions specific precautions with equipment must be taken
A CHLORINATION
(1) Do not allow liquid chlorine into the reactor A mixture of
liquid chlorine and coal is potentially explosive
(2) Preheat the chlorine to ensure that it is vaporized
(3) If leaks develop during a run repair them immediately othershywise stop the chlorine flow and abort the run
(4) Ensure that the exhaust in the fuming cupboard isworking at all times during an experiment
(5) At the end of prescribed reaction time shut off the chlorine flow Purge the system with nitrogen
(6) Make certain that the coal is being fluidized by observing the minor pressure drop fluctuations in the manometer
(7) The reactor should be adequately insulated to conserve the heat generated during chlorination
(8) Ensure that the scrubber isworking satisfactorily
B DECHLORINATION
(1) The batch-fluidized bed dechlorinator system should be opershyated in an oxygen-free environment to avoid possible coal comshybustion and explosion
(2) The reactor should be properly insulated to reduce radiation losses
(3) Hydrochloric acid vapors should be scrubbed with sodium carshybonate solution
(4) Check periodically that the heater controller isworking properly
(5) Maintain the nitrogen flow through the reactor at all times during dechlorination and cooling Failure to do so may cause fire andor an explosion
(6) In case of fire shut off the heaters and smother the fire with a nitrogen flow andor a CO2 fire extinguisher
68
C HYDRODESULFURIZATION
Before hydrogen is fed into the reactor the following tasks must be completed
(1) The hydrogen cylinder control valves and pressure gage must be installed outside the building away from the reactor system
(2) The reactor system should be completely leakproof Check it by feeding nitrogen under slight pressure
(3) The reactor should be adequately insulated with no heater parts exposed
(4) The operator should close the door of the fuming cupboard containing the reactor system and stay away from the reactor system
(5) Heat the reactor to the required temperature under nitrogen blanket before feeding hydrogen
(6) After the hydrodesulfurization experiment is completed shut off the hydrogen supply and switch off the heaters simultaneshyously then cool the reactor under nitrogen atmosphere
(7) In case of fire during hydrodesulfurization stop feeding hydrogen immediately start nitrogen flow to the reactor wait for 2 or 3 minutes in order to purge the system and put the fire out
(8) Check that the exhaust in the fuming cupboard is working at
all times during hydrodesulfurization
D REACTOR AND ACCESSORIES
(1) Before starting a run ensure that the reactor and accessories are thoroughly cleaned after the previous experiment and are connected in sequence
(2) Load the reactor with coal position securely in place and make the appropriate connections to the accessories such as manometer condenser etc
(3) Mount the heaters on the reactor and lag them properly before making the power connections
(4) Fill the scrubber with 1 M Na2CO3 solution
(5) Ensure that the exhaust fan is working
69
(6) Always start a run by feeding nitrogen into the reactor first and ensuring that the system isfree of oxygen
(7) After a run clean the entire system thoroughly in preparation for the next experiment
V OPERATING PROCEDURE
The following standard operating procedure should be available to the operashytor prior to starting an experiment
A START-UP
(1) Weigh the required quantity of dry coal (dried in an oven at IO0C for 6 hours and cooled in a desiccator) and transfer it to the reactor
(2) Position the reactor in place and connect the accessories
(3) Connect the pressure drop tappings to the manometer
(4) Fill the scrubber with 1 M Na2CO3 solution and connect it to the system
(5) Start water flow through the glass condenser
(6) Mount the reactor heaters insulate them and make the appropriate connections to the controller and power supply
(7) Switch on the exhaust in the fuming cupboard
(8) Check the system for leaks by feeding nitrogen under slight pressure
(9) Adjust the flow of nitrogen so that the bed isfluidized as indicated by the manometer reading
(10) Switch on the power supply to the preheater and reactor heaters set the temperature control for the required temperashyture and allow the system to reach stable condition
B CHLORINATION
(1) After the reactor has attained the set temperature start chlorination by stopping the nitrogen flow and feedingchlorine at the required flow rate Ensure that the bed is properly fluidized by-tapping the reactor if necessary(During the first few minutes of chlorination coal has a tendency to consolidate due to the heat generated)
70
(2) Conduct the run for the required time interval
(3) After chlorination stop chlorine flow and start feeding nitrogen at the required flow rate
C DECHLORINATION
(1) Set the reactor temperature to the required level
(2) After the required temperature is attained conduct dechlorshyination for the required time interval
D HYDRODESULFURIZATION
(1) Set the reactor temperature to the desired level and allow the reactor to attain the temperature
(2) After the reactor has attained the temperature start hydroshydesulfurization by shutting off the nitrogen flow and feeding hydrogen at the flow rate required for fluidization
(3) Conduct the run for the required time interval
(4) After hydrodesulfurization stop the hydrogen flow begin feeding nitrogen and switch off the power supply to the preshyheater and reactor heaters
(5) In case of dechlorination-cum-hydrodesulfurization omit Step C (Dechlorination) and continue with Step D after Step B (Chlorination)
E SHUT-DOWN
(1) Allow the reactor to cool to the ambient temperature in a nitrogen blanket
(2) Stop nitrogen flow dismantle the heaters from the reactor and disconnect the reactor from the manometer and the rest of the assembly
(3) Collect and weigh the product coal from the reactor
(4) Collect the condensate from the receiver
(5) Collect a sample of the scrubber solution
(6) Clean the reactor and accessories thoroughly
71
APPENDIX B
Procedure to Determine Sulfur Forms in Coal (ASTM Method)
PRECEDING PAGE BLANK NOT TILMED
73 ____
ANALYTICAL PROCEDURE TO DETERMINE SULFUR FORMS IN COAL (ASTM METHOD)
A SUMMARY OF THE METHOD
(1) Sulfate sulfur is determined by extracting a weighed sample of coal with dilute hydrochloric acid followed by precipitation with barium chloride (BaCI2) and weighing the precipitate as barium sulfate (BaS04) Sulfate sulfur is soluble in diluted hydrochloric acid while pyritic and organic forms of sulfur are not
(2) Pyritic sulfur is determined by extracting a weighed sample of coal with dilute nitric acid followed by titrimetric or atomic absorption determination of iron in the extract as a measure of pyritic sulfur Extraction of pyritic sulfur from coal with dilute nitric acid involves the oxidation of ferrous iron to ferric iron and sulfide sulfur to sulfate sulfur both of which are soluble in nitric acid Since a small amount of organic sulfur is also dissolved along with sulfate and pyritic sulfur during extraction the dissolved sulfur is not a reliable measure of pyritic sulfur Consequently it is estimated by determining the amount of iron present in the pyrite which is obtained from the difference between nitric acid and hydrochloric acid soluble iron However there are certain limitations to the use of sulfate sulfur residue for the determination of pyritic sulfur in coal For example if pyritic iron is high then the large sample required for determining the small amounts of sulfate sulfur will contain large quantities of iron and may require dilution In addition the determination of pyritic iron cannot be carried out until both extractions for sulfur have been completed
(3) Organic sulfur is determined by subtracting the sum of sulfate sulfur and pyritic sulfur from the total sulfur as determined by the Eschka Method (ASTM Method D-3177)
B REAGENTS
(1) Barium chloride solution (100 gl) - Dissolve 100 g of barium chloride (BaCl 2 bull 2H20) in water and dilute to 1000 ml
(2) Hydrochloric acid (2 + 3) - Mix 2 volumes of concentrated hydrochloric acid (specific gravity 119) with 3 volumes of water
(3) Hydrochloric acid (I + 23) - Mix 1 volume of concentrated hydrochloric acid (specific gravity 119) with 23 volumes of water
PRECEDING PAGE BLANK NOT FILMED 04shy
(4) Nitric acid (I + 7) - Mix 1 volume of concentrated nitric acid (specific gravity 142) with 7 volumes of water
C PROCEDURE
1 Sulfate Sulfur
a Extraction of sulfate sulfur Weigh to the nearest 01 mg about 5 g of thoroughly mixed air-dried coal that has been ground to pass a No 60 sieve transfer to a 250-mi Erlenmeyer flask and add 50 ml of HC] (2 + 3) Fit the cold-finger condenser into the neck of the flask place on a hot plate and boil for 30 min Rinse the cold-finger condenser into a flask with HC (1+ 23) and filter through a medium textured double acid-washed filter paper into a 400-ml beaker Transfer the residue to the filter wash six times with HCl (1 + 23) using a total of about 35 ml and determine sulfate sulfur in the filtrate as decribed in (b)and (c)below The residual coal may be retained for the determination of pyritic sulfur Discard the residual coal if separate sample isused for the pyritic sulfur determination
b Removal of iron To the filtrate obtained from (a)above add 10 ml of saturated bromine water cover with a watch glass and boil for 5 min to ensure that all iron is in the ferric state Expell excess bromine Precipitateiron by slowly adding NH40H (specific gravity 090)until a slight excess is present then add 5 ml more while stirring to coagulate the yellowish brown ferric hydroxide precipitate Place the covered beaker on a hot plate and boil for I min Filter the iron precipitate using an ashless medium-texture filter paper and collect the filtrate in a 600-ml beaker Wash the precipitate several times with hot water to which a trace of NH4OH and NH4Cl has been added Retain the filtrate with washings for the determination of sulfur and the preshycipitate with the original beaker for the determination of non-pyritic iron
c Final determination of sulfate sulfur Neutralize the filtrate from (b)above with concentrated HCI (specificgravity 119) and add an excess of about 1 ml using methyl orange as an indicator Heat the solution to boiling and while stirring add 10 ml of BaCl2 solushytion drop by drop Continue boiling the solution for 15 min and allow to simmer for 2 h just below boiling Filter through an ashless filter paper and wash the precipitate repeatedly with hot water until silver nitrate (AgNO3) solution shows no precipitate with 1 drop of the filtrate Place the wet filter paper conshytaining the precipitate of barium sulfate (BaS04) in a weighed platinum porcelain silica or refractory
76
crucible allowing a free access of air by folding the paper over the precipitate loosely to prevent spattering Smoke the paper off gradually and at no time allow it to burn with a flame After the paper is almost consumed raise the temperature to approximately 9250C and heat to constant weight The value so obtained and corrected for the blank determination (see d below) represents the sulfate sulfur of the coal
d Make a blank determination following the same procedure and using the same amounts of all reagents as described in Steps (a) (b) and (c) above
2 Pyritic Sulfur
a Transfer the sample obtained from the HCl extraction of sulfate sulfur to a 250-ml Erlenmeyer flask and add 50 ml of HNO 3 (1 + 7) Fit a cold-finger condenser into the neck of the flask and either boil for 30 min or let it stand overnight at room temperature Rinse the coldshyfinger condensor with HNO3 (I + 7) filter the contents of the flask through a medium-texture double acid-washed filter paper and wash six times with HNO 3 (1 + 7) coshyllecting the filtrate and washings in a 600-ml beaker Discard the residual coal on the filter paper and retain the filtrate for determination of iron which is a measure of pyritic sulfur in coal
Alternative method for determination of iron by Atomic Absorption Spectroscopy - Dilute the filtrate obtained in (a) above to 200 ml with water Transfer a 50-ml aliquot of this solution to a 200-ml volumetric flask and add 10 ml of lanthanum solution (weight of sample may be varied to eliminate aliquot) Dilute to volume with water Prepare a standard by combining 10 ml of 1000 ppm iron solution and 10 ml of lanthanum solution in a 100 ml volumetric flask and diluting to volume with water Prepare a blank solution by combining 30 ml of HNO3 (1 + 7) and 10 ml of lanthanum solution in a 100 ml volushymetric flask and diluting to volume with water Detershymine absorbences of the blank solution standard and the sample at 372 nm using an air-acetylene flame
NOTE 1 The wavelength of 372 nm is chosen for the determination to provide a less sensitive line and wider linear range for the iron absorbence Linearity exists with concentration in this range for iron absorbence Linearity in this range of iron concentration should be checked for each individual instrumental step and approshypriate dilutions made if necessary Alternatively the 2483 nm line may be used
NOTE 2 If concentration mode is used and the unknown is bracketed a blank is unnecessary
77
3 Calculation
a Sulfate sulfur Calculate the percentage of sulfate sulfur in coal as follows
Sulfate Sulfur = [(A-B) x 13735]W
where =A g of BaSO4 precipitate
B = g of BaSOi in the blank W =g of sample
b Calculate the percentage of pyritic sulfur when the iron determination is made by atomic absorption as follows
Pyritic Sulfur T-TC-A=4- 58
where
A = absorbence of blank B = absorbence of standard C = absorbence of sample W = weight of sample extracted as selected for
sulfate or pyritic determination
If values higher than 5 pyritic sulfur are obtained a new sample solution should be prepared from 20 ml of the filtrate (Section 2 (a)) and 10 ml of lanthanum solushytion diluted to 100 ml and the value obtained with this solution x 25 = percent pyritic sulfur
c Organic Sulfur The percentage of organic sulfur is obtained by subtracting the sum of the percentages of sulfate and pyritic sulfur from the percentage of total sulfur as determined by the Eschka Method
4 Precision
a Repeatability Results of consecutive determinations carried out on the same sample in the same laboratory bythe same operator using the same apparatus should not differ by more than the following
(1) Sulfate Sulfur 002 (2) Pyritic Sulfur (under 2) 005 (3) Pyritic Sulfur (over 2) 010
b Reproducibility The means of results of duplicate determinations carried out by different laboratories on representative samples taken from the same bulk sample should not differ by more than the following
(1) Sulfate Sulfur 004 (2) Pyritic Sulfur (under 2) 030 (3) Pyritic Sulfur (over 2) 040
78
ALTERNATIVE METHOD FOR THE DETERMINATION OF FORMS OF SULFUR IN COAL
i alternative method for the determination of forms of sulfur incoal can be immarized as follows the pyritic sulfur content inthe coal isdetermined the oxidation of pyrite to ferric sulfate and subsequent estimation gravishytrically as barium sulfate rather than by atomic absorption estimation of on as described inthe ASTM method
A REAGENTS
I Bromine Water Reagent grade bromine is added to distilled water until a saturated solution isobtained The bromine saturated water is decanted off to-make reagent (see 2 below)
2 BromineHC1 Solution Add 250 ml of concentrated HCI to 250 ml of water and add 500 ml of saturated bromine water mixing well
3 Barium Chloride Solution 10 (WV) in water
4 HCI Solution for Sulfate Sulfur Determination HClH20 (23 by volume)
5 HN0 Solution for Pyritic Sulfur Determination HN0 3H20 (Iby volume)
B PROCEDURE
1 1 g of coal isweighed into a 250-m beaker 50 ml of HCI (23) are added and the sample is refluxed for 12 - 34 h
2 The solution iscooled filtered through 11 cm No 40 Whatman filter paper and washed with hot distilled water The filshytrate and washings are collected in a 400-ml beaker while the filter paper and residue are placed inthe original beaker
3 The filtrate from (2)above is adjusted to a methyl orange end-point (pH 3-4) if necessary and heated to boiling BaCl 2 solution is slowly added with stirring The solution is allowed to sit for 1 h at this temperature and then kept overnight at room temperature The BaS0 4 precipitate is collected over 11 cm No 42 Whatman filter paper and washed with-hot distilled water until free of the chloride ion The filter paper isthen ignited off and the BaSO4 is ignited at about 925degC for 12 h cooled and weighed
wt of BaSO 4 x 1374 Sulfate Sulfur - _________
wt of sample
79
4 The filter paper and residue from (2) above is placed in the original 250-m beaker and macerated with a glass rod 50 ml of HNO3 are then added and the contents are refluxed for 12 - 34 h
5 The solution is filtered through 15 cm No 40 Whatman filter paper and washed with hot distilled water The filtrate and washings are collected in a 400-ml beaker adjusted to methyl orange end-point if necessary and 10 ml of bromine waterHCl solution are added The solution is boiled until clear and BaCl 2 solution is added The rest of the procedure is the same as described in (3) above
wt of BaSO 4 x 1374 Pyritic Sulfur = _________
wt of sample
NOTE The BaSO4 precipitate is washed with hot dilute HCI (125) if an appreciable discoloration due to iron is noted
III DETERMINATION OF TOTAL SULFUR BY ESCHKA METHOD (ASTM D3177-73)
A SUMMARY OF THE METHOD
The Eschka method involves mixing a coal sample with a mixture of MgO and Na2CO3 (called the Eschka mixture) and igniting the mixture in a bomb calorimeter under 30 atm of oxygen The SO produced by combustion is absorbed by the Eschka mixture and is converted to the sulfate form The residue in the bomb is leached with hot water and the sulfate is precipitated as BaSO4 After the BaSO4 is filtered and dried it is weighed to give the total sulfur in coal
B PROCEDURE
The basic procedure involves mixing intimately about 1 g of coal with 3 g of Eschka mixture (2 g calcined MgO + 1 g anhydrous Na2CO) Approximately 1 g of this mixture is placed in a bomb calorimeter and filled to 30 atm with oxygen The bomb is placed in a water bath the mixture is ignited and the bomb is allowed to cool for- at least 10 min The pressure is then slowly released and the bomb and the residue are thoroughly washed with hot water The residue is digested with hot water for about 1 h after which it is filtered and the insoluble residue is washed at least 5 times with hot water The filtrate is made slightly acidic with dilute HCl heated to boiling and excess BaC1 2 solution is added drop by drop while stirring The heating is continued for another hour
80
after which the precipitate is filtered washed with hot water until the washings are free of the chloride ion dried and weighed The amount of total sulfur in the sample is estimated as follows
wt of BaSO4 Precipitate x 1375 Total Sulfur w fsml wt of sample
81
APPENDIX C
MODIFIED LECO METHOD FOR TOTAL SULFUR AND CHLORINE DETERMINATION IN COAL
PRECEDING PAGE BLANK NOT FILMED
83
MODIFIED LECO METHOD FOR TOTAL SULFUR AND CHLORINE DETERMINATION IN COAL
I SUMMARY OF THE METHOD
A coal sample is burned at 1300 to 1350C in a flowing medium of oxyshygen The sulfur dioxide sulfur trioxide and chlorine formed are absorbed in a hydrogen peroxide solution producing sulfuric and hydroshychloric acids The total acid content is determined by titration with standard sodium hydroxide solution The titrated solution is further treated with mercuric oxycyanide solution to provide correction to the total acid determined as above for the hydrochloric acid content
A REAGENTS
(1) 005 N standard sodium hydroxide solution
(2) 001 N standard sulfuric acid solution or prepared by diluting 01 N standard solution
(3) Mercuric Oxycyanide Solution Dissolve 025 g of mercuric oxycyanide powder in 20 ml of distilled water Prepare one portion per sample-boat and four portions for blanks for each set of samples Discard this solution into the titration waste container if it is not used in 2 or 3 days
NOTE Mercuric oxycyanide is highly poisonous and will explode when touched by flame or by percussion
(4) Hydrogen Peroxide Solution (1) Dilute 100 ml of 30 H202 solution with distilled water to 3 1 Discard this solution if not used for 2 or 3 days
(5) Methyl Purple Indicator Solution
B APPARATUS
Use LECO Model No 534-500 total sulfur analyzer equipped with Model No 571-500 (2-tube 15 kW) resistance furnace and Model No 517200 (manually operated) acid-base titration unit
II PROCEDURE
A START-UP
1 Preheat resistance furnace to a temperature of 1350degC
2 Prepare hydrogen peroxide and mercuric oxycyanide solutions
PRECEDING PAGE BLANK NOr FILIfa 4
3 Place the oxygen baffle in the combustion tube fill the titration vessel with hydrogen peroxide solution and adjust the oxygen flow to 1 1min
4 Fill pre-cleaned back titration buretts with fresh sulfuric acid and sodium hydroxide solutions
5 Make sure that there is sufficient capacity in the titration waste container to receive the days waste
B SAMPLE ANALYSIS SEQUENCE
1 Weigh about 02 g of the coal sample to the nearest 01 mg and spread it in a clay combustion boat
2 Fill the titration vessel half full with 1 hydrogen peroxide solution Add 10 drops of methyl purple indicator solution and adjust the pH with dilute sulfuric acid (001 N) until the green colour just turns gray or reaches the green-gray transition
3 Put the boat containing the coal sample in the combustion tube so that the center of the boat is four inches from the center of the hot zone and replace the oxygen baffle
4 After 1-12 min push the boat into the center of the hot zone removing the oxygen baffle only as long as necessary to pershyform the operation quickly
5 After 7 min of combustion (5-12 min with the boat in the hot zone) titrate with 005 N sodium hydroxide solution until the purple colour fades just short of the end-point
6 After 8 min of combustion (6-12 min with the boat in the hot zone) disconnect the rubber hose from the ceramic combustion tube outlet and rinse the rubber hose and bubbler three times with distilled water into the titration vessel
7 Reconnect the rubber hose to the combustion tube and complete the titration with sodium hydroxide solution
8 Add 20 ml of mercuric oxycyanide solution to the contents of the titration vessel
9 Titrate the liberated hydroxyl ion with dilute (001 N) sulshyfuric acid solution
10 Drain and rinse the titration vessel and remove the boat from the combustion tube
86
C SHUTDOWN
1 For each set of samples run a dilute sulfuric acid (001 N) blank in triplicate on the mercuric oxycyanide solution
2 Reduce the furnace temperature to 816 0C
NOTE For optimum performance of the furnace heating eleshyments the temperature should not go down below 816 0C even during periods it is not being used
D CALCULATION
S = wt sulfur in coal (as determined basis)
A = units of 005 N sodium hydroxide used (LECO burette units)
B = ml of 001 N sulfuric acid used in full determination
C = ml of 001 N sulfuric acid used in blank determination for the mercuric oxycyanide solution
W = weight of sample in grams
Cl = wt of chlorine in coal (as determined basis)
R = 1133 if no standards are run with the sample set otherwise
known sulfur content of the standard coal average sulfur content by titration of three standard samples
S R x 05 A (B-C)- W 3128
Cl =-x 00355W
87
APPENDIX D
SURFACE AREA AND PORE VOLUME DETERMINATION BY LOW TEMPERATURE NITROGEN ADSORPTION
PRECEDING PAGE BLANK NOT FILMED
89 J
SURFACE AREA AND PORE VOLUME DETERMINATION BY LOW TEMPERATURE NITROGEN ADSORPTION
SUMMARY OF THE METHOD
Surface area of a solid is determined by physical adsorption of an adsorbate at its boiling point In general by nitrogen adsorption at liquid nitrogen temperatures the quantity of gas required to form a complete monolayer of gas molecules ismeasured The surface area of the solid is then calculated using the cross-sectional area of the gas molecule Outgassing of the sample before measuring the amount of gas adsorbed isessential to ensure reproducible results While many theories on gas-aasorption have been proposed adsorption measurements are generally interpreted using the BET Theory (Brunauer Emmett and Teller) for multilayer adsorption
I BET DETERMINATION
Three factors must be known in order to determine the specific surface area (area per gram) of a powder sample
(1) Weight of the sample
(2) Relative pressure
(3) Weight of adsorbate adsorbed on the sample surface as a function of relative pressure in the range 005 lt PPo lt 035
The assumptions restrictions and applications of BET multilayer theory are discussed in all modern texts on surface chemistry The reversible adsorption of an adsorbate is given by the BET equation as
1 C -l P CXmC P0XmP l
where
x = weight of adsorbate adsorbed at relative pressure PPo
P = partial pressure of adsorbate
Po = saturated vapour pressure of adsorbate
xm = weight of adsorbate required to completely-cover one monolayer
C = a constant that is a function of the heat of condensation and adsorption of the adsorbate
PAGE BLANK NOT FILMEDPRECEDING
91ORq
The BET equation yields a straight line when is plotted
L[(P-i)]
versus PPo The value of x the weight adsorbed for a monoshylayer can be calculated from the slope and intercept of the BET plot as follows
C-S= Slope
1 I = Intercept Xm C
Solving for xm yields
xm = 1
NOTE The BET plot is usually found to be linear in the range PPO = 005-035 Thus data outside this range should be avoided
The total surface area of the sample St is calculated using the following equation
km N Acs St Ma
Ma
where
xm = weight of adsorbate required for one monolayer
N = Avagadros Number (6023 x 1023)
Acs Cross-sectional area of the adsorbate molecule (as given in the Table 13)
Ma Molecular weight of the adsorbate
The specific surface area of the sample is given by
S = Stweight of sample
92
Table 13 Effective Molecular Areas of Various Adsorbates
Area m2 x 1020Adsorbate
aNitrogen 162
Krypton 195
Argon 142
Xenon 250
Oxygen 140
Ethane 205
Butane 469
aNitrogen is usually the preferred adsorbate since the cross-sectional area
has been exactly determined by several investigators
I SINGLE POINT BET METHOD
SUMMARY OF THE METHOD
This simplified method as an alternative to the multipoint BET Method is based on the fact that the intercept in a BET plot with nitrogen as the adsorbate is generally small when compared to the slope and hence can be ignored If the intercept is assumed to be zero the value of xm tends to be excessively large However this is somewhat compensated as the measured value of the slope tends to increase if the intercept is assumed to be zero
By assuming the intercept to be zero the BET equation is simplified as
1 =1 PP x (PoP-I) xm
or
xm = x (I-PP o)
Thus by measuring the amount of adsorbate adsorbed at a single value of PPo (preferably PPo = 03) the monolayer volume xm can be calculated
93
Substituting the value of xm the specific surface area (m2g) of
the sample with N2 as the adsorbate is calculated as
398 x x S - m wt of sample
IV PORE VOLUME AND PORE RADIUS
SUMMARY OF THE METHOD
Vapours in equilibrium with a liquid contained in fine capillaries or pores will have depressed vapour pressures In fact if the pore is sufficiently small in diameter the vapours will condense at pressures far below the normal According to Kelvin equation nitrogen gas will condense into all pores with radii less than 1500 A at a relative pressure of 099 Thus by measuring the volume of nitrogen adsorbed at a relative pressure of 099 and knowing the surface area the average pore volume and the mean pore diameter can be calculated
PROCEDURE
After thoroughly degassing a sample adsorb a concentration of adsorbate corresponding to PPo = 099 (Any value in the range 096 to 099 will be suitable) When adsorption is complete as indicated by a return to baseline on the recorder remove the liquid nitrogen bath and desorb the adsorbate Calibrate the signal with pure adsorbate Convert the volume of nitrogen adsorbed to the volume of liquid nitrogen held in the pores using the equation
Pa Vads Vliq - RT Vm
where
Pa = ambient pressure
Vads = volume adsorbed per gram of adsorbent
T = ambient temperature
Vm = molar volume of liquid adsorbate (347 cm 3for N2)
94
Assuming that all the pores are uniform and cylindrical the mean pore diameter is given by
= V0d (A)
where Vliq is the volume of all pores in the sample with a specific surface area S
95
JPL Publication 83-44
Fluidized Bed Coal Desulfurization Final Report
Maddury Ravindram
August 1983
PJASA National Aeronautics and Space Administration
Jet Propulsion Laboratory California Institute of Technology Pasadena California
Reference to any specific commercial product process or service by trade name or manufacturer does not necessarily constitute an endorsement by the US Government or Jet Propulsion Laboratory California Institute of Technology
Work was conducted through NASA Task RE-73 NASA RTOP No BR-404-00-73-02-39
ABSTRACT
Preliminary studies on Fluidized Bed Coal Desulfurization were conducted at the Jet Propulsion Laboratory California Institute of Technology under the NRC-NASA Associateships Program and JPL Directors Discretionary Fund for the period December 14 1981 through December 14 1982
Laboratory scale experiments were conducted on two high-volatile bituminous coals in a bench scale batch fluidized bed reactor Chemical pre-treatment and post-treatment of coals were tried as a means of enhancing desulfurizashytion Sequential chlorination and dechlorination-cum-hydrodesulfurization under modest conditions relative to the water-slurry process were found to result in substantial sulfur reductions of about 80 Sulfur forms as well as proximate and ultimate analyses of the processed coals are included -
These studies indicate that a fluidized bed reactor process has considerable potential for being developed into a simple and economic process for coal desulfurization
iii
PREFACE
The work described in this report was performed in the Control and Energy Conversion Division of the Jet Propulsion Laboratory California Institute of Technology Pasadena California 91109 under a JPL Directors Discretionary Fund (DDF) grant during the period December 14 1981 through December 14 1982 while Dr M Ravindram was a NRC NASA Senior Resident Research Associate at JPL
iv
ACKNOWLEDGMENTS
The author is indebted to Dr John J Kalvinskas for his constant help and unceasing efforts to make the formers stay at the Jet Propulsion Laboratory enjoyable and professionally meaningful
The author is grateful to the National Research Council and the National Aeronautics and Space Administration for awarding a Senior Resident Research Associateship under the NRC-NASA Associateships Program and to the Indian Institute of Science for awarding the necessary leave
The author is also thankful to the Jet Propulsion-Laboratory for providing financial assistance (DDF grant) and physical facilities to carry out this work and to the California Institute of Technology for providing graduate student assistance
Finally it is a pleasure to acknowledge the spontaneous assistance extended by the administrative secretarial and other staff in the Thermochemical Research and Systems Section
V
FOREWORD
This report is based on the experimental results of Fluidized Bed Coal Desulfurization studies conducted at the Jet Propulsion Laboratory under a DDF grant during the period December 14 1981 through December 14 1982 The study covers chlorination dechlorination and hydrodesulfurization of two high volatile bituminous coals in a laboratory-scale batch fluidized bed reactor A follow-on program is planned that addresses itself to parametric estimation and detailed kinetics studies on coal desulfurization in a fluidized bed reactor
vi
CONTENTS
Page
I INTRODUCTION 1
II SUMMARY 2
III CONCLUSIONS AND RECOMMENDATIONS 3
IV COAL DESULFURIZATION 4
V SULFUR IN COAL 6
VI CHEMICAL COAL CLEANING METHODS 8
A COAL DESULFURIZATION BY CHLORINE 9
B COAL DESULFURIZATION IN THE SOLID PHASE 11
VII LABORATORY SCALE COAL DESULFURIZATION EXPERIMENTS IN A BATCH-FLUIDIZED BED REACTOR 13
A SELECTION OF COALS 13
B EQUIPMENT OPERATING PROCEDURES AND METHODS OF ANALYSES 13
1 Equipment 13
2 Fluidization Experiments 18
3 Desulfurization Experiments 21
4 Methods of Analysis 24
a Analysis of Sulfur Forms in Coal 24
b Proximate and Ultimate Analyses of Coal 24
c Estimation of Total Sulfur in Coal 24
d Surface Area and Pore Volume of Coal 26
e Analysis of Scrubber Solution 26
f Coal Characterization Using Scanning Electron
Microscopy 28
VIII RESULTS AND CONCLUSIONS 43
A PSOC 282 COAL 43
1 Chlorination 43
vii
Page
2 Dechlorination 50
3 Hydrodesulfurization 50
B PSOC 276 COAL 52
IX SCANNING ELECTRON MICROSCOPY (SEM) EXAMINATION OF COAL SURFACE 53
A SEM PHOTOGRAPHS 53
B EDAX SPECTRA 54
C CONCLUSIONS 54
X RESULTS OF CSMRI ANALYSES 55
A TOTAL SULFUR AND SULFUR FORMS 55
1 PSOC 282 Coal 55
2 PSOC 276 Coal 55
3 Comparison of CSMRI and LECO Analyses 58
B PROXIMATE AND ULTIMATE ANALYSES 58
1 PSOC 282 Coal 58
2 PSOC 276 Coal 61
C CONCLUSIONS 61
XI REFERENCES 63
APPENDICES
A Operating Procedure for the Laboratory Scale Batch Fluidized Bed Reactor System for Coal Desulfurization 65
B Analytical Procedure to Determine Sulfur Forms in Coal (ASTM Method) 73
C Modified LECO Method for Total Sulfur and Chlorine Determination in Coal 83
D Surface Area and Pore Volume Determination by Low Temperature Nitrogen Adsorption 89
viii
Figure Page
1 Batch Fluidized Bed ReactorSystem for Coal Desulfurization 16
2 Fluidized Bed Reactor 17
3 Fluidization Characteristics of Coal 19
4 Fluidization Characteristics of Coal 20
5 Process Flow Diagram for Laboratory Scale Fluidized Bed Coal Desulfurization 23
6 Typical EDAX Spectrum of Coal 30
7 SEM Photograph of PSOC 282 Raw Coal 31
8 SEM Photograph of PSOC 282 Washed with IM Na2CO3 Solution 32
9 SEM Photograph of PSOC 282 Treated Coal (Run No 0032) 33
10 SEM Photograph of PSOC 282 Treated Coal (Run No 0026) 34
11 SEM Photograph of PSOC 282 Treated Coal (Run No 0027) 35
12 SEM Photograph of PSOC 282 Treated Coal (Run No 0039) 36
13 SEM Photograph of PSOC 276 Raw Coal 37
14 SEM Photograph of PSOC 276 Treated Coal (Run No 0046) 38
15 EDAX Spectrum of Coal 39
16 EDAX Spectrum of Coal 40
17 EDAX Spectrum of Coal 41
18 EDAX Spectrum of Coal 42
19 Experimental Results on Fluidized Bed Coal Desulfurization 48
20 Experimental Results on Fluidized Bed Coal Desulfurization 49
ix
Table Page
1 Characteristics of Raw Coals Employed in the Studies 14
2 Proximate and Ultimate Analyses of Raw Coals Employed in the Studies 15
3 Calculated and Observed Values of Minimum Fluidization Velocity (Umf) 22
4 Actual Flow Rates Employed in the Experiments 22
5 LECO Acid-Base Analysis vs Eschka Analysis for Total Sulfur 25
6 Specific Surface Area and Pore Volume of Raw Coals Employed in the Study 27
7 Experimental Conditions and Results 44
8 Experimental Conditions and Results 47
9 Total Sulfur and Forms of Sulfur in Selected Product Coals (PSOC 282) 56
10 Total Sulfur and Forms of Sulfur in Selected Product Coals (PSOC 276) 57
11 Comparison of Total Sulfur Estimation by Eschka
and LECO Methods 59
12- Proximate and Ultimate Analyses of Selected Product Coals 60
13 Effective Molecular Areas of Various Adsorbates 93
x
I INTRODUCTION
The Jet Propulsion Laboratory (JPL) initiated development of the Chlorinolysis Process for Coal Desulfurization in 1976 under the JPL Directors Discreshytionary Fund The preliminary results of coal desulfurization by chlorinshyolysis attracted Bureau of Mines funding for a four-month laboratory screening study of 12 bituminous subbituminous and lignite coals obtained from the Eastern Midwestern and Western regions of the United States (Ref 1) The follow-on work in Phases II and III (Ref 2 and 3) was funded by the United States Department of Energy (DoE) and included substantial modification and development of the process to provide process improvements and reduced process costs
Following Phase II and Phase III a subsequent DoE-funded study titled Coal Desulfurization by Chlorinolysis-Production and Combustion Test Evaluation of Product Coals (Ref 4) was conducted to determine the ignition and burning characteristics of these coals at the Pennsylvania State plane flame furnace These combustion test evaluations represent a first to any of the chemical coal cleaning processes
The current Fluidized Bed Coal Desulfurization Program was conducted under the JPL Directors Discretionary Fund Two coals PSOC 276 (Pittsburgh coal from Harrison County Ohio) and PSOC 282 (Illinois No 6 coal from Jefferson County Illinois) were chosen for the study The study included several chlorination dechlorination and hydrodesulfurization tests in a laboratory scale fluidized bed reactor Some of the product coals as well as raw and chlorinated coals were subjected to washing treatments This report includes the results of the laboratory fluidized bed reactor tests the influence of process parameters and product evaluation by LECO analyses for total sulfur in the laboratory and more complete analyses carried out by the Colorado School of Mines Research Institute (CSMRI) which were conducted from December 14 1981 through December 14 1982
II SUMMARY
This is the final report for the Fluidized Bed Coal Desulfurization studies conducted at the Jet Propulsion Laboratory California Institute of Technology at Pasadena California under a JPL Directors Discretionary Fund (DDF) grant for the period December 14 1981 through December 14 1982
The scope of the work consisted of several phases (1) design and fabrication of a laboratory-scale fluidized bed reactor system for coal desulfurization (2) laboratory-scale tests consisting of sequential chlorination dechlorinashytion andor hydrodesulfdrization on two high-volatile bituminous coals and (3) assessment of the influence of pre-treatments to raw coals and chlorinated coals and post-treatment of processed coals on the extent of sulfur removed
Laboratory-scale screening tests with PSOC 276 and PSOC 282 coals were used to investigate (1) the feasibility of coal desulfurization in the solid state (2) the effect of reaction time and temperature on chlorination (3) the effect of employing a mixture of nitrogen and chlorine during chlorination (4)the effect of reaction time and temperature during hydrodesulfurization and dechlorination (5)the influence of an alkaline wash to raw coal chlorinated coals and hydrodesulfurized coals and (6) the specific advantages of coal desulfurization in a gas fluidized bed reactor as compared to the chlorinolysis process employing coal-water slurries
Results of the studies indicate that (1) the two coals studied could be desulfurized to approximately the same levels achieved in the chlorinolysis process by reacting dry coal in a sequential manner with chlorine nitrogen andor hydrogen Up to 80 sulfur reductions could be achieved in conshysiderably reduced times of reaction as compared to the chlorinolysis process (2)Prolonged chlorination or chlorination at higher temperatures did not result in any enhanced desulfurization over chlorination for 15 min at 100degC In fact chlorination for even 5 min resulted in substantial sulfur reducshytion The exothermicity of coal-chlorine reaction made it possible to mainshytain the reactor at about 100degC without any external source of heating (3) Employing a mixture of nitrogen and chlorine in the ratio of 41 during chlorination results in significant sulfur removal in the process Conshysequently considerably lower chlorine concentrations could be employed(4) Hydrodesulfurization of chlorinated coals at 700C for 30 min was more efficient in removing the sulfur from coal as compared to simple dechlorinashytion employing nitrogen Hydrodesulfurization for as short a period as 10 min results in significant sulfur reductions (5)Pretreatment of raw and chlorinated coals as well as processed coals with I M Na2CO3 solution for 30 min substantially reduces sulfur emissions in combustion as indicated by LECO analysis for total sulfur (6) Coal desulfurization in the solid state in a gas fluidized bed reactor has a tremendous potential over the chlorinshyolysis process employing coal-water slurries such as reduced reaction times lower chlorine requirement lower cost of processing and a simple process with fewer processing steps
2
III CONCLUSIONS AND RECOMMENDATIONS
1 Preliminary experimental results on coal desulfurization in a fluidized bed reactor have demonstrated the potential of the process in providing a simple and cost effective method of converting high sulfur coals to environmentally acceptable solid fuels for the power plants and utilityboilers
2 The results indicate that coal desulfurization achieved in the fluidized bed process is comparable to that achieved in a coal-water slurry system
3 Chlorination times as low as five minutes were found to result in desulshyfurization levels of about 60 This represents a substantial reduction in the chlorination time as compared to the slurry process and hence the reactor cost
4 Because dry coal is used as the feed to the fluidized bed reactor the coal sulfur leaves as gaseous species from the chlorination reactor which is likely to result in reduced chlorine requirement in the process This was also evident from the fact that a mixture of nitrogen and chlorine in the proportion of 41 during chlorination did not signifishycantly reduce the extent of coal desulfurization Because chlorine cost represents a substantial portion of the overall process cost the reduced chlorine requirement will have a significant effect on the process economics
5 Dechlorination and hydrodesulfurization of the chlorinated coal has been demonstrated in 10 minutes in the fluidized bed reactor which represents a substantial reduction over the time required in the slurry process
6 A fluidized bed reactor provides good mixing of the coal particles and contact between the gas-solid phase thereby facilitating better process control and isothermal operation
7 Thermal efficiency of the overall process will be high because all the reaction steps are brought about in the solid phase itself
8 The reduction in processing steps and improved process control should result in enhanced product yields and lower costs
9 While the feasibility of bringing about coal desulfurization in a fluidized bed has been clearly demonstrated extensive development is required to establish the optimum range of operating conditions
10 Further fundamental work is required on fluidized bed coal desulfurizashytion to understand the basic chemistry and kinetics of the reactions involved in the process
3
IV COAL DESULFURIZATION
The ever increasing demand for energy uncertainties associated with resources of petroleum and natural gas inherent problems with nuclear power plants and current unfavourable economics of solar energy and biomass utilishyzation have been primary contributory factors for the renaissance of coal as a sustainable energy resource for the next decade and beyond However utilization of coal for power generation and process heat isbeset with environmental problems The major problem with coal combustion units is that associated with sulfur dioxide emissions although emissions of nitrogen oxides particulates and trace elements also contribute to environmental degradation Inthe last decade several alternatives for controlling sulfur dioxide emissions from coal combustion units have been proposed These can be broadly classified as
(1) Use of low sulfur content coals
(2) Pre-combustion physical and chemical coal cleaning
(3) Retention of sulfur in the ash during combustion
(4) Post-combustion flue-gas cleanup
Reserves of coal that contain sufficiently low concentrations of sulfur to enable them to meet the present emission standard of 12 lb S02106 Btu (which corresponds to 07 wt sulfur in coal with a heating value of 12000 Btulb) are both limited and restricted to specific geographical locashytions Infact only 123 of US coal reserves are within this compliancelevel The major recoverable fractions of Eastern and Midwestern US coals contain more than 2 wt sulfur
Precombustion physical coal cleaning to remove mineral matter is widelypracticed inthe coal industry By the conventional float-sink methods as much as 60 of the pyritic sulfur in coal is also removed However a significant portion of coal is also rejected along with the high density material of high sulfur content In addition physical methods are not effective in removing organic sulfur content of coal which incertain cases may constitute 50 of the sulfur in coal Thus to decrease the sulfur conshytent in coal to acceptable levels it is necessary to remove both pyritic and organic sulfur fractions by chemical methods During the last decade several chemical coal cleaning methods have been proposed However a majority of these methods are applicable for the removal of only pyritic sulfur and no chemical coal desulfurization process uniformly applicable for the removal of both inorganic and organic sulfur fractions in coal is as yet available commercially
Retention of sulfur during combustion employing dolomite limestone etc in fluidized bed combustion units is studied widely Chemical modification of coal and incorporation of alkaline earth metals into the coal matrix as a means of retaining sulfur in the ash have also been proposed
4
Among the post-combustion gas-cleaning methods the most widely adopted one isflue gas desulfurization (FGD) employing wet scrubbers However scrubbers generate large quantities of sludge which must be disposed of -economically Also inmany instances scrubbers are unreliable requiring excessive maintenance Consequently the cost of a FGD facility represents a substantial proportion of the equipment cost of a coal-fired power plant and this proportion was found to increase as the size of the plant decreases thereby making FGD prohibitively expensive for small utility boilers Dry scrubbers overcome some of the problems associated with wet scrubbers
The economical production of coals that comply with environmental regulations for SO2 emissions remains the main incentive for the development of chemical coal cleaning processes However many of the chemical treatment methods remove only up to 40 of the organic sulfur which limits their application In addition while the New Source Performance Standards (NSPS) of 12 lb S02106 Btu could be met by most of the chemical coal cleaning methods a majority of these methods may not be effective inmeeting the revised NSPS of 1979 which stipulates 90 reduction in potential S02 emissions However recent research effort in chemical coal cleaning has resulted inthe development of processes capable of removing sulfur levels exceeding 90 wt DOE is currently evaluating three processes as prime candidates for coal desulfurization JPLs Low-Temperature Chlorinolysis process TRWs Gravimelt process and General Electrics Microwave process However commercialization of chemical coal cleaning technology may be delayed by economic factors
JPL initiated work on coal beneficiation and coal desulfurization a few years ago An outgrowth of this activity isthe JPL Low-Temperature Chlorinolysis Process for coal desulfurization The initial laboratory studies indicated that the process was capable of removing up to 70 total sulfur from an Illinois No 6 bituminous coal Since then the process has been considerably modified A recent process modification involves aqueous phase chlorination followed by solid phase dechlorination andor hydrodesulfurization which is capable of removing up to 90 of the total amount of sulfur
5
V SULFUR IN COAL
Sulfur in coal exists primarily in two forms inorganic and organic in
almost equal proportions The average sulfur content in coals varies from 05 to 7 depending on the source and location of the deposit
The major constituent of inorganic sulfur is iron sulfide FeS 2 commonly known as pyrite although it may occur in different crystalline states such as pyrite (cubic) and marcasite (orthorhombic) The other forms of inorganic sulfur in coal are sulfate sulfur and elemental sulfur which are normally present in very low concentrations Sulfate sulfur occurs mainly as gypsum and iron sulfate the latter resulting from the oxidation of pyrites during storage and exposure The low concentration of sulfate sulfur together with its solubility in water makes it of little consequence during coal cleaning The concentration of elemental sulfur in coal is also very small Pyrite in general is believed to be present as a discrete phase in coal which incishydentally facilitates its removal by float-sink methods However with very fine particles even complete pyritic sulfur removal is not possible
Organic sulfur in coal is thought to be uniformly distributed and firmly bound to the coal matrix Limited information exists on the specific organic sulfur compounds and their distribution in various coals It is generally accepted that a major proportion of organic sulfur in coal is made up of the following functional groups
(1) Aliphatic or aromatic R-SH Thiols (Mercaptans Thiophenols) Ar-SH
(2) Aliphatic or aromatic sulfides R-S-R and mixtures of these (Thioethers) Ar-S-Ar
R-S-Ar
(3) Aliphatic or aromatic disulfides R-S-S-R and mixtures of these (Bisthioethers) Ar-S-S-Ar
R-S-S-Ar
(4) Heterocyclic compounds of the thiophenic type (Dibenzothiophene) S
Analysis of coals for organic sulfur fractions has shown that lignite and high-volatile bituminous coals contain relatively higher concentration of thiols and also that higher ranked coals have a higher proportion of thiophenic sulfur More extensive classification and characterization of coals particularly for organic sulfur components and their quantitative distribution are needed In general there is a lack of understanding of the chemical reactions involving organic sulfur in the different chemical coal cleaning processes which is partly due to the nonavailability of anashylytical techniques for the direct determination of organic sulfur Recent studies on desulfurization of model organic sulfur compounds of the type
6
believed to be present in coal by some of the proposed processes have shown that many of these compounds are unreactive and that more fundamental research work is needed to understand the nature of the precise organicsulfur species in coal and their reactivities under different desulfurization conditions
VI CHEMICAL COAL CLEANING METHODS
Among the various methods that have been proposed for controlling the S02 emissions from coal fired power plants precombustion coal desulfurization offers several potential advantages over flue gas desulfurization In the past decade several processes have been proposed for extracting pyritic and organic sulfur from coal There are also as many processes that are modifishycations of a process or a combination of different processes However most of these could be classified into a few groups based on the chemistry of the reactions involved in the process
(1) oxidation reactions
(2) displacement reactions
(3) reduction reactions
A further classification is also possible depending on whether the reactions are brought about in the liquid phase or in the solid phase However very few studies of the latter type are reported In general in the liquid phase methods the sulfur in coal is transformed into a soluble form
The exposure of coal to air results in a slow oxidation of pyrite to the sulfate which is water soluble A majority of the processes reported for the removal of pyritic sulfur in coal are aimed at enhancing this natural process of oxidation Oxidatants ranging from metal ions (Fe3+) to strong acids (HN0 3) oxygen air S02 C12 H202 NO2 etc have been employed for this purpose The PTEC oxydesulfurization process AMES wet oxidation process LEDGEMONT oxygen leaching process ARCO-promoted oxydesulshyfurization process TRW Meyers desulfurization process and JPL chlorinolysis process among others all involve oxidizing the sulfur fraction in coal to sulfuric acid or to a soluble sulfate There is a wide variability in processing conditions and in the removal efficiencies among the various processes The JPL Low Temperature Chlorinolysis process is however one of the few processes capable of removing both inorganic and organic sulfur from coal
Processes based on the displacement of sulfur such as the Battelle Hydroshythermal process TRW Gravimelt process and the General Electric Microwave process involve heating coal with sodium hydroxide to remove the sulfur in the form of sulfides and polysulfides The TRW Gravimelt process in addition to removing sulfur also removes substantial quantities of mineral matter from coal However one major disadvantage of using caustic is that the excess sodium retained in coal may cause severe ash slagging problems in the boiler
Among the processes based on reduction mention may be made of the IGT flash desulfutization process for producing chars The process involves prelimshyinary air oxidation of coal to facilitate sulfur removal in the subsequent hydrodesulfurization step A sulfur acceptor such as calcium oxide or iron oxide was found to limit the hydrogen consumption during the latter step
8
Many of the chemical coal cleaning processes described above were found to be effective for the almost total removal of pyritic sulfur and partial removal of organic sulfur On the basis of total sulfur removals claimed most of these processes are capable of desulfurizing a large number of coals to meet the 1971 US NSPS for S02 emissions (12 lb10 6 Btu) while only a few may be able to satisfy the revised 1979 standard which stipulates 90 reducshytion inpotential S02 emissions to the atmosphere irrespective of the initial sulfur content of coal There also exists some uncertainty regardingthe extent of organic sulfur removal achieved inthese processes primarilybecause of the lack of precise analytical methods for the direct detershymination of organic sulfur in coal In practice the actual reduction in organic sulfur may be much lower than claimed Consequently there is a need for a better understanding of the sulfur forms in coal and a more realistic appraisal of the cost and efficiency of the chemical coal cleaning processes
A COAL DESULFURIZATION BY CHLORINE
Chlorination of coal was initially studied for producing non-cakingcoals and chlorohydrocarbons Coal desulfurization by chlorination was first reported in 1964 when coal was chlorinated in an aqueous media at 25degC Only poor sulfur removal was achieved Subsequent studies on desulfurization by gas phase chlorination of coal at high temperaturesand elevated pressures resulted in better sulfur removals However the sulfur reductions were accompanied by higher coal losses and highchlorine retention in product coals
Development of the chlorinolysis process for coal desulfurization beganin 1976 at JPL There are two basic variations of the process althoughboth are based on the oxidation of sulfur by chlorine The original version employed methyl chloroform as the reaction medium duringchlorination which was later substituted by water A more recent version of the process consists of
(1) Chlorination of an aqueous coal slurry (watercoal 21) at 600C for 45 min (SCl 2 18 by wt)
(2) Filtration - wash of chlorinated coal (coalwater 12)
(3) Dechlorination of dry coal with N2 at 400C for 1 h
(4) Advanced dechlorination with H2 at 650 0C for 1 h1
The chemistry of the process is somewhat complex but based on the sulfur bond scission inorganic compounds may be illustrated as follows
1This step enhances the total sulfur removal to the level of 90
9
ORIGINAL PAGE W OF POOR QUALITY
The sulfur-chlorine bond and its chemical and physical properties are affected in a significant manner by unshared electron pairs and vacant d-orbitals on each atom Both sulfur and chlorine have unshared elecshytron pairs available for donation to another molecule In addition because sulfur and chlorine are second-row elements they have empty d-orbitals that may be used to accept unshared electron pairs from other molecules Molecules containing S-Cl bond may thus act as electrophiles or nucleophiles depending on the circumstances
The sulfur-chlorine reactions during chlorinolysis are summarized as follows
1 Pyritic Sulfur
FeS 2 + 2C12 - FeC12 + S2 C12
2 FeS2 + 7 T 2 FeC13 + 4 SC12 2 FeS2 + 10 Si12 2 FeCl3+ 7 S2CI2 S2CI2 + 8 H20 + 5 Cl2 2 H2S04 + 12 HCI FeS 2 + 7 C12 + 8 H20 FeCI2 + 2H2SO4 + 12 HCI
The overall reaction isassumed to proceed as
2 FeS 2 + 15 Cl2 + 16 H20 - 2 FeCl3 + 4H2S04 + 24 HCI
2 Organic Sulfur
C-S Bond Clevage
H+
-R - S - RI + Cl+ + Clr RSCI + RIcI
where R and R1 represent hydrocarbon groups
S-S Bond (electrophilic clevage)
RS - SRI + C1+ + Cl- H RSCI + RIsCI
Oxidation of sulfenyl chloride to sulfonate or sulfate is assumed to proceed as
C12 H20 H20
RSCI RS02CI - RS03H + HCI
RSCI + 2 Cl2 + 3 H20 - RS0 3 H + 5 HCI
or
C12 H20 RSC1 RS0 2CI - SD4 + RCI
C12 H20
RSCI + 3 Cl2 + 4 H20 - RCI + H2SO4 + 6 HCI
10
All these reactions are exothermic in nature and proceed favorshyably atlow temperatures In the presence of water and excess chlorine sulfur dichloride is readily converted to sulfuric and hydrochloric acids
B COAL DESULFURIZATION IN THE SOLID PHASE
Coal desulfurization by treatment with different gases at elevated temperatures was reported by several investigators (Ref 5 through 8) Early interest in such treatments was mainly for the production of metallurgical coke Sulfur removal during carbonization was studied in both inert and reactive environments such as oxygen hydrogen steam etc Iron pyrites decomposes when heated releasing half of its sulfur while one-fourth to one-third of the organic sulfur is converted to hydrogen sulfide (Ref 9 and 10)
Snow (Ref 11) treated coal in various reactive gases and found hydrogen to be most effective Pyrite reacts with hydrogen in two stages The first stage of conversion of pyrite to ferrous sulfide begins at about 400degC while the subsequent reaction leading to the formation of elemenshytal iron takes place at much higher temperatures However hydroshydesulfurization of coal is strongly inhibited by the presence of hydroshygen sulfide in the gas-phase (Ref 12 through 14)
Treating coal with hydrogen at high temperatures (gt900C) is very effective in the removal of organic sulfur but the accompanying coal losses are substantial
Several investigators have reported desulfurization of coal with oxygen and oxygen carriers and found that mainly pyritic sulfur was removed under the oxydizing atmosphere One exception is the KVB or Guth process (Ref 15) where the oxidation of sulfur compounds is brought about in the solid phase by using NO2 followed by a caustic wash to remove up to 40 of organic sulfur NO2 is reported to selectively oxidize part of the pyritic and organic sulfur in coal Block et al (Ref 16) reported that 87 pyritic sulfur was removed in a fluidized bed reactor at 6000C Sinha and Walker (Ref 17) reported that 90 of pyritic sulfur was removed in 10 min at 4500C while Jacobs and Mirkus (Ref 18) in their studies on fluidized beds using steam-air mixtures found 60 to 70 sulfur reductions in 20 to 60 min at 510C Huang and Pulsifer (Ref 19) found that the mechanism and extent of sulfur removal depends essentially on temperature and gaseous environment At temperatures below 6000C desulfurization is achieved mainly by pyrolysis and release of volatile matter while above 6000C hydrogen directly reacts with organic sulfur
Thus in principle pyritic sulfur can be removed by oxidation and organic sulfur by reduction However neither of these methods is used to any great extent because of significant losses in coal heating value
11
The earliest application of chlorine to remove sulfur from pyrites in the solid phase dates back to 1939 (Ref 20) The authors reported an 85 removal of sulfur by treating FeS 2 with Cl2 at 300 to 400C Another investigation claims that chlorine removes 95 of the sulfur from pyrites at 600 (Ref 21)
The present investigation was undertaken to study the feasibility of bringing about the desulfurization reactions in the solid phase by reacting gaseous chlorine with dry coal Because the sulfur-chlorine reactions are exothermic a fluidized bed reactor was chosen for the study as it is known to facilitate good solids mixing and isothermal operation The main objectives of this investigation are
(1) To study the effect of sequential chlorination dechlorination andor hydrodesulfurization of selected coals on total sulfur reductions in a fluidized bed reactor
(2) To assess the influence of a wash of raw chlorinated and desulshyfurized coals on the sulfur remaining in the product coals
12
VII LABORATORY SCALE COAL DESULFURIZATION EXPERIMENTS IN A BATCH-FLUIDIZED BED REACTOR
A SELECTION OF COALS
Two bituminous high volatile coals were selected for the present study PSOC 276 (Ohio No 8) and PSOC 282 (Illinois No 6) These were extensively studied in the laboratory-scale and bench-scale Chlorinolshyysis experiments
Five tons each of these coals obtained from the mine site as part of the earlier progtam were ground and classified by the Corosil Corporation Corona California For the laboratory scale experiments the ground coals were sieved to the required size using a Sweco Vibro-Energy separator equipped with 60 100 and 200 mesh stainless steel screens
Results of sulfur forms and proximate and ultimate analyses by the ASTM approved methods at the Colorado School of Mines Research Institute are presented in Tables 1 and 2
B EQUIPMENT OPERATING PROCEDURES AND METHODS OF ANALYSES
1 Equipment
A schematic of the experimental setup employed in the present study is shown in Figure 1 Figure 2 presents details of the fluidized bed reactor The experimental set-up essentially consists of a preheater reactor proper reflux condenser and a scrubber along with appropriate devices for measuring gas flows and for controlling temperature
The preheater which is made of 12 in ID x 30 in stainless steel tube is wound externally with a heating tape One end of the preheater is connected to the reactor while the other end is connected to the gas inlet line Temperature in the preheater is maintained at 501C by a transformer and the temperature is measured by a chromel-alumel thermocouple connected to a Hoskins Pyrometer
The reactor is made of 1 in ID x 24 in quartz tube A porous silica plate fused to the bottom end of the reactor serves as a gasdistributor and support for the solids in the reactor One end of the reactor is connected to the preheater while the other end is connected to solids disengaging section The reactor is provided with a thermowell and tappings for pressure drop measurement The bottom half of the reactor is enclosed in close fitting Thermcraft RH 212 Electric Heaters (264 W 575 V) Temperature in the reactor was controlled by connecting the heaters and a PtPt+13 Rh thermocouple to an OMEGA Model 49 ON-OFF Proportioning Temperature
13
Table 1 Characteristics of Raw-Coals Employed in the Studies
Forms of Sulfur wt ab Total PSOC No
Coal Type Seam County State
Size Tyler Mesh Organic Pyritic Sulfate Total
Sulfur wtbc
High Volatile bituminous Pittsshy
276 burgh coal from -60 + 100 117 263 006 387 375Harrison County Ohio George Town No 24 Mine
High volatile bituminous Illinois
No 6 coal from 158282 100 075 043 036 154Jefferson County -60 + Illinois No 6 Mine (Washed)d
a Determined by the Colorado School of Mines Research Institute (CSMRI)
b Dry basis
c LECO analysis
d Unwashed coal had 22 wt total sulfur
Controller This was later replaced by a Wheel Co Model 401 ON-OFF Temperature Controller Temperature in the reactor was also recorded separately by means of an iron-constantan thermocouple connected to a Honeywell recorder
The reactor outlet is connected to a reflux condenser for collecting any volatile components that may be present in the outshylet gases
The outlet gases from the reactor were scrubbed with 1 M Na2-CO3 solution before they were finally vented into the atmosphere
The reactor system after assembly was checked for leaks flow-meter calibration and satisfactory performance of heaters and tempershyature controller
14
Table 2 Proximate and Ultimate Analyses of Raw Coals Employed in the Studies
Proximate Analysis wta Ultimate Analysis wta
Coal Volatile Matter
Fixed Carbon Ash Moisture b
HeatingValuec BtuIb C H S N cld 0 Ash
PSOC 276 372 513 115 189 12755 716 567 391 128 016 587 116
PSOC 282 338 595 670 310 13092 748 482 160 169 047 992 670
aDry basis
bAs determined basis
CHigh heating value dry basis dLECO Analysis gave 0178 and 0478 for PSOC 276 and PSOC 282 Coals respectively
00
Zn
R
V F
SJ
BS
REGULATOR
MANUAL VALVE FLOW METER
STANDARD GLASS JOINT
BALL AND SOCKET JOINT
V V
- - -----shy
12
SJ
10
BS
13
F F 11
v 41 8
1 2 30z
LEGENDM 1 CHLORINE CYLINDER 2 NITROGEN CYLINDER 3 HYDROGEN CYLINDER 4 PREHEATER (12 ID x 30 SS TUBE) 5 HEATINGTAPE 6 TEMPERATURE INDICATOR7i TEMPERATURE INDICATOR CUM
ON-OFF CONTROLLER 8 SWEGE-LOCK JOINT
9 10 11
12 13 14 15 16
VENT
14
ELECTRICAL HEATERS REACTOR r wa POROUS SILICA DISTRIBUTOR THERMOCOUPLE MANOMETERREFLUX CONDENSER RECEIVING FLASK SCRUBBER
Figure 1 Batch Fluidized Bed Reactor System for Coal Desulfuization
00
ORIGINAL PAGE riOF POOR QUALITY
THERMOCOUPLE ENTRY POINT
6 MANOMETER6 TAPPING
IQUARTZ TUBE
18
SUPPORT FOR HEATER
MEDIUM POROSITY SINTERED SILICA DISTRIBUTOR
4
MANOMETER TAPPING
4I12
Figure 2 Fluidized Bed Reactor
17
2 Fluidization Experiments
Initially fluidization characteristics of coal were assessed For this purpose graded sizes (-60 + 100 and -100 + 200 Mesh) of PSOC 276 and PSOC 282 coals were employed in the fluidization experishyments 50 g of dry coal of a known particle size were taken in the reactor and the flow rate of nitrogen was gradually increased The onset of fluidization and solids mixing in the reactor were visually observed Pressure drop and bed expansion at each flow rate were noted A constant pressure drop and vigorous mixing of solids in the bed were taken as indicative of fluidization The
pressure drop was also noted while the flow rate was decreased The experiments were repeated using hydrogen as the fluidizing medium Representative plots of pressure drop versus volumetric flow rate are presented in Figures 3 and 4 The minimum fluidizashytion velocity was also calculated using the following equation applicable for small particles
dp2 (Ps - Pg)9 Umf = 165011
where
Umf = minimum fluidization velocity cms
dp = mean particle diameter cm
Ps = solids density gcm 3
P9 = fluid density gcm 3
g = local acceleration due to gravity cms2
P = fluid viscosity gcm s
From the minimum fluidization velocity the corresponding volumetric
flow rate was calculated as follows
Q = Umf x A
where
Q = volumetric flow rate cm3s
A = cross sectional-area of the bed cm2
18
I I I I I I
30 shy
25-
C-c20- 0 LU
LUj COAL PSOC 276 (OHIO NO 8) tI015 -60 +100 TYLER MESH QZ --FLUIDIZING MEDIUM NITROGEN
ROTAMETER UC-4334 SS FLOAT
10 LEGEND
0-- PRESSURE DROP WHILE INCREASING N2 FLOW
05 - 6---A PRESSURE DROP WHILE DECREASING N FLOW
0-O BED EXPANSION
0 I 08 I I 08 05
0 010 028 045 065 08 095 FLOW RATE LITRES PER MINUTE
Figure 3 Fluidization Characteristics of Coal
30
25
20OZ0
15 R
10
05
0
O
o
30 - 30
25 25
00
0
20
LU -
u nZ
1O
mg
15lt1
COAL PSOC276 (OHIO NO8)-100 +200 TYLER MESH
FLUIDIZING MEDIUM NITROGEN ROTAMETER UC-4334 SS FLOAT
LEGEND -
20
z
z
Z shy
tu
10
0
0-
--- A
O----O
PRESSURE DROP WHILE INCREASING N2 FLOW
PRESSURE DROP WHILE DECREASING N2 FLOW
BED EXPANSION
0I 0 010
I I 028 045
FLOW RATE LITRES PER MINUTE
I 065 08
0
Figure 4 Fluidization Characteristics of Coal
The minimum fluidization velocities calculated using the above equation and those computed frompressure drop data are presentedin Table 3 For the size fractions employed there was no signifishycant carryover of coal particles in the exit stream The actual flow rates employed in the desulfurization experiments are presented in Table 4
3 Desulfurization Experiments
The desulfurization experiments consisted of successive chlorinashytion dechlorination andor hydrodesulfurization of selected coals for varying time intervals and temperatures inthe fluidized state The effect of employing a mixture of nitrogen and chlorine (41) and pre- and post-treatments to coals were also assessed A process flow diagram of the treatments is presented in Figure 5
The experimental procedure is as follows 50 g of coal of the required particle size are loaded into the reactor and fluidized with nitrogen After ensuring that the entire system is funcshytioning properly and the preheater has reached the required temperature the chlorination experiment is started by substitutingchlorine as the fluidizing medium at the predetermined flow rate During the initial stages of chlorination the temperature of the bed rose sharply However the vigorous mixing of the solids in the reactor prevented local hot spots With proper insulation the reactor temperature could be maintained uniformly at about 1000C without supplying any additional heating During preliminary runs using coal as received (without drying) itwas observed that the bed tends to consolidate as a consequence of the exothermic sulfurshychlorine reaction resulting in defluidization and pressure buildupin the reactor This problem was overcome by employing dried coal (dried at 100 overnight) in all the subsequent experiments The chlorination experiments lasted from 5 to 15 min Unreacted chlorine and the products of chlorine-sulfur reactions are absorbed in I M Na2CO3 solution in the scrubber
After chlorination nitrogen is substituted as the fluidizingmedium and the reactor temperature is set to the required level After the reactor attained the required temperature (400 to 6000C)dechlorination is carried out for time intervals varying from 10 to 60 min
For the hydrodesulfurization step the reactor temperature is set to the required level while still being fluidized with nitrogen After the reactor attained the required temperature hydrogen is substituted as the fluidizing medium and the hydrodesulfurization of coal is carried out for time intervals ranging from 10 to 30 min in the temperature range of 500 to 7000C
After completing the hydrodesulfurization experiment the heaters are switched off hydrogen flow is stopped and nitrogen isonce
21
Table 3 Calculated and Observed Values of Minimum Fluidization Velocity Umf
Calculated Umf
Mean cms Observed Umf cms
Size Particle Nitrogen Hydrogen Fraction Diameter
Tyler Mesh cm N2 C12 H2 PSOC 276 PSOC 282 PSOC 276 PSOC 282
-60 + l00- 001995 199 268 398 181 214 272 272
-100 + 200 001115 062 084 126 076 079 103 103
Table 4 Actual Flow Rates Employed in the Experiments -60 + 100 Tyler Mesh
Fluidizing Gas Flow Rate Imin
Chlorine 0610
Nitrogen 0600
Hydrogen 0900
22
ORIGINAL PAGE F OF POOR QUALITY
DRY CHLORINE GAS POWDERED CHLORINATIONC COAL 50-1000C 1 ATM
5-15 MIN SC12f 52C12 FLUIDIZED BED REACTOR 2
CHLORINATED COALS -_ WATEPNa2CO__
AMBIENT I ATM WASTE WATER 30 MIN INCLUDING HCI
2t 4 SULFATES AND CHLORIDESSODIUM SULFIDE SULFATE etc
DECHLORINATIONO NITROGEN 300-500-C I ATM
10-60 MIN HCI (g)FLUIDIZED BED REACTOR
1 HYDROGEN
HYDRODESULFURIZATIONO HD G 500-7000C 1 ATM
10-60 MIN H2S FLUIDIZED BED REACTOR 2shy
7------------- WATERNa 2CO3I WASHING AND DRYING
L-------- H2S0 4 SOLUBLE SULFATES
SULFIDES etc DESULFURIZED COAL
LABORATORY GLASS EQUIPMENT FOR THESE PROCESSES ISSHOWN IN FIGURE ] OPTIONAL
Figure 5 Process Flow Diagram for Laboratory Scale Fluidized Bed Coal Desulfurization
23
again substituted as the fluidizing medium The reactor is cooled to room temperature in a nitrogen atmosphere
After the experiment the reactor is disconnected from the systemand the reacted coal is collected and stored for subsequent analyses
In some cases raw coal chlorinated coal and product coal are subjected to a washing treatment consisting of water wash and carbonate wash For a water wash the sample is soaked in distilled water with occasional stirring for 30 min after which the coal is filtered and dried overnight at 100degC In a carbonate wash the sample is soaked in I M Na2C03 solution for 30 min with frequent stirring after which the coal isfiltered washed repeatedly till the washings are neutral to litmus and dried at 100C overnight
A safety and operating procedure for the fluidized bed coal desulshyfurization experiments ispresented inAppendix A
4 Methods of Analysis
a Analysis of Sulfur Forms in Coal
Raw coals and some of the processed coals were analyzed for sulfur forms by ASTM approved methods at the Colorado School of Mines Research Institute Appendix B gives the details of analysis methods
b Proximate and Ultimate Analyses of Coal
Selected desulfurized coal samples were submitted to the Colorado School of Mines Research Institute for long proximate and ultimate analyses by ASTM-approved methods
c Estimation of Total Sulfur in Coal
Processed coals immediately after the desulfurization experishyments were analyzed by a modified LECO Method for total sulfur Details of the method are given in Appendix C This routine analysis in the laboratory provided a rapid estimation of the total sulfur needed for planning further experiments
A more complete analyses for total sulfur and sulfur forms were carried out by CSMRI as indicated in (a) and (b)above During the earlier work in this laboratory it was observed that the estimations of total sulfur by LECO and the Eschkashymethods were in general in good agreement as shown in Table 5
24
Table 5 LECO Acid-base Analysis vs Eschkaa Analysis for Total Sulfur
Total Sulfur by Eschka Difference
wt LECO - Eschka
154 -012
154 +002
154 -006
154 -023
057 -009
088 -016
158 +014
061 +002
029 -007
122 +002
055 -002
078 000
Run Nob
B14
L2
B17
L9
L42
B22
B38
L30
L38
L44
L48
L49
Total Sulfur by LECO wt
142
156
148
131
048
072
172
063
022
124
053
078
a Conducted by CSMRI
b From Phase III Report (Ref 3)
25
d Surface Area and Pore Volume of Coal
Specific surface area and pore volume of raw coals were determined by low-temperature nitrogen adsorption employing a Quantasorb Sorption System Surface area and pore volume were calculated by applying the BET equation as described in Appendix D The results are presented in Table 6 While the surface areas of raw coals appear to be low it is generally observed that employing nitrogen as an adsorbate results in the estimation of low surface areas as compared to carbon dioxide due to the presence of a majority of micropores in coal In addition it was reported that during desulfurizashytion new pores are created in coal resulting in a pronounced increase in the surface area of processed coals
e Analysis of Scrubber Solution
In an attempt to estimate the amount of sulfur removed as gaseous species along with the reactor outlet gases the scrubber solution after the experiment was analyzed in some instances by precipitating BaSO4 However total sulfur estimated by this method accounted to only 20 of that estimated by the LECO analysis of product coals The apparent discrepancy might be due to the nature of sulfur species present in the outlet gases and their decomposition rates
It is known that chlorine gas readily reacts with pyrite forming ferrous chloride and sulfur monochloride (S2 C12) as follows
Fe S2 + 2 C12 -- Fe C12 + S2 C12
In the presence of excess chlorine the products of reaction are ferric chloride and sulfur dichloride as given by the following equation
2 Fe 52 + 7 C12 - 2 Fe C13 + 4 SC1 2
Sulfur monochloride is quite stable at room temperatures but a reversible breakdown starts at about 1000C and beyond 300C complete breakdown takes place as
S2 C12S 2 + C12
Sulfur monochloride is slowly hydrolysed by water at room temperature as follows
S2 C12 + 2 H20 - 2 HCl + S02 + H2S
In solution SO2 and H25 further react to form elemental sulfur and polythionic acids However in the presence of excess chlorine S2 C12 decomposes forming sulfuric and hydrochloric acids as
26
Table 6 Specific Surface Area and Pore Volume of Raw Coals Employed in the Study
Ym Mean Size
Fraction Sg Specific Surface Area
V5 Pore V lume
Pore Diametera
Coal Tyler Mesh m2g cm3g A
PSOC 276 -60 + 100 720 00160 445
PSOC 282b -60 + 100 601 00127 436
a 2x Vg
For a Spherical Pore Y m
-
S
bFuller Jr E L (ACS Advances inChemistry Series Vol 192 1961)
reported a BET surface area of 26 m2g by nitrogen adsorption for a bituminous Illinois No 6 coal from Sahara Mine whereas the same coal by carbon dioxide adsorption gave a surface area of 128 m2g
27
S2 C12 + 5 C12 + 8 H20- 2 H2 S04 + 12 HIC
As the scrubber solution contains Na2CO3 H2S is likely to react forming Na2S as follows
Na2 CO3 + H2S - NaS + CO2 + H20
Sulfur dichloride also undergoes similar hydrolysis reactions and is readily decomposed on contact with water
The complex series of reactions taking place may be the reason for underestimating sulfur removal in the process by the analysis of scrubber solution for SO4
f Coal Characterization Using Scanning Electron Microscopy (SEM)
An examination of the microstructure of coal is of interest in understanding its properties Details of size shape orienshytation and distribution factors for pyrite certain pyrite and marceral groupings or other coal constituents (such as mineral matter) are useful in supporting coal cleaning processes Recent studies on coal structure using Scanning Electron Microscopy (SEM) have shown that interrelationships exist between marcerals and inorganic phases such as FeS2 This form of characterization complements optical microscopy and conventional transmission electron microscopy (TEM) that have been used to classify and study coal constituents
SEM offers a means of visualizing features hundreds and thousands of Angstroms in diameter in a three dimensional form that is not available by any other technique Although the nature of coal surface precludes any precise quantitative measurements with SEM useful qualitative conclusions could be drawn regarding the effect of various treatments on the gross structural properties of coal
By using SEM equipped with an Energy Dispersive X-ray Analysis (EDAX) system microscale structural and chemical analysis of coal could be achieved A more detailed description of the applicability of these methods can be found in Reference 22
The SEM and EDAX of raw and product coal particles were examined using AMR (Advanced Metals Research Corporation) Model 900 SEM fitted with EDAX Model XC-12-164
The images of the particles were obtained using secondary electrons Because coal is a light element composed primarily of carbon the electrons in the impinging beam interact more diffusely with coal than with a metal Consequently it becomes much harder to obtain a sharp image at higher magnifishycations Tierefore best resolution is normally obtained at about 1000 A whereas most of the coal pore structure is comshyposed of micropores (less than 15 A)
28
In addition to the production of backscattered electrons the interaction of the impinging electron beam also yields x-rays There are two electron beam-solid interactions that lead to the production of x-rays (1) core-scattering which results in the emission of a continuous spectrum and (2) inner shell ionization which yields the characteristic spectrum The characteristic spectrum allows the qualitative identification of the elements present in the sample The basic function of EDAX is to collect all of the x-rays produced analyze their energies and present the results in a convenient form on a Cathode ray tube The EDAX is calibrated using the x-rays generated by aluminum and zirconium or zirconium and gold to fix the energy scale Once calibrated the element corresponding to any peak can be readily identified A facsimile of some typical EDAX spectra are shown in Figure 6 For any given sample usually 15 to 25 separate particles were examined and the picture of the most representative one was taken The EDAX spectra usually requires about 100 to 1000 seconds of data acquisition to yield an acceptable signal to noise ratio The SEM photographs and EDAX spectra of raw and processed coals are presented in Figures 7 to 14 and 15 to 18 respectively
29
C1
Au (Ma) S
Al Si (Si
K
Au6 (L9
Si
Al$
N KFe
00
02
I
0
I
2
I I
4 6 ENERGY (keV)
I
8
I
10
I I II
A HIGHLY CHLORINATED COAL A HIGH SULFUR BITUMINOUS COAL
Figure 6 Typical EDAX Spectrum of Coal
ORIGINAL PAGE 18OF POOR QUALITY
iIltFm
100 ILm
Figure 7 SEM Photograph of PSOC 282 Raw Coal
31
ORIGINAL PAGE IS OF POOR QUALITY
LW
100m
Figure 8 SEM Photograph of PSOC 282 Washed with 1 M Na2CO3 Solution
32
ORIGINAL PAGE 1jOF POOR QUALITY
I m
100
Figure 9 SEM Photograph of PSOC 282 Treated Coal (Run No 0032)
33
ORIGINAL PAGE IS OF POOR QUALITy
L_
100 m
Figure 10 SEM Photograph of PSOC 282 Treated Coal (Run No 0026)
34
ORIGINAL PAG OF POOR QUALTy
L_J
U m
100 F
Figure 11 SEM Photograph of PSOC 282 Treated Coal (Run No 0027)
35
ORIGINAL PAGE i9 OF POOR QUALITY
1 m
L_
100 Im
Figure 12 SEM Photograph of PSOC 282 Treated Coal
(Run No 0039)
36
ORIGINAL PAGE I$OF POOR QUALITY
L__
100 Im
Figure 13 SEM Photograph of PSOC 276 Raw Coal
37
ORIGINAL PAGE 19 OF POOR QUALITY
L__
L__ 100 Im
Figure 14 SEM Photograph of PSOC 276 Treated Coal (Run No 0046)
38
ORIGINAL PAGE S OF POOR QUALITY
PSOC 282 RAW COAL
PSOC 282 COAL WASHED WITH IMNa2CO3 SOLUTION
Figure 15 EDAX Spectrum of Coal
39
OF pOOR QUALTYORIGWNAL PA(t IS
PSOC 282 TREATED COAL (RUN NO 0023)
PSOC 282 TREATED COAL (RUN NO 0026)
Figure 16 EDAX Spectrum of Coal
40
ORIGINAL PAGE IS OF POOR QUALITY
PSOC 282 TREATED COAL (RUN NO 0027)
PSOC 282 TREATED COAL (RUN NO 0039)
Figure 17 EDAX Spectrum of Coal
41
ORIGINAL PAGE 19 OF POOR QUALITY
PSOC 276 RAW COAL
PSOC 276 TREATED COAL (RUN NO 0046)
Figure 18 EDAX Spectrum of Coal
42
VIII RESULTS AND CONCLUSIONS
Fluidized bed coal desulfurization experiments were conducted employing PSOC 276 and PSOC 282 coals A total of 26 experiments were conducted to investigate the effects of (1) chlorination dechlorination and hydroshydesulfurization as a function of reaction time and temperature (2)pre- and post-treatment of raw and processed coals and (3)changing chlorine concenshytration during chlorination on total sulfur reductions in coals The ranges of variable studied are as follows
(1) Coal type PSOC 276 and PSOC 282
(2) Particle size -60 + 100 and -100 + 200 Tyler Mesh
(3) Chlorination time 5 to 15 min
(4) Chlorination temperature Approximately 100 to 250degC
(5) Chlorine concentration Pure chlorine and a mixture of 14 chlorine and nitrogen
(6) Dechlorination time 10 to 60 min
(-7) Dechlorination temperature 300 to 500C
(8) Hydrodesulfurization time 10 to 30 min
(9) Hydrodesulfurization temperature 500 to 7000C
(10) Pre- and post-treatments to Coal These consisted of carbonate wash of chlorinated and product coals
Experimental conditions and results in the form of total sulfur estimation by LECO Analyses arepresented in Tables 7 and 8 The results are also depicted in Figures 19 and 20 Results of a complete analysis of selected coals carried by CSMRI are presented in Section X of this report (see Tables 9 through 12)
A PSOC 282 COAL
A total of 20 experiments were conducted to assess the influence of various process parameters on the extent of desulfurization in the fluidized bed reactor
A maximum level of 74 desulfurization (Runs 0021 and 0027) was achieved in the process based on 1581 total sulfur in the raw coal However based on the sulfur content of unwashed coal (22 total sulfur) the level of desulfurization was 81
43
Table 7 Experimental Condition and Results
COAL PSOC 282 Illinois No 6 (-60 + 100 Tyler Mesh) Total Sulfur 1581 (Wt)a
Total Advanced Sulfur
Experiment Dechlorination Dechlorination in Desul-No Chlorination Intermediate Wash with Nitrogen with Hydrogen Post-Treatment Producta furization
0001 15 min ambient - 30 min 400C - 1170 261 0002 15 min ambient - 30 min 400C - water wash 1082 316 0003 15 min ambient - 30 min 400C - carbonate washb 0925 415
0004 15 min ambient - 60 min 400 106 327 0005 15 min ambient - 60 min 4001C water wash 104 342 0006 15 min ambient - 60 min 4000C carbonate wash 101 359
0007 15 min ambient - 30 min 5000C 107 322 0008 15 min ambient - 30 min 5001C water wash 106 327 0009 15 min ambient - 30 min 500C carbonate wash 105 328
0010 carbonate washb 150 51
0017 15 min 1000C - - 30 min 6000C 082 484 0018 0019
15 min 1000C 15 min 1000C
--
--
30 min 6001C 30 min 6000C
water wash carbonate wash
076 068
521 572
0020 15 min 1000C 0021 0022 0023
15 min 100degC 15 min 1001C 15 min 100
carbonate washb carbonate washb carbonate washb
--- 0
30 min 600degC 30 min 600degC 30 min 600C
water wash carbonate wash
041 041 038
741 741 760
0024 15 min 100degC water wash - 30 min 600-C 072 546
0026 15 min 1001C water wash --
0 30 min 6000C 30 min 600 0C
water wash carbonate wash
072 071
546 551
0027 15 min 1000C carbonate wash - 30 min 7000C 041 741
0028 15 min 1O0C carbonate wash - 30 min 700C water wash 041 741 0029 15 win 100 carbonate wash - 30 min 700degC carbonate wash 041 741
Table 7 Experimental Condition and Results (Continued)
COAL PSOC 282 Illinois No 6 (-60 + 100 Tyler Mesh) Total Sulfur 1581 (Wt)a
Total Advanced Sulfur
Experiment Dechlorination Dechlorination in Desul-No Chlorination Intermediate Wash with Nitrogen with Hydrogen Post-Treatment Producta furization
0030 - 3D min 600C 0976 383 0031 - 30 min 600C water wash 0902 429 0032 30 min 600C carbonate wash 0883 441
0033 0034
15 min 1001C 15 min 1000C carbonate wash -
-
30 min 500degC carbonate wash -shy
0690 563 0035 15 min 100C carbonate wash - 30 min 500C water wash 0677 572 0036 15 min 100degC carbonate wash - 30 min 500C carbonate wash 0552 587
0037 5 min 1000C carbonate wash - 30 min 7001C 0581 632 0038 5 min 100 C carbonate wash - 30 min 700degC carbonate wash 0498 685
0039c 0040c 15 min 100degC 15 min 100C
--
30 min 700C 30 min 700C carbonate wash
0614 0496
611 686
0041d 0042d
15 min 100C 15 min 100-C
carbonate wash carbonate wash
--
30 min 700C 30 min 70000 carbonate wash
0517 0517
673 673
0043 15 min 100C carbonate wash - 10 min 700C - 0632 600 0044 15 min 100 carbonate wash - 10 min 70000 carbonate wash 0449 716
0047 5 min I00C carbonate wash - 10 min 7000 - 0662 581 0048 5 min 1000C carbonate wash - 10 min 700degC carbonate wash 0600 620
0049e 15 min 100degC carbonate wash - 30 min 700C - 0521 670
0050e 15 min 10degC carbonate wash - 30 min 700degC carbonate wash 0409 741
0 0053 15 min 250C carbonate wash - 30 min 700C - 0 547 654
0 r 0054 15 min 2500 carbonate wash - 30 min 700 carbonate wash 0500 684 t __
Table 7 Experimental Condition and Results (Continued)
COAL PSOC 282 Illinois No 6 (-60 + 100 Tyler Mesh) Total Sulfur 1581 (Wt)a
Total Advanced Sulfur
Experiment Dechlorination Dechlorination in Desul-No Chlorination Intermediate Wash with Nitrogen with Hydrogen Post-Treatment Producta furization
0055 15 min 1000C - 109 292
0056e 15 min IO0C - 30 min 4000C - 1076 319
0057e 15 min O00C - 30 min 4000C - carbonate wash 1052 335
0058e 15 min 100C - 30 min 4000C 30 min 7000C 0849 463 0059e 15 min IO0C - 30 min 4000C 30 min 7000C carbonate wash 0850 462
0060e 15 min 1000C carbonate wash 30 min 700C 0412 739 0061e 15 min 100 carbonate wash - 30 min 7000C carbonate wash 0410 741
0062e 5 min IOuC - 10 min 7000C 0990 374 0063e 5 min 10000 - 10 min 700C carbonate wash 0985 377
aLECO analysis
bSoaked in 10 Na2CO3 solution for 30 min followed by washing with distilled water until free of alkali then dried
CCoal initially washed with 10 Na2CO3 solution and dried
d0dChlorination with a 41 mixture of nitrogen and chlorine c -00 + 200 Tyler Mesh
Table 8 Experimental Condition and Results a
COAL PSOC 276 Ohio No 8 (-60 + 100 Tyler Mesh) Total Sulfur 375 (Wt)
Total Advanced Sulfur
Experiment Dechlorination Dechlorination in Desul-No Chlorination Intermediate Wash with Nitrogen with Hydrogen Post-Treatment Producta furization
0011 15 min 1O0C - 30 min 400C 30 min 600C 260 306
0012 15 min IO0C - 30 min 400C 30 min 6000C water wash 233 379 0013 15 min ]OOC - 30 min 4000C 30 min 6000C carbonate washb 223 405
0045 15 min 1000C carbonate washb - 30 min 700C 0708 811 0046 15 min 1000 carbonate washb - 30 min 700 carbonate wash 0699 813 0051c 15 min 100 carbonate wash - 30 min 700C 1113 703
0052c 15 min IO00C carbonate wash - 30 min 700degC carbonate wash 0943 749
0064 5 min 100C - - 281 274
0065 30 min IO00C - 30 min 600C 30 min 700C 211 437 0066 30 min 100degC - 30 min 6000C 30 min 700C carbonate wash 167 555
0067 5 min 1000C - 10 min 6000C 10 min 7000C 2750 267 0068 5 min 100C - 10 min 6000C 10 min 7000 carbonate wash 1870 501
0069 5 min lO00C carbonate wash 10 min 600degC 10 min 700degC 147 608 0070 5 min IO0C carbonate wash 10 min 600C 10 min 7000C carbonate wash 146 609
aLECO analysis
bSoaked in 10 Na2CO3 solution for 30 min followed by washing with distilled water until free of alkalai then dried
c-lO00 + 200 Tyler Mesh
C 0 r
00
COAL PSOC 282 ILLINOIS NO 6 LEGEND
03 shy
04 -
PARTICLE SIZE -60 + 100 TYLER MESH -100 + 200 TYLER MESH
I WATER WASH CARBONATE WASH
7595
05 - 684
06
00 0
08 -09 -
07-526
gt
10
D-jS11 D
1213-
14
RAW
-
Cg amp
-0 e0 o0clt
0
o 0C
ogt000
o ot
cs N 0 -
)
- 368
209
51
Z 00Adeg
COAL 158
EXPERIMENT NO (REF- TABLE NO 11) --
Figure 19 Experimental Results of Fluidized Bed Coal Desulfurization PS0C 282 Illinois No 6
COAL PSOC 276 OHIO NO 8
05 PARTICLE SIZE -60 + 100 TYLER MESH -100 + 200 TYLER MESH
1811
10 -LEGEND
WATER WASH CARBONATE WASH
-733
15 - - 600
0U Z 20
L-4670 467
tL
Ln 25 - 333 Ds
nCo
30 200 M
35 RAW
-C
00 Ii
01 to
to
r
COAL 375o
Figure 20
- EXPERIMENT NO (REF TABLE NO 12)
Experimental Results of Fluidized Bed Coal Desulfurization PSOC 276 Ohio No 8
1 Chlorination
Chlorination in general was carried out at about 100C for 15 min In certain cases chlorination for as short a time interval as 5 min (Runs 0037 0047 0062) as well as at 2500 C (Run 0053) was also carried out The effect of changing chlorine concentration by employing a 41 mixture of nitrogen to chlorine (Run 0041) was also studied However due to the high levels of chlorine that are likely to exist in chlorinated coals prior to dechlorination sulshyfur estimation in chlorinated coals could not be carried out due to interferences in the LECO method Consequently these results are discussed based on sulfur estimations of the product coals in subshysequent sections on dechlorination and hydrodesulfurization in this document
2 Dechlorination
Dechlorination of chlorinated coals by nitrogen was carried out at 400 to 600C for 30 min In general dechlorination at higher temperatures did not result in any significant change in the desulshyfurization levels achieved However longer times and higher temperatures during dechlorination were effective to a limited extent in reducing the chlorine levels in product coals
3 Hydrodesulfurization
Substitution of hydrogen during dechlorination was found to further enhance the desulfurization levels achieved Infact dechlorination-cum-hydrodesulfurization by hydrogen was found to be superior to dechlorination by nitrogen alone or successive dechlorination and hydrodesulfurization Hydrodesulfurization was carried out at atmospheric pressure for 10 to 30 min at 500 to 7000C
Hydrodesulfurization of chlorinated coal at 6000C resulted in increasing the level of desulfurization to 48 (Run 0017) compared to the 30 during dechlorination While the increase in the level of desulfurization is not significant raw coal itself was desulshyfurized to the extent of 38 at 6000C the reduction in the chlorine level was substantial
Treatment for coal prior to hydrodesulfurization as well as hydroshydesulfurized coals resulted in a marked increase in the desulfurshyization levels achieved as indicated by the results presented in Table 7 A carbonate wash to the chlorinated coals prior to hydroshydesulfurization was more effective than a water wash An intershymediate carbonate wash increased the level of desulfurization to 74 (Run 0021) compared to 48 achieved with no wash at all (Run 0017) while a simple water wash resulted in only 55 desulfurshyization The data presented in Table 7 also indicate that a subshysequent wash to hydrodesulfurized coals that weretreated with
50
carbonate prior to hydrodesulfurization did not significantly enhance the level of desulfurization The substantial reduction in sulfur levels in coals as a consequence of carbonate treatment to chlorinated coals is likely due to the removal of organic sulfur by alkali Alkali treatment of coal results in the removal of both pyritic and organic forms of sulfur more so if the coal is inishytially subjected to an oxidation treatment The minor reductions in sulfur levels achieved by subjecting product coals to a carshybonate wash may be the result of trapping sulfur in the ash during combustion by sodium ions that might have been retained in the coal It is believed that alkaline metals such as sodium calcium etc either chemically bound to coal or in a physical mixture with coal are capable of reducing potential sulfur emissions during coal combustion by trapping the sulfur in the ash as sulfate
Treating raw coal with carbonate solution prior to desulfurization resulted in achieving a desulfurization level of 61 (Run 0039)
Because gaseous chlorine was employed as the fluidizing medium chlorine requirement in the process could be reduced by either reducing the time of reaction or by reducing the chlorine concenshytration in the feed by diluting it with an inert gas Both these alternatives were found to result in high levels of desulfurshyization By chlorinating for only 5 min (Run 0037) as much as 63 desulfurization was achieved while a mixture of 41 nitrogen and chlorine during chlorination (Run 0039) resulted in 61 desulfurization
Even the time of hydrodesulfurization can be reduced without sacrishyficing the level of desulfbrization as indicated by Run 0043 in which 60 desulfurization was achieved Reduction of the time of chlorination and hydrodesulfurization by as much as one-third (Run 0047) resulted in 58 desulfurization The data clearly shows that shorter reaction times and lower reactant concentrations can be used while still achieving higher levels of desulfurization However a more detailed parametric study is needed to establish optimum conditions of operation
Higher temperature during chlorination did not result in any significant enhancement of the level of desulfurization as indicated by Run 0053 in which 250C during chlorination resulted in only 65 desulfurization
Particle size also did not have a significant effect within the range of particle sizes studied (Compare Runs 0027 and 0060 for -60 +100 mesh and -100 +200 mesh respectively)
51
B PSOC 276 Coal
A limited number of experiments was conducted employing PSOC 276 coal The maximum level of desulfurization achieved was once again 81 (Run 0045) The general trend was the same as with PSOC 282 coal in that
(1) Substitution of hydrogen during dechlorination markedly improved
the level of desulfurization
(2) Particle size did not have any effect in the range of sizes studied
(3) Even 5 min of chlorination and 10 min of dechlorination cumshyhydrodesulfurization resulted in 60 desulfurization
(4) Carbonate wash prior to hydrodesulfurization significantly enhanced the level of desulfurization
(5) Longer times of chlorination and dechlorination did not enhance desulfurization
52
IX SCANNING ELECTRON MICROSCOPY (SEM) EXAMINATION OF COAL SURFACE
During desulfurization treatments coal undergoes various chemical changes which will also be reflected in changes in the gross physical structure One convenient method of assessing the physical changes undergone by coal surface is Scanning Electron Microscopy (SEM) Due to the imaging process inherent with SEM coal particles can be examined at magnifications up to 10000 times while maintaining a sufficiently large depth of field to render a three-dimensional quality to the image However the technique is-limited to an examination of the exterior surface of the particles and precludes any quantitative measurements Even so such information should provide a good qualitative indication of the changes undergone by the particle interior
By using SEM along with EDAX (Energy Dispersive Analyzer for X-Rays) it is possible to obtain a relative comparison of the levels of sulfur and mineral components in coal While this information is qualitative it nevertheless provides a basis for quickly comparing the levels of common mineral components and sulfur in coal and the effect of different treatments to coal
A SEM PHOTOGRAPHS
PSOC 276 and PSOC 282 raw coals as well as product coals from some typical experiments were examined by SEM (see representative photographs at 100 and 10000 magnification in Figures 7 through 14)
Figures 7 and 13 show the SEM photographs of PSOC 282 and PSOC 276 coals respectively Both photographs show the same general features The coal particles are covered and interspaced by several smaller particles which appear to adhere to the larger particles The dimensions of the coal particles range from 50 to 200m while a majority of the small particles are of the order of lvm or smaller It is possible that the small particles are formed during the process of grinding and are not removed during sieving
Washing PSOC 282 raw coal with 1 M Na2CO3 solution appears to have removed a majority of the small particles from the coal surface As the reduction in sulfur by the carbonate wash is only about 5 it is reasonable to assume that the smaller particles may essentially consist of mineral matter besides pyrites
Figures 9 through 12 and Figure 14 present the SEM photographs of desulfurized coals These photographs in general show that the desulfurization treatments resulted in a substantial cleaning of the coal surface not achieved by a carbonate wash They also show that not only are the coal surfaces clean but they also appear to be etched Some of the particles also appear to have developed fissures While the raw coal particle surfaces are smooth the product coal particle surfaces appear to be rough with noticeable cracks These features are indicative of the removal of some portions from the coal surface as well as a breakdown of structure in some cases during the desulfurization treatments
53
B EDAX SPECTRA
EDAX Spectra (Energy Dispersive Analyzer for X-Rays) of PSOC 282 and PSOC 276 raw coals as well assome desulfurized coals are presented in Figures 15 through 18 The EDAkspectrum of PSOC 282 raw coal (1581 wt total sulfur) presented in Figure 15 indicates that the peak corresponding to sulfur is much smaller compared to the one for PSOC 276 raw coal shown in Figure 18 which contains over twice the amount of sulfur (375 wt total sulfur) Comparison of the spectra of carbonate washed PSOC 282 coal shown in Figure 15 with that of the raw coal reveals that the wash has resulted in the reduction of sulfur and mineral matter which supports the conclusion from the SEM photographs EDAX spectra of desulfurized coals from experiments 0023 (76 sulfur removal) and 0027 (74 sulfur removal) presented in Figures 16 and 17 show smaller sulfur peaks compared to the raw coal The same trend was observed from the EDAX spectrum of PSOC 276 desulfurized coal from experiment 0046 (80 sulfur removal) presented in Figure 18 In spite of the different conditions of treatments the EDAX spectra of desulshyfurized coals did not show any significant increase in the levels of chlorine and sodium retained in the coals after the treatment The increase in iron peak observed in some of the samples was unexpected
C CONCLUSIONS
SEM photographs of raw and desulfurized coals show that desulfurization treatments result in changes in the gross physical structure of coal After treatments coal surfaces not only appeared to be clean but also developed cracks and rough surfaces indicative of a breakdown of physshyical structure and loss of material from the surface
The EDAX spectra show that sulfur peaks in the desulfurized coals are reduced when compared to raw coals Apart from some reductions in the Al and Si levels in the desulfurized coals the treatments did not result in any significant enhancement in either chlorine or sodium retained in the product coal
54
X RESULTS OF CSMRI ANALYSES
A TOTAL SULFUR AND SULFUR FORMS
Ten coal samples from typical experiments were analyzed at the ColoradpSchool of Mines Research Institute (CSMRI) for total sulfur and sulfur forms by ASTM-approved methods Ingeneral the total sulfur estimashytions by LECO acid-base analysis were in agreement with the CSMRI values Some anomalies were observed in the CSMRI results on sulfur forms such as an increase in organic sulfur fraction in coal after desulfurization in spite of substantial reductions intotal sulfur pyritic sulfur and sulfate sulfur This anomaly ismore likely to be due to the analytical bias rather than by any transformation of pyritic sulfur to organic form Inview of the fact that organic sulfur is calshyculated by difference any errors inestimating total iron and pyritic iron could lead to such anomalies Therefore more precise methods for characterizing sulfur distribution incoal as well as for the direct estimation of organic sulfur are needed
1 PSOC 282 Coal
Samples from six typical experiments were analyzed for total sulfur and sulfur forms at CSMRI The results are presented in Table 9 Pyritic sulfur reductions were uniformly above 90 except in the case where the coal was only chlorinated (48) Sulfate sulfur reductions were also high Organic sulfur reductions varied from 21 to 34 except in two cases where there was an apparent increase Insamples from experiments 0017 and 0039 (where the coals were not subjected to any post or intermediate washing treatshyments) the pyritic sulfur was reduced by 90 Thus itappears that the sulfur is removed as gas-phase species and lends support to the proposed mechanism This is also evident from the results of experiment 0055 inwhich coal was only chlorinated resulting in 49 pyritic sulfur reduction Consequently in the proposed process an intermediate wash between chlorination and dechlorinashytion andor hydrodesulfurization steps appears to be totally unnecessary thereby simplifying the process considerably
2 PSOC 276 Coal
Four samples from typical experiments were analyzed at CSMRI for total sulfur and sulfur forms The results are presented in Table 10 Again there was some analytical bias inorganic sulfur estimations
In experiment 0045 inwhich maximum desulfurization of 82 was achieved the reductions inpyritic sulfate and organic sulfur were 99 100 and 43 respectively
55
ORIGINAL PAGE gr OF POOR QUALITY
Table 9 Total Sulfur and Forms of Sulfur in Selected Product Coalsa PSOC 282
Pyritic Sulfate Organic cc Sulfur Sulfurc dTotal Sulfurc Sulfur
Sample Experimentb
No No wt Removed wt Removed wt Removed wt Removed
- Raw Coal 154 - 043 - 036 - 075 shy
0017 084 454 004 908 lt005 861 080 +67
2 0039 e 063 591 004 907 lt005 861 059 213
3 0041f 058 623 003 930 lt005 861 055 267
5 0055g 109 292 022 488 029 195 058 227
6 0058 081 474 003 930 lt005 861 078 +40
7 0060 051 669 002 954 lt005 861 049 347
aAnalyses carried out at CSMRI
bFor experimental details refer to Table 7
CAs determined basis
dBy difference
ecoal pretreated with 1 M Na CO solution
fMixture of N2C12 (41) during chlorination
gChlorination only
56
ORIGINAL PAGE 18
Table 10 Total Sulfur and Forms of Sulfur in OF POOR QUAL1TY
Selected Product Coalsa PSOC 276
Total Sulfurc PyriticSulfurc
Sulfate Sulfurc
Organicc dSulfur d
Sample Experimentb No No wt Removed wt Removed wt Removed wt Removed
- Raw Coal 387 - 263 - 006 117 -
4 0045 070 819 003 988 lt005 067 427
8 0064e 281 274 072 726 102g - 107 85
9 0067 229 408 013 950 lt005 - 216
10 0069 f 173 553 004 985 lt005 - 169g
aAnalyses carried out at CSMRI
bFor experimental details refer to Table 8 cAs determined basis dBy difference
eChlorination only
f5 min chlorination and 10 min dechlorination and hydrodesulfurization
gAnamolous results showing a substantial increase
57
Inexperiments 0064 0067 and 0069 the coal was chlorinated for 5 min and dechlorinatedhydrodesulfurized for I0min Chlorination alone for as short a time as 5 min removes as high as 73 of the pyritic sulfur Results of these experiments inwhich coals were not subjected to any washing treatment lend support to the contenshytion that the sulfur is removed in the gas-phase and no intershymediate washing step is necessary
PSOC 276 coal is desulfurized to a greater extent compared to PSOC 282 coal Even 5 min chlorination followed by 10 min of dechlorination has resulted in 99 reduction in pyritic sulfur
3 Comparison of CSMRI and LECO Analyses
Table 11 presents the results of CSMRI and LECO analyses for total sulfur in the present investigation The values are in agreement with an average deviation of 88
B PROXIMATE AND ULTIMATE ANALYSES
Four samples of chlorinated coals and chlorinated and desulfurized coals were analyzed at CSMRI for long proximate and ultimate analyses The results are presented in Table 12
1 PSOC 282 COAL
Proximate and ultimate analyses of raw coal coal chlorinated at I0CC for 15 min and chlorinated coal hydrodesulfurized at 700C for 30 min are presented in Table 12
By chlorination only the ash carbon hydrogen sulfur and nitrogen contents slightly decreased while the oxygen content remained unchanged There was a significant drop in heating value and subshystantial increase in chlorine content (129 compared to 047 in raw coal)
Dechlorination-cum-hydrodesulfurization resulted in a slight increase in the ash content and heating values The volatiles decreased considerably (from 338 in raw coal to 59) fixed carbon value increased substantially (872 compared to 595 in raw coal) carbon content increased from 748 to 858 hydrogen content decreased from 48 to 2 and nitrogen content remained almost unchanged Hydrogen treatment resulted in a substantial decrease inthe sulfur content (16 to 049) and dxygen content (10 to 263) The chlorine content after the dechlorinationshycum-hydrodesulfurization treatment was almost the same as in the raw coal
58
ORIGINAL PACE 1 OF POOR QUALITY
Table 11 Comparison of Total Sulfur Estimation by Eschka and LECO Methods
ample Experiment I Eschka b LECO Difference No INoa Analysis DeviationAnalysis Eschka-LECO
PSOC 282 COAL (Illinois No 6)
- Raw Coal 154 158 -004 -25
1 0017 084 082 +002 +24
2 0039 063 0-61 +002 +33
3 0041 058 052 +006 +115
5 0055 109 shy
6 0058 081 085 -004 -47
7 0060 051 041 +010 +244
PSOC 276 COAL (Ohio No 8)
- Raw Coal 387 375 +012 +32
4 0045 070 071 -001 -14
8 0064 281 shy
-9 0067 229 275 -046 -167
10 0069 173 147 +026 +176
PERCENT AVERAGE DEVIATION 88
aFor experimental details refer to Tables -7and 8
bAnalyses carried out at CSMRI
CAnalyses carried out at JPL
59
Table 12 Proximate and Ultimate Analyses of Selected Product Coalsa
Ash Volatile
Matter Fixed
Carbon Heating Value
Btulb Carbon
Coal Sample
No Experiment
Nob Moisturec
AD ryd ADAD Dry AD Dry AD Dry
PSOC 282 0 Raw Coalf 31 - 670 - 3380 - 5950 - 13092 - 748
PSOC 282 A 0055 361 588 610 3450 3580 5600 5810 10752 11150 6240 6270
PSOC 282 B 0060 213 678 693 5 77 590 8530 8720 13372 13666 8400 8580
PSOC 276 0 Raw Coalf 189 - 1150 - 3720 - 5130 - 12755 - 7160
PSOC 276 C 0064 273 1040 1070 3530 3630 5160 5300 11165 11478 6360 6540
PSOC 276 D 0069 131 1280 1300
Hydrogen
709 718
Sulfur
7880 7980
Nitrogen
12580 12744
Chlorine
7910 8010
Oxygen e C
aAnalysis carried out at CSMRI bFor experimental details
refer to Tables 7 and 8 CAs determined basis
Sample No 0
A
B
AD -
422
220
Dry 482
396
__
200
AD
-
116
048
Dry
160
120
049
AD
--goa
127
160
Dry
169
132
164
AD
-
1240
050
Dry
047
1290
051
AD
-
1270
444
Dry
1000
982
263
a
r
dDry basis
f y difference
0
C
-
470
567
452
-
284
391
292
-
111
128
114
-
443
016
455
-
1290
587
1080
tFrom Phase III Report
(Ref 3) D 221 209 163 165
_
138 140 013 013 275 163
ORIGINAL PAGE iS OF POOR QUALITY
As a result of the desulfurization process there is a net increase inthe ash content and heating values a substantial increase in fixed carbon and carbon values and a significant decrease inthe volatile matter hydrogen sulfur and oxygen contents Nitrogen and chlorine values remained essentially unchanged
2 PSOC 276 COAL
Proximate and ultimate analyses of PSOC 276 raw coal coal chlorishynated at 100C for 5 min and chlorinated coal dechlorinated at 600C for 10 min and hydrodesulfurized at 700 for 10 min are presented in Table 12
As a consequence of chlorination there-was an initial decrease in ash content heating value carbon and nitrogen The chlorine content increased substantially (from 016 to 455) After dechlorination and hydrodesulfurization there was a net increase in the ash content (115 to 130) fixed carbon (513 to 788) carbon (716 to 801) and nitrogen (128 to 14) The increase innitrogen content inthis case may be due to successive dechlorshyination and hydrodesulfurization instead of dechlorination-cumshyhydrodesulfurization as in the case of PSOC 282 coal The volatile matter decreased from 372 to 72 hydrogen decreased from 567 to 21 sulfur decreased from 391 to 163 and oxygen decreased from 587 to 163 The heating value and chlorine content remained unchanged Infact the chlorine content of the desulshyfurized coal is even slightly lower than the raw coal
Ingeneral the desulfurization treatments resulted in a slight net increase in ash content and heating value a substantial increase in fixed carbon and carbon values and an equally substantial reduction in volatile matter hydrogen sulfur and oxygen contents
CONCLUSIONS
Proximate and ultimate analyses of raw chlorinated and dechlorinated andor hydrodesulfurized coals revealed that the desulfurization processresults inproduct coals with increased fixed carbon and carbon contents and substantially reduced volatiles hydrogen and oxygen contents There was a net increase in ash content and heating values
The nitrogen and chlorine contents remained essentially unchanged
dThe results show that further reductions are possible inchlorinerequirement inthe process and that the use of chlorine inthe process Mas not resulted inany increased chlorine levels inthe product coals T is is significant because of environmental implications and corrosion
intermediate wash torconsiderations The results also indicate that an chlorinated coals may be totally unnecessary thereby making the processsimpler and more economical than present processes
61
XI REFERENCES
Kalvinskas John J et al Final Report for Phase I - Coal Desulfurization by Low Temperature Chlorinolysis JPL Publication bull78-8 November 23 19l7
Kalvinskas John J et al Final Report - Coal Desulfurization by Low Temperature Chlorinolysis Phase II JPL Publication 80-15 January 15 1980
Kalvinskas John J et al Final Report - Coal Desulfurization by Low Temperature Chlorinolysis Phase III JPL Publication 81-82 March 1 1981
Kalvinskas John J and Dave Daly Final Report - Coal Desulfurization by Chorinolysis - Production and Combustion Test Evaluation of Product Coals L Publication 82-2 April 30 1982
Haldipur G et al Desulfurization of Coal in Fluidized Bed Reactor Coal Desulfurization - Chemical and Physical Methods edited by Thomas D Wheelock ACS Symp Series 1977
Boodman N S et al Fluid-Bed CarbonizationDesulfurization of
Illinois Coal by the Clean Coke Process PDU Studies loc cit (Ref 5)
Fleming D K et al Hydrodesulfurization of Coals loc cit (Ref 5)
Thiessen G Pyrolytic Reactions of Coal Chem Coal Util Suppl Vol 340 1963
Powell A R Ind Eng Chem 12 1069 1077 (1920)
Ibid JACS 45 1 (1923)
Snow R D Ind Eng Chem 24 903 (1932)
Grey C A et al IEC Prod Res Dev 9 357 (1970)
Maa P S et al Fuel 54 62 (1975)
Batchelor J D et al Ind Eng Chem 52 161 (1960)
Guth E D Oxidative Coal Desulfurization Using Nitrogen Oxides TheKVB Process Proceedings Symposium On Coal Cleaning to Achieve Energy and Environmental Goals Hollywood Florida September 1978
Block S S et al Fuel 54 113 (1975)
Sinha R K and Walker P L Fuel 51 125 329 (1972)
Jackobs J K and Mirkus J D Ind Eng Chem 50 24 (1958)
CEDING PAGE BLANK NOT FILMED 63 ITshy
ly 111I1
19 Huang Edmund Tao Kang and Pulsifer Allen H Coal Desulfurization During Gaseous Treatment loc cit (Ref 5)
20 Ezdakov V I Chlorination of Pyrite Trudy Uzbekskogo GosudarstUniv Sbornik Rabot Khim 15 131 (1939)
21 - Chlorine removes 95 of the sulfur from FeS2 at 600 J Ind Chem Soc News Ed B 8T(1945-
22 Goldstein J I and Yakowitz H Edited Practical Scanning Electron Microscopy Plenum Press New York NY (19b)
64
APPENDIX A
perating Procedure for the Laboratory Scale Batch Fluidized
Bed Reactor System for Coal Desulfurization
65
OPERATING PROCEDURE FOR THE LABORATORY SCALE BATCH FLUIDIZED BED REACTOR SYSTEM FOR COAL DESULFURIZATION
INTRODUCTION
is standard operating procedure outlines the conditions required for the Fe operation of the laboratory scale batch fluidized bed reactor system for al desulfurization shown in Figure I
OPERATING RULES AND CONDITIONS
eration of the batch fluidized bed reactor system is subject to specific les and conditions Prior to beginning an experimental run the following Rps must be completed
(1) The reactor and accessories must be connected in the sequence shown
in Figure 1
(2) The entire system must be leakproof
(3) A complete description of an experimental run must be made available to the operator
(4) Excess chlorine gas during chlorination must be scrubbed with sodium carbonate solution
(5) Hydrochloric acid gas and hydrogen sulfide gas generated during dechlorination and hydrodesulfurization respectively must be scrubbed with sodium carbonate solution
[ PERSONNEL SAFETY
sonnel operating the batch-fluidized bed reactor system should be equipped bh
(1) Protective garments such as a laboratory coat and rubber or asbestos gloves
(2) Protective eye glasses
(3) Proper respiratory equipment such as gas masks for toxic gases and coal dust
(4) Fire extinguishing equipment in proper working condition and a water shower
PRECEDING PAGE BLANK NOT FILMHED
67 0a(41WBhlJ SD
IV EQUIPMENT SAFETY
To ensure safe conditions specific precautions with equipment must be taken
A CHLORINATION
(1) Do not allow liquid chlorine into the reactor A mixture of
liquid chlorine and coal is potentially explosive
(2) Preheat the chlorine to ensure that it is vaporized
(3) If leaks develop during a run repair them immediately othershywise stop the chlorine flow and abort the run
(4) Ensure that the exhaust in the fuming cupboard isworking at all times during an experiment
(5) At the end of prescribed reaction time shut off the chlorine flow Purge the system with nitrogen
(6) Make certain that the coal is being fluidized by observing the minor pressure drop fluctuations in the manometer
(7) The reactor should be adequately insulated to conserve the heat generated during chlorination
(8) Ensure that the scrubber isworking satisfactorily
B DECHLORINATION
(1) The batch-fluidized bed dechlorinator system should be opershyated in an oxygen-free environment to avoid possible coal comshybustion and explosion
(2) The reactor should be properly insulated to reduce radiation losses
(3) Hydrochloric acid vapors should be scrubbed with sodium carshybonate solution
(4) Check periodically that the heater controller isworking properly
(5) Maintain the nitrogen flow through the reactor at all times during dechlorination and cooling Failure to do so may cause fire andor an explosion
(6) In case of fire shut off the heaters and smother the fire with a nitrogen flow andor a CO2 fire extinguisher
68
C HYDRODESULFURIZATION
Before hydrogen is fed into the reactor the following tasks must be completed
(1) The hydrogen cylinder control valves and pressure gage must be installed outside the building away from the reactor system
(2) The reactor system should be completely leakproof Check it by feeding nitrogen under slight pressure
(3) The reactor should be adequately insulated with no heater parts exposed
(4) The operator should close the door of the fuming cupboard containing the reactor system and stay away from the reactor system
(5) Heat the reactor to the required temperature under nitrogen blanket before feeding hydrogen
(6) After the hydrodesulfurization experiment is completed shut off the hydrogen supply and switch off the heaters simultaneshyously then cool the reactor under nitrogen atmosphere
(7) In case of fire during hydrodesulfurization stop feeding hydrogen immediately start nitrogen flow to the reactor wait for 2 or 3 minutes in order to purge the system and put the fire out
(8) Check that the exhaust in the fuming cupboard is working at
all times during hydrodesulfurization
D REACTOR AND ACCESSORIES
(1) Before starting a run ensure that the reactor and accessories are thoroughly cleaned after the previous experiment and are connected in sequence
(2) Load the reactor with coal position securely in place and make the appropriate connections to the accessories such as manometer condenser etc
(3) Mount the heaters on the reactor and lag them properly before making the power connections
(4) Fill the scrubber with 1 M Na2CO3 solution
(5) Ensure that the exhaust fan is working
69
(6) Always start a run by feeding nitrogen into the reactor first and ensuring that the system isfree of oxygen
(7) After a run clean the entire system thoroughly in preparation for the next experiment
V OPERATING PROCEDURE
The following standard operating procedure should be available to the operashytor prior to starting an experiment
A START-UP
(1) Weigh the required quantity of dry coal (dried in an oven at IO0C for 6 hours and cooled in a desiccator) and transfer it to the reactor
(2) Position the reactor in place and connect the accessories
(3) Connect the pressure drop tappings to the manometer
(4) Fill the scrubber with 1 M Na2CO3 solution and connect it to the system
(5) Start water flow through the glass condenser
(6) Mount the reactor heaters insulate them and make the appropriate connections to the controller and power supply
(7) Switch on the exhaust in the fuming cupboard
(8) Check the system for leaks by feeding nitrogen under slight pressure
(9) Adjust the flow of nitrogen so that the bed isfluidized as indicated by the manometer reading
(10) Switch on the power supply to the preheater and reactor heaters set the temperature control for the required temperashyture and allow the system to reach stable condition
B CHLORINATION
(1) After the reactor has attained the set temperature start chlorination by stopping the nitrogen flow and feedingchlorine at the required flow rate Ensure that the bed is properly fluidized by-tapping the reactor if necessary(During the first few minutes of chlorination coal has a tendency to consolidate due to the heat generated)
70
(2) Conduct the run for the required time interval
(3) After chlorination stop chlorine flow and start feeding nitrogen at the required flow rate
C DECHLORINATION
(1) Set the reactor temperature to the required level
(2) After the required temperature is attained conduct dechlorshyination for the required time interval
D HYDRODESULFURIZATION
(1) Set the reactor temperature to the desired level and allow the reactor to attain the temperature
(2) After the reactor has attained the temperature start hydroshydesulfurization by shutting off the nitrogen flow and feeding hydrogen at the flow rate required for fluidization
(3) Conduct the run for the required time interval
(4) After hydrodesulfurization stop the hydrogen flow begin feeding nitrogen and switch off the power supply to the preshyheater and reactor heaters
(5) In case of dechlorination-cum-hydrodesulfurization omit Step C (Dechlorination) and continue with Step D after Step B (Chlorination)
E SHUT-DOWN
(1) Allow the reactor to cool to the ambient temperature in a nitrogen blanket
(2) Stop nitrogen flow dismantle the heaters from the reactor and disconnect the reactor from the manometer and the rest of the assembly
(3) Collect and weigh the product coal from the reactor
(4) Collect the condensate from the receiver
(5) Collect a sample of the scrubber solution
(6) Clean the reactor and accessories thoroughly
71
APPENDIX B
Procedure to Determine Sulfur Forms in Coal (ASTM Method)
PRECEDING PAGE BLANK NOT TILMED
73 ____
ANALYTICAL PROCEDURE TO DETERMINE SULFUR FORMS IN COAL (ASTM METHOD)
A SUMMARY OF THE METHOD
(1) Sulfate sulfur is determined by extracting a weighed sample of coal with dilute hydrochloric acid followed by precipitation with barium chloride (BaCI2) and weighing the precipitate as barium sulfate (BaS04) Sulfate sulfur is soluble in diluted hydrochloric acid while pyritic and organic forms of sulfur are not
(2) Pyritic sulfur is determined by extracting a weighed sample of coal with dilute nitric acid followed by titrimetric or atomic absorption determination of iron in the extract as a measure of pyritic sulfur Extraction of pyritic sulfur from coal with dilute nitric acid involves the oxidation of ferrous iron to ferric iron and sulfide sulfur to sulfate sulfur both of which are soluble in nitric acid Since a small amount of organic sulfur is also dissolved along with sulfate and pyritic sulfur during extraction the dissolved sulfur is not a reliable measure of pyritic sulfur Consequently it is estimated by determining the amount of iron present in the pyrite which is obtained from the difference between nitric acid and hydrochloric acid soluble iron However there are certain limitations to the use of sulfate sulfur residue for the determination of pyritic sulfur in coal For example if pyritic iron is high then the large sample required for determining the small amounts of sulfate sulfur will contain large quantities of iron and may require dilution In addition the determination of pyritic iron cannot be carried out until both extractions for sulfur have been completed
(3) Organic sulfur is determined by subtracting the sum of sulfate sulfur and pyritic sulfur from the total sulfur as determined by the Eschka Method (ASTM Method D-3177)
B REAGENTS
(1) Barium chloride solution (100 gl) - Dissolve 100 g of barium chloride (BaCl 2 bull 2H20) in water and dilute to 1000 ml
(2) Hydrochloric acid (2 + 3) - Mix 2 volumes of concentrated hydrochloric acid (specific gravity 119) with 3 volumes of water
(3) Hydrochloric acid (I + 23) - Mix 1 volume of concentrated hydrochloric acid (specific gravity 119) with 23 volumes of water
PRECEDING PAGE BLANK NOT FILMED 04shy
(4) Nitric acid (I + 7) - Mix 1 volume of concentrated nitric acid (specific gravity 142) with 7 volumes of water
C PROCEDURE
1 Sulfate Sulfur
a Extraction of sulfate sulfur Weigh to the nearest 01 mg about 5 g of thoroughly mixed air-dried coal that has been ground to pass a No 60 sieve transfer to a 250-mi Erlenmeyer flask and add 50 ml of HC] (2 + 3) Fit the cold-finger condenser into the neck of the flask place on a hot plate and boil for 30 min Rinse the cold-finger condenser into a flask with HC (1+ 23) and filter through a medium textured double acid-washed filter paper into a 400-ml beaker Transfer the residue to the filter wash six times with HCl (1 + 23) using a total of about 35 ml and determine sulfate sulfur in the filtrate as decribed in (b)and (c)below The residual coal may be retained for the determination of pyritic sulfur Discard the residual coal if separate sample isused for the pyritic sulfur determination
b Removal of iron To the filtrate obtained from (a)above add 10 ml of saturated bromine water cover with a watch glass and boil for 5 min to ensure that all iron is in the ferric state Expell excess bromine Precipitateiron by slowly adding NH40H (specific gravity 090)until a slight excess is present then add 5 ml more while stirring to coagulate the yellowish brown ferric hydroxide precipitate Place the covered beaker on a hot plate and boil for I min Filter the iron precipitate using an ashless medium-texture filter paper and collect the filtrate in a 600-ml beaker Wash the precipitate several times with hot water to which a trace of NH4OH and NH4Cl has been added Retain the filtrate with washings for the determination of sulfur and the preshycipitate with the original beaker for the determination of non-pyritic iron
c Final determination of sulfate sulfur Neutralize the filtrate from (b)above with concentrated HCI (specificgravity 119) and add an excess of about 1 ml using methyl orange as an indicator Heat the solution to boiling and while stirring add 10 ml of BaCl2 solushytion drop by drop Continue boiling the solution for 15 min and allow to simmer for 2 h just below boiling Filter through an ashless filter paper and wash the precipitate repeatedly with hot water until silver nitrate (AgNO3) solution shows no precipitate with 1 drop of the filtrate Place the wet filter paper conshytaining the precipitate of barium sulfate (BaS04) in a weighed platinum porcelain silica or refractory
76
crucible allowing a free access of air by folding the paper over the precipitate loosely to prevent spattering Smoke the paper off gradually and at no time allow it to burn with a flame After the paper is almost consumed raise the temperature to approximately 9250C and heat to constant weight The value so obtained and corrected for the blank determination (see d below) represents the sulfate sulfur of the coal
d Make a blank determination following the same procedure and using the same amounts of all reagents as described in Steps (a) (b) and (c) above
2 Pyritic Sulfur
a Transfer the sample obtained from the HCl extraction of sulfate sulfur to a 250-ml Erlenmeyer flask and add 50 ml of HNO 3 (1 + 7) Fit a cold-finger condenser into the neck of the flask and either boil for 30 min or let it stand overnight at room temperature Rinse the coldshyfinger condensor with HNO3 (I + 7) filter the contents of the flask through a medium-texture double acid-washed filter paper and wash six times with HNO 3 (1 + 7) coshyllecting the filtrate and washings in a 600-ml beaker Discard the residual coal on the filter paper and retain the filtrate for determination of iron which is a measure of pyritic sulfur in coal
Alternative method for determination of iron by Atomic Absorption Spectroscopy - Dilute the filtrate obtained in (a) above to 200 ml with water Transfer a 50-ml aliquot of this solution to a 200-ml volumetric flask and add 10 ml of lanthanum solution (weight of sample may be varied to eliminate aliquot) Dilute to volume with water Prepare a standard by combining 10 ml of 1000 ppm iron solution and 10 ml of lanthanum solution in a 100 ml volumetric flask and diluting to volume with water Prepare a blank solution by combining 30 ml of HNO3 (1 + 7) and 10 ml of lanthanum solution in a 100 ml volushymetric flask and diluting to volume with water Detershymine absorbences of the blank solution standard and the sample at 372 nm using an air-acetylene flame
NOTE 1 The wavelength of 372 nm is chosen for the determination to provide a less sensitive line and wider linear range for the iron absorbence Linearity exists with concentration in this range for iron absorbence Linearity in this range of iron concentration should be checked for each individual instrumental step and approshypriate dilutions made if necessary Alternatively the 2483 nm line may be used
NOTE 2 If concentration mode is used and the unknown is bracketed a blank is unnecessary
77
3 Calculation
a Sulfate sulfur Calculate the percentage of sulfate sulfur in coal as follows
Sulfate Sulfur = [(A-B) x 13735]W
where =A g of BaSO4 precipitate
B = g of BaSOi in the blank W =g of sample
b Calculate the percentage of pyritic sulfur when the iron determination is made by atomic absorption as follows
Pyritic Sulfur T-TC-A=4- 58
where
A = absorbence of blank B = absorbence of standard C = absorbence of sample W = weight of sample extracted as selected for
sulfate or pyritic determination
If values higher than 5 pyritic sulfur are obtained a new sample solution should be prepared from 20 ml of the filtrate (Section 2 (a)) and 10 ml of lanthanum solushytion diluted to 100 ml and the value obtained with this solution x 25 = percent pyritic sulfur
c Organic Sulfur The percentage of organic sulfur is obtained by subtracting the sum of the percentages of sulfate and pyritic sulfur from the percentage of total sulfur as determined by the Eschka Method
4 Precision
a Repeatability Results of consecutive determinations carried out on the same sample in the same laboratory bythe same operator using the same apparatus should not differ by more than the following
(1) Sulfate Sulfur 002 (2) Pyritic Sulfur (under 2) 005 (3) Pyritic Sulfur (over 2) 010
b Reproducibility The means of results of duplicate determinations carried out by different laboratories on representative samples taken from the same bulk sample should not differ by more than the following
(1) Sulfate Sulfur 004 (2) Pyritic Sulfur (under 2) 030 (3) Pyritic Sulfur (over 2) 040
78
ALTERNATIVE METHOD FOR THE DETERMINATION OF FORMS OF SULFUR IN COAL
i alternative method for the determination of forms of sulfur incoal can be immarized as follows the pyritic sulfur content inthe coal isdetermined the oxidation of pyrite to ferric sulfate and subsequent estimation gravishytrically as barium sulfate rather than by atomic absorption estimation of on as described inthe ASTM method
A REAGENTS
I Bromine Water Reagent grade bromine is added to distilled water until a saturated solution isobtained The bromine saturated water is decanted off to-make reagent (see 2 below)
2 BromineHC1 Solution Add 250 ml of concentrated HCI to 250 ml of water and add 500 ml of saturated bromine water mixing well
3 Barium Chloride Solution 10 (WV) in water
4 HCI Solution for Sulfate Sulfur Determination HClH20 (23 by volume)
5 HN0 Solution for Pyritic Sulfur Determination HN0 3H20 (Iby volume)
B PROCEDURE
1 1 g of coal isweighed into a 250-m beaker 50 ml of HCI (23) are added and the sample is refluxed for 12 - 34 h
2 The solution iscooled filtered through 11 cm No 40 Whatman filter paper and washed with hot distilled water The filshytrate and washings are collected in a 400-ml beaker while the filter paper and residue are placed inthe original beaker
3 The filtrate from (2)above is adjusted to a methyl orange end-point (pH 3-4) if necessary and heated to boiling BaCl 2 solution is slowly added with stirring The solution is allowed to sit for 1 h at this temperature and then kept overnight at room temperature The BaS0 4 precipitate is collected over 11 cm No 42 Whatman filter paper and washed with-hot distilled water until free of the chloride ion The filter paper isthen ignited off and the BaSO4 is ignited at about 925degC for 12 h cooled and weighed
wt of BaSO 4 x 1374 Sulfate Sulfur - _________
wt of sample
79
4 The filter paper and residue from (2) above is placed in the original 250-m beaker and macerated with a glass rod 50 ml of HNO3 are then added and the contents are refluxed for 12 - 34 h
5 The solution is filtered through 15 cm No 40 Whatman filter paper and washed with hot distilled water The filtrate and washings are collected in a 400-ml beaker adjusted to methyl orange end-point if necessary and 10 ml of bromine waterHCl solution are added The solution is boiled until clear and BaCl 2 solution is added The rest of the procedure is the same as described in (3) above
wt of BaSO 4 x 1374 Pyritic Sulfur = _________
wt of sample
NOTE The BaSO4 precipitate is washed with hot dilute HCI (125) if an appreciable discoloration due to iron is noted
III DETERMINATION OF TOTAL SULFUR BY ESCHKA METHOD (ASTM D3177-73)
A SUMMARY OF THE METHOD
The Eschka method involves mixing a coal sample with a mixture of MgO and Na2CO3 (called the Eschka mixture) and igniting the mixture in a bomb calorimeter under 30 atm of oxygen The SO produced by combustion is absorbed by the Eschka mixture and is converted to the sulfate form The residue in the bomb is leached with hot water and the sulfate is precipitated as BaSO4 After the BaSO4 is filtered and dried it is weighed to give the total sulfur in coal
B PROCEDURE
The basic procedure involves mixing intimately about 1 g of coal with 3 g of Eschka mixture (2 g calcined MgO + 1 g anhydrous Na2CO) Approximately 1 g of this mixture is placed in a bomb calorimeter and filled to 30 atm with oxygen The bomb is placed in a water bath the mixture is ignited and the bomb is allowed to cool for- at least 10 min The pressure is then slowly released and the bomb and the residue are thoroughly washed with hot water The residue is digested with hot water for about 1 h after which it is filtered and the insoluble residue is washed at least 5 times with hot water The filtrate is made slightly acidic with dilute HCl heated to boiling and excess BaC1 2 solution is added drop by drop while stirring The heating is continued for another hour
80
after which the precipitate is filtered washed with hot water until the washings are free of the chloride ion dried and weighed The amount of total sulfur in the sample is estimated as follows
wt of BaSO4 Precipitate x 1375 Total Sulfur w fsml wt of sample
81
APPENDIX C
MODIFIED LECO METHOD FOR TOTAL SULFUR AND CHLORINE DETERMINATION IN COAL
PRECEDING PAGE BLANK NOT FILMED
83
MODIFIED LECO METHOD FOR TOTAL SULFUR AND CHLORINE DETERMINATION IN COAL
I SUMMARY OF THE METHOD
A coal sample is burned at 1300 to 1350C in a flowing medium of oxyshygen The sulfur dioxide sulfur trioxide and chlorine formed are absorbed in a hydrogen peroxide solution producing sulfuric and hydroshychloric acids The total acid content is determined by titration with standard sodium hydroxide solution The titrated solution is further treated with mercuric oxycyanide solution to provide correction to the total acid determined as above for the hydrochloric acid content
A REAGENTS
(1) 005 N standard sodium hydroxide solution
(2) 001 N standard sulfuric acid solution or prepared by diluting 01 N standard solution
(3) Mercuric Oxycyanide Solution Dissolve 025 g of mercuric oxycyanide powder in 20 ml of distilled water Prepare one portion per sample-boat and four portions for blanks for each set of samples Discard this solution into the titration waste container if it is not used in 2 or 3 days
NOTE Mercuric oxycyanide is highly poisonous and will explode when touched by flame or by percussion
(4) Hydrogen Peroxide Solution (1) Dilute 100 ml of 30 H202 solution with distilled water to 3 1 Discard this solution if not used for 2 or 3 days
(5) Methyl Purple Indicator Solution
B APPARATUS
Use LECO Model No 534-500 total sulfur analyzer equipped with Model No 571-500 (2-tube 15 kW) resistance furnace and Model No 517200 (manually operated) acid-base titration unit
II PROCEDURE
A START-UP
1 Preheat resistance furnace to a temperature of 1350degC
2 Prepare hydrogen peroxide and mercuric oxycyanide solutions
PRECEDING PAGE BLANK NOr FILIfa 4
3 Place the oxygen baffle in the combustion tube fill the titration vessel with hydrogen peroxide solution and adjust the oxygen flow to 1 1min
4 Fill pre-cleaned back titration buretts with fresh sulfuric acid and sodium hydroxide solutions
5 Make sure that there is sufficient capacity in the titration waste container to receive the days waste
B SAMPLE ANALYSIS SEQUENCE
1 Weigh about 02 g of the coal sample to the nearest 01 mg and spread it in a clay combustion boat
2 Fill the titration vessel half full with 1 hydrogen peroxide solution Add 10 drops of methyl purple indicator solution and adjust the pH with dilute sulfuric acid (001 N) until the green colour just turns gray or reaches the green-gray transition
3 Put the boat containing the coal sample in the combustion tube so that the center of the boat is four inches from the center of the hot zone and replace the oxygen baffle
4 After 1-12 min push the boat into the center of the hot zone removing the oxygen baffle only as long as necessary to pershyform the operation quickly
5 After 7 min of combustion (5-12 min with the boat in the hot zone) titrate with 005 N sodium hydroxide solution until the purple colour fades just short of the end-point
6 After 8 min of combustion (6-12 min with the boat in the hot zone) disconnect the rubber hose from the ceramic combustion tube outlet and rinse the rubber hose and bubbler three times with distilled water into the titration vessel
7 Reconnect the rubber hose to the combustion tube and complete the titration with sodium hydroxide solution
8 Add 20 ml of mercuric oxycyanide solution to the contents of the titration vessel
9 Titrate the liberated hydroxyl ion with dilute (001 N) sulshyfuric acid solution
10 Drain and rinse the titration vessel and remove the boat from the combustion tube
86
C SHUTDOWN
1 For each set of samples run a dilute sulfuric acid (001 N) blank in triplicate on the mercuric oxycyanide solution
2 Reduce the furnace temperature to 816 0C
NOTE For optimum performance of the furnace heating eleshyments the temperature should not go down below 816 0C even during periods it is not being used
D CALCULATION
S = wt sulfur in coal (as determined basis)
A = units of 005 N sodium hydroxide used (LECO burette units)
B = ml of 001 N sulfuric acid used in full determination
C = ml of 001 N sulfuric acid used in blank determination for the mercuric oxycyanide solution
W = weight of sample in grams
Cl = wt of chlorine in coal (as determined basis)
R = 1133 if no standards are run with the sample set otherwise
known sulfur content of the standard coal average sulfur content by titration of three standard samples
S R x 05 A (B-C)- W 3128
Cl =-x 00355W
87
APPENDIX D
SURFACE AREA AND PORE VOLUME DETERMINATION BY LOW TEMPERATURE NITROGEN ADSORPTION
PRECEDING PAGE BLANK NOT FILMED
89 J
SURFACE AREA AND PORE VOLUME DETERMINATION BY LOW TEMPERATURE NITROGEN ADSORPTION
SUMMARY OF THE METHOD
Surface area of a solid is determined by physical adsorption of an adsorbate at its boiling point In general by nitrogen adsorption at liquid nitrogen temperatures the quantity of gas required to form a complete monolayer of gas molecules ismeasured The surface area of the solid is then calculated using the cross-sectional area of the gas molecule Outgassing of the sample before measuring the amount of gas adsorbed isessential to ensure reproducible results While many theories on gas-aasorption have been proposed adsorption measurements are generally interpreted using the BET Theory (Brunauer Emmett and Teller) for multilayer adsorption
I BET DETERMINATION
Three factors must be known in order to determine the specific surface area (area per gram) of a powder sample
(1) Weight of the sample
(2) Relative pressure
(3) Weight of adsorbate adsorbed on the sample surface as a function of relative pressure in the range 005 lt PPo lt 035
The assumptions restrictions and applications of BET multilayer theory are discussed in all modern texts on surface chemistry The reversible adsorption of an adsorbate is given by the BET equation as
1 C -l P CXmC P0XmP l
where
x = weight of adsorbate adsorbed at relative pressure PPo
P = partial pressure of adsorbate
Po = saturated vapour pressure of adsorbate
xm = weight of adsorbate required to completely-cover one monolayer
C = a constant that is a function of the heat of condensation and adsorption of the adsorbate
PAGE BLANK NOT FILMEDPRECEDING
91ORq
The BET equation yields a straight line when is plotted
L[(P-i)]
versus PPo The value of x the weight adsorbed for a monoshylayer can be calculated from the slope and intercept of the BET plot as follows
C-S= Slope
1 I = Intercept Xm C
Solving for xm yields
xm = 1
NOTE The BET plot is usually found to be linear in the range PPO = 005-035 Thus data outside this range should be avoided
The total surface area of the sample St is calculated using the following equation
km N Acs St Ma
Ma
where
xm = weight of adsorbate required for one monolayer
N = Avagadros Number (6023 x 1023)
Acs Cross-sectional area of the adsorbate molecule (as given in the Table 13)
Ma Molecular weight of the adsorbate
The specific surface area of the sample is given by
S = Stweight of sample
92
Table 13 Effective Molecular Areas of Various Adsorbates
Area m2 x 1020Adsorbate
aNitrogen 162
Krypton 195
Argon 142
Xenon 250
Oxygen 140
Ethane 205
Butane 469
aNitrogen is usually the preferred adsorbate since the cross-sectional area
has been exactly determined by several investigators
I SINGLE POINT BET METHOD
SUMMARY OF THE METHOD
This simplified method as an alternative to the multipoint BET Method is based on the fact that the intercept in a BET plot with nitrogen as the adsorbate is generally small when compared to the slope and hence can be ignored If the intercept is assumed to be zero the value of xm tends to be excessively large However this is somewhat compensated as the measured value of the slope tends to increase if the intercept is assumed to be zero
By assuming the intercept to be zero the BET equation is simplified as
1 =1 PP x (PoP-I) xm
or
xm = x (I-PP o)
Thus by measuring the amount of adsorbate adsorbed at a single value of PPo (preferably PPo = 03) the monolayer volume xm can be calculated
93
Substituting the value of xm the specific surface area (m2g) of
the sample with N2 as the adsorbate is calculated as
398 x x S - m wt of sample
IV PORE VOLUME AND PORE RADIUS
SUMMARY OF THE METHOD
Vapours in equilibrium with a liquid contained in fine capillaries or pores will have depressed vapour pressures In fact if the pore is sufficiently small in diameter the vapours will condense at pressures far below the normal According to Kelvin equation nitrogen gas will condense into all pores with radii less than 1500 A at a relative pressure of 099 Thus by measuring the volume of nitrogen adsorbed at a relative pressure of 099 and knowing the surface area the average pore volume and the mean pore diameter can be calculated
PROCEDURE
After thoroughly degassing a sample adsorb a concentration of adsorbate corresponding to PPo = 099 (Any value in the range 096 to 099 will be suitable) When adsorption is complete as indicated by a return to baseline on the recorder remove the liquid nitrogen bath and desorb the adsorbate Calibrate the signal with pure adsorbate Convert the volume of nitrogen adsorbed to the volume of liquid nitrogen held in the pores using the equation
Pa Vads Vliq - RT Vm
where
Pa = ambient pressure
Vads = volume adsorbed per gram of adsorbent
T = ambient temperature
Vm = molar volume of liquid adsorbate (347 cm 3for N2)
94
Assuming that all the pores are uniform and cylindrical the mean pore diameter is given by
= V0d (A)
where Vliq is the volume of all pores in the sample with a specific surface area S
95
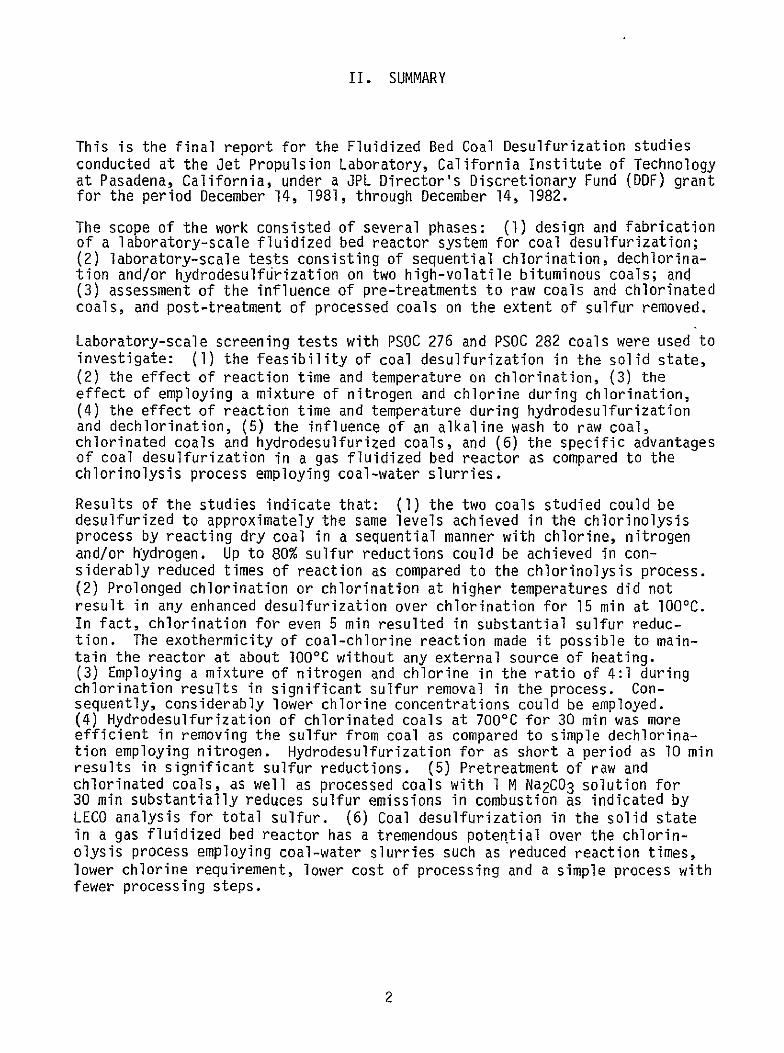
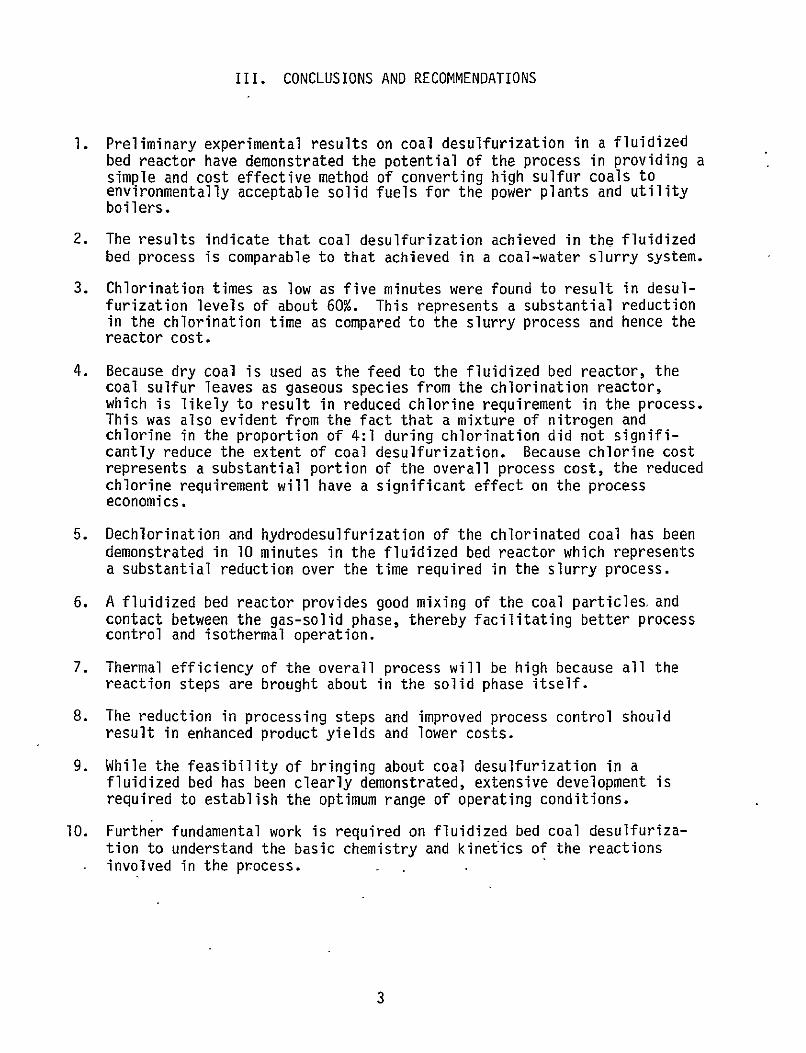