Embed Size (px)
Citation preview

International Journal of Arts and Sciences 3(7): 199 - 210 (2010)
CD-ROM. ISSN: 1944-6934 © InternationalJournal.org
A New Pattern Search Method for Detecting and Forecasting Portfolio Risk Using Local Alignment Technique*
Hyong-Jun Kim, Pusan National University, Korea Seong-Min Yoon, Pusan National University, Korea Yeonjeong Lee, Pusan National University, Korea Hwan-Gue Cho†
, Pusan National University, Korea
Abstract: It is very important to minimize the risk in portfolio selection. For minimizing risk of portfolio at a given expected returns, it is efficient to compose portfolio with stocks which have low cross-correlation among them. In this regard, forecasting the cross-correlations among stock prices has attracted much interest among investors and financial market researchers. Most of studies investigating cross-correlations among stock prices assume that the cross-correlations are static. But the cross-correlations in real stock markets are changing over time. Thus the dynamic clustering property and ensemble average can provide very useful methodology to calculate the time-dependent cross-correlations. In this paper, we investigated the dynamics of cross-correlations among stock prices using local alignment technique. Local alignment technique of bioinformatics can be applied to analyzing stock market and detect similar patterns in the fluctuation of stock prices during a certain time period. This information can be utilized in analyzing and forecasting the time-dependent cross-correlations. This paper applied local alignment technique to the time series data of Korean stock market and found that an investor can forecast the risk of his asset portfolio and manage it optimally. Keywords: Forecasting portfolio risk; Pattern analysis; Time-dependent cross-correlation; Korean stock market 1. Introduction It is very important to investigate correlations of stocks for stock investment. First, we can use past stock movement to predict future movement of similar stocks. Technical analysis is based on these assumptions. It believes that there exists patterns in past stock data, so if we can find patterns, we can predict future stocks in short terms. Second, searching correlations of stocks can use for making portfolio optimization to minimizing risks. Similar stocks have similar risks. If we make portfolio with stocks that have no relations to each other, we can neutralize these risks. Many studies on investigation the time-dependent cross-correlations between stock assumes that the cross-correlations between stock is static. The time-dependent
* This work was supported by the Korea Research Foundation Grant funded by the Korean Government (KRF–2009–371–B00008).
† Corresponding author. Tel.: +82-51-510-2283; fax: +82-51-515-2208. E-mail address: [email protected] (H.-G. Cho).

International Journal of Arts and Sciences 3(7): 199 - 210 (2010)
CD-ROM. ISSN: 1944-6934 © InternationalJournal.org
correlations between the indices of different stock exchanges were already studied (Choujaa and Dulay, 2009). They showed that there exists a time shift in the cross-correlations that arises from the fact that the different stock markets are open in different time cycles during the day as the Earth rotates. But cross-correlations between stocks are changed on time. In this paper, we studied dynamic cross-correlations between stocks by local alignments using in bioinformatics. Local alignments give similar patterns in stocks in certain time, so we can use the information for investigating the time-dependent cross-correlations. We can get the stable portfolio optimization by selecting stocks with no weakly cross-correlations in KOSPI data from 2007-01 to 2008-02. 2. Related Work 2.1. Pattern Search in Stock Data According to the “Efficient Market Hypothesis” suggested by Fama (1970), stock prices reflect all the information at that moment, so we cannot predict stock price solely using past stock data. That is, no stock time-series has the same historical information. Fama argued the price of a stock follows a random walk. Nevertheless, many stock pattern search models and techniques have been developed based on the stock price history. This discipline is commonly referred to as technical analysis. Stock prediction using computer science has based on such technical analysis. Many algorithms attempt to develop stock prediction by searching patterns in past stock data. Neural network is a popular method (Ivanov, et al., 2004). A neural network learns complex patterns quickly. However pattern learning depends on test data. If test data have problems, prediction accuracy decreases. Another method of stock price prediction is simulating human judgment (Kullmann, Kertész and Kaski, 2002). When people predict stock prices, they use some kinds of landmark. However this system also depends on test data. One study introduced the treatment of stock data as time-series sequential data to predict stock price (Kwon, Hoos and Ng, 2003). This algorithm analyzes result to obtain fast predictions but it takes time to analyze predicted results. Using alignment to predict time-series data is another method (Lee and Jo, 1997; Nayak and te Braak, 2007). This method assumes that there exist pattern in time-series data. Such methods assume that the stock price has some regular patterns or movements. Until now, few studies examine stock patterns. Thus, the stock prediction is referred to as a ‘pseudo science.’ In the community of bioinformatics, there is the DNA sequence alignment method for two different base pairs. These alignment methods can be used in comparing the homology of two different individuals. We employed this DNA sequence alignment method (Pagan, 1996) to detecting patterns in two different stock indices.
International Journal of Arts and Sciences 3(7): 199 - 210 (2010)
CD-ROM. ISSN: 1944-6934 © InternationalJournal.org
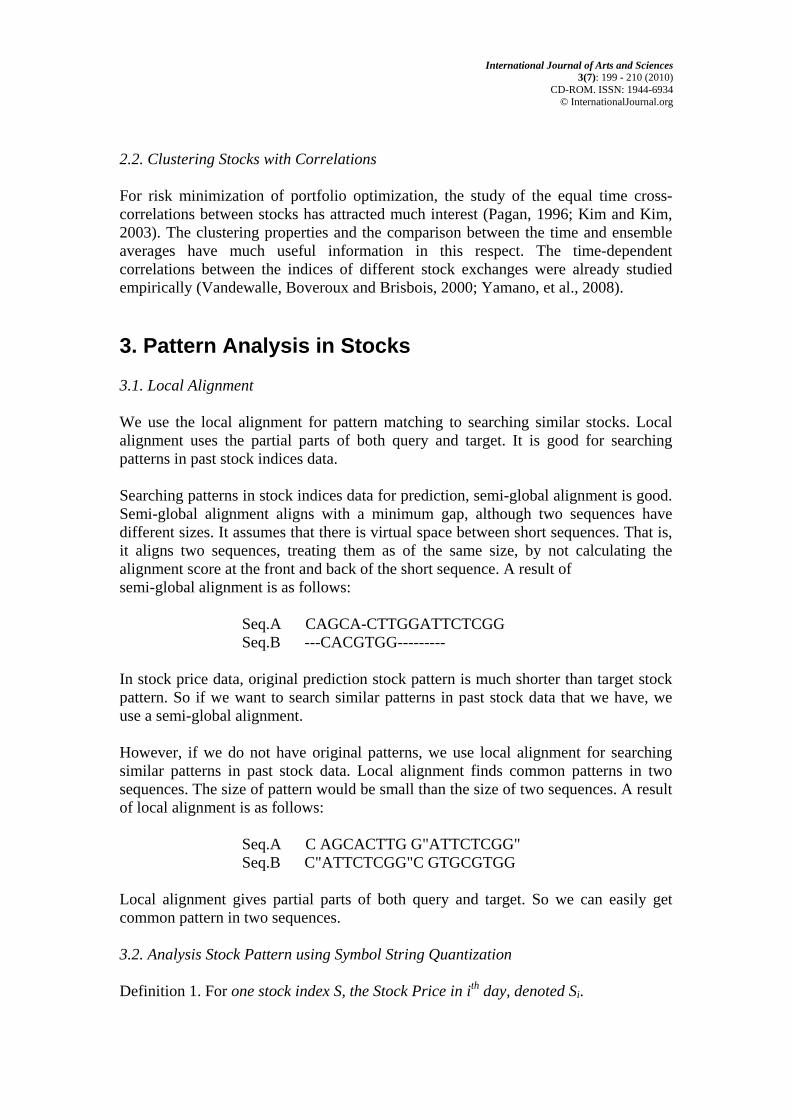
2.2. Clustering Stocks with Correlations For risk minimization of portfolio optimization, the study of the equal time cross-correlations between stocks has attracted much interest (Pagan, 1996; Kim and Kim, 2003). The clustering properties and the comparison between the time and ensemble averages have much useful information in this respect. The time-dependent correlations between the indices of different stock exchanges were already studied empirically (Vandewalle, Boveroux and Brisbois, 2000; Yamano, et al., 2008). 3. Pattern Analysis in Stocks 3.1. Local Alignment We use the local alignment for pattern matching to searching similar stocks. Local alignment uses the partial parts of both query and target. It is good for searching patterns in past stock indices data. Searching patterns in stock indices data for prediction, semi-global alignment is good. Semi-global alignment aligns with a minimum gap, although two sequences have different sizes. It assumes that there is virtual space between short sequences. That is, it aligns two sequences, treating them as of the same size, by not calculating the alignment score at the front and back of the short sequence. A result of semi-global alignment is as follows:
Seq.A CAGCA-CTTGGATTCTCGG Seq.B ---CACGTGG---------
In stock price data, original prediction stock pattern is much shorter than target stock pattern. So if we want to search similar patterns in past stock data that we have, we use a semi-global alignment. However, if we do not have original patterns, we use local alignment for searching similar patterns in past stock data. Local alignment finds common patterns in two sequences. The size of pattern would be small than the size of two sequences. A result of local alignment is as follows:
Seq.A C AGCACTTG G"ATTCTCGG" Seq.B C"ATTCTCGG"C GTGCGTGG
Local alignment gives partial parts of both query and target. So we can easily get common pattern in two sequences. 3.2. Analysis Stock Pattern using Symbol String Quantization Definition 1. For one stock index S, the Stock Price in ith day, denoted Si.
International Journal of Arts and Sciences 3(7): 199 - 210 (2010)
CD-ROM. ISSN: 1944-6934 © InternationalJournal.org
Closing prices of daily stock have big variations among the stock indices, so we cannot analyze stock prices well. Due to this problem, we use logarithmic model for stock price calculation. Definition 2. For one stock index S, the Logarithmic model in ith day, denoted S(i), is defined as follows:
( ) ln ( 1 ) ln ( 1)S i Y i i Y i= − + ∆ − − .
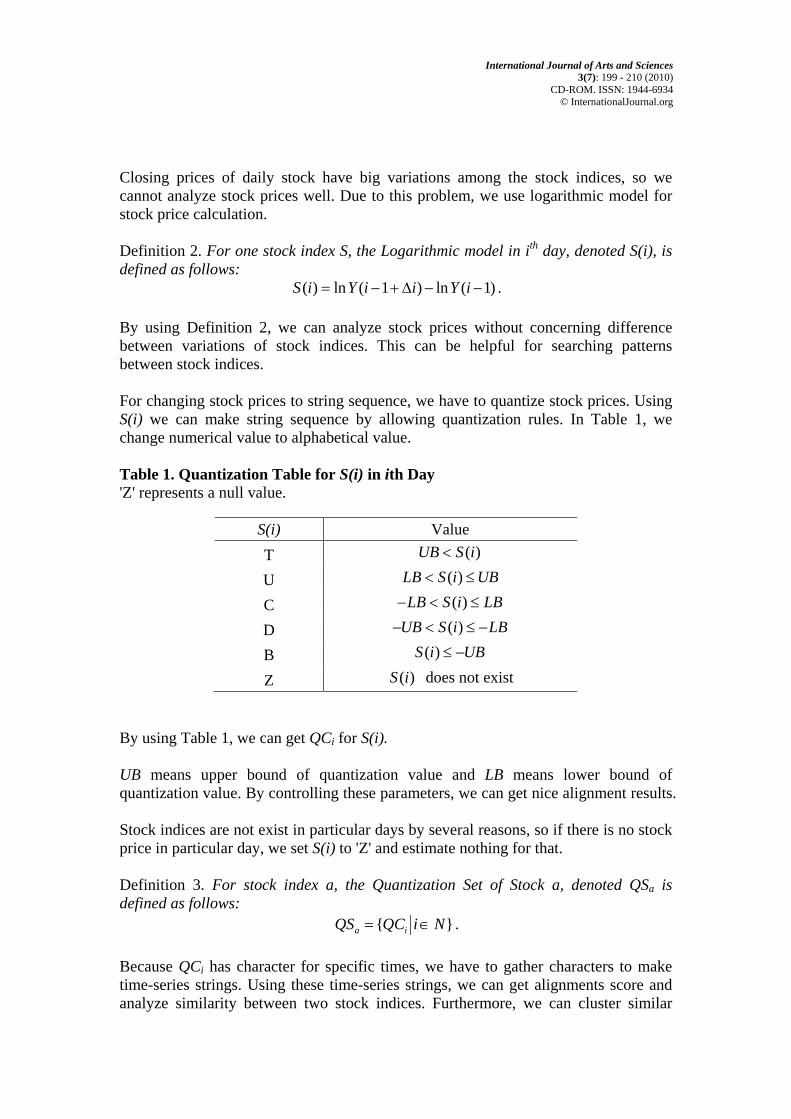
By using Definition 2, we can analyze stock prices without concerning difference between variations of stock indices. This can be helpful for searching patterns between stock indices. For changing stock prices to string sequence, we have to quantize stock prices. Using S(i) we can make string sequence by allowing quantization rules. In Table 1, we change numerical value to alphabetical value. Table 1. Quantization Table for S(i) in ith Day 'Z' represents a null value.
S(i) Value T ( )UB S i<
U ( )LB S i UB< ≤
C ( )LB S i LB− < ≤
D ( )UB S i LB− < ≤ −
B ( )S i UB≤ −
Z ( )S i does not exist By using Table 1, we can get QCi for S(i). UB means upper bound of quantization value and LB means lower bound of quantization value. By controlling these parameters, we can get nice alignment results. Stock indices are not exist in particular days by several reasons, so if there is no stock price in particular day, we set S(i) to 'Z' and estimate nothing for that. Definition 3. For stock index a, the Quantization Set of Stock a, denoted QSa is defined as follows:
{ }a iQS QC i N= ∈ .
Because QCi has character for specific times, we have to gather characters to make time-series strings. Using these time-series strings, we can get alignments score and analyze similarity between two stock indices. Furthermore, we can cluster similar
International Journal of Arts and Sciences 3(7): 199 - 210 (2010)
CD-ROM. ISSN: 1944-6934 © InternationalJournal.org
stock indices. Definition 4. For the Quantization sets of two different stocks, QSa and QSb, the Local Alignment Score, denoted LA(a; b), is defined as follows:
( , ) ( , )a bLA a b LAS QS QS= .
Using Definition 4, we can get Local Alignment Score LAw(a; b). This can be helpful for searching patterns in stock indices. 4. Influence Searching in Stocks By using patterns we searched, we can generate stock influence graph. But we have to filter alignment result for using stock influence graph. Definition 5. For one stock local alignment score LAw(a; b), the local alignment result string for a denotes LS(a). By using definition 5, we can get the LS(a) and LS(b). LS(a) contains partial part of QSa and gap character. Definition 6. For stock index a, the Start Point of LS(a), denoted LBegin(a), is defined as position of QSa where pattern begins. Sequence QSa and QSb
is not same, so LBegin(a) and LBegin(b) can be same or not. This is time gap between Stocks a and b, and defined as follows:
Definition 7. For stock index a and b, the Time Difference of pattern denoted ∆ t(a; b), is defined as follows:
( , ) ( ) ( )t a b LBegin a LBegin b∆ = − .
Using definition 7, we can filter local alignment pairs for generating stock influence graph. Local alignment pairs for stock influence graph have to meet following conditions:
• ( , )LA a b p≥ , where p is local alignment threshold parameter.
• 0 ( , )t a b q≤ ∆ ≤ , where q is time difference threshold parameter. Parameter p is local alignment threshold parameter. This parameter represents size of LS(a). We supposed p as a week. Parameter q is time difference threshold parameter. Patterns are widespread in Stock indices data and points of pattern beginning can be same or not. So we assume that if pattern is caused by stock influence, it will have bigger time difference than q because size of stock market is not infinity. In our experiment, we assume q as ten days.

International Journal of Arts and Sciences 3(7): 199 - 210 (2010)
CD-ROM. ISSN: 1944-6934 © InternationalJournal.org
Table 2. Properties of KOSPI Data Set Total count of days is 286 and total number of indices is 689.
Properties Value Start Date 2007/01/03 End Date 2008/02/28
Num. of index 689 Num. of date 286
5. Experiments To evaluate our algorithms for searching influences between stock indices, we use KOSPI stock indices from 2007/01/03 to 2008/02/28 for our test data. Table 2 shows properties of our test data set. We use 286 days of stock closing prices. And there exist many patterns in this data. 5.1. Searching Patterns in Stock Indices Data First, we experiment searching patterns in stock indices data. Table 3 shows top 10 local alignment results. Source stock index precedes target index by ∆ t days. We can find that many pairs have short time differences. Table 3. Top 10 Local Alignment Result High score shows that two stocks have relations to each other in that time.
No. Source Target Score ∆ t(day) 1 SGGlo DHpulp 229 9 2 KSSLN JSCable 218 9 3 HHI HMD 170 0 4 STX STXONS 136 0 5 TYS SMFN 130 0 6 HDEC GSCONST 121 0 7 TYS DAISHIN 121 1 8 HFN TYS 121 2 9 WOORIWM DWSEC 119 0 10 HDEC DSINFRA 117 0

International Journal of Arts and Sciences 3(7): 199 - 210 (2010)
CD-ROM. ISSN: 1944-6934 © InternationalJournal.org
Figure 1. Stock Fluctuation of SSG and DHpulp Two stock indices have similar movements in 9 days.
Figure 2. Second Top 10 Pairs of Alignment, KSS and JS They also have similar movements in 9 days.
International Journal of Arts and Sciences 3(7): 199 - 210 (2010)
CD-ROM. ISSN: 1944-6934 © InternationalJournal.org
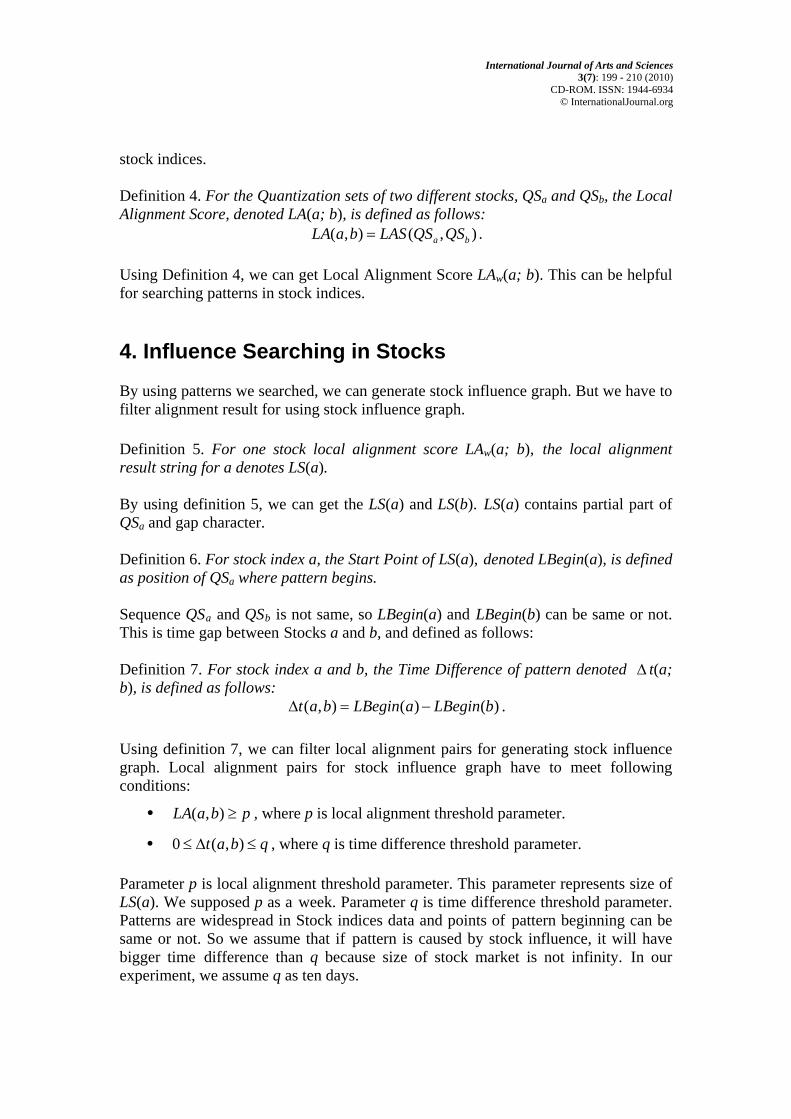
Figure 3. A Correlation Network Graph in 2008/02/26 We use KOSPI data from 2007/01/03 to 2008/02/28 and make stock influence network graph. Node with no edge shows they have no correlation to other stock indices at that moment. Directed edge shows time gaps between two nodes. Undirected edge shows that there exist no time gaps between two nodes.
Figure 1 and 2 show stock fluctuation of top 1 and 2 of alignments. Although amount of changing stock price is different, they show similar stock movements in some time gaps. This means pairs of stocks have some interactions to each others. Figure 3 shows correlation network graph of stock indices in 2008/02/26. In graph, node with no edge shows that they have no correlation to other stock indices at that moment. Directed edge shows that there are time gaps between two nodes. Source nodes are preceding target nodes. Undirected edge shows that we can determine time gaps between two nodes. Perhaps there are no time gaps or shorter than day.

International Journal of Arts and Sciences 3(7): 199 - 210 (2010)
CD-ROM. ISSN: 1944-6934 © InternationalJournal.org
Table 4. Stock Indices by Time We select 3 stocks(Samsung SDI, SsangYoung and SK) with no correlations or weak correlations.
Days Date KOSPI SMSDI SSY SK 1 2008-02-29 1,711.62 66,400 5,090 170,500 3 2008-03-03 1,671.73 65,100 4,890 168,000 7 2008-03-07 1,663.97 69,900 4,710 158,500 15 2008-03-14 1,600.26 72,300 4,700 144,500 30 2008-03-31 1,703.99 77,900 5,430 142,000 90 2008-05-29 1,841.22 78,900 4,715 161,000 180 2008-08-29 1,474.22 83,300 2,615 109,500 360 2009-02-27 1,063.03 57,500 1,225 85,500
Figure 4. Stock Price of KOSPI and Selected Stocks. It shows that selected stocks move similar to KOSPI, but have no relation to each other. 5.2. Portfolio Optimization for Risk Minimization Applying our model to the data set, we can get the stocks with no correlations or weak correlations to optimizing port folio for risk minimization. We select 3 stocks with no correlations or weak correlations, and investigate stock fluctuations by time.

International Journal of Arts and Sciences 3(7): 199 - 210 (2010)
CD-ROM. ISSN: 1944-6934 © InternationalJournal.org
Table 4 shows selected stock price changes and KOSPI changes among the time. If our portfolio gains high profits and stable volatility than KOSPI, we can tell that portfolio is well optimized for risk minimization. Table 5. Portfolio Volatility Compared to KOSPI, our portfolio has stable volatility. This means our portfolio has low profit, but less risk.
Days Date KOSPI Portfolio 1 2008-02-29 100.00% 100.00% 3 2008-03-03 97.67% 98.35% 7 2008-03-07 99.54% 97.95% 15 2008-03-14 96.17% 95.02% 30 2008-03-31 106.48% 101.73% 90 2008-05-29 108.05% 108.56% 180 2008-08-29 80.07% 79.89% 360 2009-02-27 72.11% 73.80%
Figure 5. Volatility Graph of KOSPI and Our Portfolio. It shows that our portfolio has stable volatility than KOSPI.
Figure 4 shows stock price of KOSPI and selected stocks. It shows that selected stocks move similar to KOSPI, but have no relation to each other.

International Journal of Arts and Sciences 3(7): 199 - 210 (2010)
CD-ROM. ISSN: 1944-6934 © InternationalJournal.org
Table 5 shows volatility of KOSPI and our portfolio. Our portfolio gains much profit than KOSPI and has stable volatility than KOSPI. This means our portfolio has some profit than KOSPI with less risk. But stable volatility means that we cannot get high profit than others when stock market gets up. We can see that in 30 days after from 2008/02/28. Figure 5 shows volatility of KOSPI and our portfolio by time. It shows our portfolio has stable volatility than KOSPI. This means our portfolio is well optimized for risk minimization. 6. Conclusions It is very important to investigate correlations of stocks for stock investment. First, we can use past stock movement to predict future movement of similar stocks. Technical analysis is based on these assumptions. It believes that there exists patterns in past stock data, so if we can find patterns, we can predict future stocks in short terms. Second, searching correlations of stocks can use for making portfolio optimization to minimizing risks. Similar stocks have similar risks. If we make portfolio with stocks that have no relations to each other, we can neutralize these risks. In this paper, we studied dynamic cross-correlations between stock indices by local alignments using in bioinformatics. Local alignments give similar patterns in stocks in certain time, so we can use this information for investigating the time-dependent cross-correlations. We can get the stable portfolio optimization by selecting stocks with no weakly cross-correlations in KOSPI data from 2007-01 to 2008-02. Therefore our contributions are summarized as follows: • We proposed new dynamic cross-correlation model for stock indices by using
local alignment which can represent hidden interaction between stock indices.
• We show cross-correlations between stock indices are not static but dynamic properties. It can be changed by time to time.
• By using our model, we experiment portfolio optimization for risk minimization. Our portfolio has stable volatility but less profit than KOSPI.
References Choujaa, D. & Dulay, N. (2009). Activity inference through sequence alignment.
Location and Context Awareness 5561/2009, 19 -36. Fama, E. F. (1970). Efficient capital markets: A review of theory and empirical work.
Journal of Finance 25(2), 383-417. Ivanov, P. C., Yuen, A., Podobnik, B. & Lee, Y. (2004). Common scaling patterns in
intertrade times of U.S. stocks. Phys. Rev. E 69(5), 056107.

International Journal of Arts and Sciences 3(7): 199 - 210 (2010)
CD-ROM. ISSN: 1944-6934 © InternationalJournal.org
Kim, S. G. & Kim, H. Y. (2003). The study of the financial index prediction using the equalized multi-layer arithmetic neural network. Journal of Korea Society of Computer Information 8(3), 113-123.
Kullmann, L., Kertész, J. & Kaski, K. (2002). Time-dependent cross-correlations between different stock returns: A directed network of influence. Phys. Rev. E 66(2), 026125.
Kwon, A. T., Hoos, H. H. & Ng, R. (2003). Inference of transcriptional regulation relationships from gene expression data. Bioinformatics 19(8), 905-912.
Lee, K. H. & Jo, G. S. (1997). Expert system for predicting stock market timing using a candlestick chart. Expert Systems with Applications 16(4), 357-364.
Nayak, R. & te Braak, P. (2007). Temporal pattern matching for the prediction of stock prices. Proceedings of AIDM 2007, 95-103.
Pagan, A. (1996). The econometrics of financial markets. Journal of Empirical Finance 3(1), 15-102.
Vandewalle, N., Boveroux, P. & Brisbois, F. (2000). Domino effect for world market fluctuations. European Physical Journal B 15, 547-549.
Yamano, T., Sato, K., Kaizoji, T., Rost, J.-M. & Pichl, L. (2008). Symbolic analysis of indicator time series by quantitative sequence alignment. Computational Statistics and Data Analysis 53(2), 486-495.


