Embed Size (px)
Citation preview
Fluid Flow Conditioning
2017
Flow Conditioning
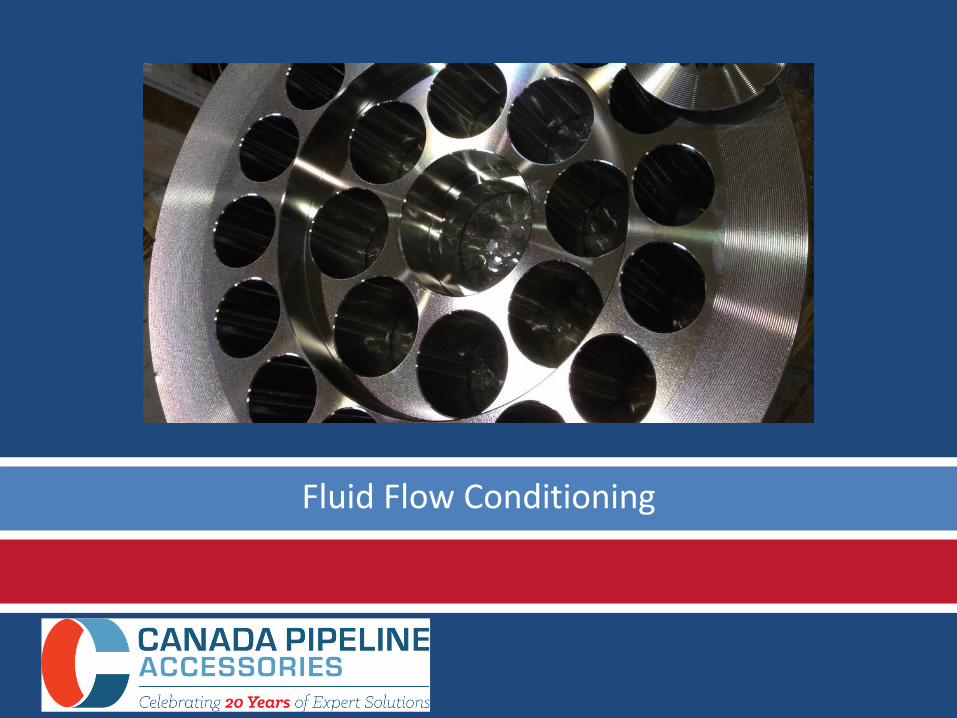
• There is no flow meter on the market that needs flow conditioning.
• All flow meters are effective without any type of flow conditioning.
• APPLICABLE TO ALL LIQUIDS AND GASES
2017
Flow Conditioning
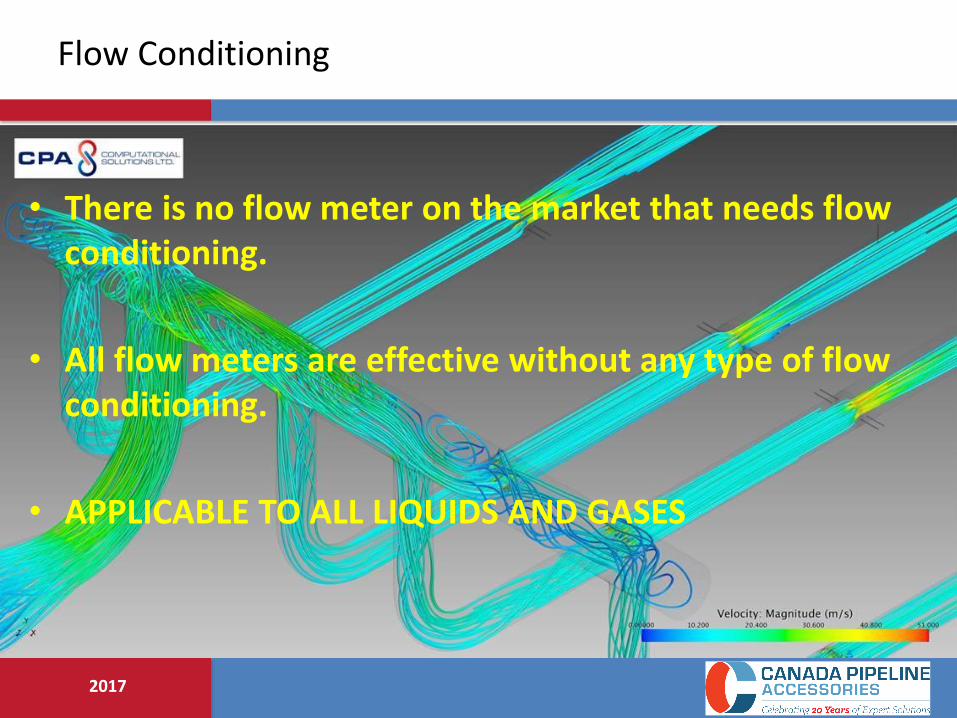
Why do we want to use flow conditioners then?
• Can eliminate up to 80 – 95% of pipeline swirl.
• Attempt to restore flow profile symmetry and eliminate distortions.
• Isolates the flow meter from upstream disturbances.
• Allows much shorter meter runs to be used with much higher repeatability.
• Improves the benefits of many USM diagnostics by providing flow stability.
• Helps with noise or pulsation problems.
• Helps balance the pressure, velocity and flow rate of meter tubes running in parallel.
• They UNLOAD the flow meter, helping it become even more accurate.

2017
What is a Flow Conditioner?
Four general types of flow conditioners 1. Tube bundles – eliminate swirl only – actually lock in distorted velocity profile 2. Perforated plates – reduce swirl and asymmetry – do not produce fully developed flow
profile 3. High performance flow conditioners – eliminate swirl and produce fully developed floe
profile 4. 245D of Straight Pipe

2017
What is a Flow Conditioner? – Orifice meters
2017
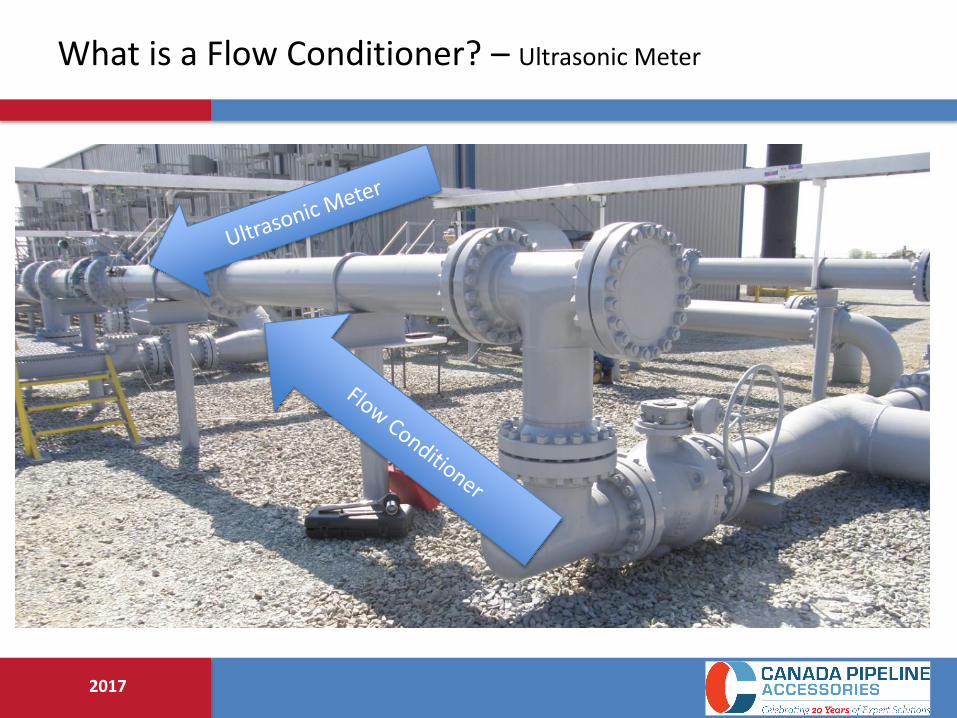
What is a Flow Conditioner? – Ultrasonic Meter

2017
Cone Meters, with Swirl

2017
Even these but don’t tell any one
2017
Why should we use a Flow Conditioner?
Reduction in straight run upstream lengths required for repeatable measurement
When dealing with flow measurement, we cannot simply stick a flow meter in the pipe, turn it on and expect perfect results.
In the real world, we have to deal with:
• Installation effects – tees, valves, elbows, probes, etc.
• Swirl
• Flow profile distortion
• Pulsation
• Noise
All of these combine in different ways to generate measurement errors!

2017
Why Fully Developed Flow ???
• Fully developed pipeline flow is the ideal state of a fluid in a pipe.
• If we had an infinitely long pipe, this is the flow we would always see.
• It is mathematically predictable.
• It is perfectly symmetrical around the center of the pipe.
• It has no swirl.
• This *should* guarantee us perfect, error free, repeatable measurement.
• Reality is that Installation effects take us away from this state.
2017
How They Work
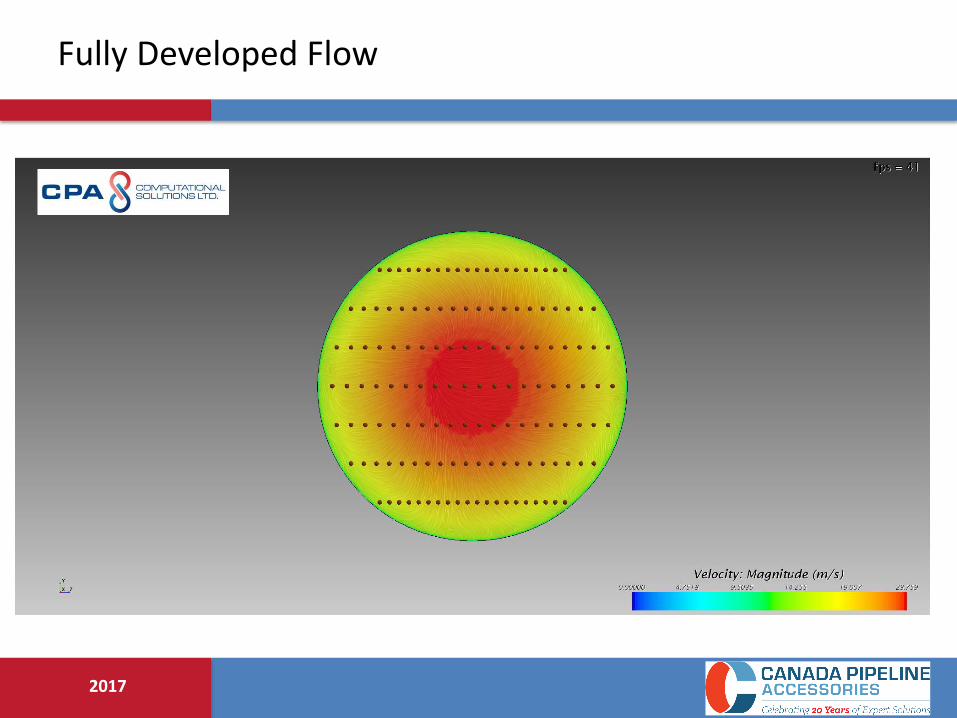
• Hole pattern is arranged so that the resulting downstream condition is a fully developed profile, the same as would be achieved by a long length of straight, uniform pipe.
• Stream is forced towards the holes in the plate which forces the pressure field to balance immediately upstream of the flow conditioner.
• Stream reaches a max velocity through the holes of roughly 3 times the average upstream pipe velocity.
• Immediately downstream of the flow conditioner (about 1D) the peak velocity is 20% higher than the average.
• By the time you get 2 – 3D away, the flow is fully developed, and your peak velocity at the centre of the pipe is 15% higher than the average pipe velocity,
• If swirl is present, this is cut out by the acceleration of the gas, and the thickness of the plate.

2017

2017
0
0.2
0.4
0.6
0.8
1
1.2
0 0.05 0.1 0.15 0.2 0.25 0.3 0.35
Flu
id V
elo
city
(m
/s)
Distance Across Pipe (m)
5 FPS 25 FPS 75 fps 75 FPS. P=52000 Pa 75 FPS, Rough Wall 75 FPS, Smooth Wall
How They Work - CPA 50E

2017
Fully Developed Flow – Repeatable & Uniform
0
0.2
0.4
0.6
0.8
1
1.2
1.4
1.6
0 0.05 0.1 0.15 0.2 0.25 0.3
No
rmal
ize
d F
low
Ve
loci
ty (
V/V
avg)
Distance Across Pipe (m)
30000000 3000000 300000 30000 15000 10000 6000 1000 300
2017
Fully Developed Flow

2017
Installation Effects – Life gets in the way
Every pipe fitting generates an installation effect.
• Tees
• Elbows
• Expanders
• Reducers
• Valves
• Probes
All of these can combine to create a deviation from perfect fully developed flow.
2017
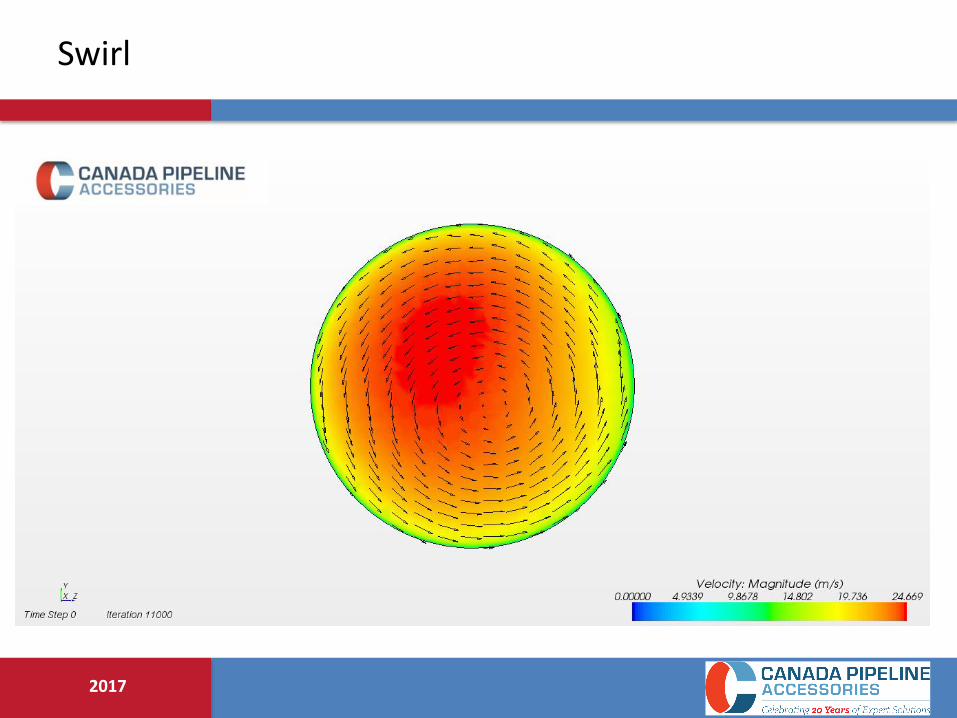
Swirl
• Swirl is the rotation of fluid in a pipe.
• It is caused by any change in piping direction! – Elbow, 45, tee..
• It can also be caused by any partial restriction of a pipe – Probe, filter, change in line size, reducers / expanders…
2017
Swirl

2017
Swirl

2017
Dual Elbows In Plane, 1D of Separation Streamlines

2017
Dual Elbows In Plane, 1D of Separation Velocity Contour, 0D

2017
Dual Elbows In Plane, 1D of Separation Velocity Contour, 5D

2017
Installation Effects - Elbows
2017
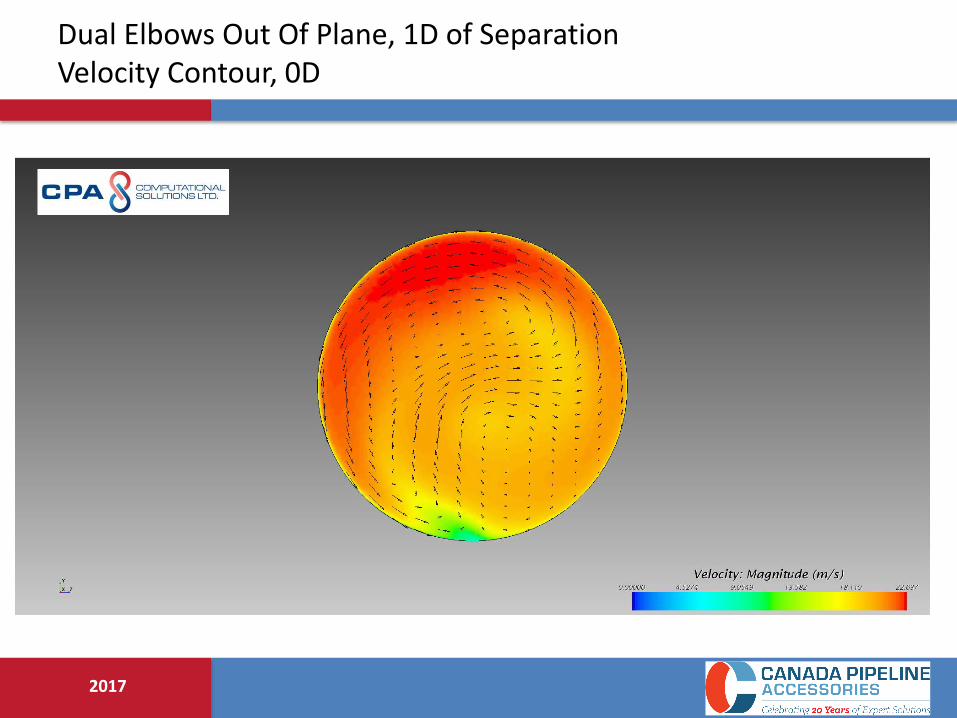
Dual Elbows Out Of Plane, 1D of Separation Velocity Contour, 0D

2017
Dual Elbows Out Of Plane, 1D of Separation Velocity Contour, 10D
2017
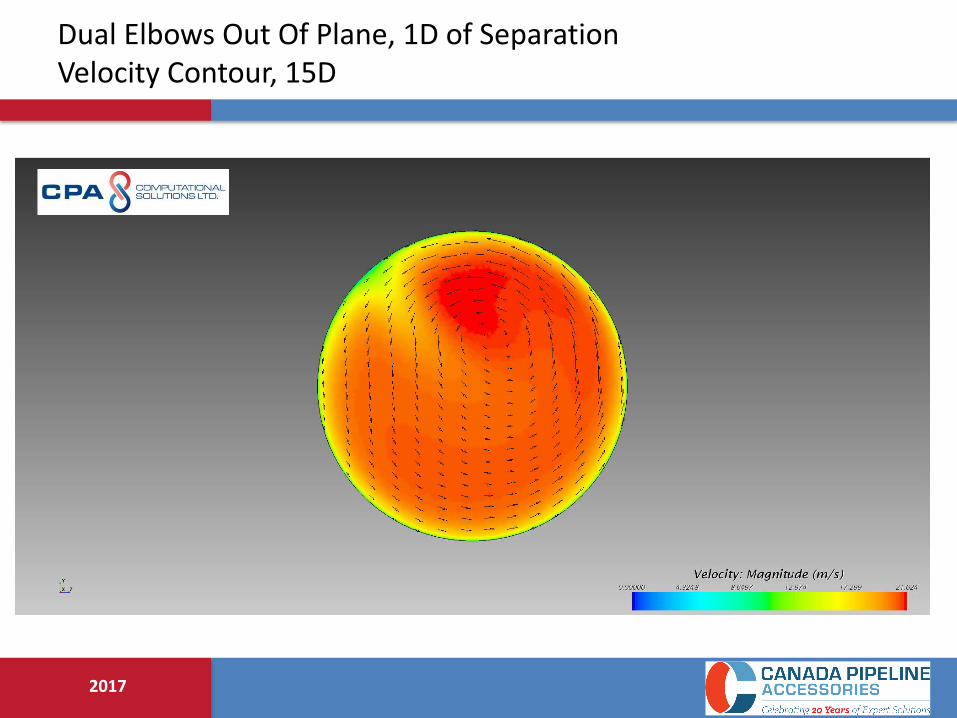
Dual Elbows Out Of Plane, 1D of Separation Velocity Contour, 15D

2017
AGA 3 – Appendix for worst case
2017
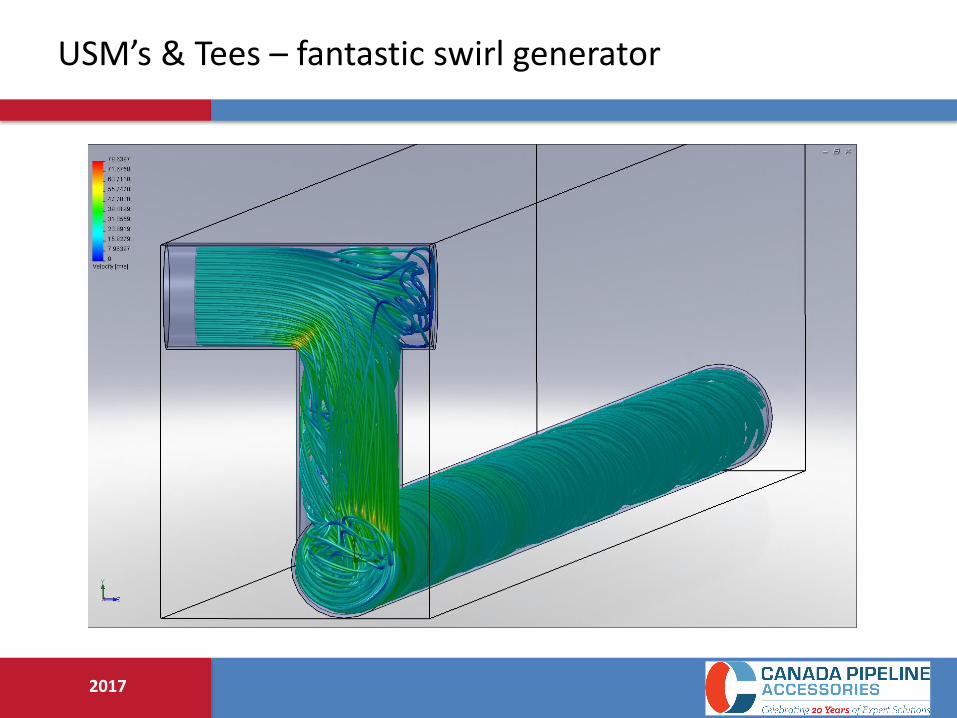
USM’s & Tees – fantastic swirl generator
2017
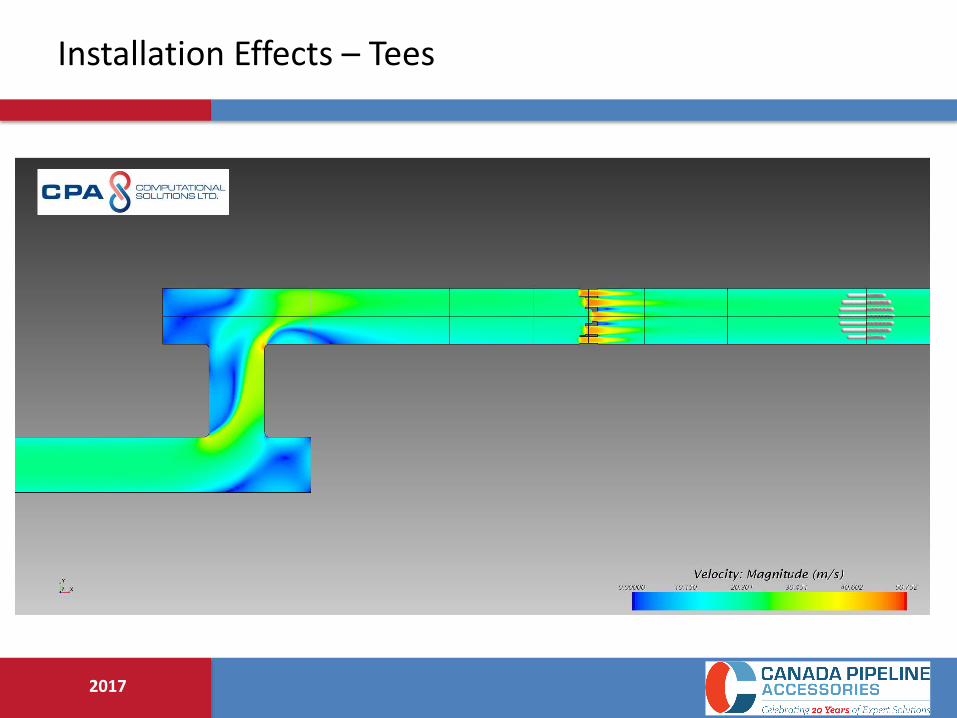
Installation Effects – Tees

2017
Dual Tees In Plane, 1D of Separation Velocity Contour, 0D

2017
Dual Tees In Plane, 1D of Separation Velocity Contour, 5D
2017
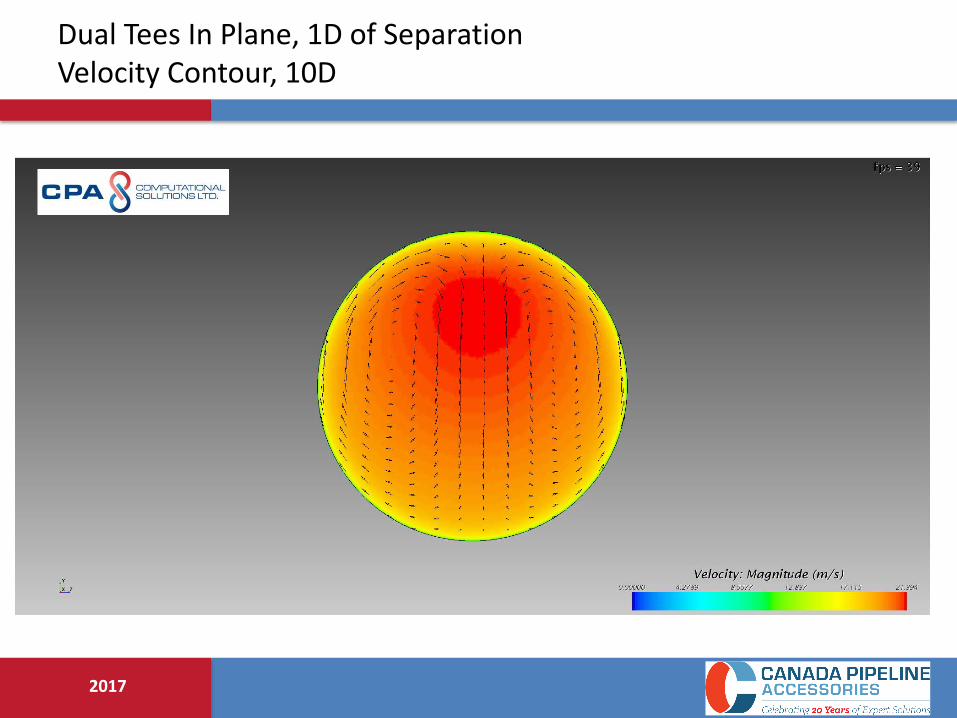
Dual Tees In Plane, 1D of Separation Velocity Contour, 10D

2017
2017
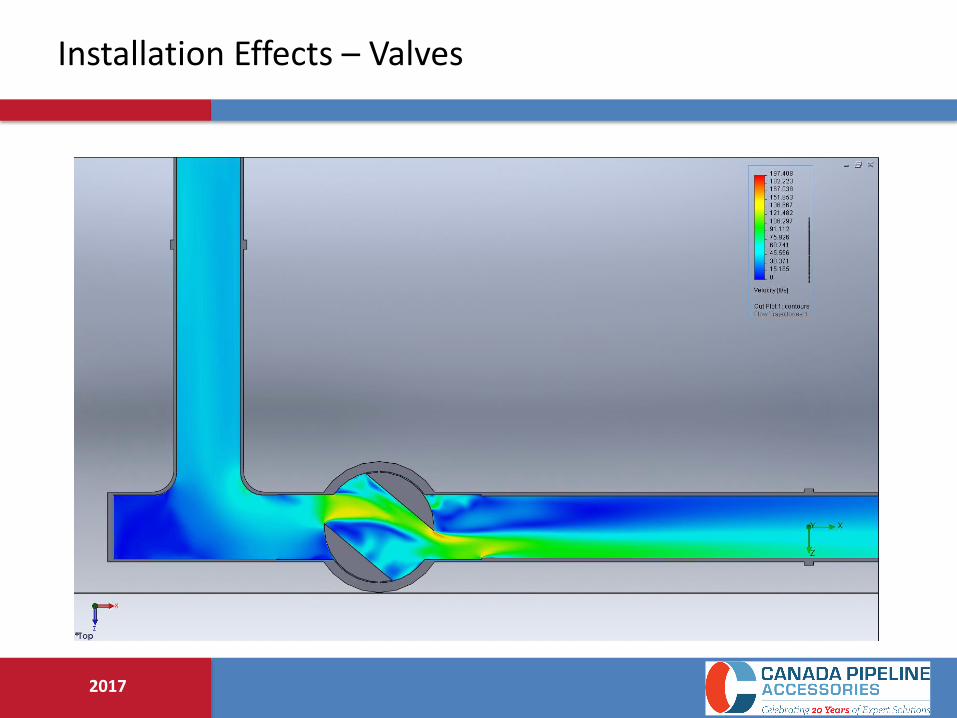
Installation Effects – Valves

2017
Installation Effects – Reducers

2017
Installation Effects – Elbows & Orifice Plates

2017
Measurement Errors – why we do what we do!!
• The further we get from our perfect, swirl free, fully developed flow, the more uncertain our measurement becomes.
• Error due to flow profile distortion – deviation from baseline state.
• Error due to swirl itself.
• What if we want to shorten our meter run?
• What do we do?
• Meter uncertainty statement is going to be formed under the most ideal circumstances that the manufacturer can provide
2017
Without Flow Conditioning
• We can build a meter run without any sort of flow conditioning!
• It just needs to be very long to compensate for installation effects and swirl.
• AGA3-2000 even allows this.
• Table 2-7 shows suggested meter run lengths when a flow conditioner won’t be used…but the runs could end up being 44D, 95D or even up to 145D long!!

2017
Flow Conditioning
A properly designed Flow Conditioner converts this flow....
...Into this.

2017
Flow Conditioning
A properly designed Flow Conditioner converts this flow....
...Into this.

2017
2017

2017
Flow Conditioning
0.00
5.00
10.00
15.00
20.00
25.00
30.00
35.00
40.00
45.00
50.00
-6.00 -4.00 -2.00 0.00 2.00 4.00 6.00
Empty 5&5 OIMLR137 25m 15000 Horizontal 2.5D Upstream Empty 5&5 OIMLR137 25m 15000 Vertical 2.5D Upstream
Empty 5&5 OIMLR137 25m 15000 Horizontal 1D Upstream Empty 5&5 OIMLR137 25m 15000 Vertical 1D Upstream
2017
Flow Conditioning
0.00
5.00
10.00
15.00
20.00
25.00
30.00
-6.00 -4.00 -2.00 0.00 2.00 4.00 6.00
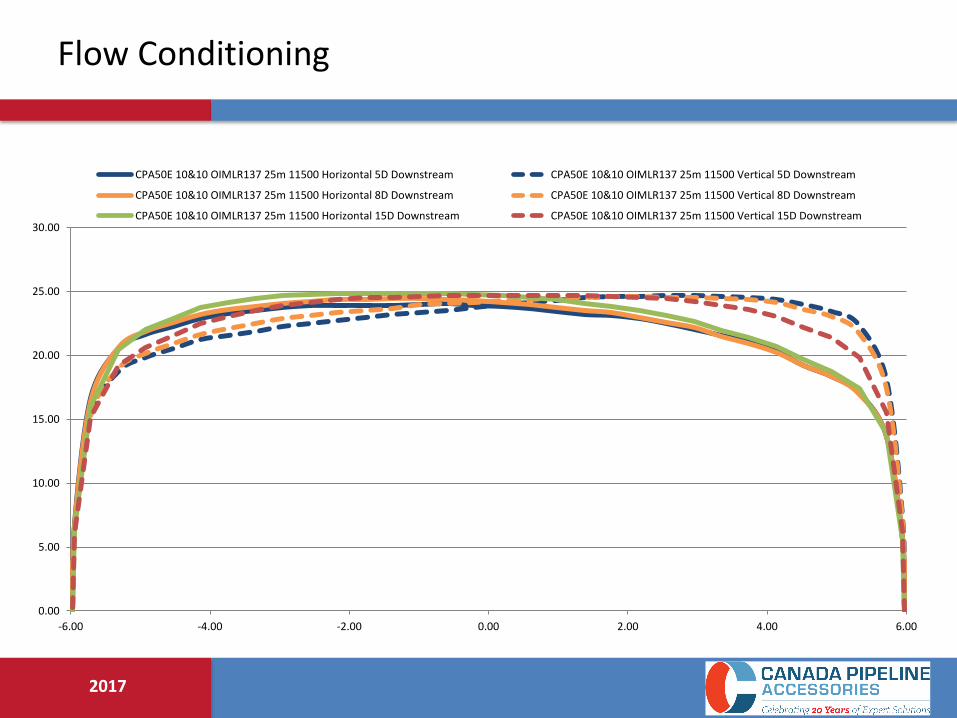
CPA50E 10&10 OIMLR137 25m 11500 Horizontal 5D Downstream CPA50E 10&10 OIMLR137 25m 11500 Vertical 5D Downstream
CPA50E 10&10 OIMLR137 25m 11500 Horizontal 8D Downstream CPA50E 10&10 OIMLR137 25m 11500 Vertical 8D Downstream
CPA50E 10&10 OIMLR137 25m 11500 Horizontal 15D Downstream CPA50E 10&10 OIMLR137 25m 11500 Vertical 15D Downstream

2017
Tees – Swirl Removal

2017
Swirl – ALL SCENARIOS

2017
Meter Types
• All volumetric flow meters can be flow conditioned: Orifice, Ultrasonic, Venturi, Coriolis Vortex, Turbine, Cone, Mag, etc.
• Every meter type responds differently to the effects of swirl and flow profile distortion.
• Volumetric flow meters are looking for ‘good flow’. Flow with minimal swirl and good flow profiles.
• A flow conditioner is simply trying to improve the flow that the meter is seeing.
2017
Orifice Meters
• A thin plate with a very sharp chamfered hole creates a significant pressure drop.
• The flow rate of the fluid is proportional to the pressure drop.
• So why is there a problem?

2017
Orifice Meters

2017
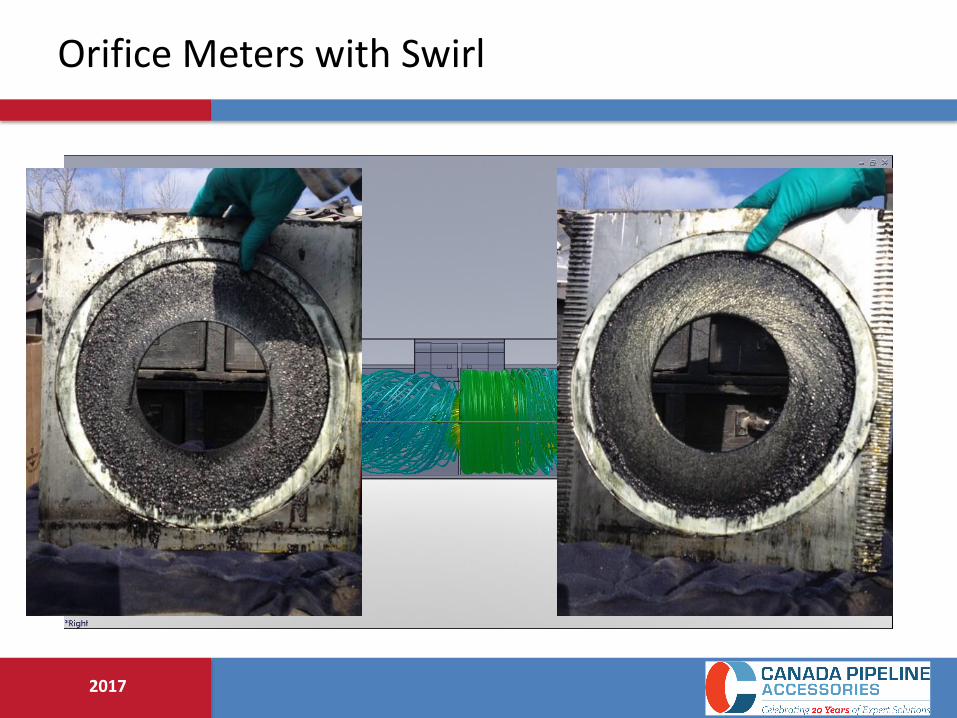
Orifice Meters with Swirl
2017
Orifice Meters with Swirl

2017
Orifice Meters
Velocity Velocity Swirl P1 P2 Bulk Density K deltaP
(fps) (m/s) (Degrees) (Pa) (Pa) (ρ) (Pa)
50 15.24 0 5598181 5458170 36.84 32.73 140011
50 15.24 20 5591067 5471339 36.74 28.06 119728
50 15.24 45 5560318 5497955 36.68 14.64 62363
• In orifice measurement, swirl can change the pressure differential that is being measured.
2017
Cone Meters
• Similar to other dP devices.
• Have a high pressure and a low pressure tap.
• Has a unique geometry that forces flow to the outside of the pipe.
• High pressure tap is in a similar location as with a orifice plate or venturi, but low pressure tap is in the center of the element geometry.
• Supposed to be highly immune to installation effects and swirl, requires only 0 – 3 upstream pipe diameters and no flow conditioning.
2017
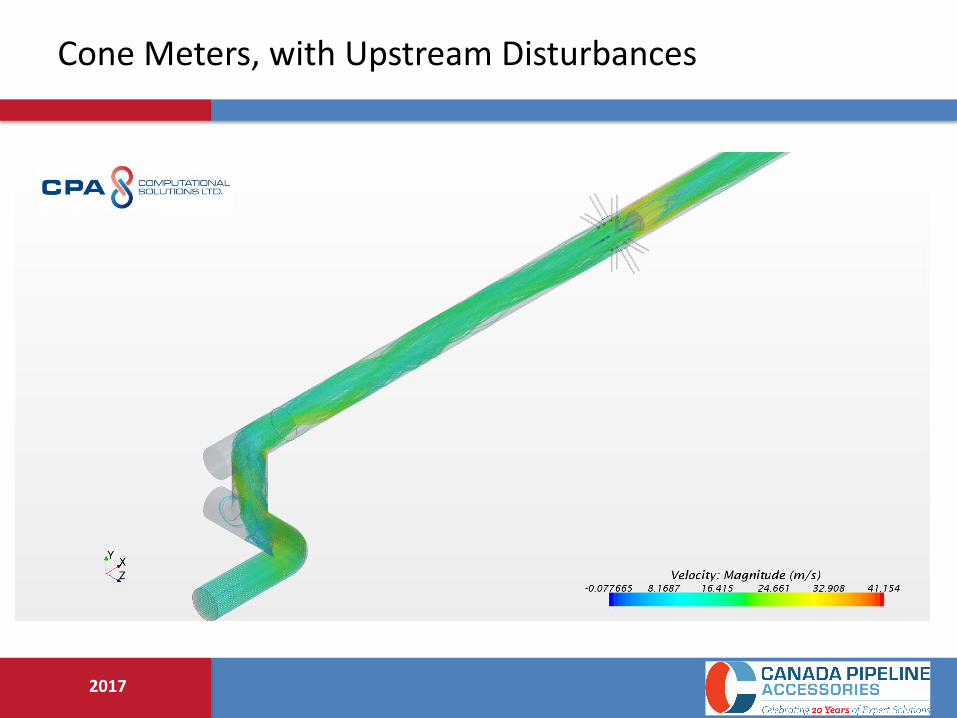
Cone Meters, with Upstream Disturbances

2017
Cone Meters, with Swirl

2017
Turbine Meters
• Turbine meters with nose cones redirect flow towards the outside of the fluid passage.
• This movement amplifies disturbances within the flow profile
• Turbine meters need to see a well flow conditioned bulk fluid flow.
• Asymmetrical or peaky flow profiles will cause the turbine to over register.

2017
Turbine Meters

2017
Tube Bundles
From GRI 97/0207

2017
Tube Bundle Data

2017
Without Tube Bundles & Straightening Vanes
• Tube bundles can be very problematic in custody transfer applications.
• AGA3 test data has shown them to be have very unpredictable behavior in scenarios with various upstream configurations.
• A low pressure drop combined with a long length (2 – 3D) result in an inability to properly redistribute the flow profile, while locking in distortions.
• Testing has found tube bundles to cause errors in straight pipe baseline scenarios!
• AGA3 itself shows in table 2-8 that there are configurations where a tube bundles cannot even be used!

2017
17D with Tube Bundle
From AGA Report No. 3, 2000 Edition

2017
Plate Based Isolating Flow Conditioners
2017
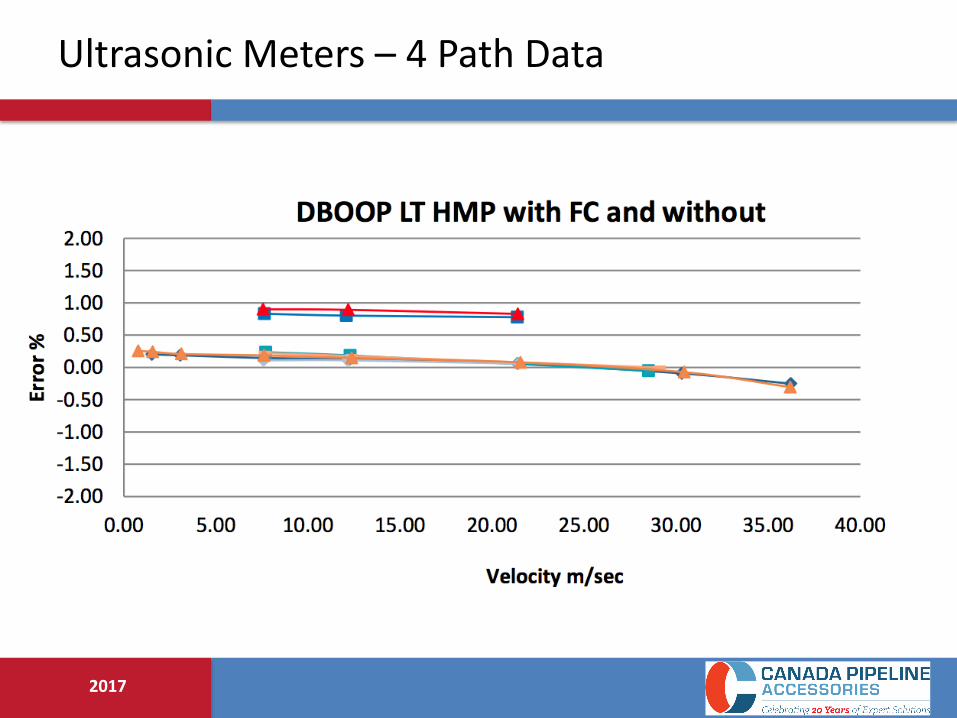
Ultrasonic Meters
• Rely on a noise pulse that is transmitted through the fluid and the flow rate is computed using the transit time.
• Transit time is affected by velocity disturbances within the pipe, slowing or speeding up the pulse.
• Multiple paths help to generate a complete picture of the cross sectional flow within the pipe.
• The meter only knows how long it took for the pulse to travel from point A to point B.
• It cannot guess the state of the flow along the way.

2017
Ultrasonic Meters

2017
Ultrasonic Meters

2017
USM Path Layouts
2017
Ultrasonic Meters – 4 Path Data
2017
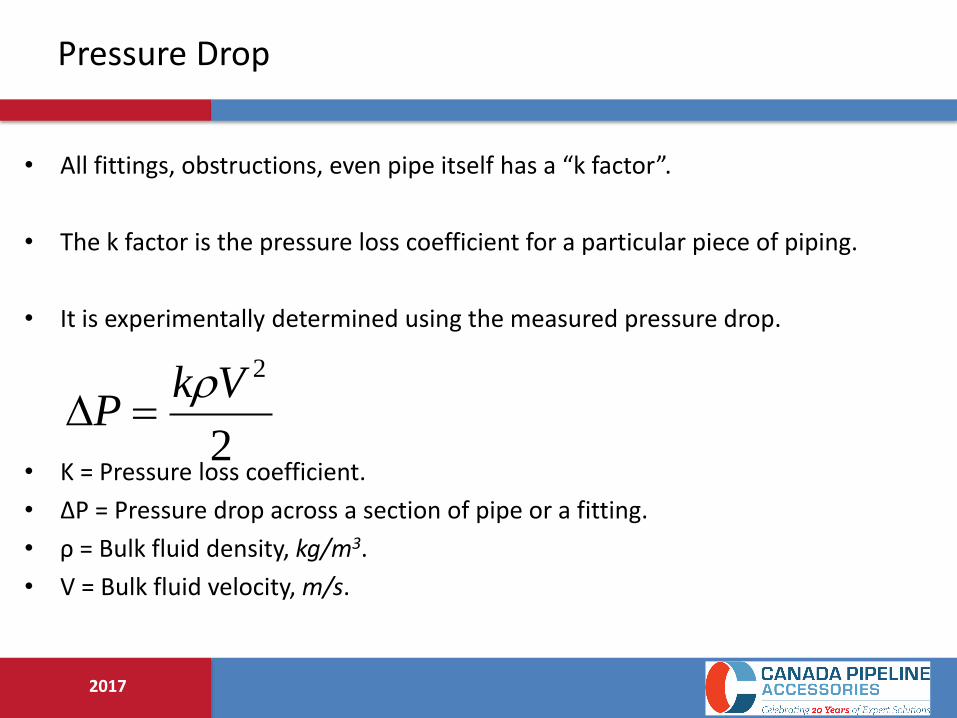
Pressure Drop
• All fittings, obstructions, even pipe itself has a “k factor”.
• The k factor is the pressure loss coefficient for a particular piece of piping.
• It is experimentally determined using the measured pressure drop.
• K = Pressure loss coefficient.
• ΔP = Pressure drop across a section of pipe or a fitting.
• ρ = Bulk fluid density, kg/m3.
• V = Bulk fluid velocity, m/s.
2
2VkP

2017
Pressure Drop
• For natural gas applications, most plate flow conditioners have a K factor of approximately 2.
• Tube bundles are closer to 0.75 – 1.5.
• What if we are worried about the pressure drop across the flow conditioner?

2017
Pressure Drop
• The CPA 50E K factor ~ 2.0 (dP same as roughly 277 feet of pipe, 12” ID).
• Long radius Elbow K factor ~ 0.6 – 0.8
• Tee, flowing straight through ~0.5
• Tee, flow turning 90 degrees from inlet to outlet ~ 1.2 – 1.8
• Flow from a inlet header into a meter run ~ 1.0
• Flow from a meter run into an outlet header ~ 0.78

2017
Pressure Drop
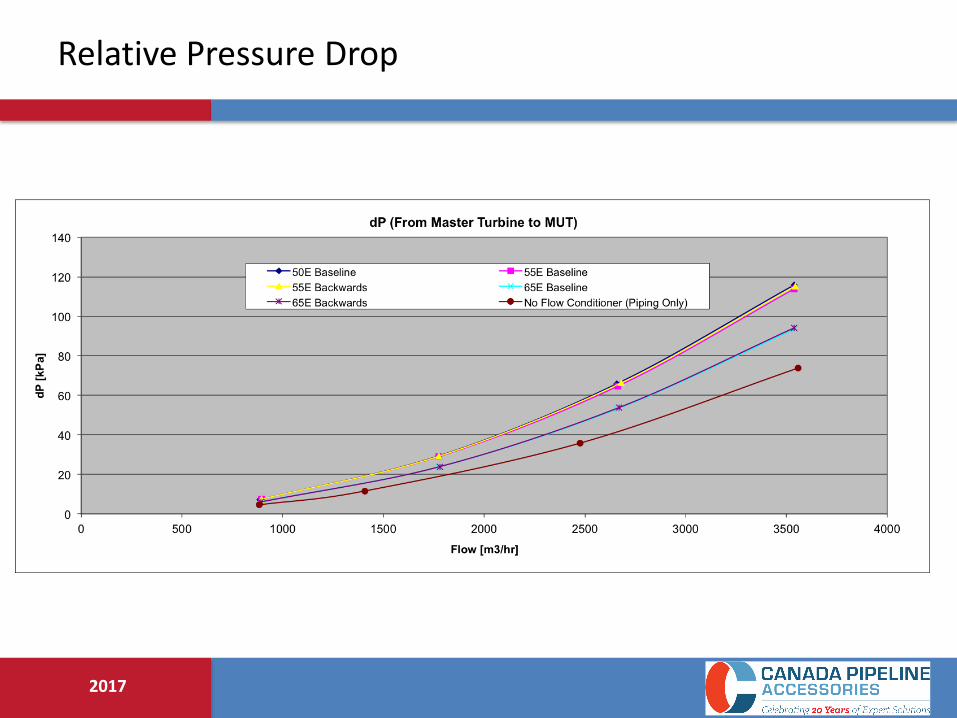
• The uni-directional meter run on page 27 of AGA9, excluding the flow conditioner, will have a total K factor of at least 3.0 – 4.0.
• This is ignoring the fittings that would be needed to connect up to the tees.
• Adding two additional tees would nearly double the pressure drop.
• This is assuming fully developed flow. Swirl and profile distortion will change the pressure drop!
2017
Relative Pressure Drop

2017
0.00
1.00
2.00
3.00
4.00
5.00
6.00
7.00
8.00
9.00
10.00
1,000 10,000 100,000 1,000,000 10,000,000
Pre
ssu
re D
rop
(p
si)
Reynold's Number
Flow Conditioner Pressure Drop
CPA 50E
CPA 65E
Tube Bundle
Transition Flow
Region

2017
Pressure Drop Calculation Results
Flow
Pipe Inside Pressure Pressure Est Noise Actual Flow Expected Flow Dynamic Reynold's
Conditions
Conditioner Diameter Drop Drop
@ 610 mm Flow Velocity K-Factor Density Viscosity Number
Type (inch) (psi) (kPa) (dB) (m³/hr) (m/s) ( - ) (kg/m³) (Pa·s) ( - )
5, M3/H 50E 2.000 0.06 0.38 N/A 5.00 0.69 2.31 707.7 5.15E-04 4.79E+04
10, M3/H 50E 2.000 0.22 1.51 N/A 10.00 1.37 2.27 707.7 5.15E-04 9.57E+04
25, M3/H 50E 2.000 1.33 9.16 N/A 25.00 3.43 2.20 707.7 5.15E-04 2.39E+05
50, M3/H 50E 2.000 5.20 35.86 N/A 50.00 6.85 2.16 707.7 5.15E-04 4.79E+05
5, M3/H 65E 2.000 0.03 0.21 N/A 5.00 0.69 1.26 707.7 5.15E-04 4.79E+04
10, M3/H 65E 2.000 0.12 0.81 N/A 10.00 1.37 1.23 707.7 5.15E-04 9.57E+04
25, M3/H 65E 2.000 0.71 4.88 N/A 25.00 3.43 1.18 707.7 5.15E-04 2.39E+05
50, M3/H 65E 2.000 2.74 18.90 N/A 50.00 6.85 1.14 707.7 5.15E-04 4.79E+05
5, M3/H
AGA/API/ISO Tube Bundle 2.000 0.04 0.29 N/A 5.00 0.69 1.75 707.7 5.15E-04 4.79E+04
10, M3/H
AGA/API/ISO Tube Bundle 2.000 0.16 1.10 N/A 10.00 1.37 1.65 707.7 5.15E-04 9.57E+04
25, M3/H
AGA/API/ISO Tube Bundle 2.000 0.92 6.34 N/A 25.00 3.43 1.53 707.7 5.15E-04 2.39E+05
50, M3/H
AGA/API/ISO Tube Bundle 2.000 3.45 23.78 N/A 50.00 6.85 1.43 707.7 5.15E-04 4.79E+05

2017
AGA Standards/Meter Run Compliance
• AGA 3 / API 14.3 - Orifice Meter Measurement, Turbine Meter Measurement, USM’s
• Measurement Canada – Daniel
– Savant
– CPA
• 50E
• 55E
• 65E
• IT is the responsibility of the manufacturer to demonstrate their performance and test results to demonstrate compliance
2017
Flow Conditioning
What if we have debris in our pipe?
• The debris has to go somewhere, ignoring the flow conditioner won’t make it disappear.
• Install a filter (or another flow conditioner UPSTREAM of the meter run to catch the debris).
• Without something to catch debris, we risk damaging or destroying any sample probes, thermo wells or any other equipment in the pipe.
• Better hope there isn’t a compressor or turbine downstream somewhere.
• If the gaskets are unraveling, recommend switching to Flexitallic CGI gaskets with an inner ring to keep the windings intact.

2017
Flow Conditioning
What if we have debris in our pipe?
2017
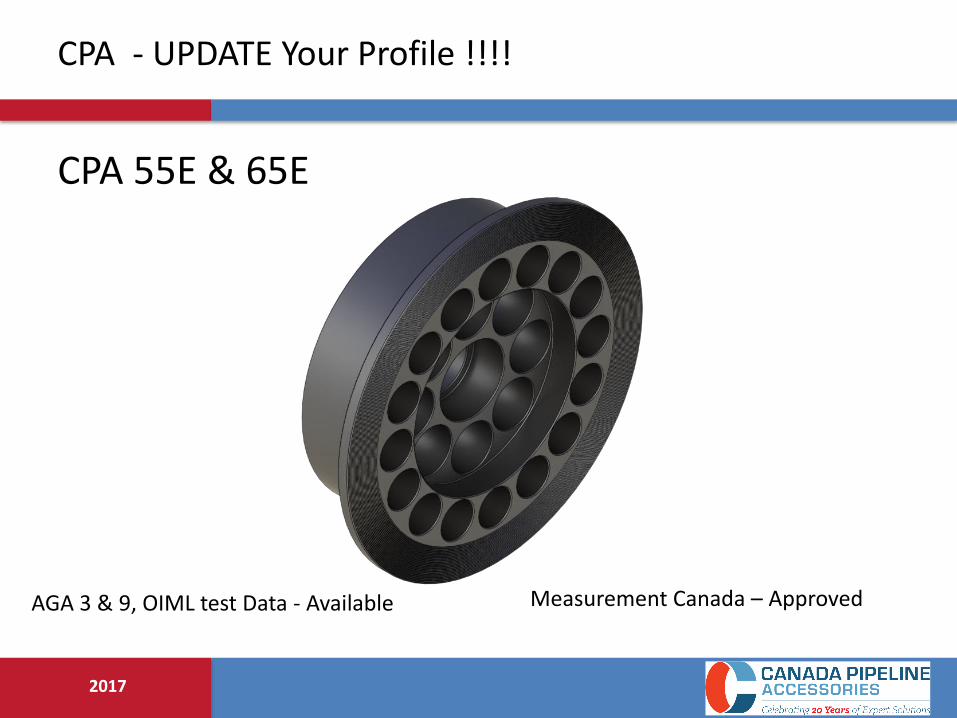
CPA - UPDATE Your Profile !!!!
Measurement Canada – Approved
CPA 55E & 65E
AGA 3 & 9, OIML test Data - Available

2017
CPA Generation II Flow Conditioners
• CPA 55E – Designed for orifice, turbine and USM measurement.
– Has a pressure drop roughly 10% lower than that of the CPA 50E.
– Roughly 30 dB quieter than the CPA 50E at 110 fps
– AGA3-2000 testing data available, 5D/8D meter run, up to 0.75 beta.
– Swirl that makes it through the 50E is reduced by an additional half.
– Tested in 5/5, 3/5 and 3/3 meter run configurations with OIML R137 upstream piping

2017
CPA Generation II Flow Conditioners
• CPA 65E – Designed for liquid and USM applications.
– Has a pressure drop roughly 50% lower than that of the CPA 50E / 55E.
– Roughly 30 dB quieter than the CPA 50E at 110 fps.
– Lower turbulence generation.
– Swirl that makes it through the 50E is reduced by an additional half.
– Tested in 5/5, 3/5 and 3/3 meter run configurations with OIML R137 upstream piping.

2017
CPA Flow Conditioner Sound Levels

2017
CPA 65E OIML Testing, TCC

2017
OIML R137 Piping, CPA 65E
2017
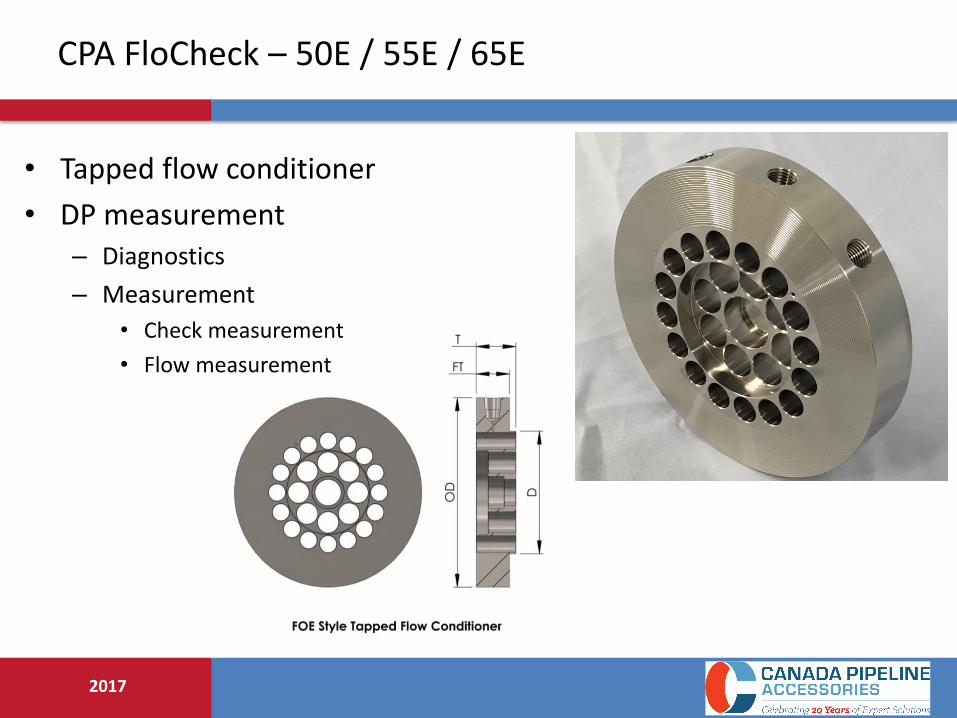
CPA FloCheck – 50E / 55E / 65E
• Tapped flow conditioner
• DP measurement – Diagnostics
– Measurement
• Check measurement
• Flow measurement

2017
Common Installation types
2017
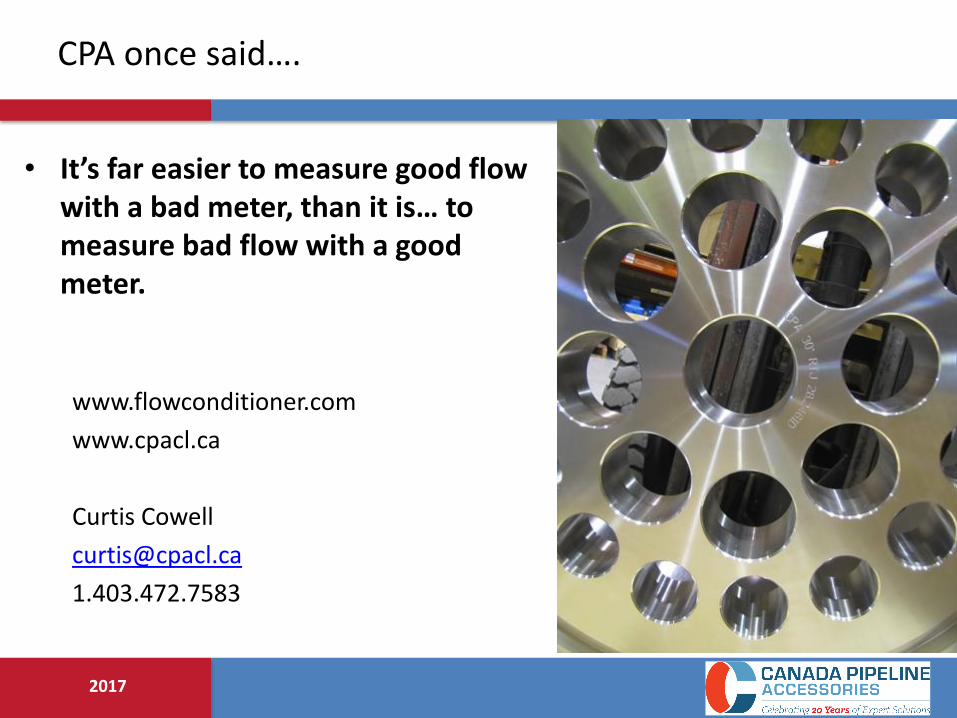
CPA once said….
• It’s far easier to measure good flow with a bad meter, than it is… to measure bad flow with a good meter.
www.flowconditioner.com
www.cpacl.ca
Curtis Cowell
1.403.472.7583

2017
Thank You
• For Further information


![· SUNAC AGA3 Ec'Coaeer AUTOMATIC AIRLESS a AIR-WRAPPED SPRAY GUN Coater] 0](https://img.dokumen.tips/doc/110x75/5ad690937f8b9aff228e7670/-aga3-eccoaeer-automatic-airless-a-air-wrapped-spray-gun-coater-0.jpg)