Embed Size (px)
Citation preview

Nationaal Lucht- en Ruimtevaartlaboratorium
National Aerospace Laborator y NLR
NLR-TP-99104
Flow field investigations on a wing installedCounter Rotating Ultra-high-bypass Fan enginesimulator in the low speed wind tunnel DNW-LST
G.H. Hegen, W. Puf fer t-Meissner, L. Dieterle and H. Vollmers

This report is based on an article to be presented at the 7th European PropulsionForum on Aspects of Engine/Airframe Integration, 10-12 March 1999, Pau, France.
The contents of this report may be cited on condition that full credit is given to NLRand the author(s).
Division: AerodynamicsIssued: 5 March 1999Classification of title: Unclassified
Nationaal Lucht- en Ruimtevaartlaboratorium
National Aerospace Laboratory NLR
* German Aerospace Research Centre (DLR)
NLR-TP-99104
Flow field investigations on a wing installedCounter Rotating Ultra-high-bypass Fan enginesimulator in the low speed wind tunnelDNW-LST
G.H. Hegen, W. Puffert-Meissner*, L. Dieterle* and
H. Vollmers*

-2-NLR-TP-99104
Contents
Abstract 3
List of symbols 3
1. Introduction 3
2. Experimental set-up 4
2.1 Wind tunnel 4
2.2 Model 4
3. Rake measurements 4
3.1 Devices for flow field measurements 4
3.2 Test programme 5
3.3 Results 5
4. Particle Image Velocimetry (PIV) 5
4.1 Experimental set-up 5
4.2 Test programme 6
4.3 Results 6
5. CFD calculations 6
5.1 Computational Method 6
5.2 Results 6
6. Discussion of results 6
7. Concluding remarks 7
8. References 7
3 Tables
10 Figures
(13 pages in total)

-3-NLR-TP-99104
- 1 -
FLOW FIELD INVESTIGATIONS ON A WING INSTALLED
COUNTER ROTATING ULTRA-HIGH-BYPASS FAN ENGINE SIMULATOR
IN THE LOW SPEED WIND TUNNEL DNW-LST
G.H. Hegen
National Aerospace Laboratory (NLR), Emmeloord, The Netherlands
W. Puffert-Meissner
German Aerospace Research Centre (DLR), Braunschweig, Germany
L. Dieterle and H. Vollmers
German Aerospace Research Centre (DLR), Göttingen, Germany
ABSTRACTFor a better understanding of jet interference fromwing mounted turbofan engines and for improvedCFD modelling more detailed flow field studies andreliable test data are required. With this objective,within the framework of the DLR-NLR co-operation,flow field investigations have been carried out in theLow Speed wind Tunnel LST 3x2.25 m2 of the DNW(German Dutch Wind tunnels) on a twin-jet transportaircraft half model (ALVAST).
The half model was tested in cruise configuration(clean wing without flaps) without and with a wingmounted engine simulator. Two types of enginesimulators were used: a Through Flow Nacelle (TFN)and a turbo-powered Counter Rotating Ultra-high-bypass Fan (CRUF). All tests have been carried out atwind tunnel speed V0=60 m/s (Mach numberM0=0.18). The flow fields behind the wing andengine simulators (TFN and CRUF) wereinvestigated using a rake equipped with total pressureprobes and a rake equipped with directional probes.In this way time-averaged flow field planesperpendicular to the tunnel flow were obtained. Non-intrusive flow field measurements were carried outusing the Particle Image Velocimetry (PIV)technique. This technique was used to investigate thestream-wise development of the turbo-poweredCRUF inlet and fan exhaust flow and the velocityflow field near wing and pylon. Information aboutboth the unsteady and the time-averaged flow fieldwas obtained.
The measurement techniques proved to be successfulfor engine/airframe interference studies. The twotechniques are complementary and the resultscorrespond well with each other. Furthermore auseful database has become available for furtherimprovement of the CFD modelling. CFDcomputations have already been made for the cruiseconfiguration without engine simulator, whichcorrespond reasonably well with the five-hole rakemeasurements.
LIST OF SYMBOLSb wing span (=3.428 m)c local wing chord lengthCL lift coefficientCD drag coefficientCpt total pressure coefficient (=(pt-pto)/q0)M flow Mach numberM0 tunnel free stream Mach numberpt local total pressurept0 tunnel free stream total pressureq0 tunnel free stream dynamic pressureRPM CRUF rotational speedU, V, W model fixed flow velocity componentsVx,Vy,Vz tunnel fixed flow velocity componentsV0 free-stream velocity in tunnel sectionX, Y, Z tunnel fixed coordinates (origin in model
reference point) at αm=0°)αm model angle of attack (uncorrected for
tunnel wall effects)
1. INTRODUCTIONCurrent testing techniques on engine-airframeintegration deliver mainly test data on overallaerodynamic forces and surface pressuredistributions. With this respect both DLR and NLRparticipated in the BRITE/EURAM programsDUPRIN (DUcted PRopfan INvestigations) andENIFAIR (ENgine Integration for Future transportAIRcraft). Within these programs the engine-airframeinterference effects are determined experimentallyand theoretically (via CFD calculations) for a twin-jettransport aircraft model (ALVAST), supplied withdifferent types of engine simulators. However, for abetter understanding of the jet effects on the overalldrag behaviour and for improved CFD modellingmore detailed studies and reliable test data areneeded. The influence of a jet on the flow fieldaround an aircraft poses a very complex problem andrequires detailed flow field visualisation to get insightinto physics. NLR and DLR therefore decided to co-operate on some topics where further study wasrequired (within the existing DLR-NLR co-operation

-4-NLR-TP-99104
- 2 -
program: Low Speed Propulsion AirframeIntegration).
Within this framework flow field investigations havebeen carried out in the DNW-LST on the ALVASThalf model in cruise configuration. Since some of theflow field measurement techniques were used for thefirst time for engine/airframe interference studies, itwas decided to restrict ourselves to the cruiseconfiguration instead of the more realistic but alsomore complex high-lift configuration. Within phase 1(October 1995, see Ref.1) the half model was testedwithout and with the Through Flow Nacelle (TFN),used for the simulation of the Counter Rotating Ultra-high-bypass Fan (CRUF) simulator. The flow fieldplanes behind the wing and the TFN wereinvestigated, using a rake equipped with five-holeprobes and a rake equipped with total pressureprobes. During phase 2 (November/ December 1996,see Ref.2) the half model was supplied with theturbo-powered CRUF simulator. The flow fieldsbehind the wing and engine were not onlyinvestigated using the above mentioned rakes but alsoflow field measurements were carried out using theparticle image velocimetry (PIV) technique.Emphasis of these tests was on the spatialdevelopment of the CRUF fan jet.
Additional CFD calculations for the cruiseconfiguration, without engine simulator, at low speedconditions have been made by DLR.
2. EXPERIMENTAL SET-UP
2.1 Wind tunnelThe experiments have been performed in the LowSpeed wind Tunnel (LST) of the DNW (GermanDutch Wind tunnels). It is an atmospheric windtunnel of the closed return circuit type with a freestream turbulence level of about 0.025%. Themaximum velocity in the test section is about 80 m/s.The test section has a cross section of 3.00x2.25 m2
and a length of 8.75 meters with excellent visualaccessibility through removable transparent sidepanels. It is equipped with a remote controlled Y-Ztraversing mechanism, allowing manual movementsin axial X-direction over most of the test sectionlength. All tests were carried out at a wind tunnelflow velocity of V0=60 m/s (M0=0.18).
2.2 ModelThe ALVAST half model is the starboard side of theALVAST complete model of the DLR (see Fig. 1).The ALVAST complete model is a twin enginemodel of approximately 3.5 meters span without tail,in cruise condition (no slat/flap) closely resemblingan A320 aircraft 1:10 scale. Geometrical data and
aerodynamic coefficients are given in tables 1 and 2respectively. The ALVAST half model is providedwith a pylon to mount one of the engine simulators(TFN or CRUF) to the wing. Both types of simulatorsare designed and owned by DLR (see Ref.3):
- The Through Flow Nacelle (TFN) (see alsoFig.1) consists of an engine nacelle with internaldiameter of 10” (254 mm). Enclosed in thenacelle is a through flow core with five inletopenings on its nose fairing.
- A technical drawing of the turbo-powered CRUFsimulator is shown in Fig.2 and some mainparameters are given in table 3. It has a two stage(8 blades per stage) counter-rotating fan of 10"(254 mm) diameter. This fan is driven by a fourstage air turbine. The air turbine is driven byhigh-pressure air.
During the phase 1 test campaign the ALVAST halfmodel (without and with TFN) was mounted in theDNW-LST from the top wall. During the phase 2campaign, however, the model with turbo-poweredCRUF simulator was mounted from the tunnel floor(see also Fig.3). In both cases a peniche is presentbetween the model and the turntable of the DNW-LST to reduce influences of the tunnel boundary layeron the model. The peniche is mounted to the LSTturntable while the model is mounted to an externalbalance system. The gap between the model and thepeniche is closed by a labyrinth seal. An unintentionalcontact between the peniche and the model isdetected electrically at two locations.
3. RAKE MEASUREMENTS
3.1 Devices for flow field measurementsThe five-hole rake and the pitot rake have been usedfor flow field measurements behind the wing:
- The five-hole probe pressures are used for localflow vector and total pressure measurement. Thefive-hole rake is equipped with 18 five-holeprobes with spherical heads (2.5 mm diameter).The individual probes are placed 15 mm apart(pitch), resulting in a rake span of 255 mm. Therake was calibrated at Mach numbers betweenM=0.07 and 1.2, and flow angles up to 45° .
- The pitot rake is used for total pressure measure-ment. It is equipped with 59 total pressure probes(1.1 mm diameter). The individual probes areplaced 3.5 mm apart (pitch), resulting in a rakespan of 203 mm.
The larger probe diameter could introduce a worseaccuracy for the five-hole rake in a strong velocity

-5-NLR-TP-99104
- 3 -
gradient. Therefore the pitot rake measurements areused for verification purposes.
The probe pressures are electronically scanned (withthe electronically scanned pressure units placed insidethe rake support sting) yielding high data rates andon-line pressure calibration abilities. The rake sting ismounted on a streamlined horizontal strut, whichpenetrates the wind tunnel side walls, and is fixed tothe Y-Z traversing mechanism (see Fig.3). The rake iscontinuously traversed (traversing speed 3 mm/s)perpendicular to the wing span, while takingmeasurements about every second. The measurementgrids of the five-hole rake and pitot rake are thusrespectively ∆Yx∆Z=15x3.4 mm2 and 3.5x3.4 mm2.For the five-hole rake it was decided to use a finergrid of ∆Yx∆Z=7.5x3.4 mm2 for the complex flowfield areas (wing tip and behind the simulators) by anintermediate traverse at half probe pitch. Dedicateddata handling software and interpolation thecalibration data base provides a nearly on-linepresentation of measured data.
3.2 Test programmeFor three model angles of attack αm = 2°, 4° and 6°,flow field measurements have been made at twodifferent positions behind the model (see alsoFig.1):
I) At about half-chord distance behind thewing trailing edge.
II) At about one chord distance behind thewing trailing edge.
The following cruise configurations were tested:
•• Clean wing without simulator.•• Clean wing with Through Flow Nacelle.
• Clean wing with turbo-powered CRUF. Therotational speed was set at RPM=3700 (idle)and 10500 rev/min (medium power).
Due to the cold turbine jet temperature (statictemperature below 200K), the high power conditionRPM=13300 rev/min could not be tested. The coldjet would cause freezing of the rake probes.
3.3 ResultsFigure 4 shows a sample of the five-hole results atone chord distance behind the wing trailing edge(rake plane II) for the clean wing with turbo-poweredCRUF simulator at RPM=3700 rev/min (idlecondition) and αm=4°. The cross flow velocitycomponents are represented as arrows while the axialvelocity components are represented as back groundcolours. The wakes from the wing, wing tip and
CRUF are clearly visible. Counter-clockwise crossflow components can be noted in the whole flow fieldand become stronger near the wing tip vortex. Asmay be expected over the complete half-span a down-wash of the wake exists with a stronger down-washnear the pylon. Furthermore, strong vortices aregenerated at the inboard side of the pylon and theoutboard side of the nacelle. These vortices deformthe originally circular nacelle wake to a square shape.All these effects increase in strength with angle ofattack.
4. PARTICLE IMAGE VELOCIMETRY (PIV)
4.1 Experimental set-upTwo different PIV systems have been used: aphotographic one for the investigation of the large-sized CRUF inlet flow and a digital one for study-ing the fan exhaust flow and the surrounding flowfield near wing and pylon. Photographic films arestill superior to digital cameras in so far as sensi-tivity and resolution are concerned. Consequently,they are capable to record larger observation areasthan CCD cameras do. Over and above that, in thepresent application no additional technical effortslike image-shifting had to be made for photographicPIV because the structure of the inlet flow wasexpected to be very simple.
In both cases a frequency-doubled Nd:YAG lasersystem (wavelength 532 nm), consisting of two Q-switched oscillators, was employed for illumina-tion. The laser system created double pulses of 2 x300 mJ with a repetition rate of 10 Hz. A combina-tion of spherical and cylindrical lenses spread thelaser beam to a thin light sheet which entered thetest section through a small opening in the wall andilluminated a plane inclined to the horizontal by 6°in Y-direction. An aerosol generator created oildroplets, 1 µm in size, by means of so-calledLaskin-nozzles, see Ref.4. The tracer particles werereleased by a seeding rake inside the settlingchamber of the wind tunnel.
Orthogonal to the light sheet, 100 mm lenses withan f-number 2.8 imaged the tracer particles by theirscattered light at a working distance of about2 meters. In the case of photographic recording theobservation area was 0.4 x 0.6 m2. A 35 mm SLRcamera (Yashica) took 36 images per run on a b/wfilm Kodak T-max 3200 of 100 lines/mmresolution. For digital recording two CCDprogressive scan cameras (Kodak) were used. Theyare able to take two single-exposed full frames(1024 x 1024 pixels) in quick succession each. Thetwo cameras were triggered simultaneously andobserved neighbouring areas (perpendicular to the

-6-NLR-TP-99104
- 4 -
wing) of the same object plane, each 0.2 x 0.2 m2 insize. In this configuration they took 2 x 30 imagepairs per run. Additionally, the optical set-up, i.e.the laser light sheet and the cameras, could beshifted in X-direction in order to investigate thewake flow at three different distances from theengine simulator, resulting in 3 x 60 image pairs perrun. The cameras were placed above the test sectionand mounted to the turntable, so that they did notneed to be readjusted when changing the modelangle of attack. The frame rate was always 10 Hz.
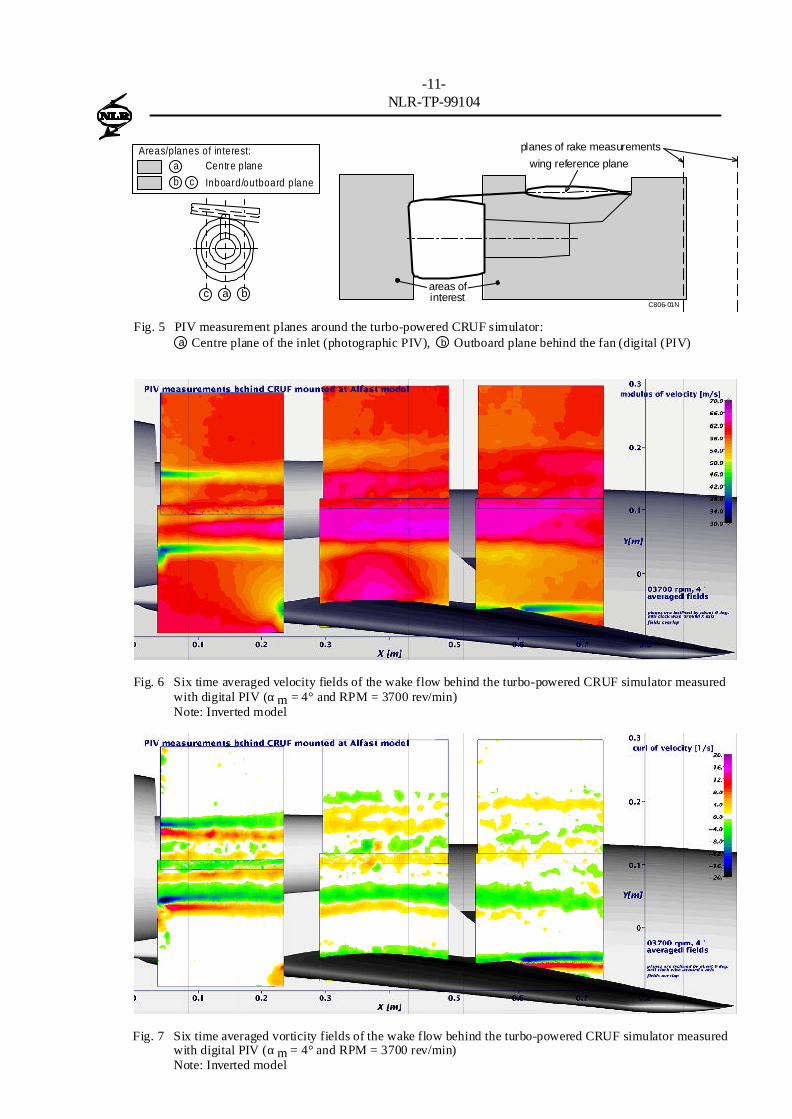
4.2 Test programmeOnly the clean wing with turbo-powered CRUF hasbeen tested. The measurement planes around theCRUF simulator are depicted in Fig. 5:
(a) Centre plane of the inlet (photographic PIV).(b) Outboard plane behind the fan (digital PIV).
Two parameters varied: the rotational speed of theengine simulator (3700 rev/min, 10500 rev/min and13300 rev/min) and the model angle of attack αm
(photographic PIV: 2° and 10°, digital PIV: 2°, 4°and 6°).
The photographs were evaluated by means of digi-tal auto-correlation. To this end a scanner read inthe negatives and digitalized the image data with aresolution of 2500 x 3700 pixels. The pictures takenwith the CCD cameras were evaluated by means ofdigital cross-correlation (resulting in a spatialresolution of about 7 mm). For details of PIV imageprocessing see Ref.5.
4.3 ResultsIn Figs. 6 and 7, results of the digital PIV measure-ments are presented. In Fig.6, a combination of sixtime-averaged velocity fields taken atRPM=3700 rev/min (idle condition) and αm=4° areshown, and in Fig.7 the corresponding time-averaged vorticity field (one component, orthogonalto the measurement plane) of the same run isdepicted.
In this case the jet coming out of the fan and thesurrounding main flow have nearly the samevelocity. The combined velocity field reveals thedecelerated wake flow behind the fan cowling andthe wing as well as the decelerated flow close to thestagnation point on the wing’s leading edge.Additionally, areas of increased velocity can beseen below the wing and inside the adjacent jet. Inthis region the jet appears to be slightly deflectedby the wing. This is confirmed by the vorticity fieldwhich indicates the velocity gradients of the wake.
5. CFD CALCULATIONS
5.1 Computational MethodComputations on the ALVAST cruise configuration(without engine simulator) were made with theFLOWer code, which is part of the MEGAFLOWsoftware system at DLR, see Ref.6. The code isdesigned to simulate flows around complexaerodynamic configurations and solves the three-dimensional compressible Reynolds-averagedNavier-stokes equations in integral form in thesubsonic, transonic and supersonic flow regime.Turbulence is modeled either by the algebraic modelof Baldwin-Lomax or the more general two-equationk-ω transport model of Wilcox. In this case the k-ωturbulence model was used. The numerical procedureof FLOWer is based on a finite volume formulationon block-structured meshes. The numerical grid usedfor the calculations on the ALVAST-model wasdesigned at NLR and improved in several steps(BRITE/EURAM program ENIFAIR).
For direct comparison with results obtained with thefive-hole probes, additional numerical evaluationswere necessary to obtain the flow field values in thesame plane as measured by the five-hole probes.
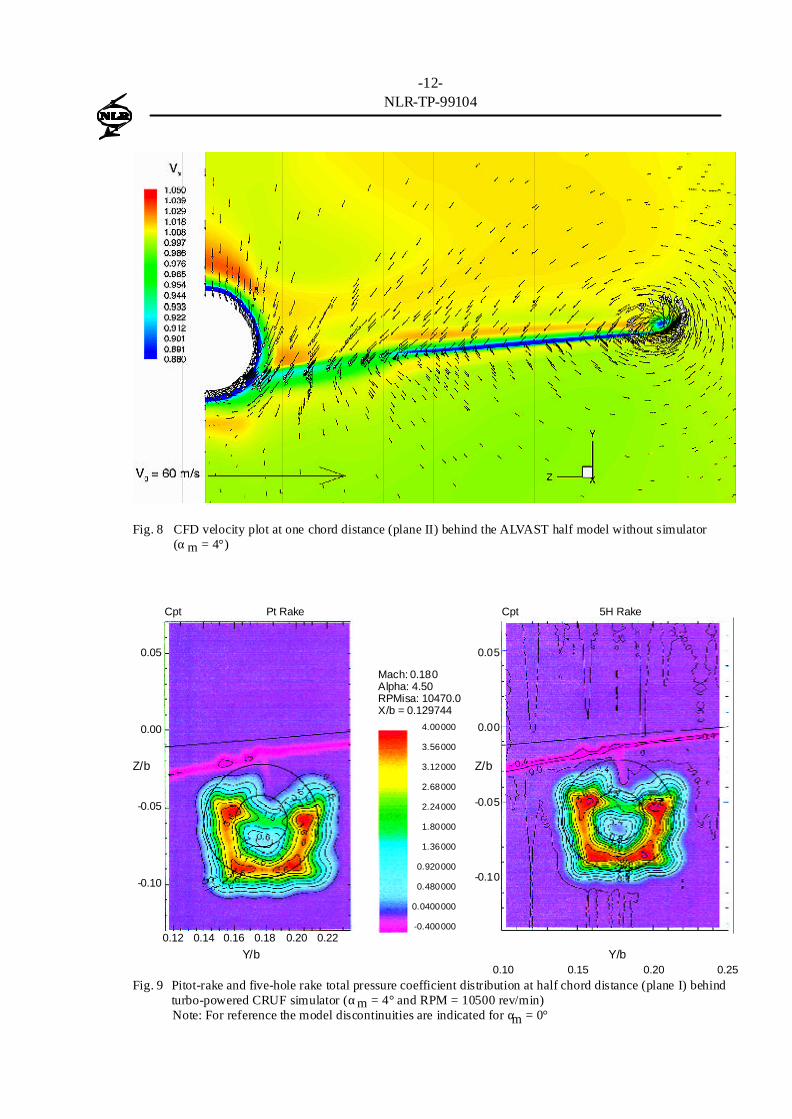
5.2 ResultsFig.8 shows the computed tunnel fixed flowvelocities at one chord length behind the wing trailingedge (rake plane II). As for the five-hole results, theaxial velocity Vx is visualised by the backgroundcolours and the cross-flow velocities Vy and Vz arerepresented as arrows, allowing a direct comparisonwith the rake measurements.
6. DISCUSSION OF RESULTSThe CFD results of Fig.8 (without engine simulator)and the presented five-hole rake results of Fig.4 canbe compared for the area well away from thesimulator location. The cross velocity componentsagree very well but a systematic difference can benoted with respect to the axial velocity distribution.This difference is higher than the estimated five-holerake measurement accuracy of ±0.01 (0.5 m/s) and islikely to be attributed to the tunnel wall effects (CFDcalculations were made for a tunnel wall freecondition).
Fig.9 shows the total pressure coefficient Cpt
distributions at about half chord distance (rakeplane I) behind the turbo-powered CRUF forRPM=10500 rev/min and αm=4°. At the left side thepitot rake and at the right side the five-hole rakeresults are presented. The Cpt-values are representedas back ground colours and identical values are

-7-NLR-TP-99104
- 5 -
connected via iso-lines. A good agreement betweenboth rakes can be noted. The larger diameter of thefive-hole rake probes does not result in systematicdifferences in the shear layers and vortex cores; onlysome extra scatter is introduced due to the calculationprocedures (data base interpolation, etc.). Instead inthe wing tip area the pitot rake shows a worse resultthan the five-hole rake (not shown here) due to thehigh local cross flow angles. The pitot rake measuresonly accurately for cross flow angles smaller than20°.
The 2-D PIV and the five-hole rake results can becompared at the intersection line of both planes atabout half chord distance (rake plane I) behind theturbo-powered CRUF (see also Fig.5). Therefore, thefive-hole rake data (3-D) are projected on the bodyfixed 2-D PIV plane and two interpolated data setshave been used. In Fig.10 the body fixed axial andvertical velocity components U and W (or Machnumber coefficients Mx/M0 and Mz/M0) are drawnversus height Z for αm=4° and RPM=10500 rev/min.Shown by different colours are: the five-hole rakeresults, PIV single realisation and the mean of 30 PIVrealisations. The deviations between the presentedPIV realisations indicate that in the fan-jet (rotatingflow) 30 realisations are probably not enough, toachieve a reliable mean. With exception of the lowerfan-jet area, the mean PIV realisation shows a goodagreement with the five-hole rake result. Both in theshear layer of the fan-jet and the wing wake, thedifferences are within 1 m/s (PIV and five-hole rakeaccuracies are respectively about 1 m/s and 0.5 m/s).
7. CONCLUDING REMARKSThe five-hole rake and PIV measurement techniqueswere successfully applied in the DNW-LST forengine/airframe interference flow field studies on theALVAST half model in cruise configuration (noflaps). For this case the two techniques arecomplementary and the results correspond well witheach other. Furthermore the precision of the five-holerake data was verified by available pitot-rake data.
A more detailed analysis of this test will be requiredto reveal unsteady features of engine/airframeinterference flow fields. Therefore advantage will betaken of the fact that instantaneous PIV measurementresults are available.
Further analysis is underway at NLR with respect tothe five-hole rake velocity fields along the modelspan. The data can be used to calculate the localviscous drag (total pressure losses), induced drag(vorticity) as well the lift. The local lift can becompared with the integrated wing pressure
distributions while the total lift and drag can becompared with the measured balance forces.A useful database with reliable data has becomeavailable for further improvement of the CFDmodelling. CFD computations have already beenmade for the ALVAST cruise configuration withoutsimulator, which correspond reasonably well with thefive-hole rake measurements. Next, the ALVASTconfiguration with Through Flow Nacelle and turbo-powered CRUF simulator are to be computed.Preferably the wind tunnel walls are incorporated inthe computations.
The DLR-NLR co-operation will continue withfurther analysis of the available PIV and five-holerake data, and with the CFD computations. A windtunnel test campaign on the (more realistic and alsomore complex) ALVAST half model in high-liftconfiguration equipped with the turbo-poweredCRUF simulator, is planned in the DNW-NWB forMay 1999. These tests will will include again five-hole rake, PIV and force measurements.
8. REFERENCES1. Hegen, G.H., Test report of force and flow fieldmeasurements on the ALVAST half model in theLow Speed wind Tunnel LST Phase 1 -test number5619-, TR 96576L.2. Hegen, G.H., Test report of force and flow fieldmeasurements on the ALVAST half model suppliedwith turbo-powered CRUF simulator in the LowSpeed wind Tunnel DNW-LST Phase 2 -test number6628-, TR xxxxxL.3. Hoheisel, H., The design of a Counter RotatingUltra-high-bypass Fan simulator for wind tunnelinvestigation, DLR, Institut für Entwurfs-aerodynamik, Braunschweig, DLR-FB 93-20, March1993.4. Echols, W.H.; Young, J.A., Studies of portableair-operated aerosol generators, NLR (NavalResearch Laboratory) Report 5929, Washington1963.5. Raffel, M.; Willert, C.E.; Kompenhans, J.,Particle image velocimetry − a practical guide,Springer-Verlag, Berlin 1998.6. Kroll, N.; Rossow, C.C.; Becker, K.; Thiele, F.,MEGAFLOW - A Numerical Flow SimulationSystem. 21st ICAS congress, 1998, Melbourne, 13.09-18.09.1998, ICAS-98-2.7.4, 1998

-8-NLR-TP-99104
- 5 -
connected via iso-lines. A good agreement betweenboth rakes can be noted. The larger diameter of thefive-hole rake probes does not result in systematicdifferences in the shear layers and vortex cores; onlysome extra scatter is introduced due to the calculationprocedures (data base interpolation, etc.). Instead inthe wing tip area the pitot rake shows a worse resultthan the five-hole rake (not shown here) due to thehigh local cross flow angles. The pitot rake measuresonly accurately for cross flow angles smaller than20°.
The 2-D PIV and the five-hole rake results can becompared at the intersection line of both planes atabout half chord distance (rake plane I) behind theturbo-powered CRUF (see also Fig.5). Therefore, thefive-hole rake data (3-D) are projected on the bodyfixed 2-D PIV plane and two interpolated data setshave been used. In Fig.10 the body fixed axial andvertical velocity components U and W (or Machnumber coefficients Mx/M0 and Mz/M0) are drawnversus height Z for αm=4° and RPM=10500 rev/min.Shown by different colours are: the five-hole rakeresults, PIV single realisation and the mean of 30 PIVrealisations. The deviations between the presentedPIV realisations indicate that in the fan-jet (rotatingflow) 30 realisations are probably not enough, toachieve a reliable mean. With exception of the lowerfan-jet area, the mean PIV realisation shows a goodagreement with the five-hole rake result. Both in theshear layer of the fan-jet and the wing wake, thedifferences are within 1 m/s (PIV and five-hole rakeaccuracies are respectively about 1 m/s and 0.5 m/s).
7. CONCLUDING REMARKSThe five-hole rake and PIV measurement techniqueswere successfully applied in the DNW-LST forengine/airframe interference flow field studies on theALVAST half model in cruise configuration (noflaps). For this case the two techniques arecomplementary and the results correspond well witheach other. Furthermore the precision of the five-holerake data was verified by available pitot-rake data.
A more detailed analysis of this test will be requiredto reveal unsteady features of engine/airframeinterference flow fields. Therefore advantage will betaken of the fact that instantaneous PIV measurementresults are available.
Further analysis is underway at NLR with respect tothe five-hole rake velocity fields along the modelspan. The data can be used to calculate the localviscous drag (total pressure losses), induced drag(vorticity) as well the lift. The local lift can becompared with the integrated wing pressure
distributions while the total lift and drag can becompared with the measured balance forces.A useful database with reliable data has becomeavailable for further improvement of the CFDmodelling. CFD computations have already beenmade for the ALVAST cruise configuration withoutsimulator, which correspond reasonably well with thefive-hole rake measurements. Next, the ALVASTconfiguration with Through Flow Nacelle and turbo-powered CRUF simulator are to be computed.Preferably the wind tunnel walls are incorporated inthe computations.
The DLR-NLR co-operation will continue withfurther analysis of the available PIV and five-holerake data, and with the CFD computations. A windtunnel test campaign on the (more realistic and alsomore complex) ALVAST half model in high-liftconfiguration equipped with the turbo-poweredCRUF simulator, is planned in the DNW-NWB forMay 1999. These tests will will include again five-hole rake, PIV and force measurements.
8. REFERENCES1. Hegen, G.H., Test report of force and flow fieldmeasurements on the ALVAST half model in theLow Speed wind Tunnel LST Phase 1 -test number5619-, TR 96576L.2. Hegen, G.H., Test report of force and flow fieldmeasurements on the ALVAST half model suppliedwith turbo-powered CRUF simulator in the LowSpeed wind Tunnel DNW-LST Phase 2 -test number6628-, TR xxxxxL.3. Hoheisel, H., The design of a Counter RotatingUltra-high-bypass Fan simulator for wind tunnelinvestigation, DLR, Institut für Entwurfs-aerodynamik, Braunschweig, DLR-FB 93-20, March1993.4. Echols, W.H.; Young, J.A., Studies of portableair-operated aerosol generators, NLR (NavalResearch Laboratory) Report 5929, Washington1963.5. Raffel, M.; Willert, C.E.; Kompenhans, J.,Particle image velocimetry − a practical guide,Springer-Verlag, Berlin 1998.6. Kroll, N.; Rossow, C.C.; Becker, K.; Thiele, F.,MEGAFLOW - A Numerical Flow SimulationSystem. 21st ICAS congress, 1998, Melbourne, 13.09-18.09.1998, ICAS-98-2.7.4, 1998

-9-NLR-TP-99104
177.5
Fig. 1 ALVAST half model with simulator
1.8°FE
FE391156.4
285600
3489
1714
217.2
1°
607
254
42
Dimensions in mm
1C
1/2CI II
rake planes
254gearbox housing (T/C)
slimline bearing (T/C)
forward outer shaft vearing (T/C)
counter rotating bearing (T/C)
aft turbine bearing (2xT/C)aft bearing (2xT/C)
2 forward turbinebearings (T/C)
gearbox temperatures:left hand idler cover (RTD)left hand idler inner race (RTD)right hand idler cover (RTD)right hand idler inner race (RTD)
STA0
STA2 85
STA60 3
RTD = PT100 like sensorT/C = type K-calibration (Chromel/Alumel)
thermocouple
Fig. 2 Turbo-powered CRUF simulator
0.88C
C806-01N
C806-01N

-10-NLR-TP-99104
Fig. 3 ALVAST half model with turbo-powered CRUF simulator
1.050001.010000.9700000.9300000.8900000.8500000.8100000.7700000.7300000.6900000.650000
Mach: 0.179Alpha: 4.52RPMIsa: 3747.4X = 0.230035
0.10 0.20 0.30 0.40 0.50
0.05
0.00
-0.05
-0.10
Z/b
Y/b
Mx/M0 5H Rake FINAL RESULTS
Fig. 4 Five-hole rake velocity plot at one chord distance (plane II) behind the ALVAST half model with turbo-powered CRUF simulator (αm = 4° and RPM = 3700 rev/min)Note: For reference the model discontinuities are indicated for αm = 0°
C806-01N
C806-01N
-11-NLR-TP-99104
Fig. 5 PIV measurement planes around the turbo-powered CRUF simulator:a Centre plane of the inlet (photographic PIV), b Outboard plane behind the fan (digital (PIV)
Fig. 7 Six time averaged vorticity fields of the wake flow behind the turbo-powered CRUF simulator measuredwith digital PIV (α m = 4° and RPM = 3700 rev/min)Note: Inverted model
Fig. 6 Six time averaged velocity fields of the wake flow behind the turbo-powered CRUF simulator measuredwith digital PIV (α m = 4° and RPM = 3700 rev/min)Note: Inverted model
wing reference plane
planes of rake measurements
areas ofinterestc a b
c
Centre plane
Inboard/outboard plane
Areas/planes of interest:
b
a
C806-01N
-12-NLR-TP-99104
Fig. 8 CFD velocity plot at one chord distance (plane II) behind the ALVAST half model without simulator(α m = 4°)
Fig. 9 Pitot-rake and five-hole rake total pressure coefficient distribution at half chord distance (plane I) behindturbo-powered CRUF simulator (αm = 4° and RPM = 10500 rev/min)
Note: For reference the model discontinuities are indicated for αm = 0°
4.00000
3.56000
3.12000
2.68000
2.24000
1.80000
1.36000
0.920000
0.480000
0.0400000
-0.400000
Mach: 0.180Alpha: 4.50RPMisa: 10470.0X/b = 0.129744
Cpt Pt Rake
0.05
0.00
-0.05
-0.10
Z/b
Cpt 5H Rake
0.12 0.14 0.16 0.18 0.20 0.22
0.10 0.15 0.20 0.25
0.05
0.00
-0.05
-0.10
Z/b
Y/bY/b

-13-NLR-TP-99104
2.4
2.2
2.0
1.8
1.6
1.4
1.2
1.0
0.8
0.6
0.2
0
-0.2
140
130
120
110
100
90
80
70
60
50
40
10
0
-10
-0.3 -0.2 -0.1 0 0.1 0.2 0.3z [m]
MZ
/M0
MX
/M0
U [m
/s]
W [m
/s]
Fig. 10 Comparison of the projected five-hole rake and 2-D PIV results at the intersection line half chord distance(plane I) behind turbo-powered CRUF simulator (α m = 4° and RPM = 10500 rev/min)
Single PIV realisationMean of 30 PIV realisationsFive-hole rake
C806-01N