Embed Size (px)
Citation preview
American Institute of Aeronautics and Astronautics
1
Flow-Field Investigation of Gear-Flap Interaction on a Gulfstream Aircraft Model
Chungsheng Yao1, Luther N. Jenkins1, Scott M. Bartram 2, Jerome Harris3, and Mehdi R. Khorrami4 NASA Langley Research Center, Hampton, Virginia 23681, USA
and
W. Derry Mace5 Sierra-Lobo, Hampton, Virginia 23681
Off-surface flow measurements of a high-fidelity 18% scale Gulfstream aircraft model in landing configuration with the main landing gear deployed are presented. Particle Image Velocimetry (PIV) and Laser Velocimetry (LV) were used to measure instantaneous velocities in the immediate vicinity of the main landing gear and its wake and near the inboard tip of the flap. These measurements were made during the third entry of a series of tests conducted in the NASA Langley Research Center (LaRC) 14- by 22-Foot Subsonic Tunnel (14x22) to obtain a comprehensive set of aeroacoustic measurements consisting of both aerodynamic and acoustic data. The majority of the off-body measurements were obtained at a freestream Mach number of 0.2, angle of attack of 3 degrees, and flap deflection angle of 39 degrees with the landing gear on. A limited amount of data was acquired with the landing gear off. LV was used to measure the velocity field in two planes upstream of the landing gear and to measure two velocity profiles in the landing gear wake. Stereo and 2-D PIV were used to measure the velocity field over a region extending from upstream of the landing gear to downstream of the flap trailing edge. Using a special traverse system installed under the tunnel floor, the velocity field was measured at 92 locations to obtain a comprehensive picture of the pertinent flow features and characteristics. The results clearly show distinct structures in the wake that can be associated with specific components on the landing gear and give insight into how the wake is entrained by the vortex at the inboard tip of the flap.
Nomenclature X = distance along the longitudinal axis, cm Y = distance along the lateral axis, cm Z = distance along the normal axis, cm U = velocity component in the X direction, (m/s) V = velocity component in the Y direction, (m/s) W = velocity component in the Z direction, (m/s) TKE = turbulent kinetic energy, (m/s)
I. Introduction Noise generated by the airframe is a major component of aircraft noise during approach to landing. The prominent
airframe noise sources are the wing high-lift devices (e.g., flaps and leading-edge slats) and the undercarriage.1-10 Increasingly, computational simulations are being used to predict airframe noise11-14 and develop viable mitigation
1 Aerospace Engineer, Flow Physics and Control Branch, NASA Langley Research Center, MS 170. 2 Optical Technician, Advanced Sensing and Optical Measurements Branch, NASA Langley Research Center, MS 493. 3 Optical Technician, Flow Physics and Control Branch, NASA Langley Research Center, MS 170. 4 Aerospace Engineer, Computational AeroSciences Branch, NASA Langley Research Center, MS 128, Associate Fellow AIAA. 5 Systems Engineer, Technical Applications Branch, NASA Langley Research Center, MS 289.
https://ntrs.nasa.gov/search.jsp?R=20150000560 2018-07-11T12:15:53+00:00Z

American Institute of Aeronautics and Astronautics
2
concepts. Advancement and maturation of the computational tools required to accurately predict airframe noise for a full aircraft geometry is an important goal of NASA’s Environmentally Responsible Aviation (ERA) Project. Proper development and validation of such tools depend on the availability of high-quality, flow field measurements (both on surface and off surface). Under the NASA-Gulfstream partnership on airframe noise research, a high-fidelity 18% scale semi-span model of a Gulfstream aircraft was used as a test bed to conduct a comprehensive set of aeroacoustics measurements. The tests, performed in three separate entries in the NASA Langley Research Center (LaRC) 14- by 22-Foot Subsonic Tunnel (14x22), included both aerodynamic and acoustic measurements. The first entry, accomplished during October-November of 2010, was entirely devoted to mapping the aerodynamic characteristics of the 18% aircraft model. In addition to documenting the global forces (e.g., lift, drag, pitching moment, etc.), extensive steady and unsteady surface pressure measurements were performed. A full description of the 18% scale, semi-span model and details of the 2010 steady and unsteady measurements are provided in references 15 and 16, respectively. The acoustic and off-surface flow measurements, 2nd and 3rd entries in the 14x22 tunnel, were performed during February-March and March-April of 2013, respectively. An account of the acoustic results is given in a companion paper17. The present paper provides details of the 3rd entry, which was entirely devoted to off-surface flow measurements of the 18% scale aircraft model in landing configuration with the main landing gear deployed. Particle Image Velocimetry (PIV) and Laser Velocimetry (LV) techniques were used to collect the desired flow data. Leading-edge slats are absent in the Gulfstream aircraft high-lift system; therefore, attention was focused on the noise source areas associated with flaps and main landing gear. The off-surface flow regions of interest were identified to be the inboard and outboard flap tips plus the flow field in the immediate vicinity of the main landing gear and its wake. Because of tunnel time constraints, we chose to concentrate our effort on obtaining quality data for the flap inboard tip, main landing gear, and the gear-flap interaction zone. This decision facilitated the achievement of two important goals of the study. First, very little is known about the component interaction in airframe noise collectively termed as “installation effects”. Gear-flap interaction noise for a realistic geometry in a relevant aerodynamic setting is among the installation effects that have remained virtually unexplored. The present experiment provided a unique opportunity to increase our knowledge on the nature of this extremely complex interaction and how the presence of one component (main gear) may alter the turbulent fluctuation field experienced by the other component (flap). Second, the extreme geometric and flow field complexities associated with gear-flap combinations represent a grand challenge for the predictive tools based on computational simulations. Gathering of quality flow field data on this complex interaction paves the way for successful validation/benchmarking of our predictive capabilities and enhances the state of the art for modeling and simulation of full airframe noise prediction and abatement.
II. Experiment and Measurements
A. Facility and Model Description The 14x22 is a closed-return, subsonic wind tunnel with a maximum speed of 103 m/s and maximum dynamic
pressure of 6.503 kilopascals. These conditions correspond to a freestream Mach number of 0.30 and unit Reynolds number of 7.2 million per meter. As the name implies, the test section is 4.27 meters (14 feet) by 6.71 meters (22 feet) and can be configured in a variety of ways. For the off-body measurements, the test section was configured with the tunnel floor in place and the tunnel sidewalls and ceiling raised to maximize optical access to the model. Additional details and information about the facility can be found in Ref. 18.
The test article was an 18% scale, semi-span, high-fidelity replica of a Gulfstream aircraft (see Fig. 1a.). It was designed, fabricated, instrumented, and integrated at the NASA Langley Research Center based on a set of geometry files provided by Gulfstream. The model includes a fuselage, wing, flap, flow-through nacelle, pylon, and main landing gear. From nose to tail, the model is 4.709 meters (185.4 inches) long. The wing span (measured from the wind tunnel floor to the tip of the winglet) is 2.654 meters (104.5 inches). A full account of the model development effort, including its fabrication, instrumentation, and integration is given in Refs. 15 and 16. The model coordinate system and datum for all distances are given in Fig. 1b.

American Institute of Aeronautics and Astronautics
3
a. 18% scale Gulfstream model in the 14- by 22-Foot Subsonic Tunnel.
b. Model coordinate system and reference location for all distances.
Figure 1. Gulfstream model and model coordinate system.
B. Measurement Techniques
1. Particle Image Velocimetry To investigate and document the landing-gear wake and flow near the inboard edge of the flap, off-body
measurements were made in the wake of the landing gear and along the inboard side edge of the flap using PIV. Over the past seven years, stereo PIV (SPIV) systems have proven to be a valid and efficient tool to document wake flows in the 14x22 for both fixed-wing and rotary-wing configurations. The challenge in this experiment was to configure the PIV systems to survey close to a surface and capture highly vortical and complex shear flows with high resolution. To address this challenge, four windows were installed in the tunnel floor adjacent to the model to minimize the distance between the measurement area and the cameras. Figure 1a shows the position of the windows relative to the model and Fig. 2 shows the PIV cameras beneath the tunnel floor. The cameras and optics used to generate the lightsheet were mounted on a rigid frame attached to the underside of the turntable that could be translated parallel to the waterline of the model. This arrangement provided several benefits. First, with the frame and PIV system attached to the turntable, data could be acquired at any angle of attack and the measured velocities would automatically be in the model coordinate system. Secondly, the relative position between the cameras and the lightsheet could be maintained when moving between measurement locations. As such, the time-consuming process of reconfiguring and re-calibrating the PIV system at each location was eliminated. This enabled the flow to be

American Institute of Aeronautics and Astronautics
4
surveyed in closely-spaced planes to produce a volume of flow field data. The only disadvantage to this arrangement was that it put the cameras in backscatter which means that the particle exposure and signal-to-noise ratio were not optimal.
Figure 2. SPIV camera orientation under the tunnel floor. Two different PIV configurations were used to acquire data in the wake of the landing gear. The first
configuration consisted of a 2D PIV system to measure two components of velocity in X-Y planes behind the landing gear. As shown in Fig. 3, this configuration featured a single PIV camera with 400mm focal length lens located at the side of the test section with the laser sheet projected upward through one of the glass windows in the tunnel floor. The field of view (FOV) for this PIV configuration was approximately 300x200 mm (width x height) and the working distance was approximately 4.27 meters (14 feet) from the underside of the model. The location and orientation of the measurement planes relative to the landing gear are shown in Fig. 4. For this and the other PIV configurations described in the next paragraph, the actual measurement area is smaller than the specified FOVs because of constraints on where the laser sheet could be projected through the tunnel floor, flare caused by impingement of laser light on the model, and acute blockage of the measurement area in certain camera views by the complicated geometry of the landing gear/flap.
The second PIV configuration consisted of a SPIV system that was used to measure three components of velocity in cross-flow planes behind the landing gear. The SPIV cameras were arranged on opposite sides of the light sheet as it was projected to the measurement areas through the windows in the tunnel floor. The orientation of the cameras is shown in Fig. 2. Images were acquired using both 100 mm and 180 mm focal length lenses to cover FOVs measuring 330 mm x 430 mm and 160 mm x 210 mm, respectively. The larger FOV was used to capture the wake behind the wheels and the lower portion of the strut. The smaller FOV was used to capture flow features emanating from the door and other components on the upper part of the strut and the flow interaction near the inboard edge of the flap. The location and orientation of the individual measurement planes for the second PIV configuration are shown in Figs. 5a and 5b.

American Institute of Aeronautics and Astronautics
5
Figure 3. 2D PIV camera configuration.
Figure 4. Location and orientation of 2D-PIV measurement planes.
a. Wheel and lower portion of the strut
b. Upper portion of the strut/inboard edge of the flap
Figure 5. Location and orientation of SPIV measurement planes.
A SPIV system was also used to obtain detailed measurements of the flow field near the side edge of the flap.
Because of the structural support beams under the tunnel floor, space limitations, and model blockage constraints, this SPIV system had to be configured with the stereoscopic cameras installed on the same side of the laser sheet as depicted in Fig. 6. The angle between the stereoscopic cameras was less than 30 degrees, which is a compromised design compared to the conventional/optimal separation angle of 90 degrees. A 90 mm focal length lens was used on the camera nearest to the light sheet and a 210 mm focal length lens was used on the far camera to obtain a FOV of approximately 130 mm x 100 mm. The location and orientation of the measurement planes for this system are shown in Fig. 7.
Figure 6. SPIV camera configuration to accommodate window access from below the test floor.

American Institute of Aeronautics and Astronautics
6
Figure 7. Location and orientation of SPIV measurement planes near the side edge of the flap.
To seed the flow, a mineral oil based mixture was used with a commercial fog machine to produce polydispersed
particles ranging in diameter from 0.25 microns to over 1.5 microns. The fog machine was located in the rear of the test section and, at specific intervals, ejected particles into the flow where they would pass through the diffuser, fan, and return leg of the tunnel before entering the test section.
2. Laser Velocimetry In addition to PIV, velocity information was also obtained upstream, and in the near wake, of the landing gear
using a two-component laser velocimeter (LV) system. The LV system at the 14- by 22-Foot Subsonic Tunnel features state-of-the-art fiber-optic based transmit/receive optics and a custom data acquisition and real-time signal/data processing system. A full description of the system can be found in references 19 and 20.
Upstream of the landing gear, the U and V components of velocity were measured at X = 0 cm and X = 35.56 cm (14 inches). At X = 0 cm, two profiles were obtained by scanning the system in the Y direction and then in the Z direction. Each profile consisted of 7 points spaced 5.08 cm (2 inches) apart, with a common point at Y = 48.21 cm (18.98 inches) and Z = -54.61 cm (-21.50 inches). At X = 35.56 cm, measurements were made on a rectangular grid consisting of 81 points extending from Y = 32.97 cm (12.98 inches) to Y = 63.45 cm (24.98 inches) and Z = -38.10 cm (-15.00 inches) to Z = -72.39 cm (-28.5 inches). The spacing between points was 5.08 cm (2 inches) and 3.81 cm (1.50 inches) in the Y and Z directions, respectively.
Downstream of the landing gear, profiles of U and V components of velocity were measured at two locations. The first profile was obtained at X = 53.14 cm (20.92 inches) and Z = -38.61 cm (-15.2 inches) behind the upper part of the strut. This profile consisted of 36 points spaced 0.51 cm (0.20 inches) apart between Y = 43.13 cm (16.98 inches) and Y = 60.91 cm (23.98 inches). The second profile was obtained behind the wheel at X = 67.56 cm (26.6 inches) and Z = -56.82 cm (-22.37 inches). This profile consisted of 25 points spaced 1.02 cm (0.40 inches) apart between Y = 35.00 cm (13.78 inches) and Y = 59.39 cm (23.38 inches) and coincided with the location of one of the PIV measurement planes, thus providing data for comparison with the PIV results. The LV configuration is shown in Fig. 8 and the locations of the measurement plane and line profiles relative to the landing gear are shown in Fig. 9.
Figure 8. LV configuration. Figure 9. LV measurement locations.

American Institute of Aeronautics and Astronautics
7
III. Results
The majority of the results that will be presented and discussed in this section were obtained at an angle of attack of 3 degrees, flap deflection angle of 39 degrees, and landing gear on. The tunnel flow conditions were set to a freestream Mach number of 0.2 which corresponds to a freestream velocity of 68.6 m/sec (225 ft/sec) and a unit Reynolds number of 4.4 x 10⁶ per meter (1.341 x 10⁶ per foot). At these conditions, the Reynolds number based on the mean aerodynamic chord of 0.782 meters (30.8 inches) was 3.4 x 10⁶. Data were also acquired for a limited number of runs at different Mach numbers (0.16, 0.22, 0.24), angles of attack (5 and 7 degrees), and with the landing gear off to examine the effect on the flow field. The Reynolds numbers based on mean aerodynamic chord for these Mach numbers are 3.5 x 10⁶, 4.8 x 10⁶, and 5.2 x 10⁶, respectively.
At most measurement locations, the mean and standard deviation of the velocity were computed using 600 to 1000 PIV images and 1000 or more LV samples., Based on the convergence plots of the mean velocity and standard deviation shown in Fig. 10 for a typical point from the PIV results, 600 to 1000 samples were deemed sufficient to estimate turbulence quantities and examine the level of flow unsteadiness.
Figure 10. Convergence of mean velocity and standard deviation.
For the PIV results, the measurement uncertainty for each velocity component was estimated to be less than 1 m/sec. Background noise levels in the freestream flow also contribute to the error in the measurements and can produce a standard deviation in the magnitude of velocity of 1 m/sec. Unfortunately, because the images were acquired in backscatter mode, the signal-to-noise ratio is low in many of the PIV images. As a result, we expect the second-order statistics to be slightly elevated. Nevertheless, the velocity fluctuations and distribution can still provide useful information to study and characterize the wake structure and flow unsteadiness associated with gear-flap interactions.
American Institute of Aeronautics and Astronautics
8
For the presentation and discussion of the results, the flow field has been subdivided into four zones or areas: (1) the flow upstream of the landing gear, (2) the wake behind the landing gear wheels, (3) the wake behind the upper segment of the strut, and (4) the vortical flow field at the flap side edge. Unless specifically noted, all velocity quantities are presented in meters per second and all distances are presented in centimeters.
A. Upstream of the Landing Gear Although the flow field upstream of the landing gear is expected to be benign, it was deemed important to obtain
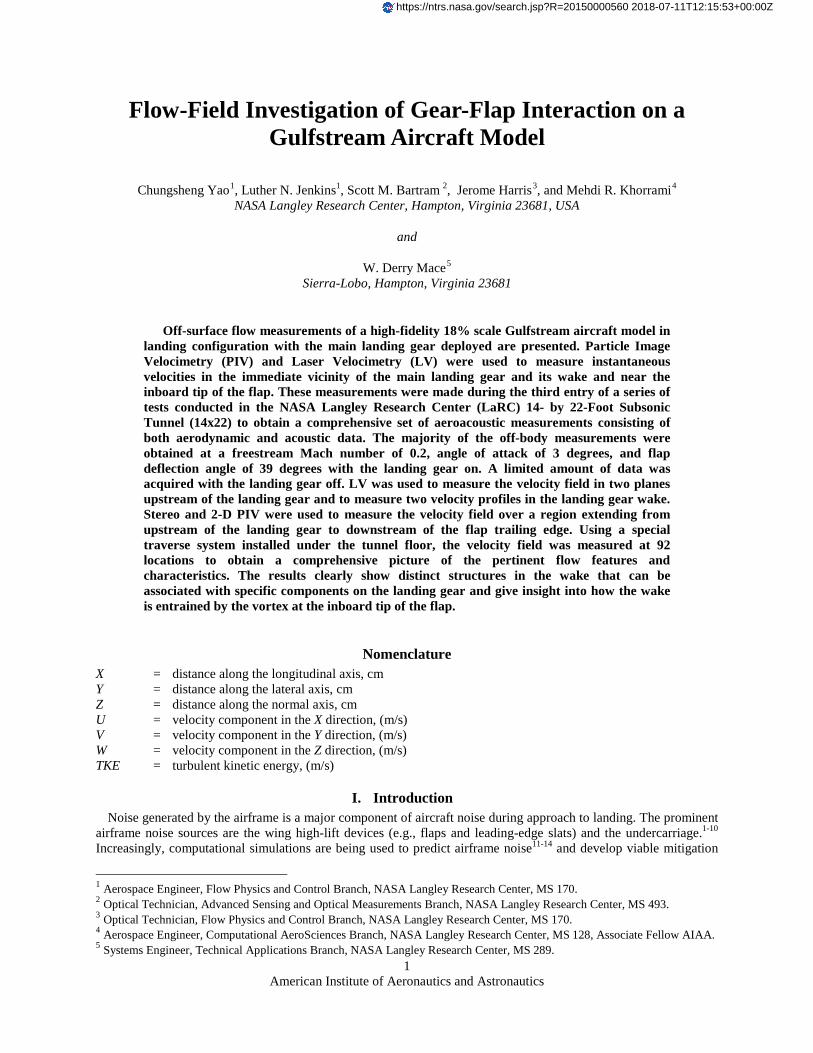
information about the flow uniformity and turbulence levels in this region with and without the landing gear deployed to determine the influence of the landing gear on the upstream flow and to provide an anchor point for current and future computational studies associated with this experiment. In Figs. 11a and 11b, line contours of the mean velocity obtained at X = 35.56 cm (12.98 inches) using the LV system show that the landing gear has a significant influence on the local flow field. At this location, the flow directly in front of the wheels has decelerated to approximately one third of the freestream velocity and the V component of velocity reaches its peak value as the flow begins to turn near the outer edges of the wheels. It is also interesting to note that the location where the U component of velocity is lowest and V component of velocity reaches its highest value is slightly below the wheel axle. This could be due to local flow angularity possibly induced by the circulation around the wing. Unfortunately, the W component of velocity could not be measured; therefore, the level of flow angularity in the X-Z plane could not be quantified.
a. U component of velocity .
b. V component of velocity
Figure 11. Line contours of mean velocity upstream of the landing gear at X = 35.56 cm.
B. Wake Behind the Landing Gear Wheels Behind the landing gear wheels, the velocity field was measured using SPIV at 19 locations between X = 64.16
cm (25.26 inches) and X = 90.17 cm (35.50 inches). The images were processed using a 32 pixel by 32 pixel interrogation area with 50% overlap. These settings resulted in a spatial resolution of 4.90 mm x 4.90 mm (0.19 inches x 0.19 inches). In Fig. 5a, the location of each plane is shown relative to the landing gear wheels and the flap. In Figs. 12a-c, the in-plane vector field, line contours of the U velocity component, and contours of turbulent kinetic energy (TKE) are shown for three locations in the wake behind the landing gear wheels, X = 66.17 cm (26.05 inches), X = 78.17 cm (30.78 inches), and X = 88.17 cm (34.71 inches). These locations are approximately 9.79 cm (3.853 inches), 22.48 cm (8.85 inches), and 31.78 cm (12.51 inches) downstream of the rearmost point on the surface of the landing gear wheel, respectively. Also, the plane located at X = 78.17 cm is essentially at the same location as the flap trailing edge (X = 77.98 cm (30.70 inches)).
In Fig. 12a, the line contour plot shows that the wake immediately behind the wheels is comprised of two, well-defined, oval regions or zones: one near the bottom of the wheels (Zone 1) and one near the top of the wheels (Zone

American Institute of Aeronautics and Astronautics
9
2). The in-plane vector field shows a well-defined saddle point centered at the wheel axle and vortical flow patterns within each zone. Zone 1 contains two, symmetric vortical flow patterns whereas Zone 2 only contains one. Both zones remain visible in the downstream planes (Figs 12b and 12c); however, the vortical flow pattern no longer exists. The data also show that the position of Zone 1 stays nearly constant in each of the planes but the position of Zone 2 changes quite rapidly as it moves closer to the inboard flap edge. In Fig. 13, multiple PIV planes were assembled to create a volumetric depiction of the data. The iso-surface of the U component of velocity (U = 15 m/s) provides a three-dimensional view of the wake and clearly shows the two zones. From this image it appears that Zone 2 is the combined wake of the front and rear struts near the knee joint. Contours of TKE in the measurement plane near the wheels (Fig. 12a) show a concentration of turbulence in Zone 1. In the measurement plane near the tip of the flap (Fig. 12b), equal concentrations of turbulence are seen in both zones. The other regions of high TKE in this image (the red area on the left and the red stripe at the top) are not physical (flow induced) but resulted from a problem with the light sheet optics during this particular run. Downstream of the flap trailing edge, the contours of TKE in Fig. 12c show that turbulence is still concentrated in both zones but the levels are comparable to the levels shown in Fig. 12a.
a. X = 66.17 cm (26.05 inches)
b. X = 78.17 cm (30.78 inches)
c. X = 88.17 cm (34.71 inches)
Figure 12. In-plane vector field (left column), U component of velocity (middle column), and turbulent kinetic energy (right column) in the wake of the landing gear.

American Institute of Aeronautics and Astronautics
10
Figure 13. Velocity iso-surface of the U component of velocity (U = 15 m/s) showing the two zones in the wake.
Figures 14 and 15 show profiles of the mean velocity and the corresponding standard deviation obtained in the wake downstream of the landing gear wheels at X = 67.56 cm (26.6 inches) and Z = -56.82 cm (-22.37 inches) using both LV and PIV. The location of this measurement station relative to the landing gear is shown in Fig. 9. Data used to produce the PIV profile were extracted from the PIV crossflow plane at this location. In Fig. 14, profiles of the U component of velocity show that the width of the wake is approximately 12 cm and the velocity deficit is over 50% of the freestream velocity. In Fig. 15, profiles of the V component of velocity show that the velocity is positive below Y = 47 cm (18.50 inches) and negative above it. The location of this profile in the Z direction is between the saddle point and Zone 1 discussed in the previous paragraph, so the profile is consistent with the vortical flow pattern associated with Zone 1. Between the two regions of vortical flow, the flow interaction generates turbulence levels on the order of 20%.
At this location, the two measurement techniques provide comparable results in terms of trends and overall magnitude. However, the profiles of the U component of velocity show some fairly large differences in the magnitude of the deficit within the center of the wake and the profiles of standard deviation show significant differences in the upper third of the profile. The PIV results in this part of the profile may be affected by a lower signal-to-noise ratio due to flare off the landing gear wheels. At this measurement location, half of the inboard wheel is visible in the PIV image from the upstream camera so scattered light off the wheel surface could significantly increase the background noise in this part of the image.
Figure 14. Profiles of mean velocity and standard deviation (U).

American Institute of Aeronautics and Astronautics
11
Figure 15. Comparison between LV and PIV in the wake behind the landing gear wheels.
C. Wake Behind the Strut Upper Segment
To investigate the wake behind the upper segment of the strut, the 2-D PIV and stereo PIV systems described in Section II B were both used to obtain a comprehensive picture of the flow field. Using the 2-D PIV system, data were acquired in 10 streamwise planes spaced 10 mm apart between Z = -26.75 cm (-10.53 inches) and Z = -35.74 cm (-14.07 inches). Based on the orientation of the 2-D system, only the U and V velocity components could be measured. Although the FOV was 300 mm x 200 mm (11.81 inches x 7.87 inches), the entire plane could not be illuminated by the light sheet due to blockage by the support structure under the tunnel floor and the mask that was applied on the upper surface of the window to prevent the laser light from impinging directly on the side edge of the flap. After the 2-D data were acquired, the SPIV system was used to obtain information in 47 cross-flow planes spaced 5 mm apart between X = 64.17 cm (25.26 inches) to X = 86.17 cm (33.93 inches). The images were processed using a 24 pixel by 24 pixel interrogation area with 50% overlap. For the 2-D PIV system the spatial resolution was 1.21 mm by 1.21 mm (0.048 inches by 0.048 inches) and for the SPIV system, the spatial resolution was 1.81 mm by 1.81mm (0.071 inches by 0.071 inches).
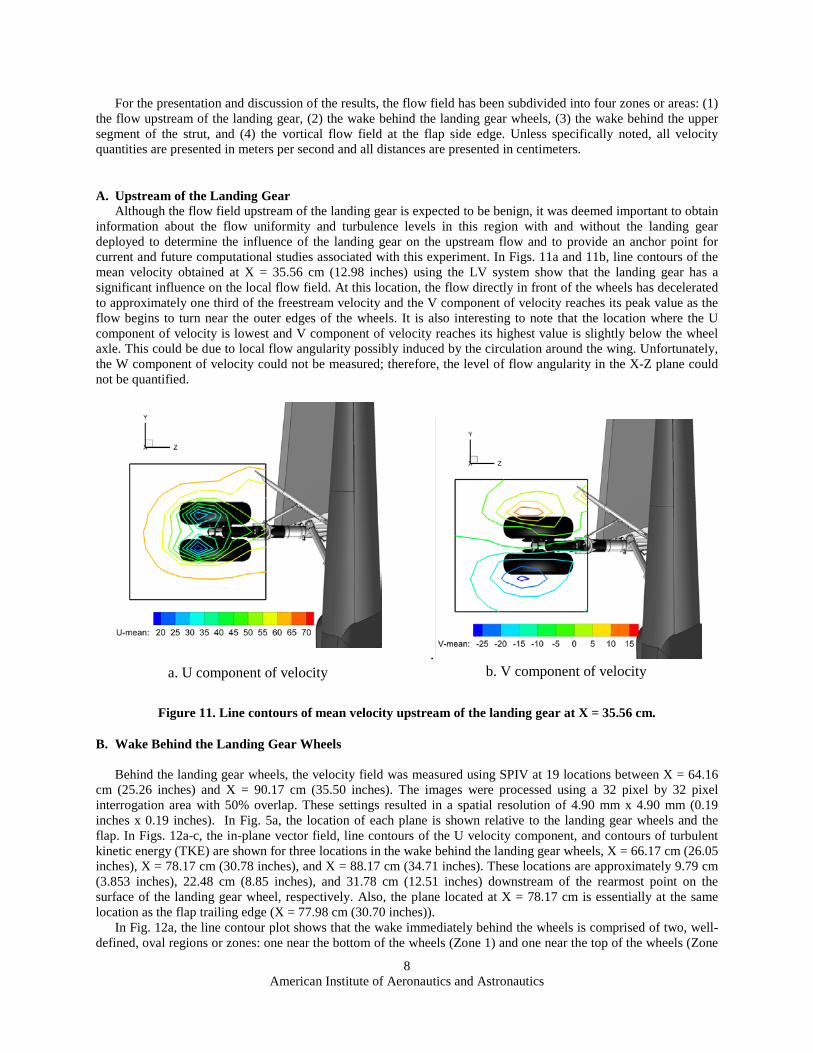
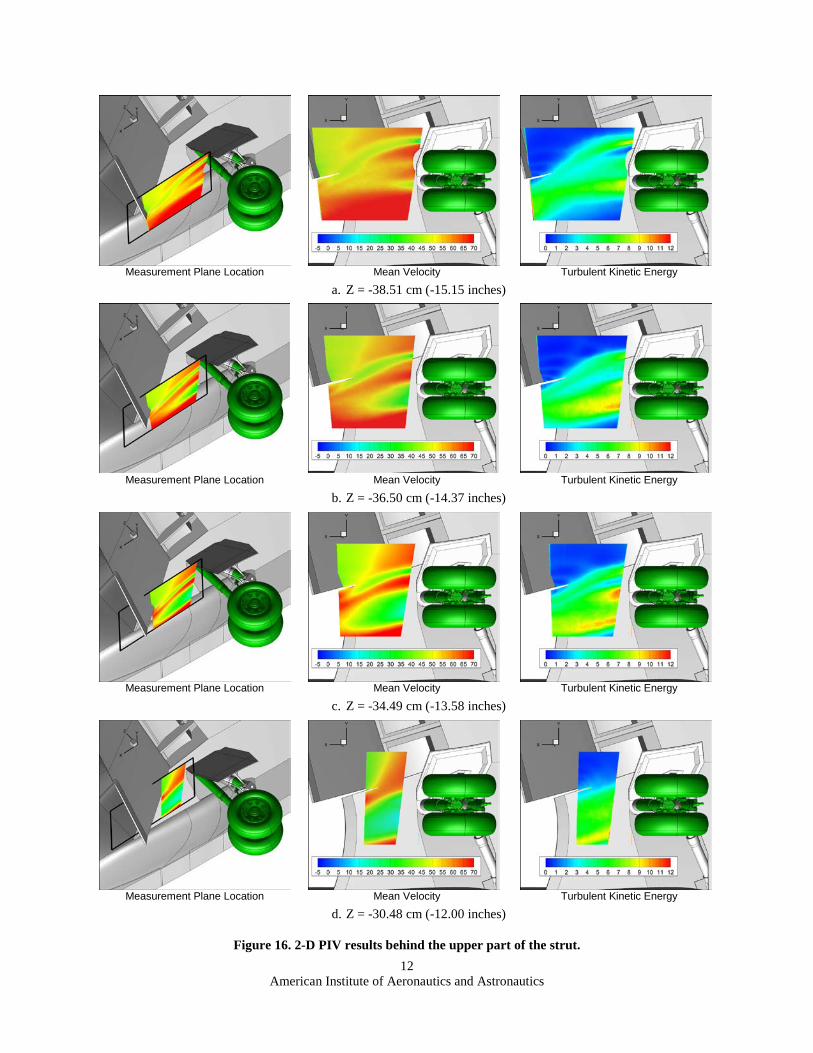
In Figs.16a-d, results from the 2-D PIV system are presented for four locations behind the upper part of the strut. Each figure shows the location of the measurement plane relative to the landing gear along with contours of the U velocity component and TKE. In this case, the W component of velocity was not measured and therefore could not be included in the calculation. Consequently, the values of TKE represent the 2-D in-plane component of total energy. In the contours of mean velocity, the wakes from the landing gear door and the strut are easily distinguishable except at Z = -30.48 cm (-12.00 inches) where it appears that the wake from the door and the wake from the other landing gear components have merged. It appears that only the wake from the landing gear door impinges on the flap near the side edge. The wake from the strut is wedged between two regions of high-speed flow and turns inboard. The contours of TKE show that the turbulence level is relatively constant throughout the wake; however, there are some high levels of turbulence near the landing gear and some bands of high TKE are shown in Figs. 16c and 16d. These bands appear to be associated with the wake from the side brace actuator.
American Institute of Aeronautics and Astronautics
12
Measurement Plane Location
Mean Velocity
Turbulent Kinetic Energy
a. Z = -38.51 cm (-15.15 inches)
Measurement Plane Location
Mean Velocity
Turbulent Kinetic Energy
b. Z = -36.50 cm (-14.37 inches)
Measurement Plane Location
Mean Velocity
Turbulent Kinetic Energy
c. Z = -34.49 cm (-13.58 inches)
Measurement Plane Location
Mean Velocity
Turbulent Kinetic Energy
d. Z = -30.48 cm (-12.00 inches)
Figure 16. 2-D PIV results behind the upper part of the strut.

American Institute of Aeronautics and Astronautics
13
Figure 17 shows color contours of U velocity component and turbulent kinetic energy obtained in crossflow
planes at X = 66.17 cm (26.05 inches) and X = 86.17 cm (33.93 inches). In these images, data measured behind the upper part of the strut (outlined by the black border) and data obtained behind the wheels have been superimposed to produce a composite picture of almost the entire landing-gear wake. The view is looking upstream toward the landing gear. The dotted line denotes the centerline of the front and rear struts. Although the datasets were acquired several days apart, the overlap of the contour levels is remarkable and shows that the repeatability is quite good. In Fig. 17a, the contours of streamwise velocity show the two zones in the wake behind the wheels as well as the wake and tip vortex from the landing gear door. Unfortunately, part of the wake from Y = 41 cm to Y = 48 cm and Z = -32 cm to Z = -37 cm could not be captured because the view of one of the PIV cameras was obstructed by the mask used to reduce laser light scattered off the inboard side edge of the flap. Downstream of the flap trailing edge, the velocity contours in Fig. 17b show the two zones and the vortex formed on the inboard edge of the flap. Zone 2 has moved towards the flap but has not merged with the vortex system. Compared to the upstream station, the TKE levels in the two zones are lower and the highest levels are now found outside the vortex core.
Mean Velocity
Turbulent Kinetic Energy
a. X = 66.17 cm (26.05 inches)
Mean Velocity
Turbulent Kinetic Energy
b. X = 86.17 cm (33.93 inches)
Figure 17. U component of velocity and turbulent kinetic energy upstream and downstream of the flap trailing edge.

American Institute of Aeronautics and Astronautics
14
D. Vortical Flow Field at Flap Side Edge The flow field on the inboard side edge of the flap is known to be dominated by separate shear layers. The
cameras were configured to specifically look at the region very close to the side edge of the flap to capture the shear layer and the vortex in the early stages of formation. Data were acquired in nine crossflow planes located between X = 71.78 cm (28.26 inches) and X = 89.89 cm (35.39 inches). Three planes were located upstream of the flap trailing edge (see Fig. 18a) and six were located downstream of it.
In Fig. 18b, contours of the U component of velocity are shown for the three upstream planes located at X = 71.78 cm (28.26 inches), X = 74.88 cm (29.48 inches), and X = 75.79 cm (29.84 inches). As a result of these planes being in the coordinate system of the model and not normal to the chord of the flap, some of the flow features appear slightly distorted. Nevertheless, the PIV results reveal regions of high-velocity fluid near the flap side edge as well as high velocity fluctuations. As seen in Fig. 18c, the standard deviation of the U velocity component near the flap side edge is as high as 40 m/sec.
a. Sample measurement plane upstream of flap trailing edge.
b. Mean U velocity c. Standard deviation
Figure 18. Color contours of U velocity near the side edge of the flap.
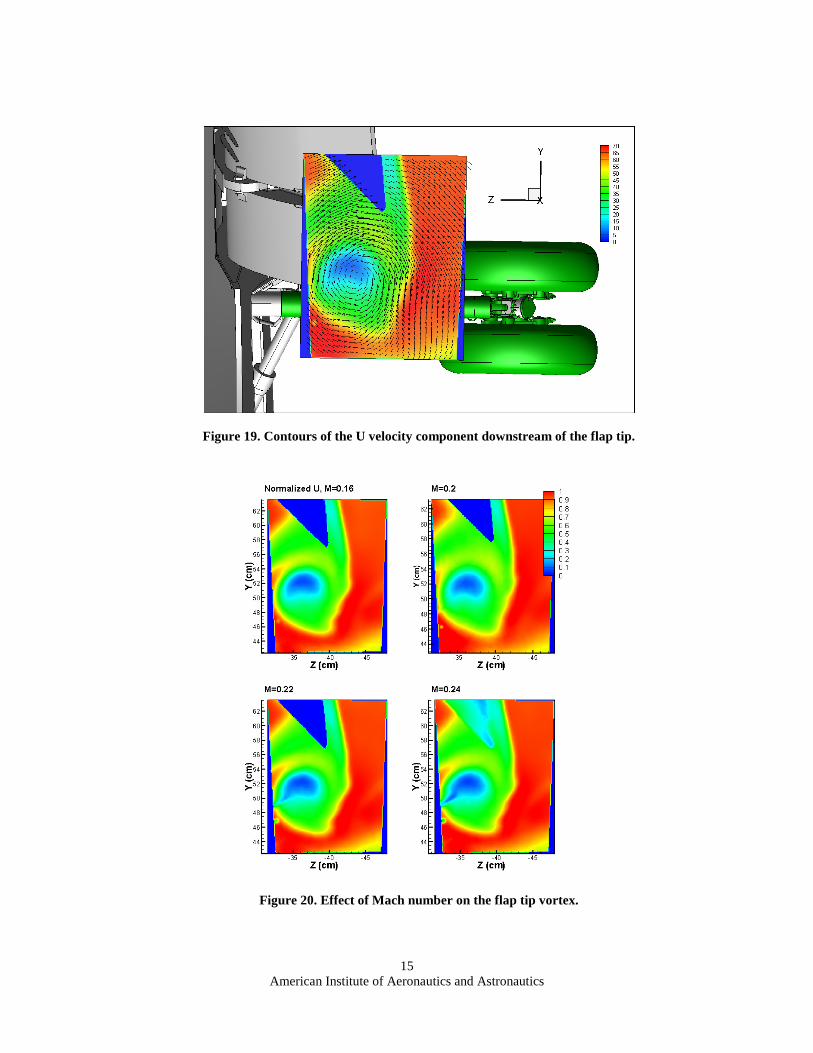
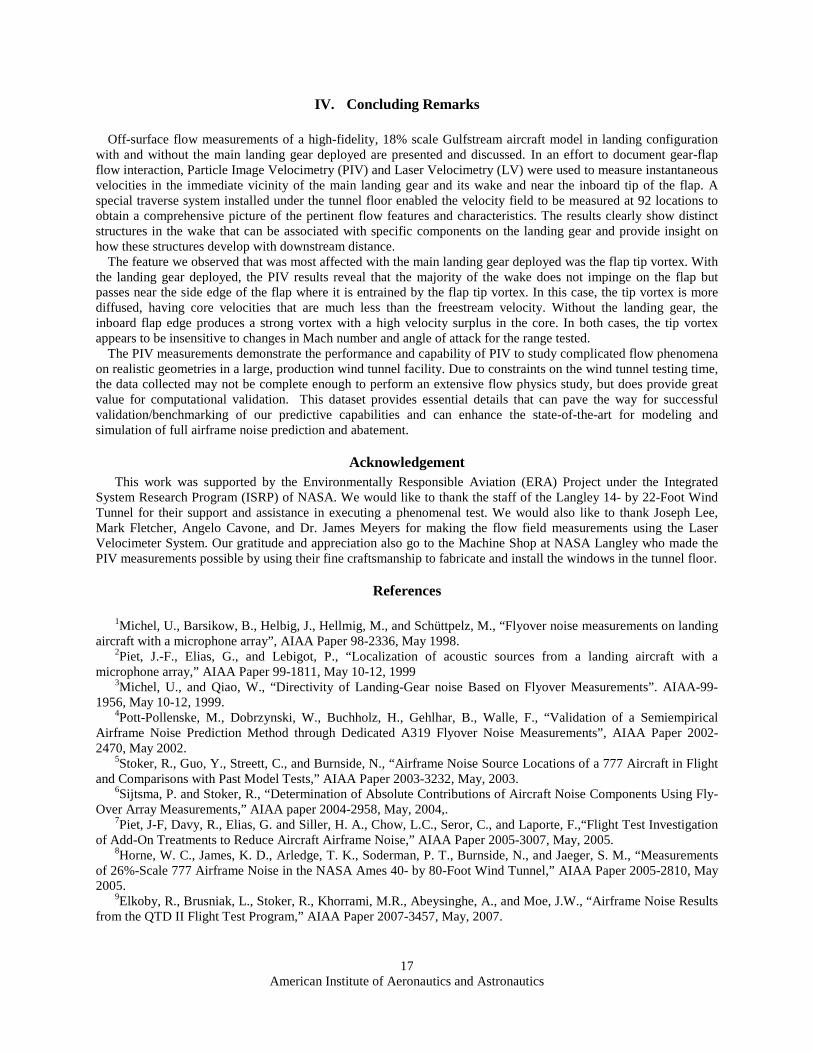
The PIV system was not configured to acquire images on top of the flap so the streamwise growth and development of the tip vortex could not be captured at all possible locations. However, PIV results obtained downstream of the flap tip provide great insight into the structure of the edge vortex after it is fully formed. In Fig. 19, the mean velocity results presented in Fig. 17b are shown again but with in-plane velocity vectors and the model geometry for reference. At this location, which is approximately 8 cm (3.15 inches) downstream of the flap trailing edge, the contours show the distorted shape of the vortex and low velocities near the core. The contours in Fig. 20 indicate that the vortex structure does not change appreciably for Mach numbers between 0.16 and 0.24. Although not shown here, the results obtained at additional angles of attack of 5 and 7 degrees also show no apparent change in the vortex structure.
Trailing Edge
Side Edge
American Institute of Aeronautics and Astronautics
15
Figure 19. Contours of the U velocity component downstream of the flap tip.
Figure 20. Effect of Mach number on the flap tip vortex.

American Institute of Aeronautics and Astronautics
16
The structure of the flap inboard tip vortex does change significantly depending on whether the landing gear is deployed or not, with the most obvious differences being seen in the core. With the landing gear deployed, the U component of velocity in the core in Fig. 21 shows a significant deficit that is well below the freestream velocity. Without the landing gear deployed, the velocity in the core is higher than that of the freestream. Also with landing gear deployed, the size of the flap edge vortex is slightly larger due to the entrainment of the wakes from the upper segment of the strut and the section of the main element inboard of the flap. The PIV results in Fig. 16d show that the wake from the upper segment of the strut does not impinge on the flap but does pass near the side edge. Computations performed by Khorrami, et. al. (Ref. 21) reveal that this flow is entrained into the flap tip vortex. The computations also show that the spiral band in the upper left part of the contour plot for both cases in Fig. 21 is the wake from the section of the main element inboard of the flap. The spiral band for the case with the landing gear deployed is wider possibly due to the effects of obstructions and cavities in the flow path on the underside of the wing. In Fig. 22, contours of vorticity in the X direction show that with the landing gear deployed, the vorticity levels are lower than when the landing gear is not deployed.
Figure 21. Comparison of U velocity with landing gear on and off.
Figure 22. Comparison of vorticity in the X direction with landing gear on and off.
American Institute of Aeronautics and Astronautics
17
IV. Concluding Remarks
Off-surface flow measurements of a high-fidelity, 18% scale Gulfstream aircraft model in landing configuration with and without the main landing gear deployed are presented and discussed. In an effort to document gear-flap flow interaction, Particle Image Velocimetry (PIV) and Laser Velocimetry (LV) were used to measure instantaneous velocities in the immediate vicinity of the main landing gear and its wake and near the inboard tip of the flap. A special traverse system installed under the tunnel floor enabled the velocity field to be measured at 92 locations to obtain a comprehensive picture of the pertinent flow features and characteristics. The results clearly show distinct structures in the wake that can be associated with specific components on the landing gear and provide insight on how these structures develop with downstream distance.
The feature we observed that was most affected with the main landing gear deployed was the flap tip vortex. With the landing gear deployed, the PIV results reveal that the majority of the wake does not impinge on the flap but passes near the side edge of the flap where it is entrained by the flap tip vortex. In this case, the tip vortex is more diffused, having core velocities that are much less than the freestream velocity. Without the landing gear, the inboard flap edge produces a strong vortex with a high velocity surplus in the core. In both cases, the tip vortex appears to be insensitive to changes in Mach number and angle of attack for the range tested.
The PIV measurements demonstrate the performance and capability of PIV to study complicated flow phenomena on realistic geometries in a large, production wind tunnel facility. Due to constraints on the wind tunnel testing time, the data collected may not be complete enough to perform an extensive flow physics study, but does provide great value for computational validation. This dataset provides essential details that can pave the way for successful validation/benchmarking of our predictive capabilities and can enhance the state-of-the-art for modeling and simulation of full airframe noise prediction and abatement.
Acknowledgement This work was supported by the Environmentally Responsible Aviation (ERA) Project under the Integrated
System Research Program (ISRP) of NASA. We would like to thank the staff of the Langley 14- by 22-Foot Wind Tunnel for their support and assistance in executing a phenomenal test. We would also like to thank Joseph Lee, Mark Fletcher, Angelo Cavone, and Dr. James Meyers for making the flow field measurements using the Laser Velocimeter System. Our gratitude and appreciation also go to the Machine Shop at NASA Langley who made the PIV measurements possible by using their fine craftsmanship to fabricate and install the windows in the tunnel floor.
References 1Michel, U., Barsikow, B., Helbig, J., Hellmig, M., and Schüttpelz, M., “Flyover noise measurements on landing
aircraft with a microphone array”, AIAA Paper 98-2336, May 1998. 2Piet, J.-F., Elias, G., and Lebigot, P., “Localization of acoustic sources from a landing aircraft with a
microphone array,” AIAA Paper 99-1811, May 10-12, 1999 3Michel, U., and Qiao, W., “Directivity of Landing-Gear noise Based on Flyover Measurements”. AIAA-99-
1956, May 10-12, 1999. 4Pott-Pollenske, M., Dobrzynski, W., Buchholz, H., Gehlhar, B., Walle, F., “Validation of a Semiempirical
Airframe Noise Prediction Method through Dedicated A319 Flyover Noise Measurements”, AIAA Paper 2002-2470, May 2002.
5Stoker, R., Guo, Y., Streett, C., and Burnside, N., “Airframe Noise Source Locations of a 777 Aircraft in Flight and Comparisons with Past Model Tests,” AIAA Paper 2003-3232, May, 2003.
6Sijtsma, P. and Stoker, R., “Determination of Absolute Contributions of Aircraft Noise Components Using Fly-Over Array Measurements,” AIAA paper 2004-2958, May, 2004,.
7Piet, J-F, Davy, R., Elias, G. and Siller, H. A., Chow, L.C., Seror, C., and Laporte, F.,“Flight Test Investigation of Add-On Treatments to Reduce Aircraft Airframe Noise,” AIAA Paper 2005-3007, May, 2005.
8Horne, W. C., James, K. D., Arledge, T. K., Soderman, P. T., Burnside, N., and Jaeger, S. M., “Measurements of 26%-Scale 777 Airframe Noise in the NASA Ames 40- by 80-Foot Wind Tunnel,” AIAA Paper 2005-2810, May 2005.
9Elkoby, R., Brusniak, L., Stoker, R., Khorrami, M.R., Abeysinghe, A., and Moe, J.W., “Airframe Noise Results from the QTD II Flight Test Program,” AIAA Paper 2007-3457, May, 2007.
American Institute of Aeronautics and Astronautics
18
10Khorrami, M. R., Lockard, D. P., Humphreys, Jr., W. M., Choudhari, M. M., and Van de Ven, T., “Preliminary Analysis of Acoustic Measurements from the NASA-Gulfstream Airframe Noise Flight Test,” AIAA Paper 2008-2814, May 2008.
11Keating, A., Dthioux, P., Satti, R., Noelting, S., Louis, J., Van de Ven, T., and Vieito, R., “Computational Aeroacoustics Validation and Analysis of a Nose Landing Gear,” AIAA Paper 2009-3154, May 2009.
12Vatsa, V., Lockard, D. P., Khorrami, M. R., and Carlson, J.-R., “Aeroacoustic Simulation of a Nose Landing Gear in a Open-Jet Facility using FUN3D,” AIAA Paper 2012-2280, June 2012.
13Fares, E. and Noelting, S., “Unsteady Flow Simulation of a High-Lift Configuration using a Lattice-Boltzmann Approach,” AIAA Paper 2011-869, January 2011.
14Casalino, D., Noelting, S., Fares, E., Vand de Ven, T., Perot, F., and Bres, G., “Towards Numerical Aircraft Noise Certification: Analysis of a Full-Scale Landing Gear in Fly-Over Configuration,” AIAA Paper 2012-2235, June 2012.
15Khorrami, M. R., Hannon, J. A., Neuhart, D. H., Markowski, G. A., and Van de Ven, T., “Aeroacoustic Studies of a High-Fidelity Aircraft Model: Part 1-Steady Aerodynamic Measurements,” AIAA Paper 2012-2233, June 2012.
16Khorrami, M. R. and Neuhart, D. H, “Aeroacoustic Studies of a High-Fidelity Aircraft Model: Part 2- Unsteady Surface Pressures,” AIAA Paper 2012-2234, June 2012.
17Khorrami, M. R., Humphreys, W. M., Jr., Lockard, D. P., and Ravetta, P. A., “Aeroacoustics Evaluation of Flap and Landing Gear Noise Reduction Concepts,” paper to be presented at the 20th AIAA/CEAS Aeroacoustics Conference, Atlanta, GA, June, 2014.
18Gentry, Jr., G. L., Quinto, P. F., Gatling, G. M., and Applin, Z. T., “The Langley 14- by 22-Foot Subsonic Wind Tunnel: Description, Flow Characteristics, and Guide for Users”, NASA Technical Paper 3008, 1990.
19Meyers, J. F.; Lee, J. W.; Cavone, A. A.; and, Fletcher, M. T.: The Modernization of a Long-Focal Length Fringe-type Laser Velocimeter. 16th International Symposium on Applications of Laser Techniques to Fluid Mechanics, paper 2.12.5, Lisbon, Portugal, July 9-12, 2012.
20Meyers, J. F.; Lee, J. W.; Cavone, A. A.; and, Fletcher, M. T.: 14- by 22-Foot Subsonic Tunnel Laser Velocimeter Upgrade, NASA / TM-2012-217781, November 2012.
21Khorrami, M. R., Fares, E., and Casalino, D., “Towards Full-Aircraft Airframe Noise Prediction: Lattice-Boltzmann Simulations,” Paper to be presented at the 20th AIAA/CEAS Aeroacoustics Conference in Atlanta GA, June 2014.