Embed Size (px)
Citation preview

Flow Characteristics of Heterogeneous
Traffic with and without Adherence to Lane
Following
G. Sarishka, A. Gowri and R. Sivanandan
Centre of Excellence in Urban Transport
Transportation Engineering Division
Department of Civil Engineering
IIT Madras, Chennai
Urban Mobility India Research Symposium
Dec 5, 2012
Introduction
Homogeneous traffic
Lane-following
Disciplined movement
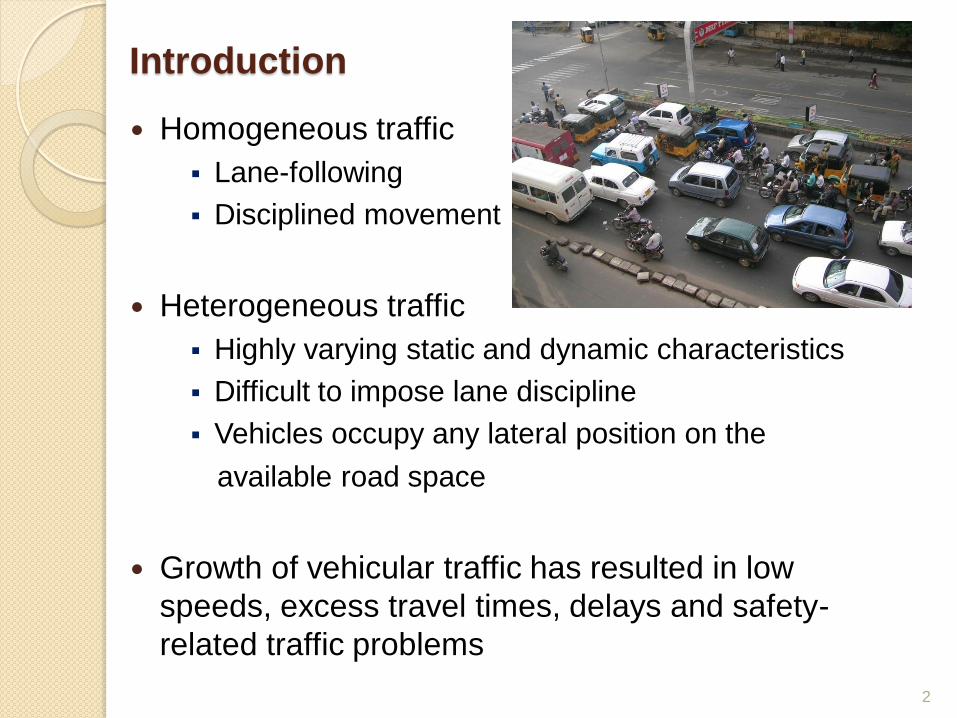
Heterogeneous traffic
Highly varying static and dynamic characteristics
Difficult to impose lane discipline
Vehicles occupy any lateral position on the
available road space
Growth of vehicular traffic has resulted in low
speeds, excess travel times, delays and safety-
related traffic problems
2
Motivation
Different types of vehicles moving on the same
road may enjoy different levels of service (e.g. Two
wheelers)
Complex traffic scenario poses a serious challenge
to traffic planners and engineers
Solutions can be obtained through systematic
study of relevant characteristics of mixed traffic
3

Objectives
To compare the lane following and non-lane
following characteristics of heterogeneous traffic
for different lane facility types (two-, three- and
four-lane)
To compare the capacities and speeds of different
lane facility types by varying composition, flow
levels and lane widths
4
Literature Review
Different simulation models were developed for
heterogeneous traffic conditions (Oketch (2000) , Cho &
Wu (2004), Arasan & Koshy (2005), Mallikarjuna & Rao
(2007), Dey et al. (2008) )
Limited work were done for comparing capacities of
different lane facility types - heterogeneous traffic
system follow lane discipline (Chandra & Kumar (2003),
Arasan et al. (2009), Thomas et al. (2011), Gowri et al.
(2012) )
This work is a further attempt in this direction; it
compares the capacities of lane following and non-lane
following scenarios through simulation models
5

Development of Simulation Model
On most Indian roads, vehicles move freely based
on availability of space and ignore lane discipline
Smaller vehicles often weave through gaps
between larger vehicles
These features of traffic flow and wide variations in
vehicular characteristics are incorporated in the
developed simulation model (Gowri et al., 2009;
Gowri, 2011).
This model is intended to simulate the
heterogeneous traffic flow at mid-block section (two
lanes) of an urban street
6

Logics used in Simulation Model
Logics in simulation model for non-lane following
scenario
Vehicle Generation
Vehicle Placement
Vehicle Movement
Object Oriented Programming concepts
Implemented in C++ programming language
(Gowri et al., 2009)
7
Vehicle Generation
• Vehicle enter the system based on time interval (time
gap distribution)
• Time gap distributions for different categories based
on lead-lag vehicle (e.g. TW-TW, TW-Car, etc.) are
given as input to the simulation model
• Generated vehicle is assigned a free speed as per
the normal distribution based on field data
• Type of vehicle is assigned based on traffic
composition observed in field
8

Vehicle Placement
• Vehicle placement is based on availability of
transverse and longitudinal spaces
• Vehicle looks for spaces from right edge to left
edge of the road stretch
• If spaces are sufficient, vehicle will be placed on
the road stretch
• If not, it reduces its speed to that of its leader (car
following rule)
W3
Curb
Vehicle 3
Vehicle 2
Vehicle 1 Median
L 3
L 2
L 1 W1
W2
9

Vehicle Movement
If there is no slow vehicle in
front of it, vehicle accelerates
up to its free speed.
If not, overtaking logic is invoked
Overtaking vehicle looks for availability of transverse
and longitudinal spaces on the right/left side of the
overtaken vehicle
If spacings are inadequate on both the sides, car
following logic is involved
10

Modifications to the Simulation Program
In order to simulate lane following by vehicles and
to accommodate multiple lane scenarios, program
was modified appropriately
Lane following scenario
Vehicles are placed in such a way that centre line of
the vehicle and centre line of the lane match.
Overtaking is allowed but movements between lanes
are not allowed.
Vehicles are allowed to overtake from the left as well
as right
Increase in lane widths to reflect multiple lanes
(three and four) were incorporated
11
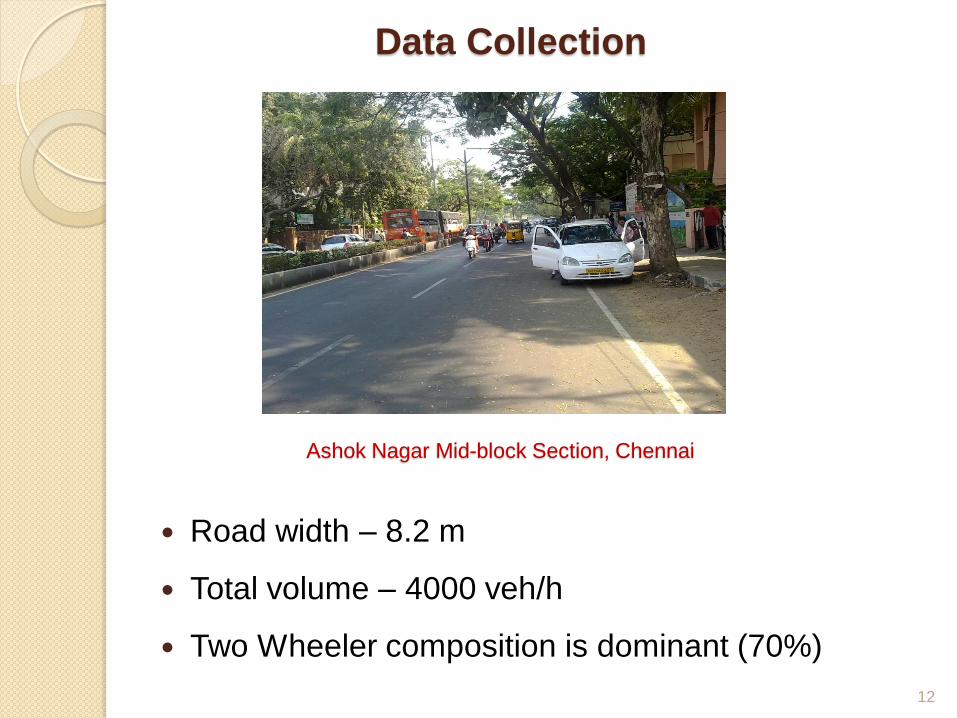
Ashok Nagar Mid-block Section, Chennai
12
Data Collection
Road width – 8.2 m
Total volume – 4000 veh/h
Two Wheeler composition is dominant (70%)

Model Validation
Parameter used for validation – Speeds of different
types of vehicles
Speeds of vehicles for one hour peak period is
obtained from field and simulation model
Simulated values are not statistically different from
observed values, indicating the validity of the
developed model
13
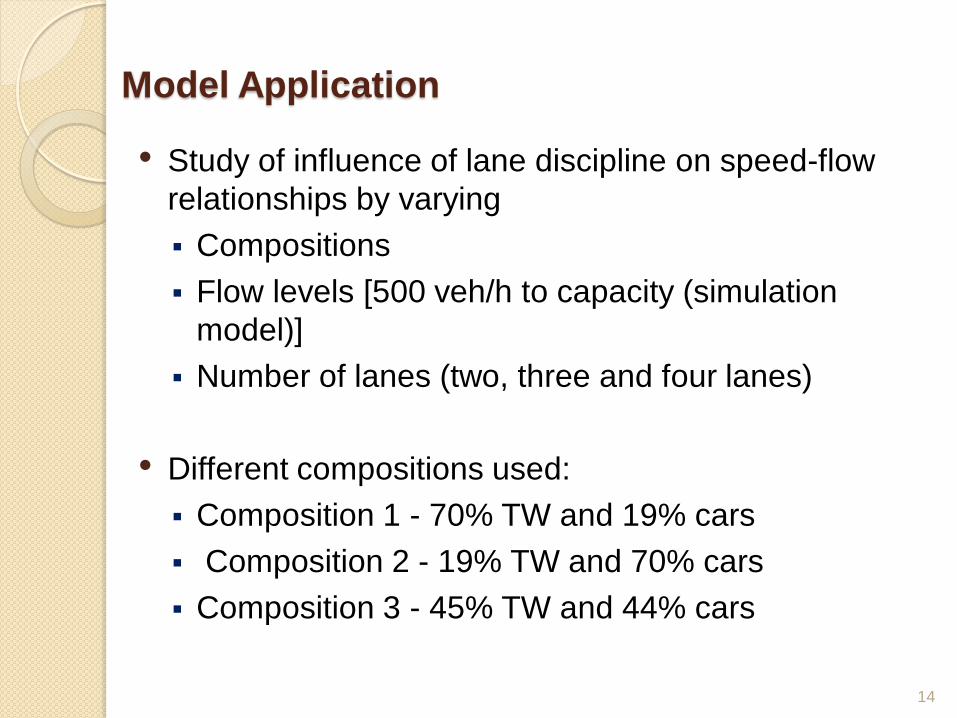
Model Application
• Study of influence of lane discipline on speed-flow
relationships by varying
Compositions
Flow levels [500 veh/h to capacity (simulation
model)]
Number of lanes (two, three and four lanes)
• Different compositions used:
Composition 1 - 70% TW and 19% cars
Composition 2 - 19% TW and 70% cars
Composition 3 - 45% TW and 44% cars
14

Composition 1 (TW Dominant)
15
5
10
15
20
25
30
35
40
45
50
1000 2000 3000 4000 5000 6000 7000 8000 9000 10000 11000 12000
Sp
eed
(km
ph
)
Flow (veh/h)
Two Lane Road - Without Lane Discipline Two Lane Road - With Lane Discipline
Three Lane Road - Without Lane Discipline Three Lane Road - With Lane Discipline
Four Lane Road - Without Lane Discipline Four Lane Road - With Lane Discipline
• Capacities (in veh/h) are
higher in the traffic stream for
both lane following and non-
lane following cases.
• Due to high seepage
(between other vehicles) of two
wheelers due to their smaller
size and higher
manoeuverability

Composition 2 (Car Dominant)
16
5
10
15
20
25
30
35
40
45
50
1000 2000 3000 4000 5000 6000 7000 8000 9000 10000 11000 12000 13000
Sp
eed
(km
ph
)
Flow (veh/h)
Two Lane road - Without Lane Discipline Two Lane Road - With Lane Discipline
Three Lane Road - Without Lane Discipline Three Lane Road - With Lane Discipline
Four Lane Road - Without Lane Discipline Four Lane Road - With Lane Discipline
• Capacities (veh/h) are lesser
in the traffic stream compared
to that of two wheeler dominant
composition
•Due to the presence of higher
proportion of cars vis-a-vis two
wheelers.
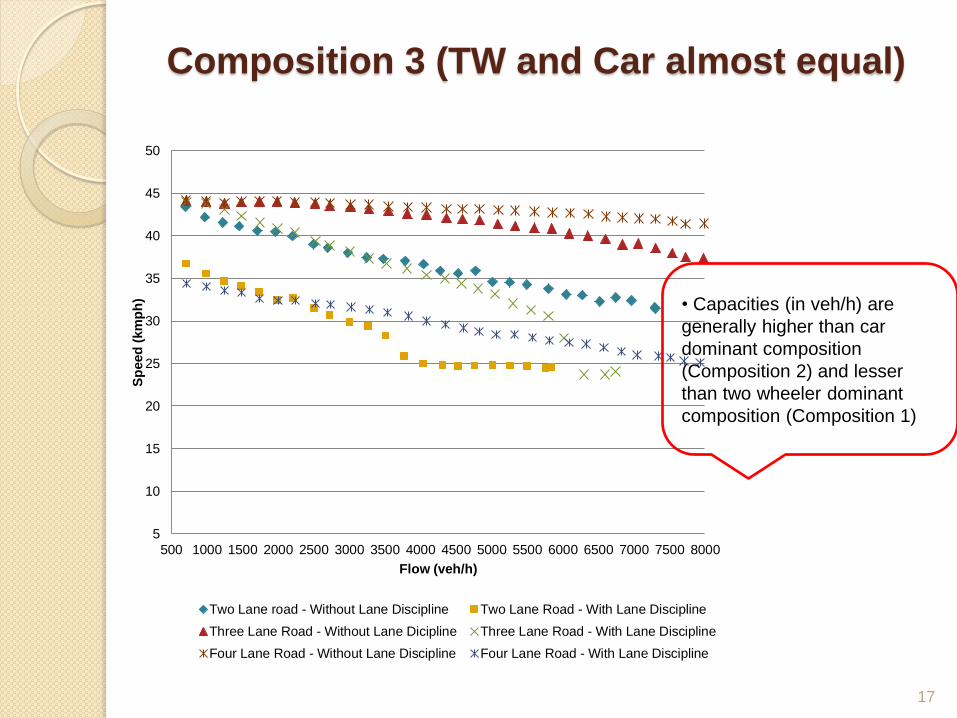
Composition 3 (TW and Car almost equal)
17
5
10
15
20
25
30
35
40
45
50
500 1000 1500 2000 2500 3000 3500 4000 4500 5000 5500 6000 6500 7000 7500 8000
Sp
eed
(km
ph
)
Flow (veh/h)
Two Lane road - Without Lane Discipline Two Lane Road - With Lane Discipline
Three Lane Road - Without Lane Dicipline Three Lane Road - With Lane Discipline
Four Lane Road - Without Lane Discipline Four Lane Road - With Lane Discipline
• Capacities (in veh/h) are
generally higher than car
dominant composition
(Composition 2) and lesser
than two wheeler dominant
composition (Composition 1)

Capacity difference between Lane Following (LF) and Non-Lane
Following (NLF) for various lane widths and compositions
18
Lane
Width
Composition 1
(70% TW, 19% Cars)
Composition 2
(19% TW, 70% Cars)
Composition 3
(44% TW, 45% Cars)
Capacity PCU/h (veh/h) Capacity PCU/h(veh/h) Capacity PCU/h(veh/h)
NLF LF Diff. NLF LF Diff. NLF LF Diff.
Two- lane
road
6343
(7356)
5067
(5876)
1276
(1480)
7226
(7300)
5768
(5827)
1458
(1473)
6803
(7336)
5415
(5839)
1388
(1497)
Three-lane
road
8839
(10250)
5962
(6914)
2877
(3336)
10314
(10238)
6529
(6596)
3785
(3642)
9502
(10246)
6258
(6748)
3244
(3498)
Four- lane
road
11101
(12873)
9082
(10532)
2019
(2341)
12250
(12375)
9964
(10066)
2286
(2309)
11920
(12854)
9692
(10451)
2228
(2403)
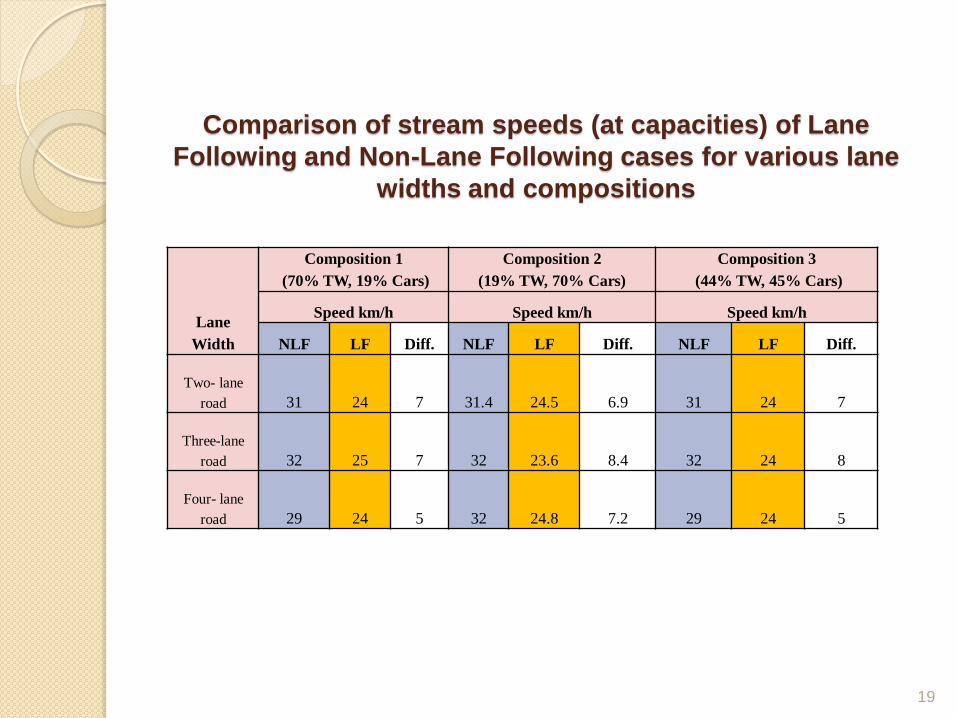
Comparison of stream speeds (at capacities) of Lane
Following and Non-Lane Following cases for various lane
widths and compositions
19
Lane
Width
Composition 1
(70% TW, 19% Cars)
Composition 2
(19% TW, 70% Cars)
Composition 3
(44% TW, 45% Cars)
Speed km/h Speed km/h Speed km/h
NLF LF Diff. NLF LF Diff. NLF LF Diff.
Two- lane
road 31 24 7 31.4 24.5 6.9 31 24 7
Three-lane
road 32 25 7 32 23.6 8.4 32 24 8
Four- lane
road 29 24 5 32 24.8 7.2 29 24 5

Conclusions
This study focuses on comparison of capacities and
corresponding speeds under heterogeneous traffic
with and without lane adherence for various
combinations of vehicular compositions
An existing microscopic traffic simulation model was
used
Simulation runs were carried out for various
combinations of vehicular composition, volume levels,
number of lanes and lane following/non-lane following
scenarios
20

Conclusions (contd..)
Non-adherence to lanes results in higher mid-block
capacities vis-à-vis the case of lane following
Capacity decreases with the increase in the cars in
the total composition when it is measured in veh/h but
increases with increase in cars when it is measured
in PCU/h, for both lane following and non-lane
following cases, in all the road cases, i.e. two, three
and four lanes
While these findings point to higher capacities for
non-lane following cases, the issue of compromise on
safety must be kept in mind
21

Conclusions (contd..)
More case studies and further scenario analysis
need to be conducted to generalize the findings
The present work can be extended to include both
mid-block and intersection to form a linear section,
which would serve as measure of performance of
traffic flow on a road corridor
22
Acknowledgement
The data collection effort in this project was made
possible through a project supported by funds from
Ministry of Urban Development (MoUD), GoI, through
their sponsorship of Centre of Excellence in Urban
Transport at IIT Madras
23
References
Arasan, V.T. & Koshy, R.Z. (2005). Methodology for modeling highly heterogeneous traffic, Journal of
Transportation Engineering, ASCE, 131(7), 544-551.
Arasan, V.T., Vedagiri, P. & Manu, S. (2009). Development of Speed-Flow Relationship for
Heterogeneous Traffic Using Computer Simulation, Journal of Institution of Engineers (India), 89, 3-9.
Chandra, S. & Kumar, U. (2003).Effect of Lane Width on Capacity under Mixed Traffic Conditions,
Journal of Transportation Engineering, ASCE, 129,155-160.
Cho, H. & Wu, Y. (2004). Modeling and Simulation of Motorcycle Traffic Flow, Proceedings of the IEEE
International Conference on Systems, Man and Cybernetics. The Hague, Netherlands.
Dey, P. P., Chandra, S. & Gangopadhyay, S. (2008).Simulation of mixed traffic flow on two-lane roads,
Journal of Transportation Engineering, ASCE, 134, 361-369.
Gowri Asaithambi, Venkatesan Kanagaraj & Sivanandan, R. (2009). Object-oriented methodology for
intersection simulation model under heterogeneous traffic conditions, Advances in Engineering Software
(Elsevier), 40 (10), 1000-1010.
Gowri, A. (2011). Evaluation of turn lanes at signalized intersections under heterogeneous traffic
conditions using microsimulation models, Ph.D Thesis, Indian Institute of Technology Madras, Chennai,
India.
Gowri Asaithambi, Venkatesan Kanagaraj, Karthik K. Srinivasan & Sivanandan, R.(2012).Mixed
Traffic Characteristics on Urban Arterials with Significant Motorized Two-Wheeler Volumes: Role of
Composition, Intra-Class Variability, and Lack of Lane Discipline, Transportation Research Record,
Transportation Research Board, Washington D.C., USA (Article in Press).
Mallikarjuna, Ch. & Rao, K. R. (2007) Identification of suitable cellular automata model for mixed traffic,
Journal of the Eastern Asia Society for Transportation Studies, 7, 2454-2469.
Oketch, T. M. (2000). New modeling approach for mixed-traffic streams with nonmotorized vehicles,
Transportation Research Record1674, Transportation Research Board, Washington, D.C., 86-93.
Thomas, J., Karthik K. Srinivasan & Arasan,V. T.(2011). Multi-class volume delay functions for
heterogeneous traffic applications, Journal of Road Transport, 2, 40-54.
24