Embed Size (px)
Citation preview

The Florida LegislatureOffice of Economic and
Demographic Research850.487.1402http://edr.state.fl.us
Presented by:
Florida’s Financially-Based Economic Development Tools &
Return on Investment
January 11, 2017

Economic Development Tools...Definition…The active government pursuit of economic growth and improvements in terms of population, gross domestic product, output, tax base, jobs, wages, per capita income, investments, and the overall well-being of citizens.
The body of Florida-specific knowledge regarding the use of state public policy and resources as an instrument of economic development has increased fairly dramatically since 2010 when Chapter 2010-101 passed establishing EDR’s Statewide Model and 2013 when Chapter 2013-39 and 2013-42 passed requiring EDR’s calculation of returns-on-investment for selected state economic development incentive programs on a recurring schedule.
In the broadest sense, Florida’s economic growth is affected by nearly everything the Legislature does—from public school funding to road-building to the regulation of a specific industry.
Essentially, the Legislature has three directed tools for economic development: financial incentives and investments, tax policies, and nonfinancial assistance.
1
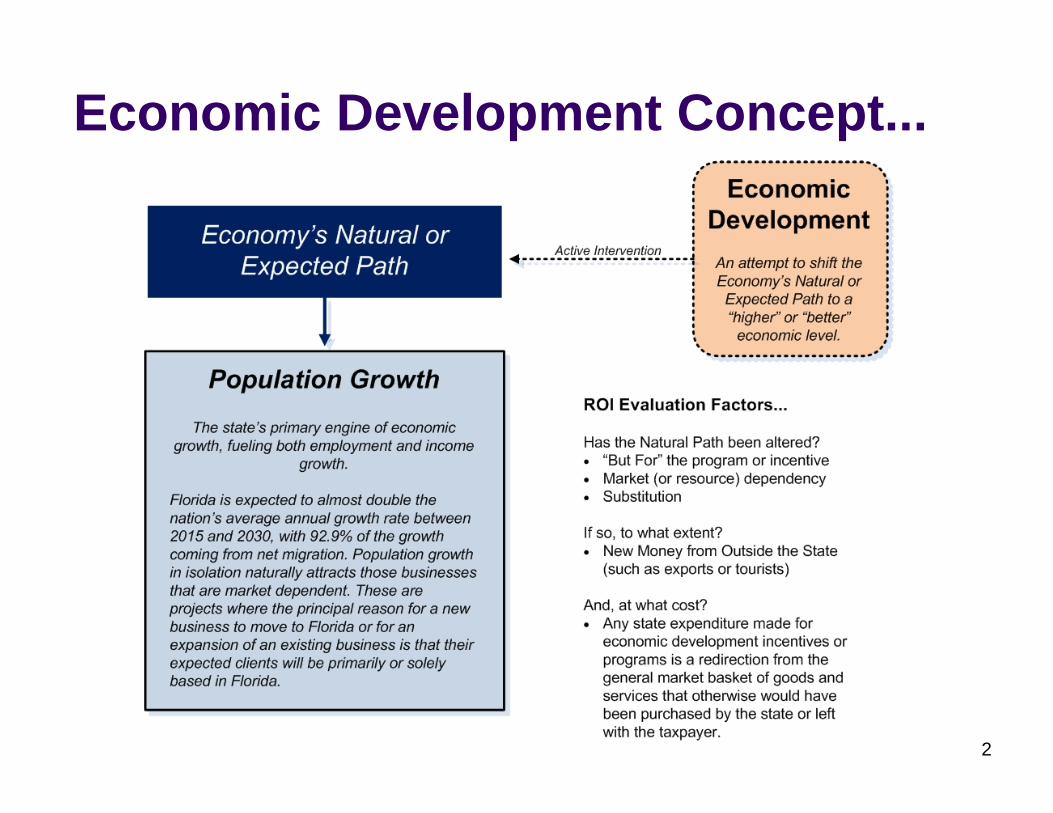
Economic Development Concept...
2
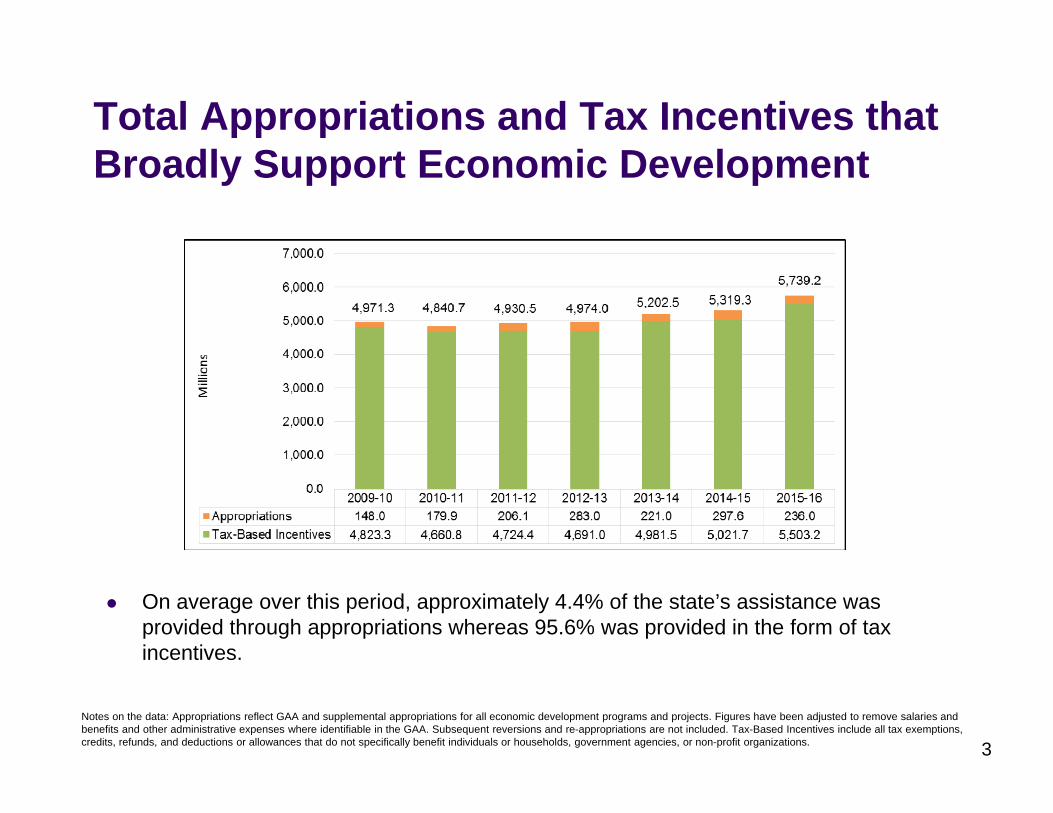
Total Appropriations and Tax Incentives that Broadly Support Economic Development
On average over this period, approximately 4.4% of the state’s assistance was provided through appropriations whereas 95.6% was provided in the form of tax incentives.
3
Notes on the data: Appropriations reflect GAA and supplemental appropriations for all economic development programs and projects. Figures have been adjusted to remove salaries and benefits and other administrative expenses where identifiable in the GAA. Subsequent reversions and re-appropriations are not included. Tax-Based Incentives include all tax exemptions, credits, refunds, and deductions or allowances that do not specifically benefit individuals or households, government agencies, or non-profit organizations.

Return on Investment (ROI)...In EDR’s work, the term “Return on Investment” is synonymous with the statutory term “economic benefits” which is defined in s. 288.005, Florida Statutes.
4
“The direct, indirect, and induced gains in state revenues as a percentage of the state’s investment. The state’s investment includes state grants, tax exemptions, tax refunds, tax credits, and other state incentives.”
ROI = 1.0
Cost of the Investment from
State Revenues or Appropriation:
$1 million
Taxable Sales Generated from New Activity
(Direct, Indirect and Induced)
This has to be 16.67 times bigger than the original cost
to the state.
$16.67 million
Multiplied by Sales Tax Rate
(.06 x 16.67 million)
$1 million
Sales Tax Example...

ROI In Practice...The measure is ultimately conditioned by the state’s tax policy which determines what is taxable.
EDR’s evaluation also requires identification of jobs created, the increase or decrease in personal income, and the impact on state Gross Domestic Product (GDP) to round out the analysis.
The ROI does not address issues of overall effectiveness or societal benefit; instead, it focuses on tangible financial gains or losses to state revenues.
It is entirely possible for a project or program to have a negative return on investment but still be desired (for example, to subsidize an essential activity that wouldn’t otherwise have occurred).
5

Meaning of Returns...Returns can be categorized as follows:
Greater Than One (>1.0)…the program more than breaks even; the return to the state produces more revenues than the total cost of the incentives.
Equal To One (=1.0)…the program breaks even; the return to the state in additional revenues equals the total cost of the incentives.
Less Than One, But Positive (+, <1)…the program does not break even; however, the state generates enough revenues to recover a portion of its cost for the incentives.
Less Than Zero (-, <0)…the program does not recover any portion of the incentive cost, and state revenues are less than they would have been in the absence of the program because taxable activity is shifted to non-taxable activity or the costs are greater than the expected benefit.
The numerical ROI can be interpreted as return in tax revenues for each dollar spent by the state. For example, a ROI of 2.5 would mean that $2.50 in tax revenues is received back from each dollar spent by the state.
6
7
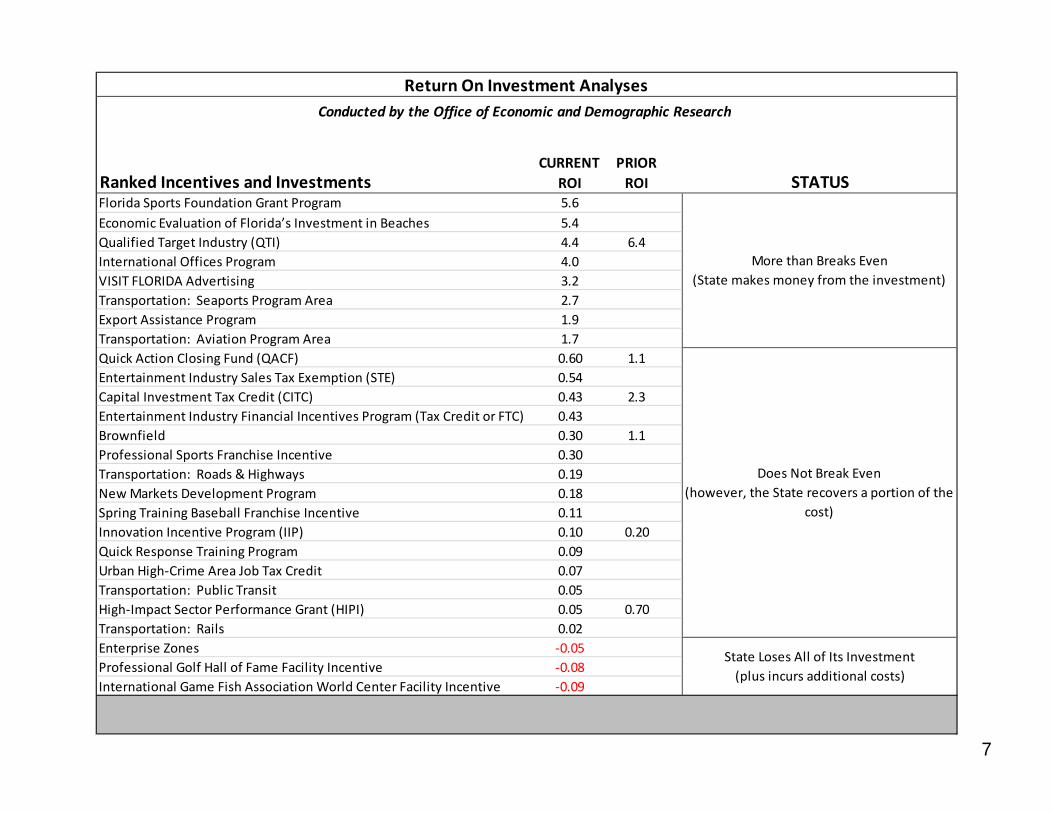
Ranked Incentives and Investments STATUSFlorida Sports Foundation Grant Program 5.6Economic Evaluation of Florida’s Investment in Beaches 5.4Qualified Target Industry (QTI) 4.4 6.4International Offices Program 4.0VISIT FLORIDA Advertising 3.2Transportation: Seaports Program Area 2.7Export Assistance Program 1.9Transportation: Aviation Program Area 1.7Quick Action Closing Fund (QACF) 0.60 1.1Entertainment Industry Sales Tax Exemption (STE) 0.54Capital Investment Tax Credit (CITC) 0.43 2.3Entertainment Industry Financial Incentives Program (Tax Credit or FTC) 0.43Brownfield 0.30 1.1Professional Sports Franchise Incentive 0.30Transportation: Roads & Highways 0.19New Markets Development Program 0.18Spring Training Baseball Franchise Incentive 0.11Innovation Incentive Program (IIP) 0.10 0.20Quick Response Training Program 0.09Urban High‐Crime Area Job Tax Credit 0.07Transportation: Public Transit 0.05High‐Impact Sector Performance Grant (HIPI) 0.05 0.70Transportation: Rails 0.02Enterprise Zones ‐0.05Professional Golf Hall of Fame Facility Incentive ‐0.08International Game Fish Association World Center Facility Incentive ‐0.09
State Loses All of Its Investment (plus incurs additional costs)
Return On Investment Analyses Conducted by the Office of Economic and Demographic Research
CURRENT ROI
PRIOR ROI
More than Breaks Even (State makes money from the investment)
Does Not Break Even (however, the State recovers a portion of the
cost)

Traditional Economic Measures Have ADifferent Focus...
8
3‐Year Average Real Gross Domestic Product
(Millions of $)
3‐Year Average Real Disposable Income (Millions of $)
Roads & Highways Program $18,962.8 $20,546.7Aviation Program $9,093.5 $9,867.7Seaports Program $6,396.4 $6,920.3
Qualified Target Industry Tax Refund $773.3 $544.3Quick Action Closing Fund $666.3 $446.0Capital Investment Tax Credit $426.3 $299.0Public Transit Program $411.7 $446.3New Markets Development Program $154.2 $105.8Rails Program $88.6 $96.0Innovation Incentive Program $56.0 $52.0
Brownfield Redevelopment Bonus Tax Refund $1.6 $1.4
High‐Impact Sector Performance Grant $0.7 $0.7
RETURN-ON-INVESTMENT REAL GDP & REAL DISPOSABLE PERSONAL INCOME
Progam (Highest to Lowest By Real GDP)
Transportation Programs 3‐Year Average: FY2013‐14 to FY2015‐16 Economic Development Programs 3‐Year Average: FY2012‐13 to FY2014‐15
Florida’s Real GDP in 2015 was $795.0 billion. This means the Roads & Highways program area represented about 2.4% of the economy. It averaged a return in net state revenues of nearly $825 million per year during this period, but its ROI was only 0.19 (meaning the state of Florida received only 19 cents back in tax revenue for every dollar spent). This dichotomy has to do with the state’s tax structure and the cost of the program.
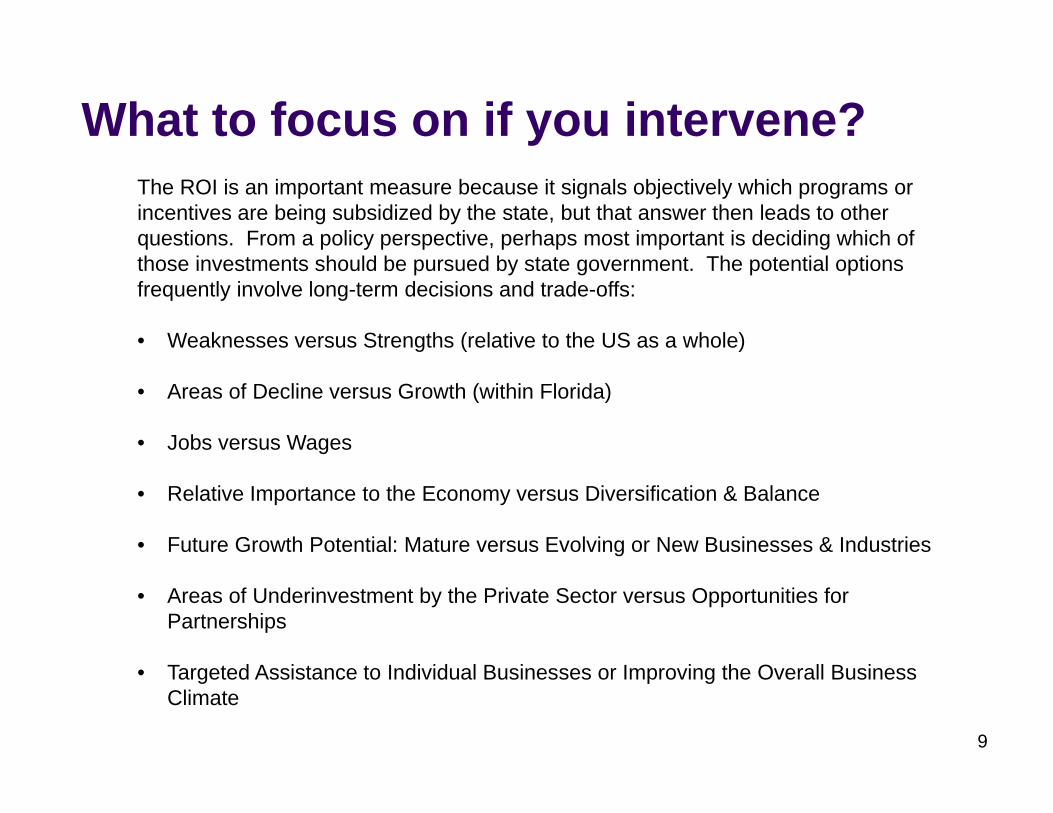
What to focus on if you intervene?The ROI is an important measure because it signals objectively which programs or incentives are being subsidized by the state, but that answer then leads to other questions. From a policy perspective, perhaps most important is deciding which of those investments should be pursued by state government. The potential options frequently involve long-term decisions and trade-offs:
• Weaknesses versus Strengths (relative to the US as a whole)
• Areas of Decline versus Growth (within Florida)
• Jobs versus Wages
• Relative Importance to the Economy versus Diversification & Balance
• Future Growth Potential: Mature versus Evolving or New Businesses & Industries
• Areas of Underinvestment by the Private Sector versus Opportunities for Partnerships
• Targeted Assistance to Individual Businesses or Improving the Overall Business Climate
9

“Changing” the Reported ROI...
10
Options for “Improving” the Economic Benefit of the State’s Investments...
The literature suggests there are three ways to make improvements:
Improve the direct effects on the front-end, primarily through the creation of more jobs, increased facilitation of new business establishments in targeted industries, enhanced promotion of higher salaries, or additional capital expenditures.
Impose a requirement for backward linkages in the selection of firms for incentives. Industries with strong backward linkages generate economic activity far beyond the nominal value of their products when they spend locally on inputs instead of purchasing those intermediate goods and services from outside the state. Each dollar that remains in Florida reduces leakages and continues to boost local economic activity, employment, and ultimately tax revenue.All else being equal, the stronger the linkage is, the greater the impact will be on the state’s economy.
Develop strong pools of local suppliers and knowledge infrastructure in key locations that can attract businesses which benefit from those relationships—essentially, the development of a portfolio of business assets.
11

What Does This Look Like?A broadened focus that includes growing in-state businesses rather than a limited focus on recruiting out-of-state businesses.
A multi-faceted approach that is inclusive of other policy areas, rather than a limited focus on the traditional toolkit (examples include improving the quality of education; retaining graduates of higher education programs; and, developing different kinds of incentives and programs).
Formally, this is a grassroots or bottom-up theory of economic development that focuses government efforts on:
Helping local businesses find, expand, or create new markets for unique and innovative products (technical assistance, infrastructure, distribution channels, financing and facilitation), Fostering entrepreneurs and new business development (also called enterprise development), andDeveloping pools of local resources, including human capital, and access to technology (agglomeration and clustering).
12

Research & Development in Florida
Product-life-cycle-theory suggests that new technologies are: (1) discovered through research & development activities (which, in part, have features of being public goods); (2) introduced as commercial products or services by entrepreneurs (generating the potential for high profits); and (3) then picked up and imitated by others. This is a form of “creative destruction.”
It would have taken another $1.1 billion in academic R&D for Florida to have had the same share of its GDP invested in this type of research as the US as a whole in 2013.
Data from National Science Board 2016
13

The Future of Economic Development: Fostering Entrepreneurship
Entrepreneurship focuses on business creation that is homegrown.
Global economy increases competition, requiring business to be more nimble, innovative and flexible. Generally, this is best accomplished through smaller businesses.
Innovations have stronger growth potential than established business activity—but the risk is greater.
States need new tools that focus on the start-up and growth of new enterprises within the state, as well as a longer term vision.
To be meaningful, economic development assistance should be through strategic and targeted interventions at key parts of the process.
14


![Economic- July 2016.pptx [Read-Only] - EDR - Office of ...edr.state.fl.us/Content/presentations/economic/Fl...Florida’s Participation Rate... Currently, it is not clear what this](https://img.dokumen.tips/doc/110x75/5ad8f3fc7f8b9a991b8dfc3f/economic-july-2016pptx-read-only-edr-office-of-edrstatefluscontentpresentationseconomicflfloridas.jpg)


![Economic-January 2012 Late.pptx [Read-Only]edr.state.fl.us/Content/presentations/economic/Fl...annual growth will be about 0.9%. zThe future will be different than the past; Florida’s](https://img.dokumen.tips/doc/110x75/5abbce557f8b9af27d8d2e5b/economic-january-2012-latepptx-read-onlyedrstatefluscontentpresentationseconomicflannual.jpg)