Embed Size (px)
Citation preview
Florida’s Economy and the Influence of Population
Presented by:Select Policy Council on Strategic & Economic Planning
October 7, 2009
The Florida LegislatureOffice of Economic and
Demographic Research850.487.1402http://edr.state.fl.us
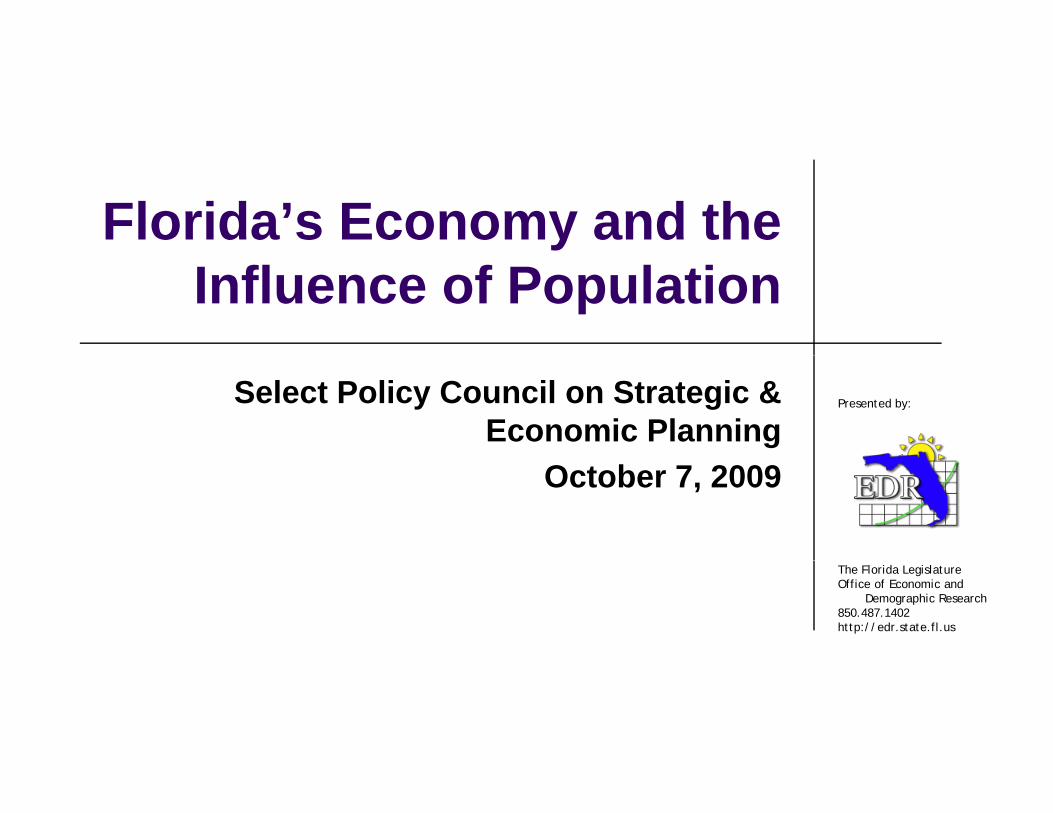
E L t G d i 2008Economy Lost Ground in 2008Florida’s growth is now declining. State Gross Domestic Product (GDP) ranked us 48th in the nation in real growth with a decline of (-1.6%) in 2008. In 2005, weus 48 in the nation in real growth with a decline of ( 1.6%) in 2008. In 2005, we were ranked 2nd in the nation.
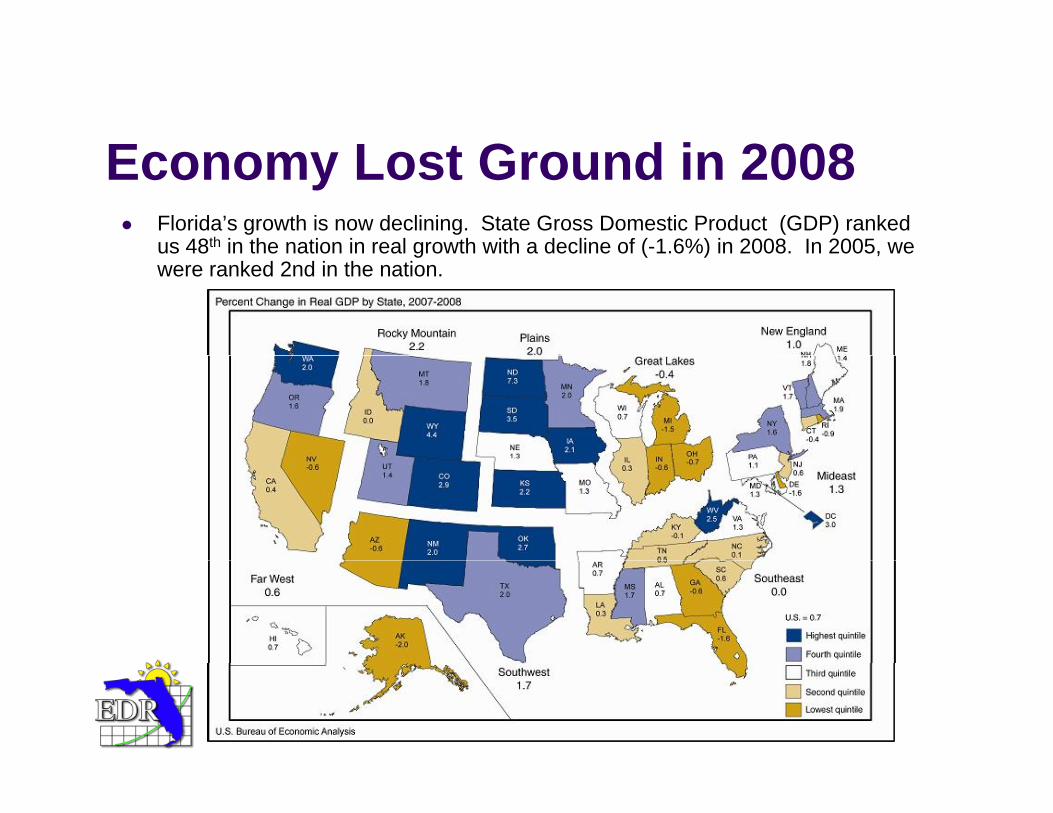
Employment Worsensp y
August (YOY)US -4.3%FL -4.8%(-372,700 jobs)
Recent BestRecent BestSept 2005: +5.2%
AugustUS 9.7%FL 10.7%
(984,000 people)( , p p )
Recent BestJuly 2006: 3.3%
Projected BottomFL 11 0%FL 11.0%Spring, 2010
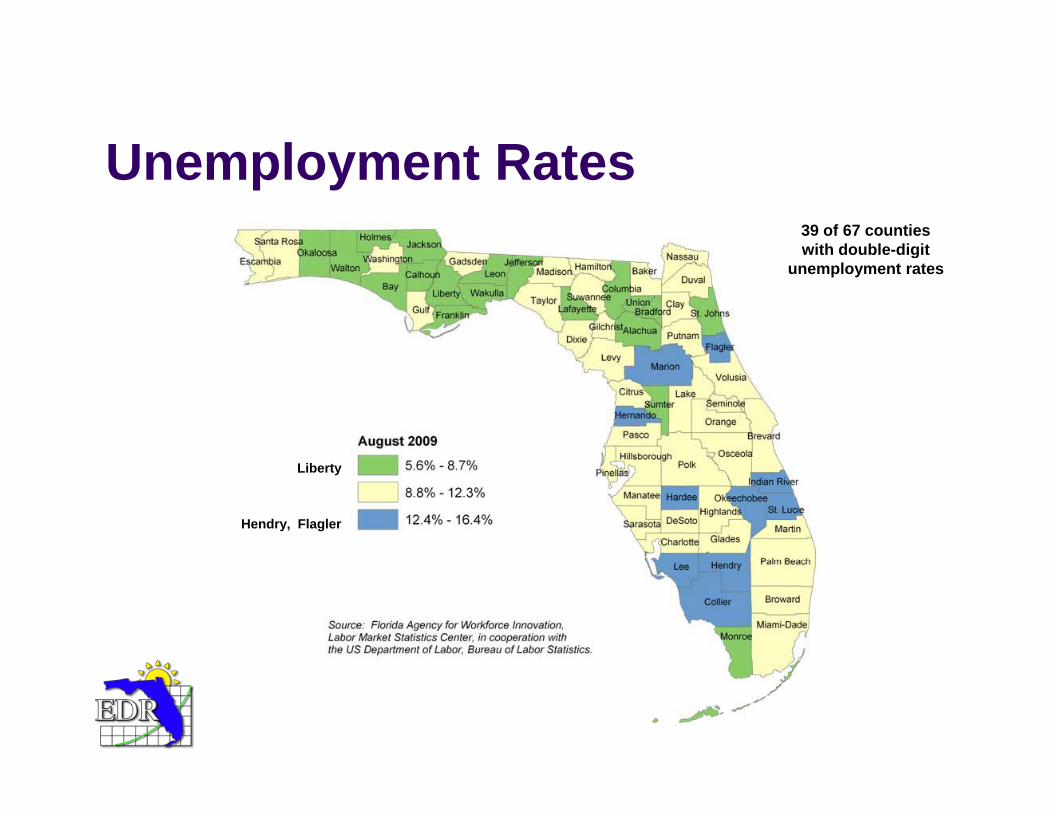
U l t R tUnemployment Rates 39 of 67 counties with double-digitwith double digit
unemployment rates
Liberty
Hendry, Flagler
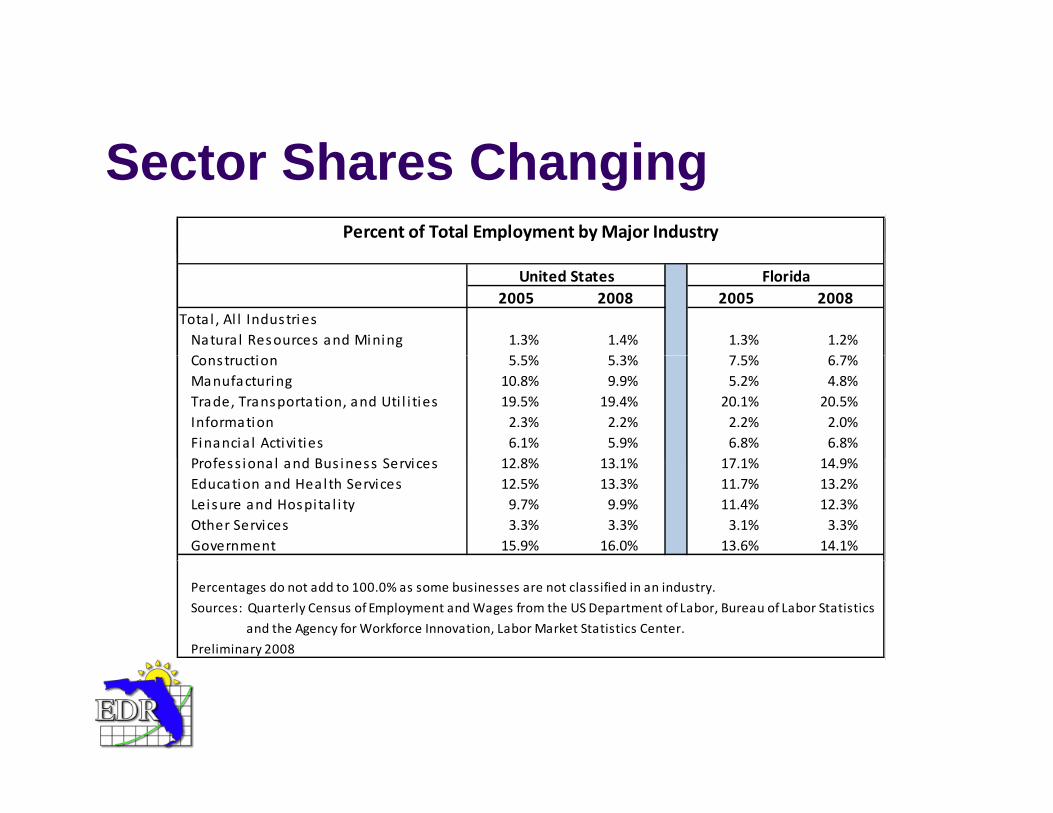
S t Sh Ch iSector Shares ChangingPercent of Total Employment by Major Industry
2005 2008 2005 2008Tota l , Al l Industries Natura l Resources and Mining 1.3% 1.4% 1.3% 1.2%C i 5 5% 5 3% 7 5% 6 7%
United States Florida
Construction 5.5% 5.3% 7.5% 6.7%Manufacturing 10.8% 9.9% 5.2% 4.8%Trade, Transportation, and Uti l i ties 19.5% 19.4% 20.1% 20.5%Information 2.3% 2.2% 2.2% 2.0%Financia l Activi ties 6.1% 5.9% 6.8% 6.8%
f l dProfess iona l and Bus iness Services 12.8% 13.1% 17.1% 14.9%Education and Health Services 12.5% 13.3% 11.7% 13.2%Leisure and Hospita l i ty 9.7% 9.9% 11.4% 12.3%Other Services 3.3% 3.3% 3.1% 3.3%Government 15.9% 16.0% 13.6% 14.1%
Percentages do not add to 100.0% as some businesses are not classified in an industry.
Sources: Quarterly Census of Employment and Wages from the US Department of Labor, Bureau of Labor Statistics
and the Agency for Workforce Innovation, Labor Market Statistics Center.
Preliminary 2008
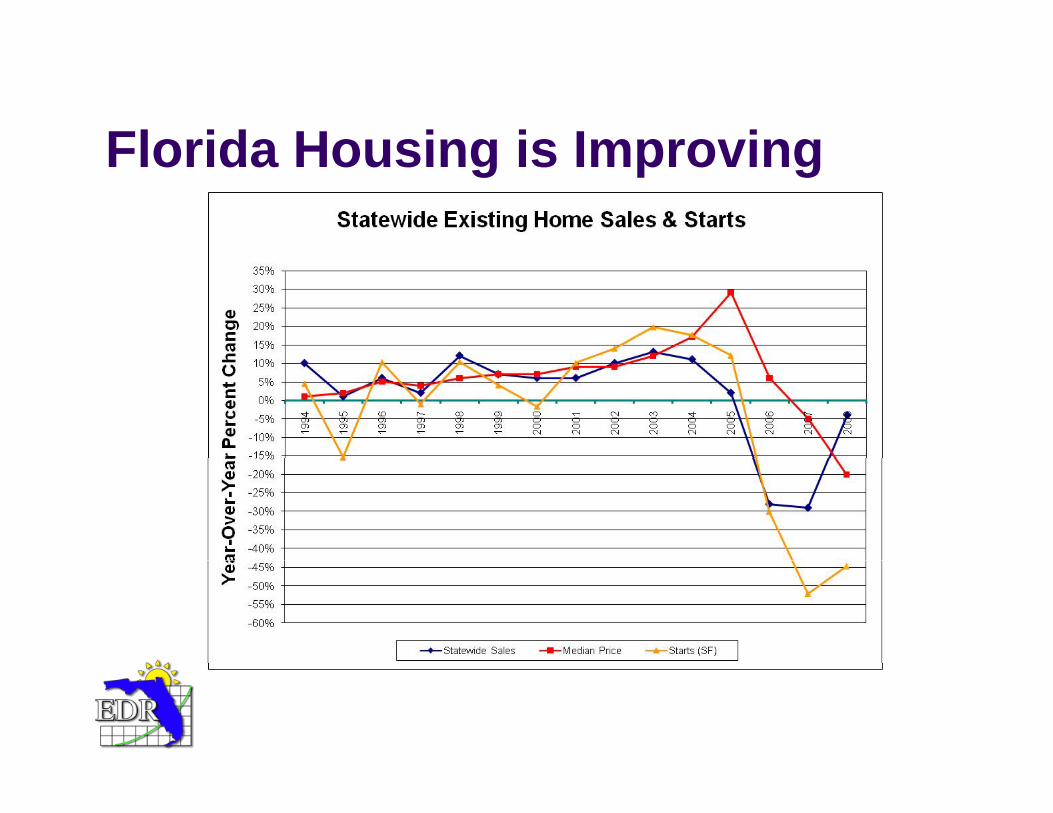
Florida Housing is ImprovingFlorida Housing is Improving
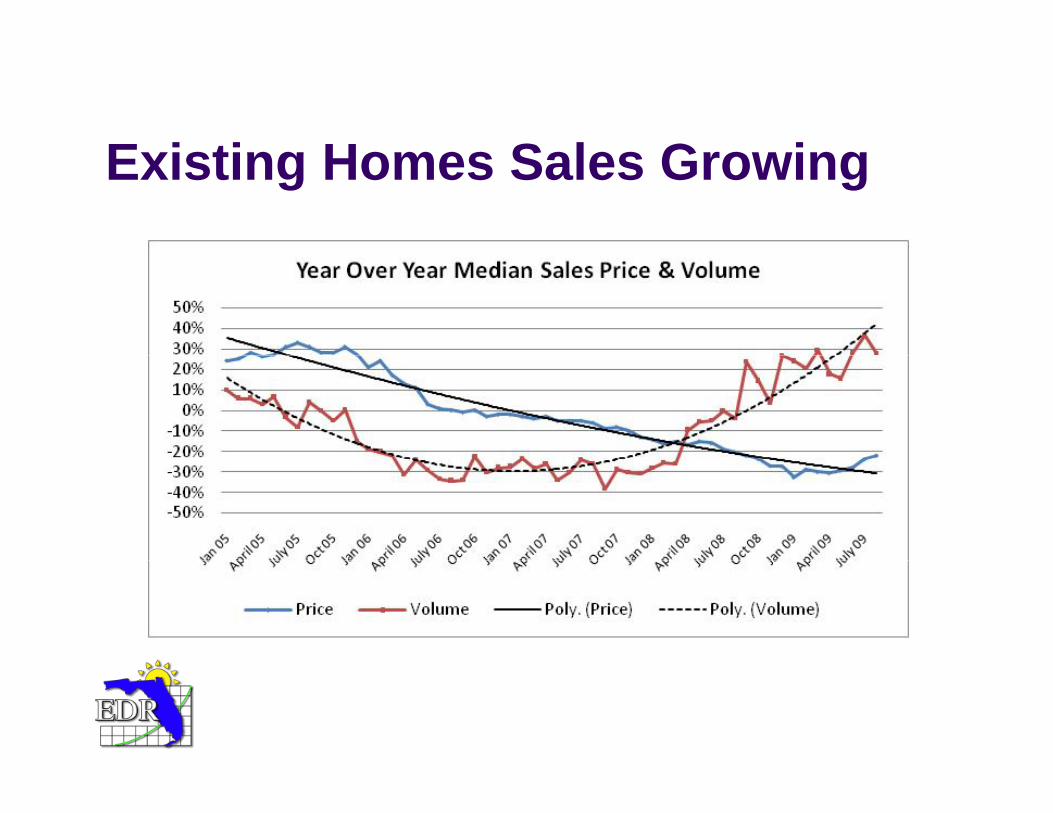
E i ti H S l G iExisting Homes Sales Growing
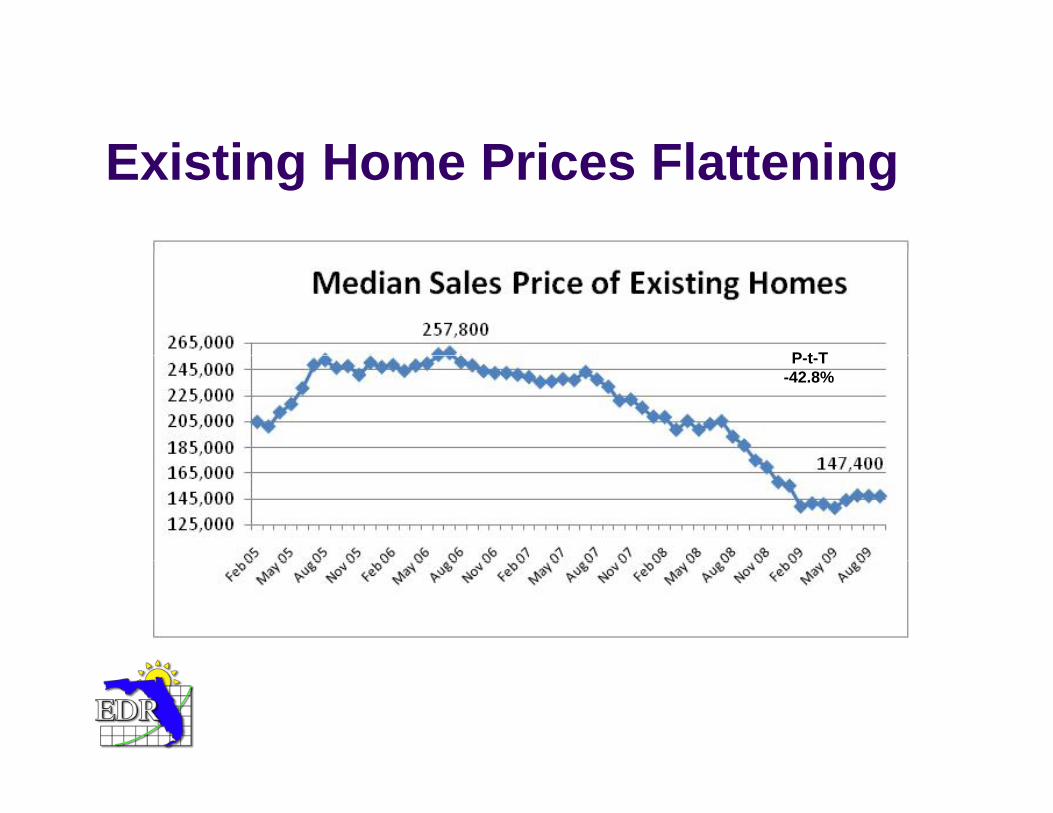
E i ti H P i Fl tt iExisting Home Prices Flattening
P t TP-t-T-42.8%
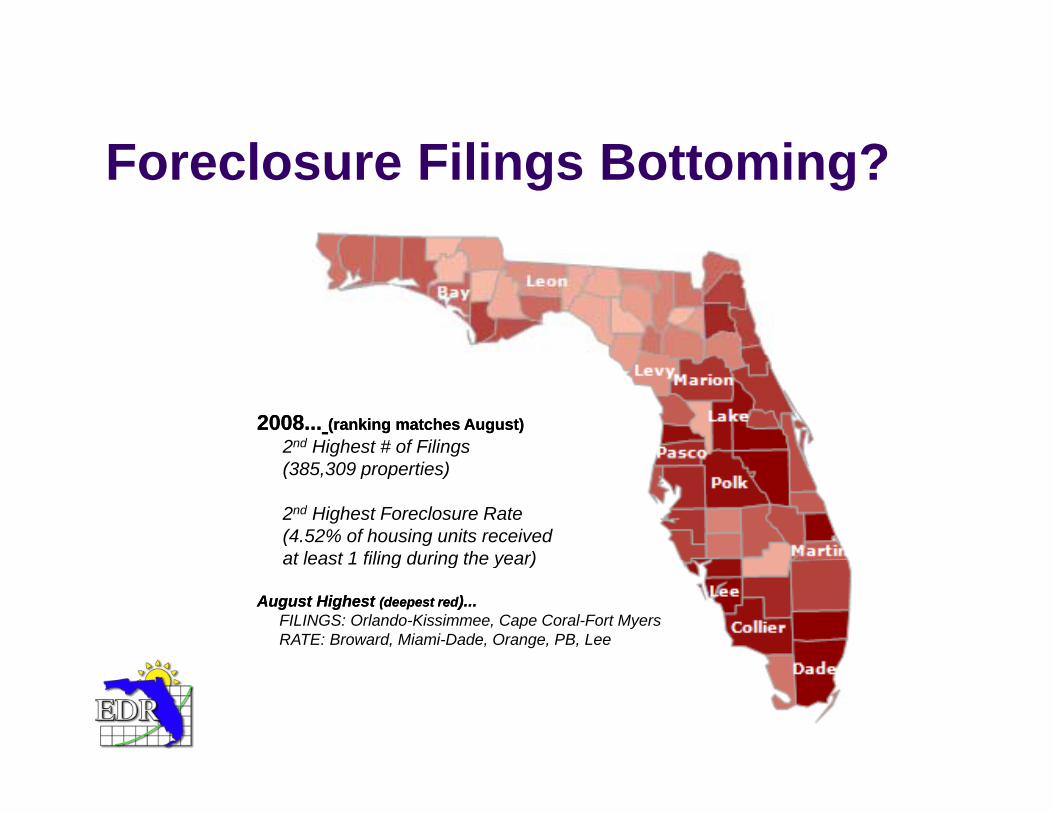
F l Fili B tt i ?Foreclosure Filings Bottoming?
2008...2008... (ranking matches August)(ranking matches August)2nd Highest # of Filings (385,309 properties)
2nd Highest Foreclosure Rate(4.52% of housing units receivedat least 1 filing during the year)at least 1 filing during the year)
August Highest August Highest (deepest red(deepest red)...)...FILINGS: Orlando-Kissimmee, Cape Coral-Fort MyersRATE: Broward, Miami-Dade, Orange, PB, Lee
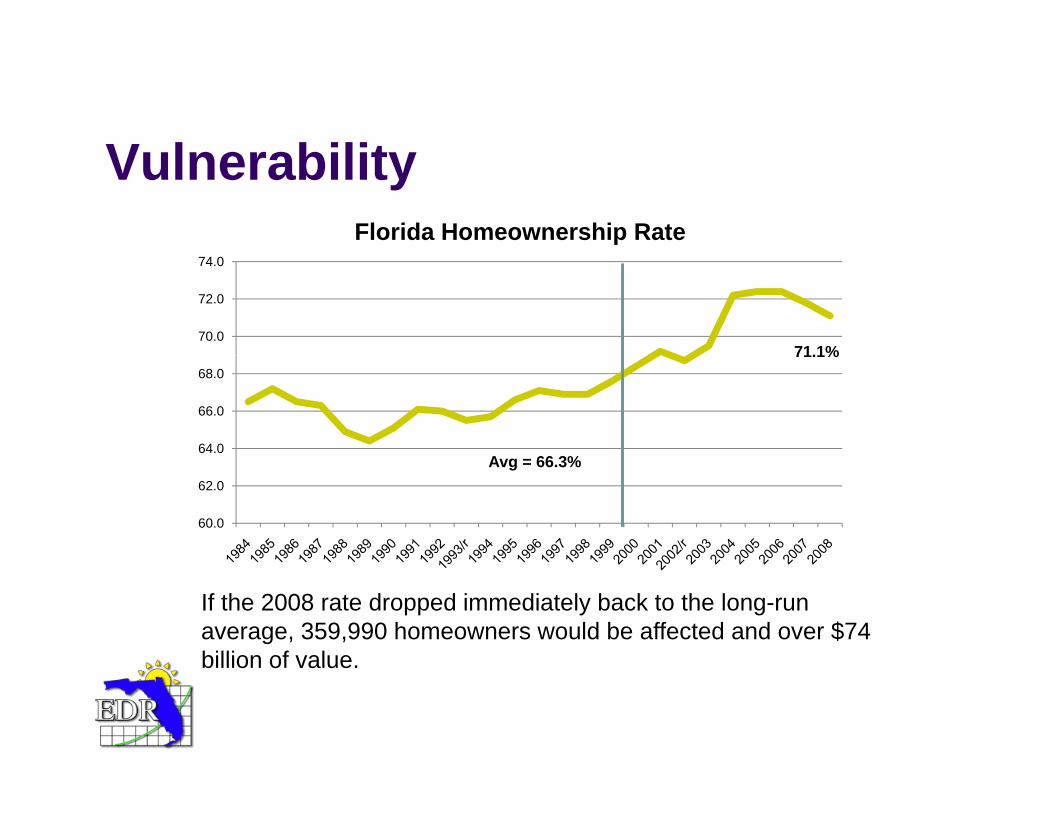
V l bilitVulnerabilityFlorida Homeownership Rate
71.1%70.0
72.0
74.0
A 66 3%
71.1%
64.0
66.0
68.0
Avg = 66.3%
60.0
62.0
If the 2008 rate dropped immediately back to the long-run average, 359,990 homeowners would be affected and over $74 billion of valuebillion of value.
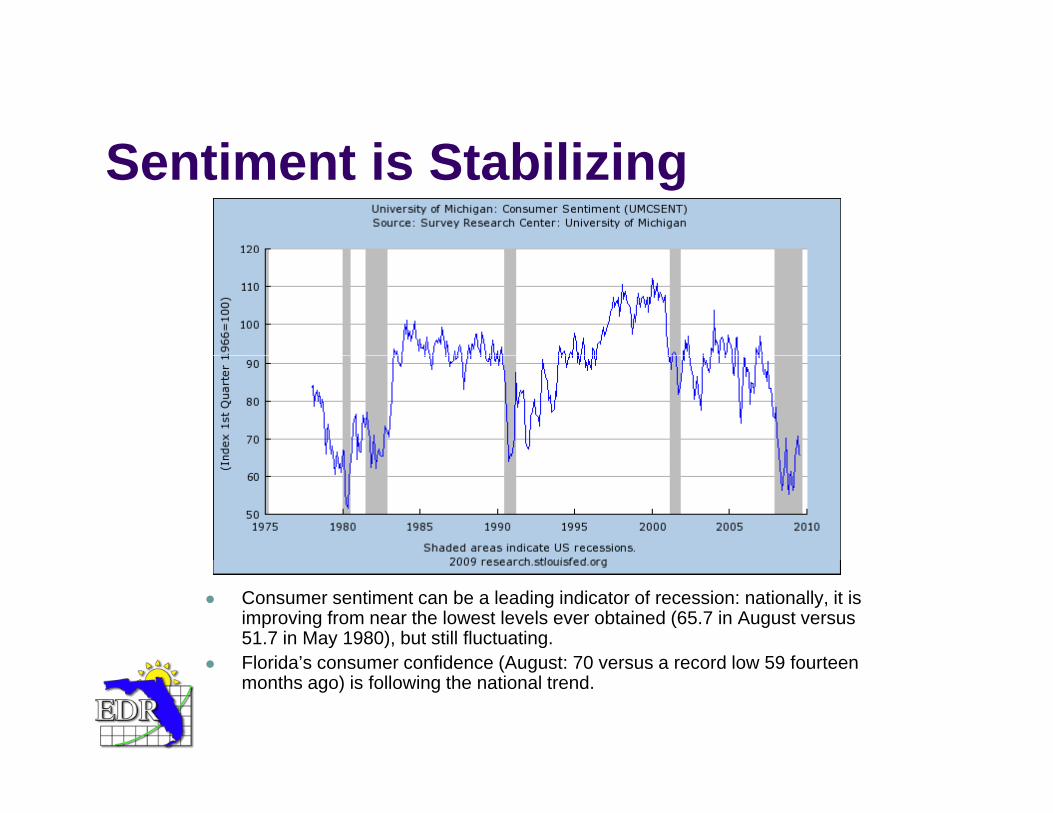
S ti t i St bili iSentiment is Stabilizing
Consumer sentiment can be a leading indicator of recession: nationally, it is improving from near the lowest levels ever obtained (65.7 in August versus 51.7 in May 1980), but still fluctuating. Florida’s consumer confidence (August: 70 versus a record low 59 fourteenFlorida s consumer confidence (August: 70 versus a record low 59 fourteen months ago) is following the national trend.
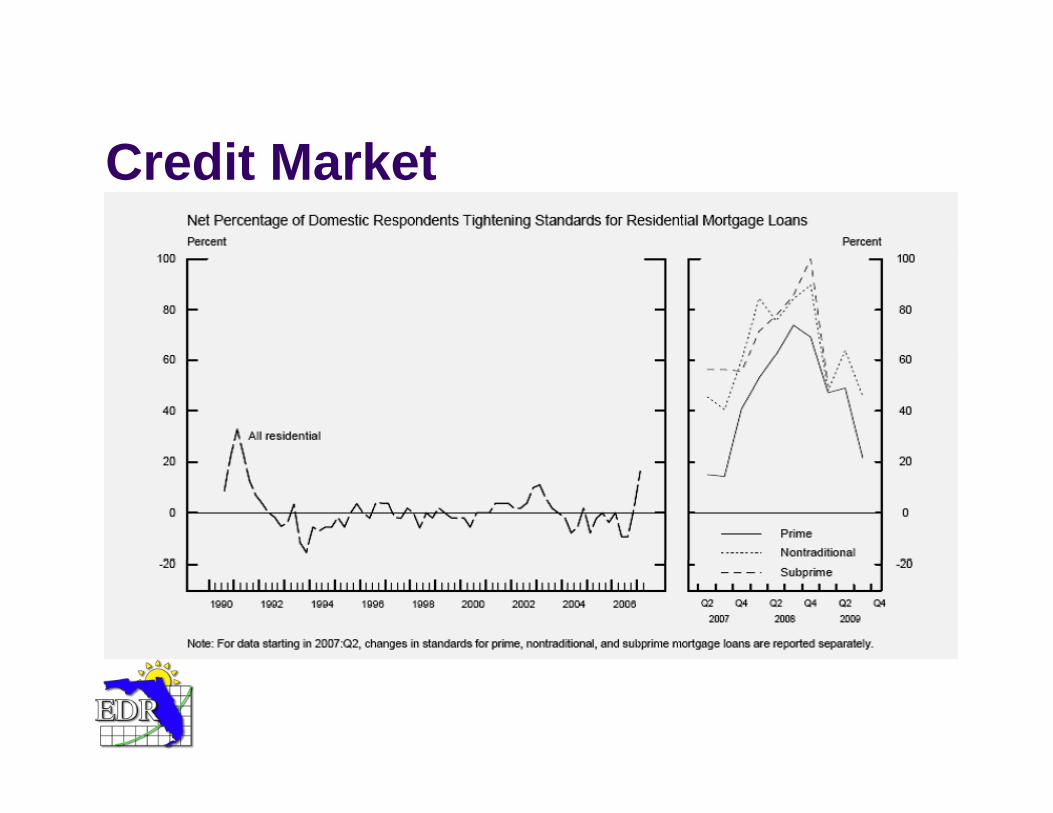
C dit M k tCredit Market
B i i It T thBringing It TogetherDrags are more persistent relative to some past events, and strength will be slow to returnstrength will be slow to return.
Credit Market, while much improved, remains sluggish and still difficult to accessdifficult to access.
Global recessionary conditions affect international migration, tourism and spending decisions, as well as exports.p g , p
U.S. Consumers are responding to massive wealth destruction and tighter credit conditions.
Recovery in the Florida housing market is not anticipated to begin until the latter half of Fiscal Year 2010-11.
Th E Will R b dThe Economy Will ReboundBy Summer 2010 growth rates will begin a slow returnBy Summer 2010, growth rates will begin a slow return to more typical levels. In the meanwhile...
The national economic contraction will run its course and moreThe national economic contraction will run its course and, more importantly, the financial markets will recover stability.The subsequent turnaround in Florida housing will be led by:
Falling home prices that begin to attract buyers and clear theFalling home prices that begin to attract buyers and clear the inventory (FL below the national average in July: $178,300 nationally vs. $147,600 in Florida...17.2% below)Long run sustainable demand caused by continued populationLong-run sustainable demand caused by continued population growth and household formation.Florida’s unique demographics and the aging of the baby-boom generationboom generation.
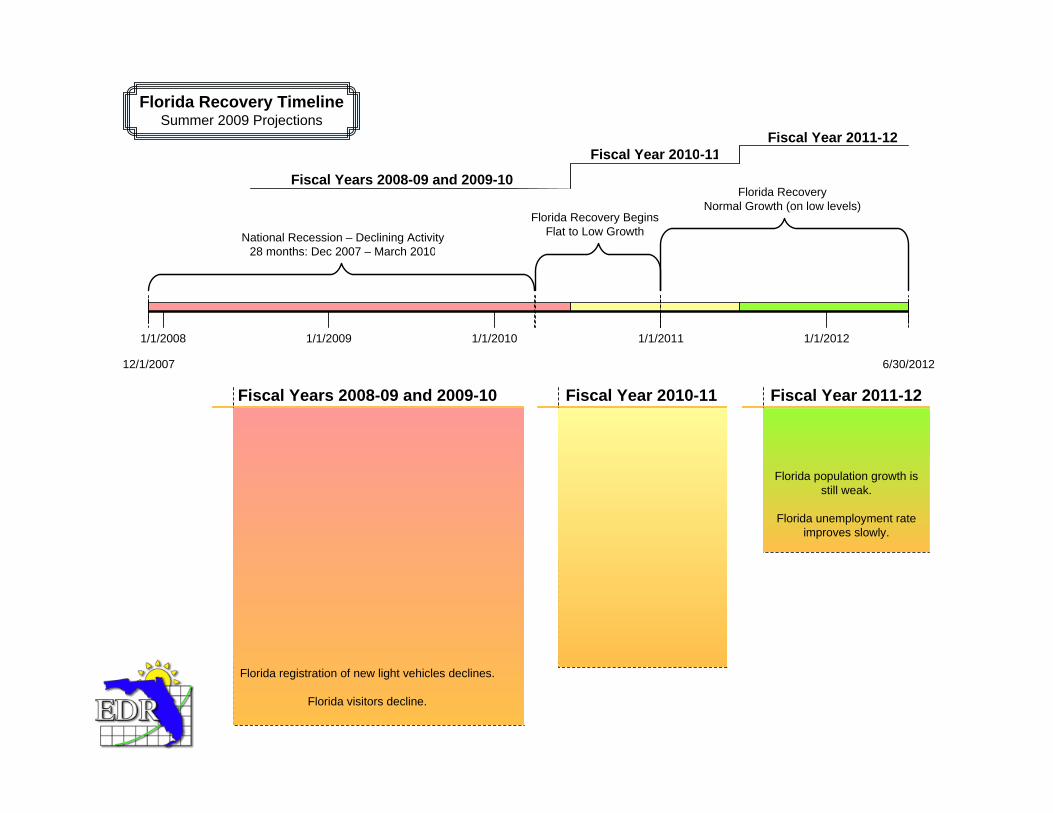
Florida Recovery TimelineSummer 2009 Projections
Fi l Y 2010 11Fiscal Year 2011-12
Fiscal Years 2008-09 and 2009-104/1/2010 - 12/31/2010
Florida Recovery Begins Flat to Low Growth
Fiscal Year 2010-111/1/2011 - 6/30/2012
Florida RecoveryNormal Growth (on low levels)
12/1/2007 - 3/30/2010National Recession – Declining Activity
28 months: Dec 2007 – March 2010
1/1/2008 1/1/2009 1/1/2010 1/1/2011 1/1/2012
28 months: Dec 2007 March 2010
12/1/2007 6/30/2012
Fiscal Years 2008-09 and 2009-10National GDP has negative growth of -1.7%.
National consumer price index is flat.
Fiscal Year 2011-12Most Florida measures return
to normal or accelerated growth rates.
Fiscal Year 2010-11National GDP has weak
growth.
Fl id l ti till hNational consumer spending is flat.
Standard & Poor’s Index is negative.
Florida has virtually zero population growth.
Florida personal income declines
Florida population growth is still weak.
Florida unemployment rateimproves slowly.
Florida population still has virtually no growth.
Florida personal income hasweak growth.
Florida employment hasweak growthFlorida personal income declines.
Florida employment declines.
Florida unemployment rate peaks at 10.9%.
Florida housing starts decline.
weak growth.
Florida unemployment rateis only slightly off the peak.
Florida private housing startsenter positive territory.
Florida registration of new light vehicles declines.
Florida visitors decline.
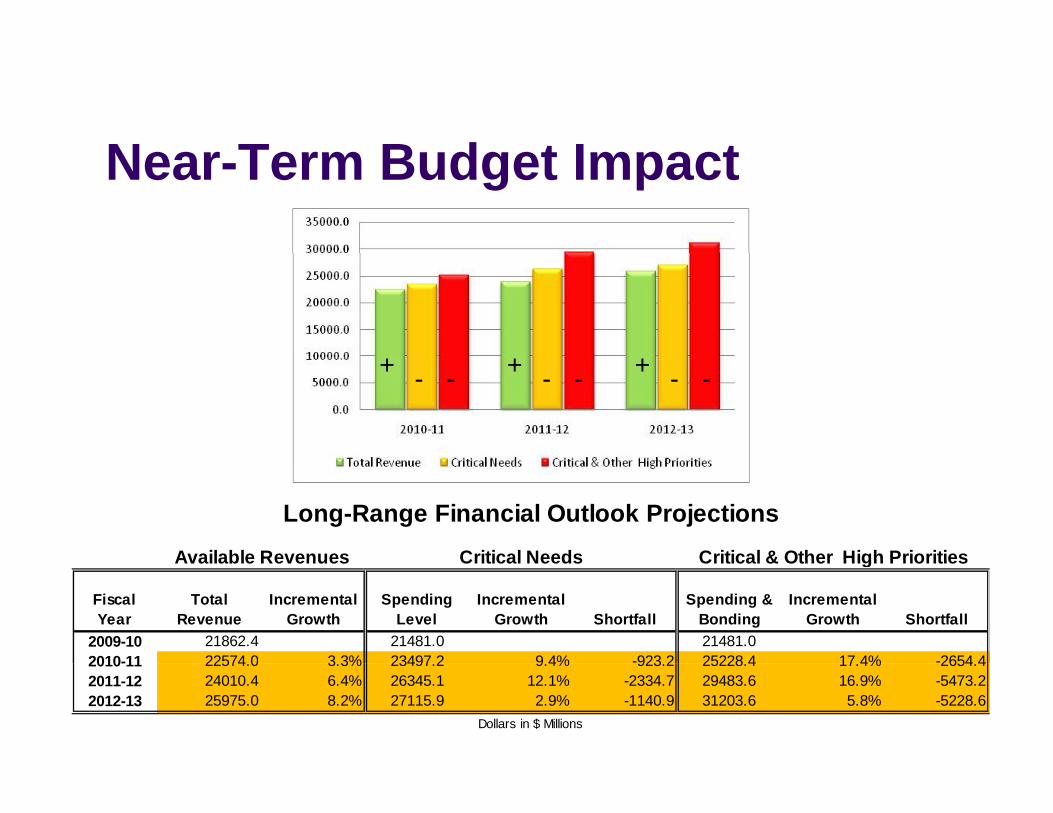
N T B d t I tNear-Term Budget Impact
+ + +- - - - - -
Critical Needs Critical & Other High PrioritiesAvailable Revenues
Long-Range Financial Outlook Projections
Fiscal Year
Total Revenue
Incremental Growth
Spending Level
Incremental Growth Shortfall
Spending & Bonding
Incremental Growth Shortfall
2009-10 21862.4 21481.0 21481.02010-11 22574 0 3 3% 23497 2 9 4% -923 2 25228 4 17 4% -2654 4
Critical Needs Critical & Other High PrioritiesAvailable Revenues
2010-11 22574.0 3.3% 23497.2 9.4% 923.2 25228.4 17.4% 2654.42011-12 24010.4 6.4% 26345.1 12.1% -2334.7 29483.6 16.9% -5473.22012-13 25975.0 8.2% 27115.9 2.9% -1140.9 31203.6 5.8% -5228.6
Dollars in $ Millions
D hi T itiDemographic TransitionPopulation growth is the state’s primary engine of economic
h f li b h l d i hgrowth, fueling both employment and income growth.
Population growth hovered between 2.0% and 2.6% from the mid 1990’s to 2006 then began to slow – only reaching 0 7%mid 1990 s to 2006, then began to slow only reaching 0.7% in 2008. In the short term, population growth is forecast to remain relatively flat – averaging 0.4% between 2008 and 2012. Population growth is expected to recover in the future
i 1 1% b t 2025 d 2030– averaging 1.1% between 2025 and 2030.
The future will be different from the past; the long-term growth rate between 1970 and 1995 was over 3%rate between 1970 and 1995 was over 3%.
Florida is still on track to break the 20 million mark in 2015, becoming the third most populous state sometime before th i N Y kthen – surpassing New York.
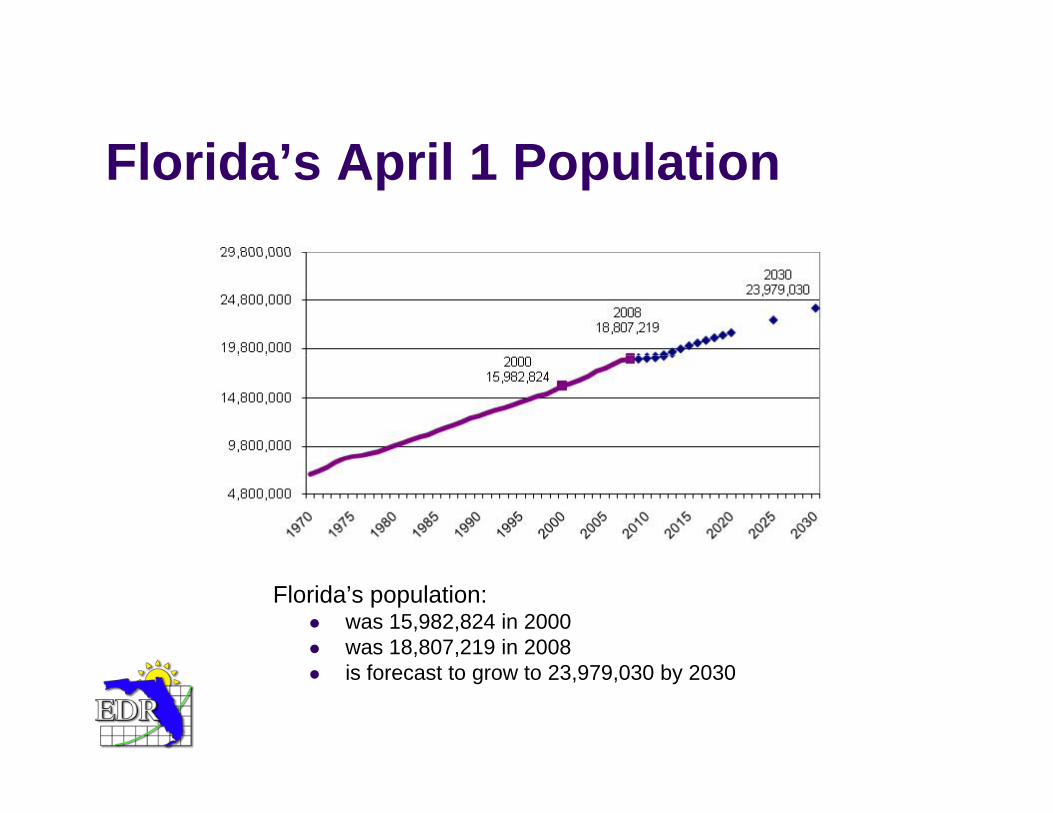
Fl id ’ A il 1 P l tiFlorida’s April 1 Population
Florida’s population:was 15,982,824 in 2000was 18,807,219 in 2008is forecast to grow to 23,979,030 by 2030
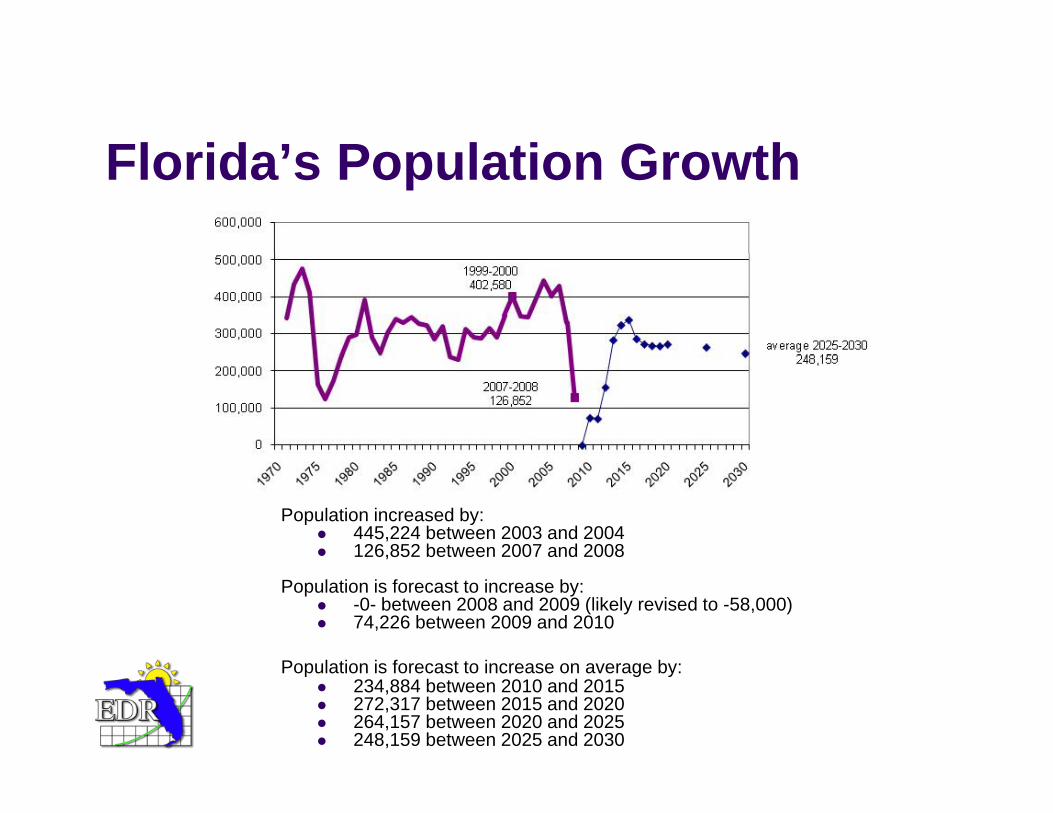
Fl id ’ P l ti G thFlorida’s Population Growth
Population increased by:445,224 between 2003 and 2004126,852 between 2007 and 2008
Population is forecast to increase by:-0- between 2008 and 2009 (likely revised to -58,000)74,226 between 2009 and 2010
P l ti i f t t i bPopulation is forecast to increase on average by:234,884 between 2010 and 2015 272,317 between 2015 and 2020264,157 between 2020 and 2025248,159 between 2025 and 2030
Fl id ’ P l ti G thFlorida’s Population Growth
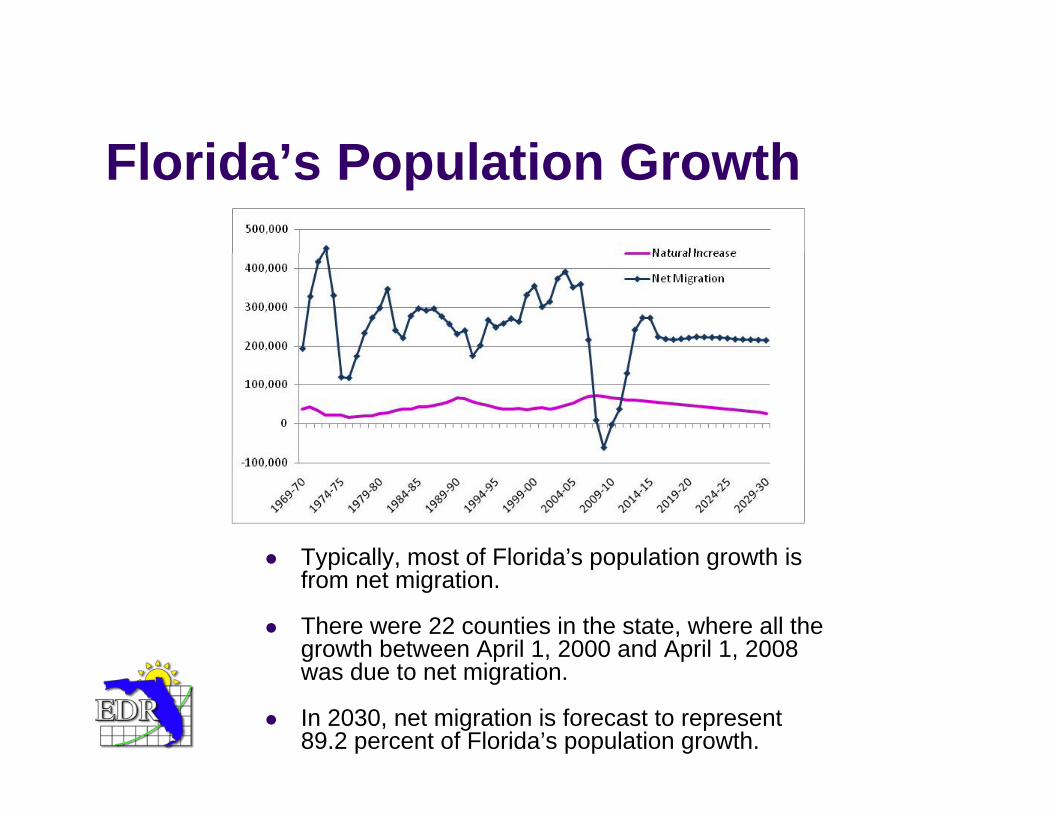
Typically most of Florida’s population growth isTypically, most of Florida s population growth is from net migration.
There were 22 counties in the state, where all the growth between April 1, 2000 and April 1, 2008
d i iwas due to net migration.
In 2030, net migration is forecast to represent 89.2 percent of Florida’s population growth.
Median Age of Floridians(April 1, 2008)
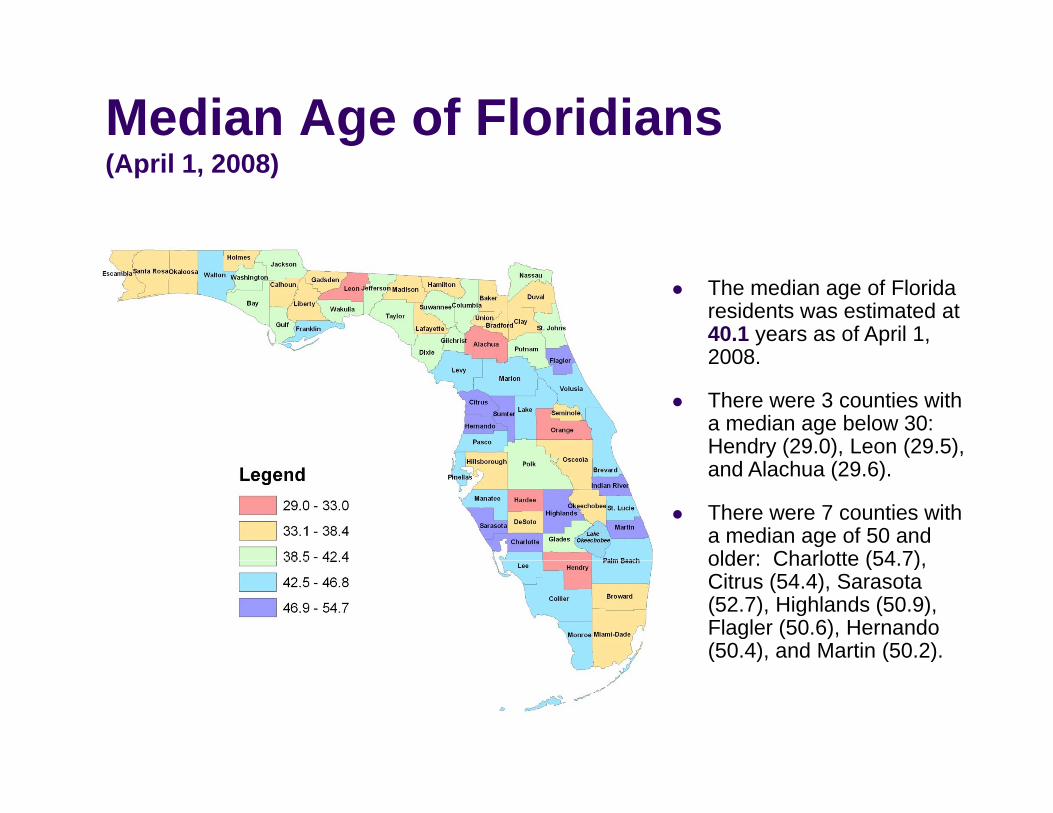
The median age of Florida residents was estimated at 40.1 years as of April 1, 20082008.
There were 3 counties with a median age below 30: Hendry (29.0), Leon (29.5), and Alachua (29.6).
There were 7 counties with a median age of 50 and older: Charlotte (54 7)older: Charlotte (54.7), Citrus (54.4), Sarasota (52.7), Highlands (50.9), Flagler (50.6), Hernando (50.4), and Martin (50.2).
P l ti b A GPopulation by Age Group4 000 000
4,500,000
2,500,000
3,000,000
3,500,000
4,000,000April 1, 2008
1,000,000
1,500,000
2,000,000
0
500,000
0‐17 18‐29 30‐39 40‐49 50‐59 60‐69 70‐79 80+
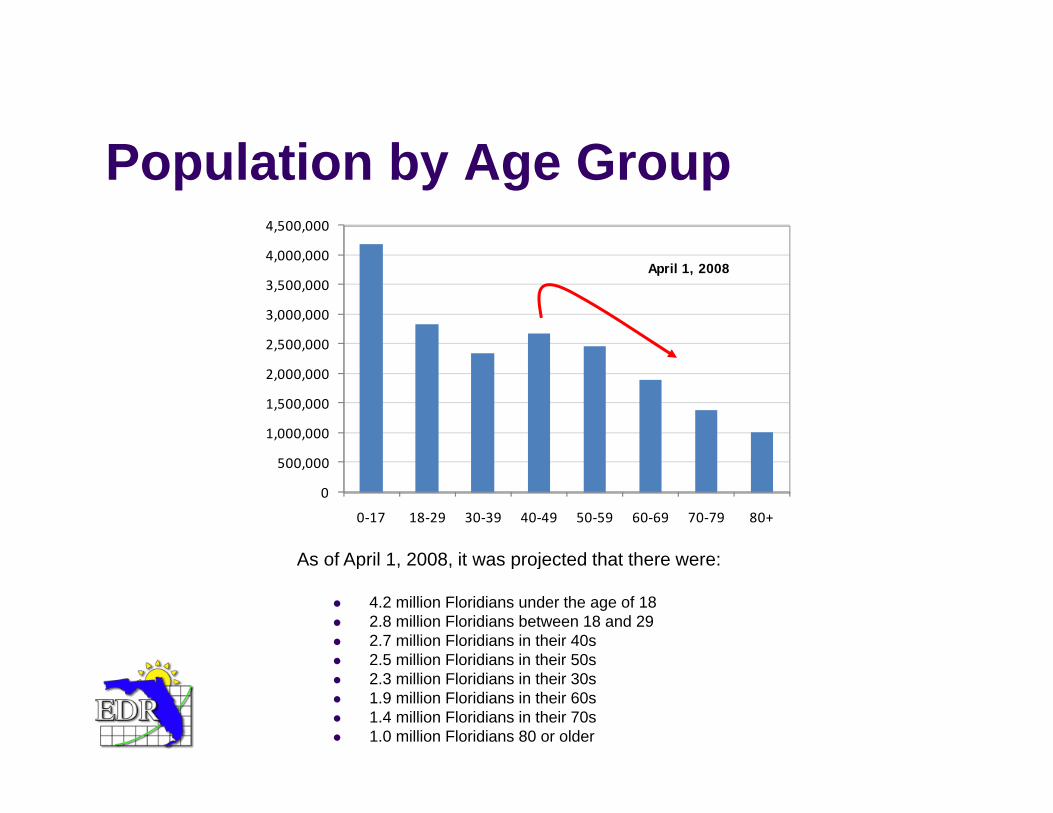
As of April 1 2008 it was projected that there were:As of April 1, 2008, it was projected that there were:
4.2 million Floridians under the age of 182.8 million Floridians between 18 and 292.7 million Floridians in their 40s2 5 million Floridians in their 50s2.5 million Floridians in their 50s2.3 million Floridians in their 30s1.9 million Floridians in their 60s1.4 million Floridians in their 70s1.0 million Floridians 80 or older
Percent of Population Growth by A GAge Group
25 0%
30.0%
April 1, 2008 to April 1, 2030
15 0%
20.0%
25.0%
5.0%
10.0%
15.0%
0.0%
5.0%
0‐17 18‐29 30‐39 40‐49 50‐59 60‐69 70‐79 80+
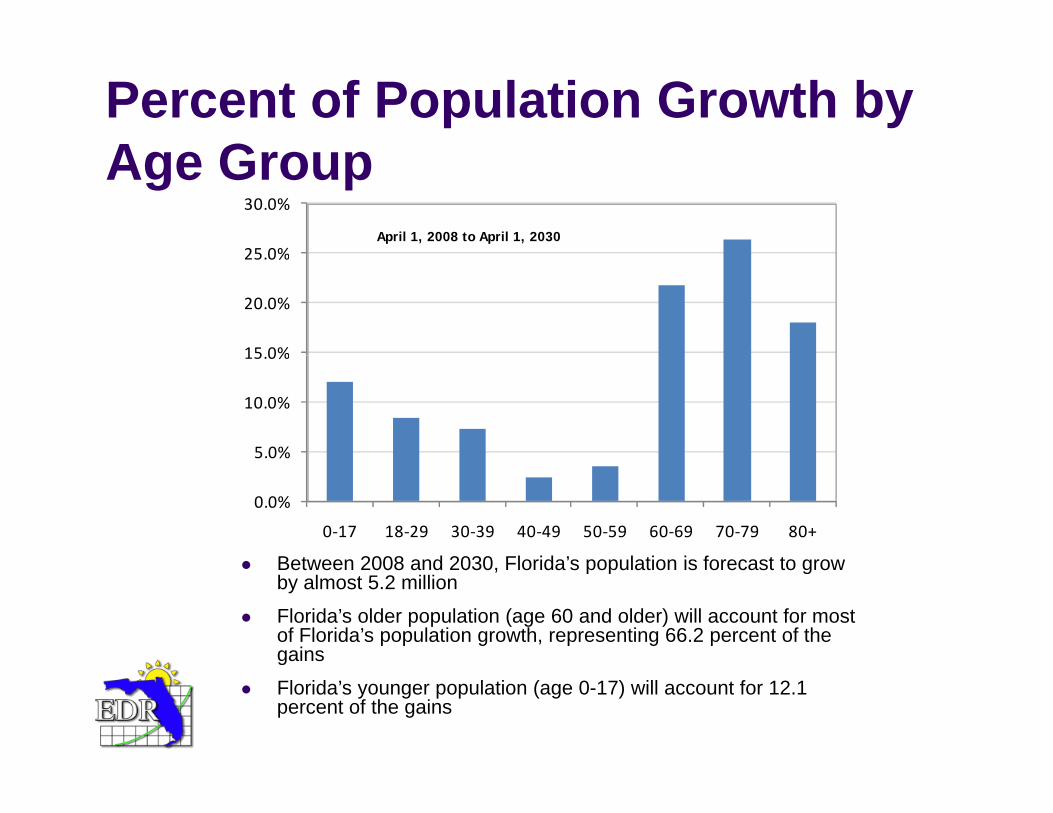
Between 2008 and 2030 Florida’s population is forecast to growBetween 2008 and 2030, Florida s population is forecast to grow by almost 5.2 million
Florida’s older population (age 60 and older) will account for most of Florida’s population growth, representing 66.2 percent of the gainsg
Florida’s younger population (age 0-17) will account for 12.1 percent of the gains
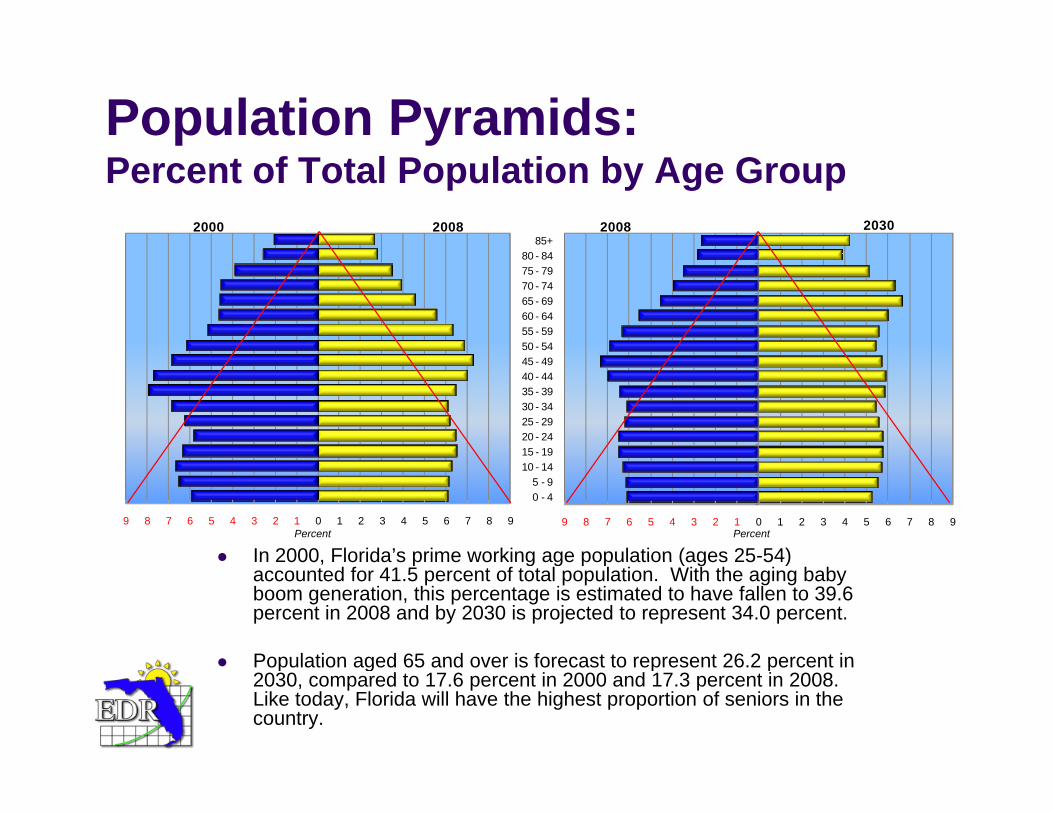
Population Pyramids: Percent of Total Population by Age Group
80 8485+
2000 2008 2008 2030
50 - 5455 - 5960 - 6465 - 6970 - 7475 - 7980 - 84
15 - 1920 - 2425 - 2930 - 3435 - 3940 - 4445 - 49
9 8 7 6 5 4 3 2 1 0 1 2 3 4 5 6 7 8 9
0 - 45 - 9
10 - 14
9 8 7 6 5 4 3 2 1 0 1 2 3 4 5 6 7 8 9
In 2000, Florida’s prime working age population (ages 25-54)Percent Percent
In 2000, Florida s prime working age population (ages 25 54) accounted for 41.5 percent of total population. With the aging baby boom generation, this percentage is estimated to have fallen to 39.6 percent in 2008 and by 2030 is projected to represent 34.0 percent.
Population aged 65 and over is forecast to represent 26 2 percent inPopulation aged 65 and over is forecast to represent 26.2 percent in 2030, compared to 17.6 percent in 2000 and 17.3 percent in 2008. Like today, Florida will have the highest proportion of seniors in the country.
P l ti b RPopulation by RaceOther2.4%
Black or African
American2000Other2.8%
Black or African
American200815.4%
American16.5%
Other3.5%
Black or African
A i
White82.2%
White80.7%
American17.0%
White79.4% 2030
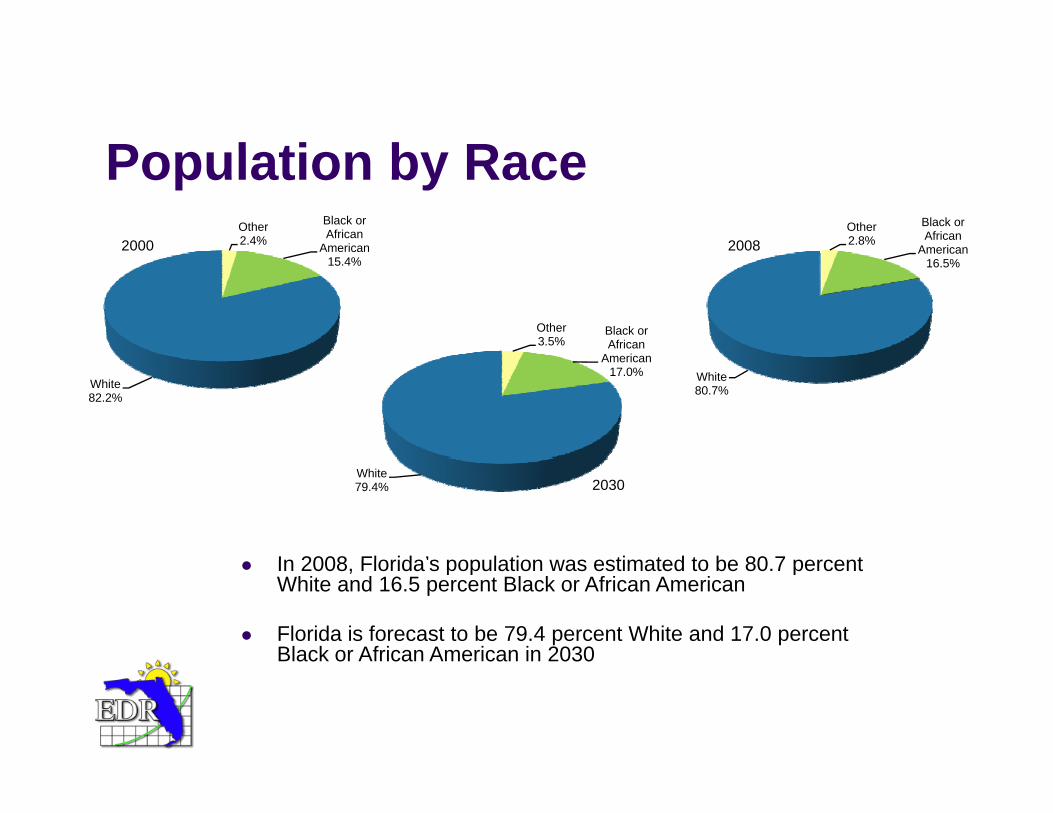
In 2008 Florida’s population was estimated to be 80 7 percentIn 2008, Florida s population was estimated to be 80.7 percent White and 16.5 percent Black or African American
Florida is forecast to be 79.4 percent White and 17.0 percent Black or African American in 2030
Fl id ’ Hi i P l tiFlorida’s Hispanic Population23 7% 24.6% 25.4%
25 0%
30.0%
16.8%19.1%
21.4% 21.4%22.5%
23.7%
15.0%
20.0%
25.0%
5.0%
10.0%
Currently Hispanics represent about 21 4 percent of
0.0%
2000 2005 2008 2010 2015 2020 2025 2030
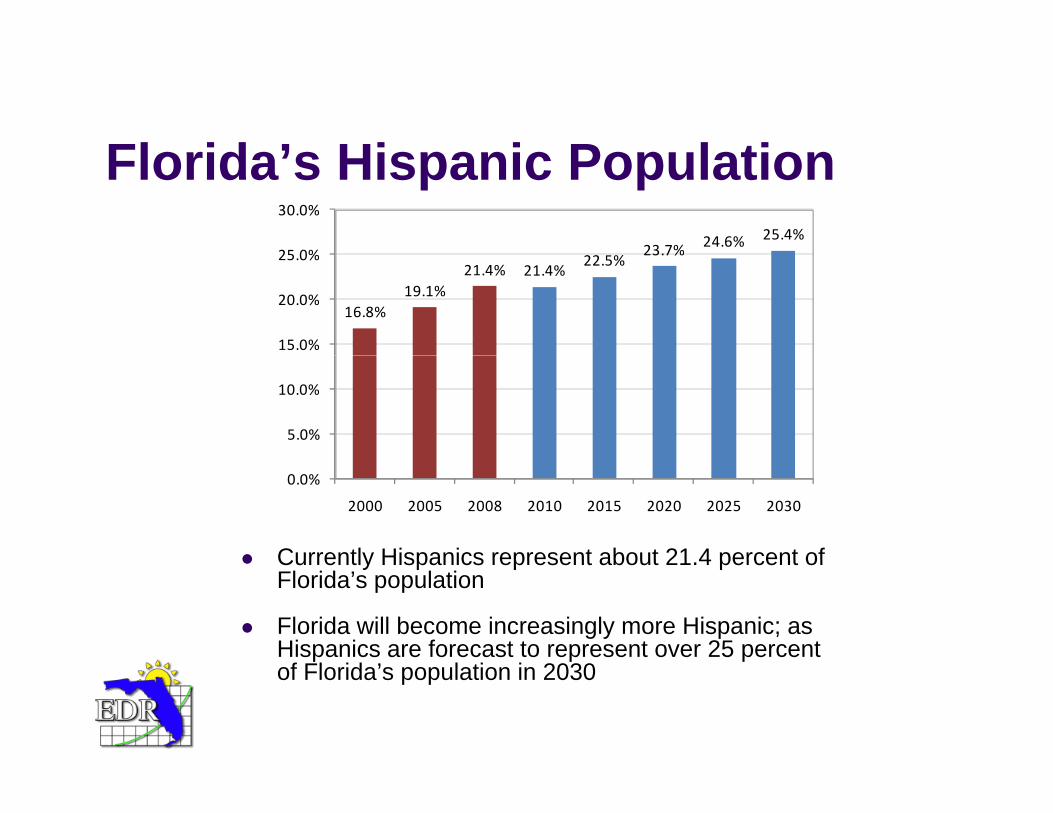
Currently Hispanics represent about 21.4 percent of Florida’s population
Florida will become increasingly more Hispanic; as Hispanics are forecast to represent over 25 percent
f Fl id ’ l i i 2030of Florida’s population in 2030
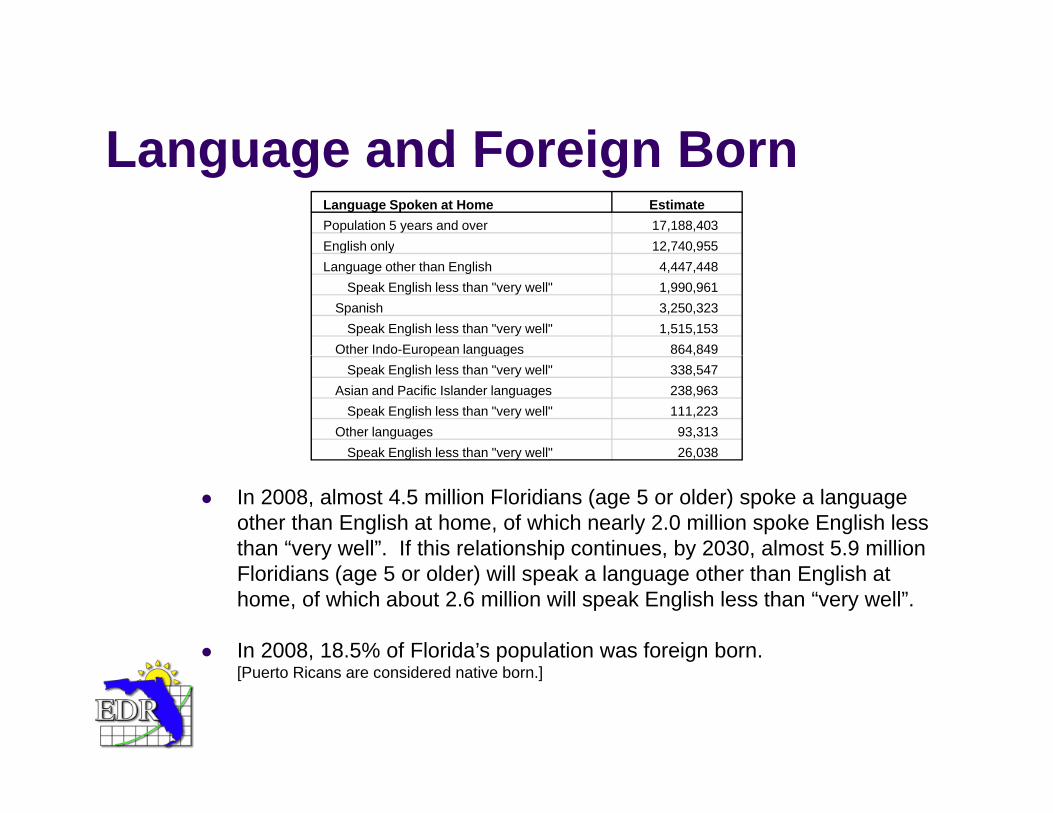
Language and Foreign BornLanguage and Foreign BornLanguage Spoken at Home EstimatePopulation 5 years and over 17,188,403English only 12,740,955g yLanguage other than English 4,447,448
Speak English less than "very well" 1,990,961Spanish 3,250,323
Speak English less than "very well" 1,515,153Other Indo-European languages 864,849p g g ,
Speak English less than "very well" 338,547Asian and Pacific Islander languages 238,963
Speak English less than "very well" 111,223Other languages 93,313
Speak English less than "very well" 26,038
In 2008, almost 4.5 million Floridians (age 5 or older) spoke a language other than English at home, of which nearly 2.0 million spoke English less than “very well”. If this relationship continues, by 2030, almost 5.9 million
p g y ,
Floridians (age 5 or older) will speak a language other than English at home, of which about 2.6 million will speak English less than “very well”.
In 2008, 18.5% of Florida’s population was foreign born. [Puerto Ricans are considered native born.]
B b B C h tBaby Boom Cohort
Birth Cycle: 1946 – 1964Initial Number: 75 9 millionInitial Number: 75.9 millionEntry into the Workforce: 1967 – 1985Entry into Retirement: 2011 – 2029
2050
Gl b l T dGlobal TrendsBy 2025, the world will be:y ,
Much Older (the US will largely look like FL today)Far Less CaucasianFar More Concentrated in Urban Areas
The aging population is a function of:The Baby Boom CohortFalling Fertility RatesRising Longevity (life expectancy)
L T W kf T dLong-Term Workforce TrendsThe ratio of taxpaying workers to retirees will fall as babyThe ratio of taxpaying workers to retirees will fall as baby boomers age:
US today, 4:1FL today, 3:1FL in 2030, 2:1
Pool of native workers will shrink: new retirees will not be fully replaced by younger workers.
Worker shortages (especially among highly educated and skilled) will become the norm.
M R ifi tiMore RamificationsLabor force contraction could significantly depress economicLabor force contraction could significantly depress economic output and boost inflation as wages increase to attract workers from other areas.
Long-term economic slowdown and larger retirement population will further lead to a decline in consumer spending and changes in investment patterns as the senior population g p p pspends down its savings.
Lower standard of living could become the norm for some, especially for those seniors living on fixed incomes for 20 or more years, and the estimated one-third of boomers with limited retirement assets (mainly single women).
Fl id Ch llFlorida ChallengesAging StateAging State more intense in Florida thanAging StateAging State – more intense in Florida than elsewhere because population share (26.2% in 2030)( )Growing StateGrowing State – all of the same problems as we’ve had in the past, only more soy
Greater Need for ServicesAllocation of Increasingly Scarce Natural Resources (especially water)(especially water)Provision of Needed Infrastructure (new and replaced)
I li ti f S iImplications for Services
L b i t i j b (fi fi ht liLabor-intensive jobs (firefighters, police, construction) will be harder to fill.T d ’ ld l f f t fToday’s elderly prefer face-to-face interaction. In the future, people will become more technologically savvy and moremore technologically savvy and more comfortable working over the internet.
Less reliance on physical spaceLess reliance on physical spaceFewer employees as the use of technology increases
H lth CHealth CareAbout 80% of older people are living with at least one p p gchronic condition.Nearly one-third of all older people live alone, and this h ti t ishare continues to increase.
Today, elderly and disabled Medicaid recipients account for an estimated 34% of the total caseload – but almostfor an estimated 34% of the total caseload but almost 69% of Medicaid spending.
Use of acute and long-term care services is high. The majority of nursing home residents rely on Medicaid supportThe majority of nursing home residents rely on Medicaid support after the cost of their care exhausts their savings and they qualify for assistance --- 65% of nursing home residents have Medicaid.An increasing array of new services procedures and drugsAn increasing array of new services, procedures and drugs prolong life – but also the potential for chronic problems.

C i i l J tiCriminal Justice
P it t it i di i i hPropensity to commit crime diminishes over time; however, Florida has been increasing the classification of crimethe classification of crime.Prisons will have an increasing share of older and infirm inmatesand infirm inmates.
RRevenuesOne implication of the declining working-ageOne implication of the declining working age population is that government tax structures which rely heavily on this age-group will have to be reevaluatedreevaluated. An increasingly smaller percentage of individuals will assume the bulk of the tax burden as the number of elderly increases and the demand for services continues to grow.The states that will be hardest hit are those that relyThe states that will be hardest hit are those that rely on personal income and payroll taxes as their largest revenue sources.
S l TSales TaxStudies have found that the elderly tend toStudies have found that the elderly tend to spend less than younger persons on goods and more on services. The state’s current sales tax structure with its dependence on the sale of goods will come
d f thi f tunder pressure from this fact.If this risk is not addressed, then the state will likely see much lower growth rates for sales taxlikely see much lower growth rates for sales tax receipts than it has normally seen in the past.
P t TProperty TaxesTraditionally senior citizens have opposed property taxation to aTraditionally, senior citizens have opposed property taxation to a greater extent than the rest of the population.Not only do many live on fixed incomes, but they also have no school-age children. As their connection to providing this type ofschool age children. As their connection to providing this type of funding diminishes, they are more apt to oppose property tax increases of any kind. Conversely, Florida offers several income-based exemptions and y, ptax advantages for senior citizens that will become increasingly expensive as the baby boomers hit their retirement years. While today’s elderly have the lowest poverty rates of any age group, this will not be true in the future An estimated one third ofthis will not be true in the future. An estimated one-third of boomers are projected to have limited financial assets or private pensions when they retire.
St t iStrategiesAttracting migration from other states and countries whichAttracting migration from other states and countries which have greater youth populations will become an important relief valve for worker shortages.
On average immigrants are younger than native AmericansOn average, immigrants are younger than native Americans, are more inclined to work and have more children per family (Federal Reserve).
Designing incentive programs to keep workers in theDesigning incentive programs to keep workers in the workforce longer.Fostering the development and application of:
Age-sensitive technologies.Productivity-enhancing skills and technologies.


![The influence of refugial population on Lateglacial and ...people.geo.su.se/barbara/pdf/Feurdean_et_al_2007_RPP_f[1].pdf · The influence of refugial population on Lateglacial and](https://img.dokumen.tips/doc/110x75/5e0a4f17dfca9e635f10a958/the-influence-of-refugial-population-on-lateglacial-and-1pdf-the-influence.jpg)