Embed Size (px)
Citation preview

1
Florida State Board of Education2011-12 Education Budget Request
As Approved by the State Board of Education on September 21, 2010

2
2011-12 Education Budget Presentation
Introduction Eric J. SmithPK-12 Education Frances HaithcockCareer and Adult Education Loretta CostinFlorida Colleges John NewmanOther Education Linda Champion
Vocational RehabilitationBlind ServicesStudent Financial Assistance
Fixed Capital Outlay Linda Champion
State Board of Education
2

3
Introduction
Dr. Eric J. SmithCommissioner of Education
3

4
National Assessment of Educational Progress (NAEP) Florida Mathematics Highlights 2009
Fourth grade students maintained the previous year’s average math score of 242. This is three points higher than the national average of 239 and represents an eight point increase for the state since 2003.
The percentage of Florida fourth-graders performing at or above Basic is greater than the national average for every student group tested in the state.
The percentage of Florida eighth-graders performing at or above Basic is equal to or greater than the national average for every student group tested in the state.
Since 2003, Florida’s African-American fourth-graders have narrowed the math achievement gap with White students by 6 points, compared to minimal reductions by the nation.
Since 2003, Florida’s African-American eighth-graders have narrowed the math achievement gap with White students by 12 points, compared to the nation’s three point narrowing.
Fourth grade students with disabilities increased their average math score to 230 this year, a seven point increase since 2007 and a 16 point increase since 2003. This year’s average score is 10 points above the national average of 220.
4

5
National Assessment of Educational Progress (NAEP) Florida Reading Highlights 2009
The scores of Florida’s African-American fourth and eighth grade students have increased 13 and 11 points respectively, compared to seven points for the nation’s African-American fourth-graders and one point for eighth-graders.
The scores of Florida’s Hispanic fourth and eighth grade students have increased 12 and nine points respectively, compared to five points for the nation’s Hispanic fourth-graders and four points for eighth-graders.
Florida’s fourth and eighth grade students with disabilities have increased their scores by 20 and 16 points respectively. This is compared to the nation’s increase of five points in both fourth and eighth grade.
Florida’s fourth and eighth grade low income students have increased their scores by 12 and 10 points respectively. This is compared to the nation’s increase of five points in fourth grade and three points in eighth grade.
The scores of Florida’s English Language Learners in fourth and eighth grade have increased seven and eight points respectively, compared to two points for the nation’s English Language Learners fourth-graders and a decrease of three points for eighth-graders.
5

6
76 77
6268
63 6368
7482 80
6569
65 64 6673
8682
68 71 70 6771 74
8682
70 73 7366
76 74
0
20
40
60
80
100
GR 4 GR 4 Nation GR 8 GR 8 Nation GR 4 GR 4 Nation GR 8 GR 8 Nation
Percent Scoring At or Above Basic Level
2003 2005 2007 2009
National Assessment of Educational Progress (NAEP) FLORIDA
6

7
FCAT Reading by Achievement Level, Grades 3-10
In 2010, 62 percent of all students in Grades 3‐10 were performing at or above Achievement Level 3 (on grade level and above) on FCAT Reading. This is an increase from 47 percent in 2001, 47 percent in 2002, 50 percent in 2003, 52 percent in 2004, 53 percent in 2005, 57 percent in 2006, 58 percent in 2007, 60 percent in 2008, and 61 percent in 2009. In 2010, 18 percent of all students in Grades 3‐10 were performing at Achievement Level 1 on FCAT Reading. This is a decrease from 32 percent in 2001, 31 percent in 2002, 29 percent in 2003, 27 percent in 2004, 26 percent in 2005, 22 percent in 2006, 21 percent in 2007, 20 percent in 2008, and is equal to 18 percent in 2009.Source: K20 Education Data WarehouseFlorida Department of Education, June 2010
7

8
FCAT Mathematics by Achievement Level, Grades 3-10
In 2010, 68 percent of all students in Grades 3‐10 were performing at or above Achievement Level 3 (on grade level and above) on FCAT Mathematics. This is an increase from 50 percent in 2001, 51 percent in 2002, 54 percent in 2003, 56 percent in 2004, 59 percent in 2005, 61 percent in 2006, 63 percent in 2007, 65 percent in 2008, and 67 percent in 2009. In 2010, 14 percent of all students in Grades 3‐10 were performing at Achievement Level 1 on FCAT Mathematics. This is a decrease from 29 percent in 2001, 27 percent in 2002, 24 percent in 2003, 22 percent in 2004, 20 percent in 2005, 18 percent in 2006, 17 percent in 2007, 15 percent in 2008, and is equal to 14 percent in 2009.Source: K20 Education Data WarehouseFlorida Department of Education, June 2010
8

9
FCAT Reading by Achievement Level, Grades 9 and 10
In 2010, 44 percent of all students in Grades 9 and 10 were performing at or above Achievement Level 3 (on grade level and above) on FCAT Reading. This is an increase from 32 percent in 2001, 32 percent in 2002, 33 percent in 2003, 33 percent in 2004, 34 percent in 2005, 37 percent in 2006, 38 percent in 2007, 42 percent in 2008, and 42 percent in 2009. In 2010, 26 percent of all students in Grades 9 and 10 were performing at Achievement Level 1 on FCAT Reading. This is a decrease from 39 percent in 2001, 39 percent in 2002, 38 percent in 2003, 38 percent in 2004, 37 percent in 2005, 33 percent in 2006, 32 percent in 2007, 30 percent in 2008, and 28 percent in 2009.Source: K20 Education Data WarehouseFlorida Department of Education, June 2010 9

10
FCAT Science by Achievement Level, Grade 5
In 2010, 49 percent of all students in Grade 5 were performing at or above Achievement Level 3 (on grade level and above) on FCAT Science. This is an increase from 28 percent in 2003, 29 percent in 2004, 33 percent in 2005, 35 percent in 2006, 42 percent in 2007, 43 percent in 2008, and 46 percent in 2009. In 2010, 19 percent of all students in Grade 5 were performing at Achievement Level 1 on FCAT Science. This is a decrease from 38 percent in 2003, 37 percent in 2004, 29 percent in 2005, 29 percent in 2006, 25 percent in 2007, 23 percent in 2008, and 21 percent in 2009.Source: K20 Education Data WarehouseFlorida Department of Education, June 2010 10

11
FCAT Science by Achievement Level, Grade 8
In 2010, 43 percent of all students in Grade 8 were performing at or above Achievement Level 3 (on grade level and above) on FCAT Science. This is an increase from 28 percent in 2003, 28 percent in 2004, 33 percent in 2005, 32 percent in 2006, 38 percent in 2007, 40 percent in 2008, and 41 percent in 2009. In 2010, 25 percent of all students in Grade 8 were performing at Achievement Level 1 on FCAT Science. This is a decrease from 36 percent in 2003, 36 percent in 2004, 36 percent in 2005, 35 percent in 2006, 31 percent in 2007, 27 percent in 2008, and 27 percent in 2009.Source: K20 Education Data WarehouseFlorida Department of Education, June 2010 11

12
FCAT Science by Achievement Level, Grade 11
In 2010, 38 percent of all students in Grade 11 were performing at or above Achievement Level 3 (on grade level and above) on FCAT Science. This is an increase from 33 percent in 2005, 35 percent in 2006, 37 percent in 2007, 38 percent in 2008, and 37 percent in 2009. In 2010, 28 percent of all students in Grade 11 were performing at Achievement Level 1 on FCAT Science. This is a decrease from 36 percent in 2005, 32 percent in 2006, 30 percent in 2007, 29 percent in 2008, and 31 percent in 2009.Source: K20 Education Data WarehouseFlorida Department of Education, June 2010
12

Education, $22.5 , 32%
Human Services, $28.5 , 41%
General Government, $4.5 ,
6%
Natural Resources, Environment,
Growth Management and Transportation,
$9.7 , 14%
Criminal Justice and Corrections and Judicial, $5.1 , 7%
1313
2010-11 Statewide FundsOperations and Fixed Capital Outlay
= $70.3 billion(amounts in billions)
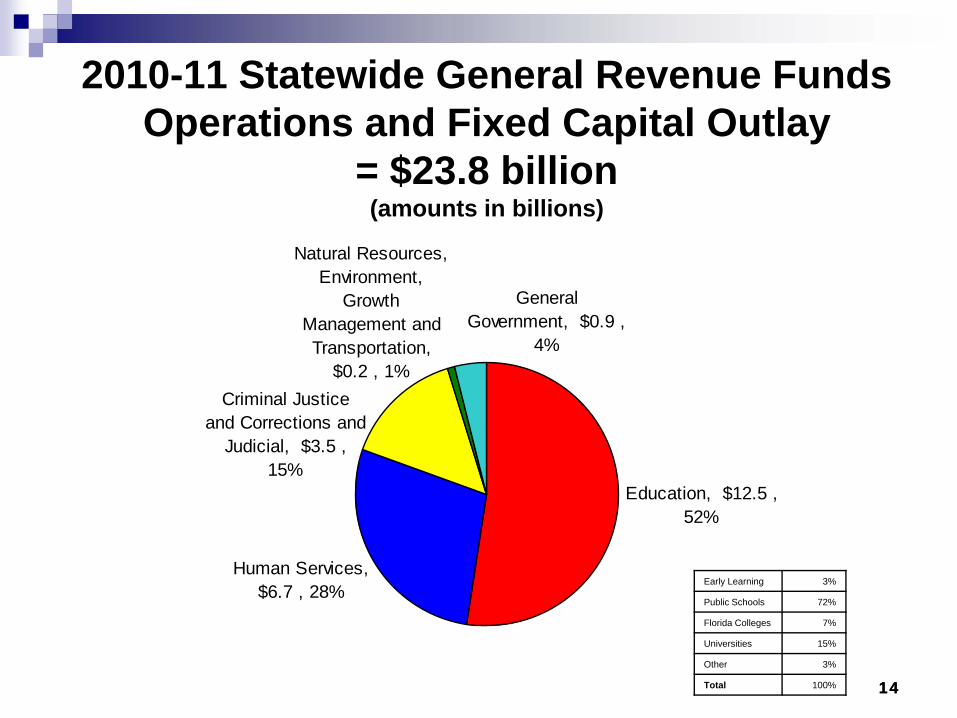
Education, $12.5 , 52%
Human Services, $6.7 , 28%
Natural Resources, Environment,
Growth Management and Transportation,
$0.2 , 1%
General Government, $0.9 ,
4%
Criminal Justice and Corrections and
Judicial, $3.5 , 15%
1414
2010-11 Statewide General Revenue FundsOperations and Fixed Capital Outlay
= $23.8 billion (amounts in billions)
Early Learning 3%
Public Schools 72%
Florida Colleges 7%
Universities 15%
Other 3%
Total 100%

15
Department of Education Next Generation Strategic Initiatives
1. Strengthen foundation skills.2. Improve college and career readiness.3. Expand opportunities for post-secondary
degrees and certificates.4. Improve quality of teaching in the education
system.
5. Improve K-12 educational choice options.
6. Align resources to strategic goals.

16
2011-12 Prioritized Request for Additional State Support
Restoration of Nonrecurring Funds to Maintain Current Level of Services - $1.198 Billion Will Continue Services in VPK, Public Schools, Workforce, and Ensure Access to Florida Colleges
Instructional and Instructional Support Staff – Teachers, Librarians, Media Specialists Instructional Staff TrainingScholarships
Enrollment/Participation Growth - $217 Million to Fund1,494 VPK Students19,906 K-12 Students476 Workforce Students26,674 Florida College Students25,653 Scholarship Participants
16

17
2011-12 Prioritized Request for Additional State SupportEnhancements:
Additional Reading Funds - $40 MillionPublic School Technology Grant - $50 MillionVPK Supplement - $49 MillionFlorida Colleges Challenge Grants - $154 MillionRestore Norm-Referenced Test - $12 Million
Total Increase in State Support - $1.694 BillionGeneral Revenue - $1.319 BillionState Trust Funds - $375 Million
State Board of Education Voted Not to Request a Cost of Living Adjustment in Recognition of the Current State of the Economy

18
Voluntary Prekindergarten Program
Dr. Frances HaithcockChancellor, Public Schools
18

19
2011-12 Voluntary Prekindergarten Program Funds
2011-12 Data232,173 - Estimated Total Number of Four-Year-Olds 171,344 - Participation Estimate (Approximately 73.80% of Total)
2011-12 Legislative Budget Request
Maintain Current Year 4.50% Administrative Support of Regional Coalitions
$458,180,948
2010-11 Legislative
Appropriation
2011-12SBE
RequestIncrease/
(Decrease)% Increase/ (Decrease)
Full-time Equivalent 152,107.72 153,601.29 1,493.57 0.98%
School Year (BSA) $ 2,562 $ 2,562 $ 0 0.00%
Summer (BSA) $ 2,179 $ 2,179 $ 0 0.00%Supplement/Economically Disadvantaged Students $ 0 $48,998,217 $48,998,217 100.00%
19

20
2011-12 VPK Early Learning Standards and Accountability
Provider Services$ 259,481 - VPK Regional Facilitators $ 29,300 - Bright Beginnings Website$ 33,250 - Materials & Online Reporting System for Provider
Training
Accountability$ 61,969 - VPK Provider Kindergarten Readiness Rate
Website and Calculation of Rate
$384,000

21
K-12 Education
Dr. Frances HaithcockChancellor, Public Schools
21

22
2011-12 FEFP Summary
2010-11 FEFP Second Calculation
2011-12Legislative
Budget RequestIncrease/
(Decrease)% Increase/ (Decrease)
Unweighted FTE 2,645,079.41 2,664,985.23 19,905.82 0.75%
State and Local Funds $ 18,082,453,785 $ 18,242,331,399 $ 159,877,614 0.88%
Per Student FTE $ 6,836.26 $ 6,845.19 $ 8.93 0.13%
22
23
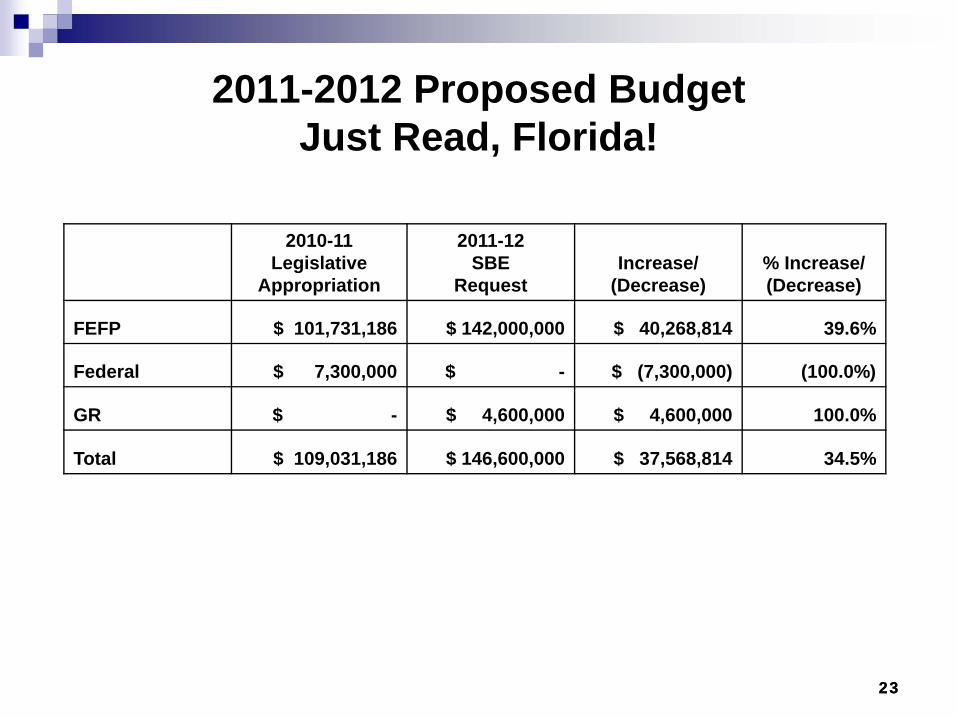
2011-2012 Proposed BudgetJust Read, Florida!
2010-11 Legislative
Appropriation
2011-12SBE
RequestIncrease/
(Decrease)% Increase/ (Decrease)
FEFP $ 101,731,186 $ 142,000,000 $ 40,268,814 39.6%
Federal $ 7,300,000 $ - $ (7,300,000) (100.0%)
GR $ - $ 4,600,000 $ 4,600,000 100.0%
Total $ 109,031,186 $ 146,600,000 $ 37,568,814 34.5%
23

24
Florida’s Race to the Top Budget
Total Florida RTTT Budget Requested, State 50%
Final figure: $700,000,000 (50% = $350,000,000)State’s 50% of RTTT funds will benefit every student in the state, regardless of school attendance in a Participating LEA
24

25
Race to the Top Grant Award
Programs FY 2010-11 FY 2011-12 FY 2012-13 FY 2013-14
Phase II TotalBudget
Allocation
Standards and Assessments $ 21,139,000 $ 38,020,000 $ 37,920,000 $ 41,920,000 $138,999,000
Data Systems $ 6,417,673 $ 10,686,538 $ 4,414,627 $ 4,325,741 $ 25,844,579
Great Teachers and Leaders $ 12,739,312 $ 18,078,916 $ 21,675,646 $ 16,418,378 $ 68,912,252
Struggling Schools $ 16,073,600 $ 22,594,300 $ 24,736,550 $ 22,595,550 $ 86,000,000
Charter Schools $ 2,500,000 $ 2,500,000 $ 2,500,000 $ 2,500,000 $ 10,000,000
DOE Project Management and Oversight $ 5,106,852 $ 5,045,772 $ 5,045,772 $ 5,045,773 $ 20,244,169
Total DOE Strategic Initiatives $ 63,976,437 $ 96,925,526 $ 96,292,595 $ 92,805,442 $350,000,000
Funding Subgranted to Participating LEAs (50% of Total Grant) $ 63,976,437 $ 96,925,526 $ 96,292,595 $ 92,805,442 $350,000,000
Total Grant Award $ 127,952,874 $ 193,851,052 $192,585,190 $ 185,610,884 $700,000,000
25
26
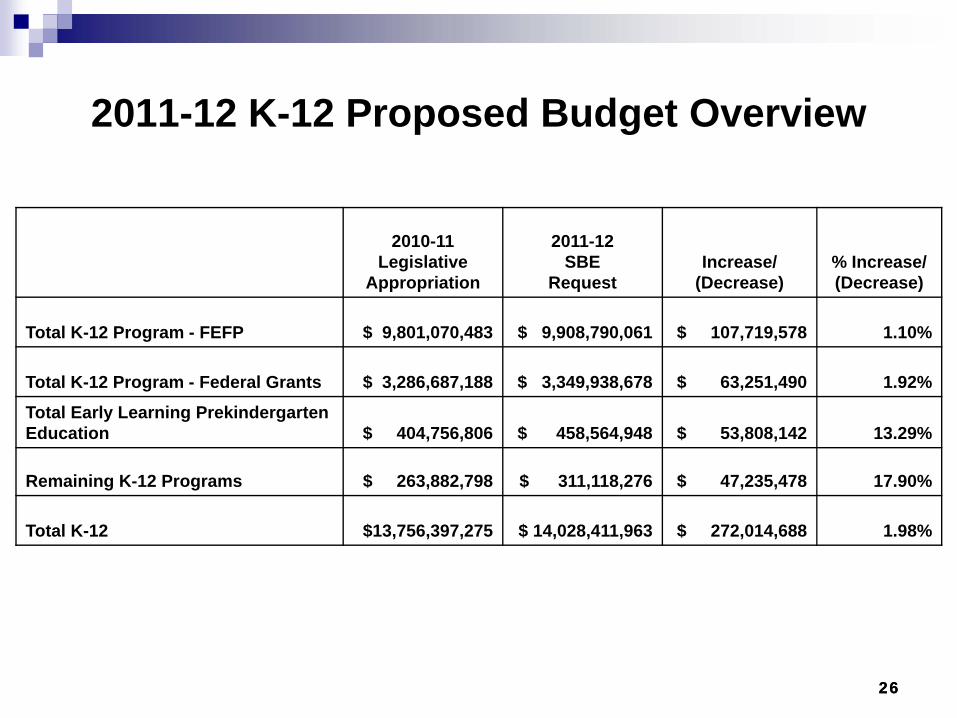
2011-12 K-12 Proposed Budget Overview
2010-11 Legislative
Appropriation
2011-12SBE
RequestIncrease/
(Decrease)% Increase/ (Decrease)
Total K-12 Program - FEFP $ 9,801,070,483 $ 9,908,790,061 $ 107,719,578 1.10%
Total K-12 Program - Federal Grants $ 3,286,687,188 $ 3,349,938,678 $ 63,251,490 1.92%
Total Early Learning Prekindergarten Education $ 404,756,806 $ 458,564,948 $ 53,808,142 13.29%
Remaining K-12 Programs $ 263,882,798 $ 311,118,276 $ 47,235,478 17.90%
Total K-12 $13,756,397,275 $ 14,028,411,963 $ 272,014,688 1.98%
26

27
Career and Adult Education
Loretta CostinChancellor, Career and Adult Education

28
Florida District Career and Adult Education2011-12 Budget Request
School District Career and Adult Education – Operating Funds1. 2010-11 Appropriation
for Workforce Development and Performance Incentives $ 374,641,224
2. Workload Enrollment Growth $ 1,909,396
Total Increase Requested $ 1,909,396
2011-12 Career and Adult Education – Workforce Development and and Performance $ 376,550,620
% Increase Over 2010-11 Appropriation .52%

29
Operating Funds Increase
2010-11* Legislative
Appropriation
2011-12**SBE
RequestIncrease/
(Decrease)% Increase/ (Decrease)
Enrollment FTE 91,156.47 91,631.58 475.11 0.52%
Total Funds $ 374,641,224 $ 376,550,620 $ 1,909,396 0.52%
Funds Per FTE $ 4,018.85 $ 4,018.85 $ 0
* 2010-11 FTE is based on the average FTE for fiscal years 2006-07 through 2008-09.** 2011-12 FTE is based on the average FTE for fiscal years 2007-08 through 2009-10.

30
Florida Colleges
John NewmanSenior Legislative Policy and Budget Advisor
30

31
An “Open-Door” With a Positive Outcome!
NOTE: Percentages represent percent of SREB average.SOURCE: 2008-2009 SREB-State Data Exchange, Tables 9 and 47
Leading the Region in Degree Productivity Among SREB States, 2008-09
050,000
100,000150,000200,000250,000300,000350,000400,000450,000
010,00020,00030,00040,00050,00060,00070,00080,000
FTE DEGREES
FTE 52,458 58,592 62,667 68,757 278,482 398,825DEGREES 6,892 10,169 10,669 14,046 71,222 59,049
GA MS AL SC FL TX
31

$0
$1,000
$2,000
$3,000
$4,000
$5,000
$6,000
2006-07 2007-08 2008-09 2009-10 2010-11 2011-12 LBR
Florida College System Funding per FTE by Source
ARRA Funds
Tuition
State
$5,537 $5,427
$5,053 $4,925 $5,083 $5,083
32
33
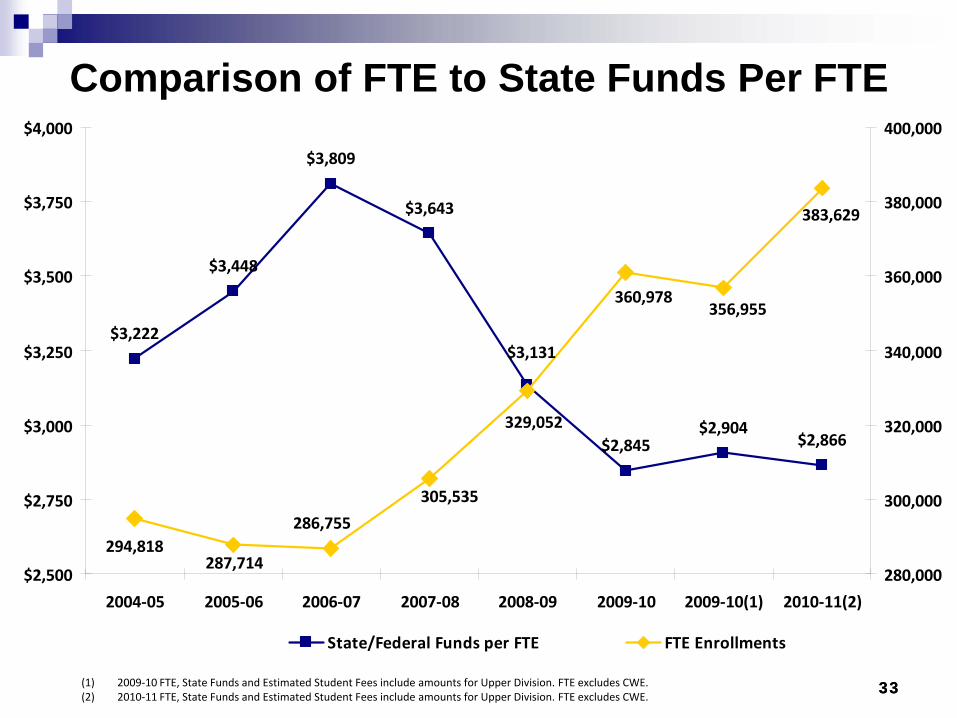
Comparison of FTE to State Funds Per FTE
$2,904$2,866
$3,643
$3,222
$3,448
$3,809
$2,845
$3,131
329,052
360,978
287,714294,818
356,955
383,629
286,755
305,535
$2,500
$2,750
$3,000
$3,250
$3,500
$3,750
$4,000
2004‐05 2005‐06 2006‐07 2007‐08 2008‐09 2009‐10 2009‐10(1) 2010‐11(2)
280,000
300,000
320,000
340,000
360,000
380,000
400,000
State/Federal Funds per FTE FTE Enrollments
(1) 2009‐10 FTE, State Funds and Estimated Student Fees include amounts for Upper Division. FTE excludes CWE.(2) 2010‐11 FTE, State Funds and Estimated Student Fees include amounts for Upper Division. FTE excludes CWE.
33
34
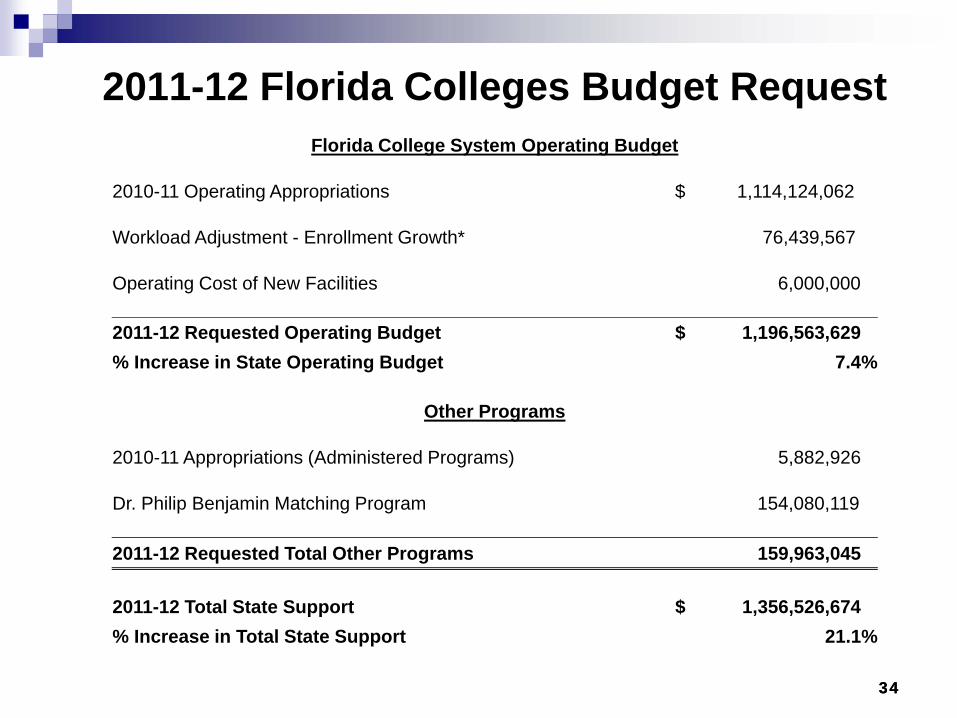
2011-12 Florida Colleges Budget RequestFlorida College System Operating Budget
2010-11 Operating Appropriations $ 1,114,124,062
Workload Adjustment - Enrollment Growth* 76,439,567
Operating Cost of New Facilities 6,000,000
2011-12 Requested Operating Budget $ 1,196,563,629 % Increase in State Operating Budget 7.4%
Other Programs
2010-11 Appropriations (Administered Programs) 5,882,926
Dr. Philip Benjamin Matching Program 154,080,119
2011-12 Requested Total Other Programs 159,963,045
2011-12 Total State Support $ 1,356,526,674 % Increase in Total State Support 21.1%
34

35
Other Education- Division of Vocational Rehabilitation- Division of Blind Services- Student Financial Assistance
Linda ChampionDeputy Commissioner, Finance and Operations
36
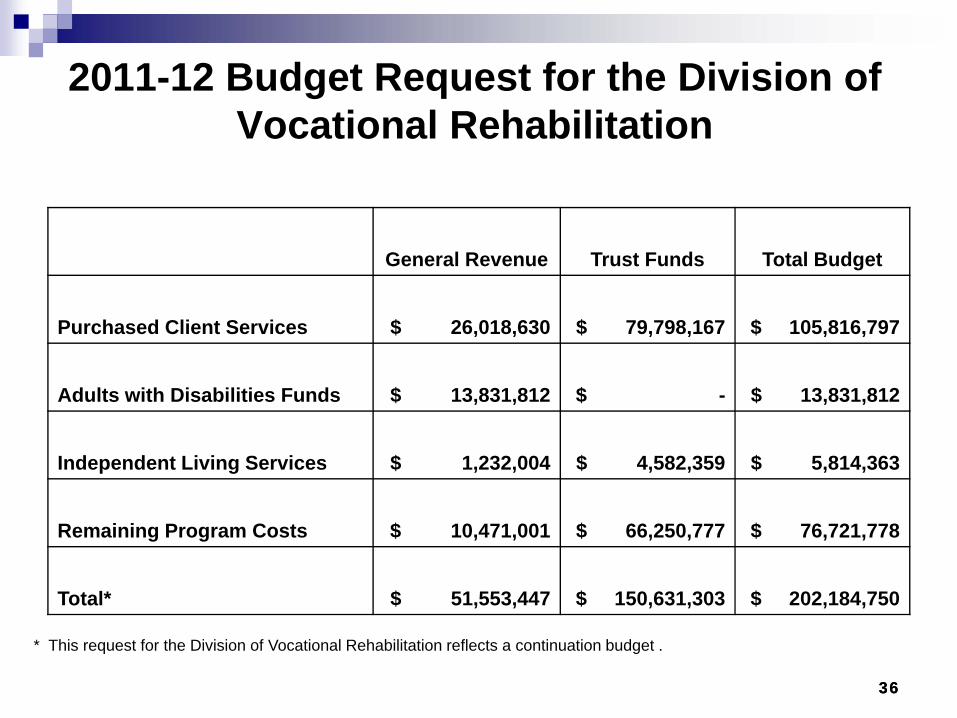
2011-12 Budget Request for the Division of Vocational Rehabilitation
General Revenue Trust Funds Total Budget
Purchased Client Services $ 26,018,630 $ 79,798,167 $ 105,816,797
Adults with Disabilities Funds $ 13,831,812 $ - $ 13,831,812
Independent Living Services $ 1,232,004 $ 4,582,359 $ 5,814,363
Remaining Program Costs $ 10,471,001 $ 66,250,777 $ 76,721,778
Total* $ 51,553,447 $ 150,631,303 $ 202,184,750
* This request for the Division of Vocational Rehabilitation reflects a continuation budget .
36
37
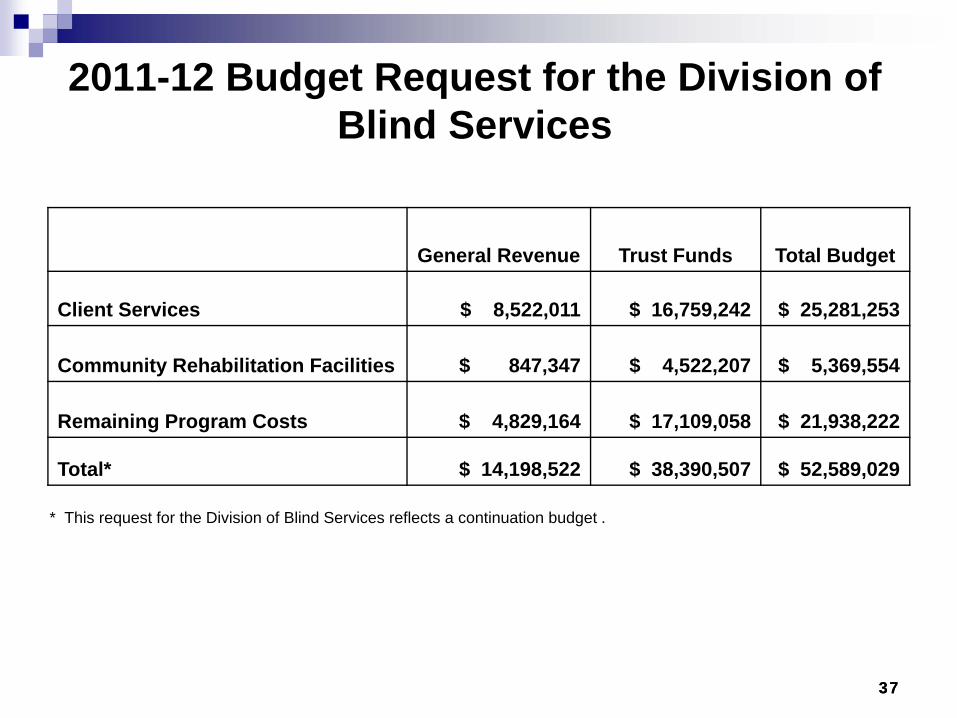
2011-12 Budget Request for the Division of Blind Services
General Revenue Trust Funds Total Budget
Client Services $ 8,522,011 $ 16,759,242 $ 25,281,253
Community Rehabilitation Facilities $ 847,347 $ 4,522,207 $ 5,369,554
Remaining Program Costs $ 4,829,164 $ 17,109,058 $ 21,938,222
Total* $ 14,198,522 $ 38,390,507 $ 52,589,029
* This request for the Division of Blind Services reflects a continuation budget .
37

38
Student Financial Assistance 2011-12 Proposed Budget for the Three Largest Programs
*Student Financial Aid Amount includes FSAG amount on following line.
2010-11 Legislative
Appropriation
2011-12SBE
RequestIncrease/
(Decrease)% Increase/ (Decrease)
Bright Futures $ 437,282,546 $ 444,505,572 $ 7,223,026 1.65%*Student Financial Aid $ 134,050,405 $ 152,886,140 $ 18,835,735 14.05%
Florida Student Assistance Grants (FSAG) $ 129,977,707 $ 148,650,964 $ 18,673,257 14.37%
Florida Resident Access Grant (FRAG) $ 83,856,500 $ 86,371,225 $ 2,514,725 3.00%

39
2011-12 Operating Budget Request
2010-11 Legislative Appropriation
2011-12 SBE Request
Increase/ (Decrease)
% Increase/ (Decrease)
Early Learning/ Prekindergarten Education $ 404,756,806 $ 458,564,948 $ 53,808,142 13.29%
K-12 $ 13,351,640,469 $ 13,569,847,015 $ 218,206,546 1.63%
Career & Adult Education $ 504,711,614 $ 501,621,010 $ (3,090,604) (0.61)%
Florida Colleges $ 1,120,006,988 $ 1,356,526,674 $ 236,519,686 21.12%
Private Colleges & Universities $ 113,986,145 $ 116,825,005 $ 2,838,860 2.49%
Student Financial Aid $ 604,624,872 $ 622,824,440 $ 18,199,568 3.01%
State Board of Education $ 215,165,013 $ 233,843,143 $ 18,678,130 8.68%
Vocational Rehabilitation $ 219,784,336 $ 202,184,750 $ (17,599,586) (8.01%)
Blind Services $ 57,465,650 $ 52,589,029 $ (4,876,621) (8.49%)
Total $ 16,592,141,893 $ 17,114,826,014 $ 522,684,121 3.15%
39

40
2011-12 K-14 Operating Budget Request
*Excludes Universities and Board of Governors40

41
2011-12 Fixed Capital Outlay
Legislative Budget Request
Linda ChampionDeputy Commissioner, Finance and Operations

42
2011-12 Public Education Capital OutlayLegislative Budget Request
K-12 CC SUS TOTAL
5-Year Appropriation
Average %32.47% 29.44% 38.09% 100%
FY 2011-12Allocation $208,304,433 $188,866,107 $244,358,357 $641,528,897
Total FY 2011-12 Request $657,600,000
Less off-the-top projects $16,071,103
42
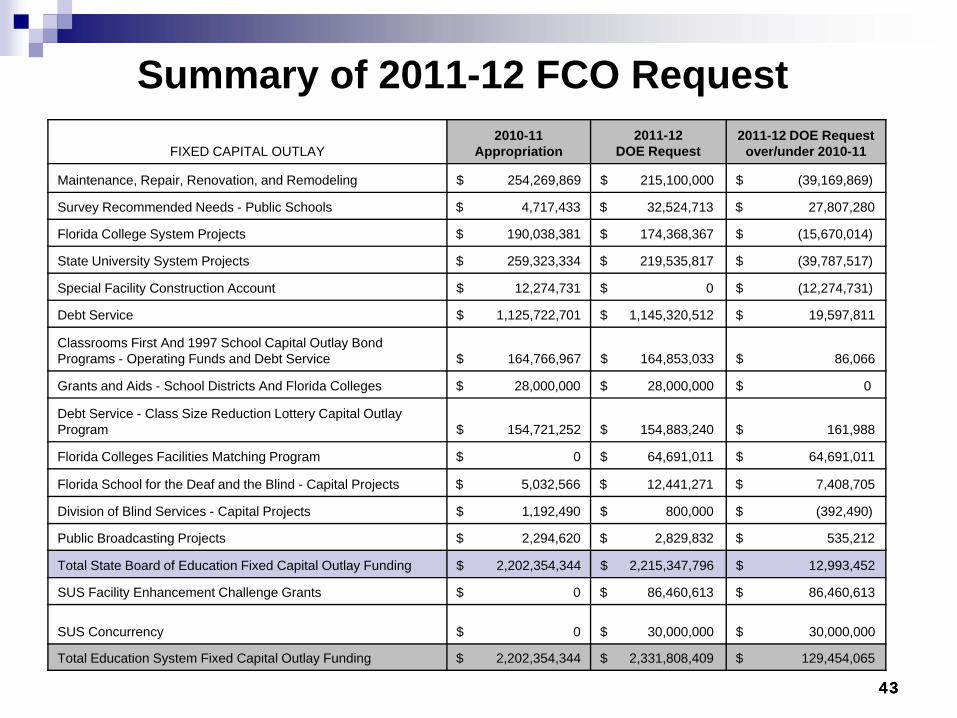
43
Summary of 2011-12 FCO RequestFIXED CAPITAL OUTLAY
2010-11 Appropriation
2011-12DOE Request
2011-12 DOE Request over/under 2010-11
Maintenance, Repair, Renovation, and Remodeling $ 254,269,869 $ 215,100,000 $ (39,169,869)
Survey Recommended Needs - Public Schools $ 4,717,433 $ 32,524,713 $ 27,807,280
Florida College System Projects $ 190,038,381 $ 174,368,367 $ (15,670,014)
State University System Projects $ 259,323,334 $ 219,535,817 $ (39,787,517)
Special Facility Construction Account $ 12,274,731 $ 0 $ (12,274,731)
Debt Service $ 1,125,722,701 $ 1,145,320,512 $ 19,597,811
Classrooms First And 1997 School Capital Outlay Bond Programs - Operating Funds and Debt Service $ 164,766,967 $ 164,853,033 $ 86,066
Grants and Aids - School Districts And Florida Colleges $ 28,000,000 $ 28,000,000 $ 0
Debt Service - Class Size Reduction Lottery Capital Outlay Program $ 154,721,252 $ 154,883,240 $ 161,988
Florida Colleges Facilities Matching Program $ 0 $ 64,691,011 $ 64,691,011
Florida School for the Deaf and the Blind - Capital Projects $ 5,032,566 $ 12,441,271 $ 7,408,705
Division of Blind Services - Capital Projects $ 1,192,490 $ 800,000 $ (392,490)
Public Broadcasting Projects $ 2,294,620 $ 2,829,832 $ 535,212
Total State Board of Education Fixed Capital Outlay Funding $ 2,202,354,344 $ 2,215,347,796 $ 12,993,452
SUS Facility Enhancement Challenge Grants $ 0 $ 86,460,613 $ 86,460,613
SUS Concurrency $ 0 $ 30,000,000 $ 30,000,000
Total Education System Fixed Capital Outlay Funding $ 2,202,354,344 $ 2,331,808,409 $ 129,454,065
43

44
2011-12 Operating and Fixed Capital Outlay Budget Request
2010-11 Legislative Appropriation
2011-12 SBE Request
Increase/ (Decrease)
% Increase/ (Decrease)
Early Learning/ Prekindergarten Education $ 404,756,806 $ 458,564,948 $ 53,808,142 13.29%
K-12 $ 13,351,640,469 $ 13,569,847,015 $ 218,206,546 1.63%
Career & Adult Education $ 504,711,614 $ 501,621,010 $ (3,090,604) (0.61%)
Florida Colleges $ 1,120,006,988 $ 1,356,526,674 $ 236,519,686 21.12%
Private Colleges & Universities $ 113,986,145 $ 116,825,005 $ 2,838,860 2.49%
Student Financial Aid $ 604,624,872 $ 622,824,440 $ 18,199,568 3.01%
State Board of Education $ 215,165,013 $ 233,843,143 $ 18,678,130 8.68%
Vocational Rehabilitation $ 219,784,336 $ 202,184,750 $ (17,599,586) (8.01%)
Blind Services $ 57,465,650 $ 52,589,029 $ (4,876,621) (8.49%)
Fixed Capital Outlay $ 2,202,354,344 $ 2,331,808,409 $ 129,454,065 5.88%
Total $ 18,794,496,237 $ 19,446,634,423 $ 652,138,186 3.47%
44
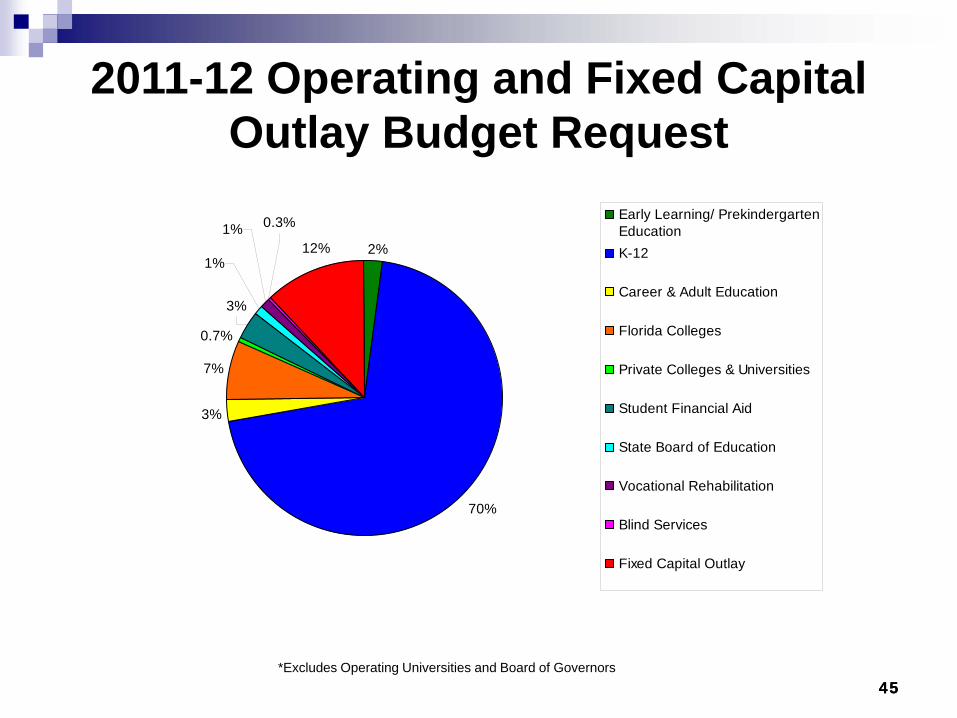
45*Excludes Operating Universities and Board of Governors
70%
3%
7%
12%
0.3%1%2%
1%
0.7%
3%
Early Learning/ PrekindergartenEducationK-12
Career & Adult Education
Florida Colleges
Private Colleges & Universities
Student Financial Aid
State Board of Education
Vocational Rehabilitation
Blind Services
Fixed Capital Outlay
2011-12 Operating and Fixed Capital Outlay Budget Request
45