Embed Size (px)
Citation preview

DRAFT dated April ‘09
DES
IGN
GU
IDEL
INES
Table of Contents
Introduction
BenefitsofTransitOrientedDevelopment DesignGuidelinesFramework
PathForward
Transit Oriented Development Design Guidelines
TransitOrientedPlaceTypes DesignGuidelinesMatrix
Florida Department of TransportationTR
ANSIT
ORIE
NTED
DEV
ELOPM
ENT
DRAFT
TheFloridaDepartmentofTransportation(FDOT),inpartnershipwiththeFloridaDepartmentof
CommunityAffairs(DCA),isdevelopingTransitOrientedDevelopment(TOD)DesignGuidelines
toprovidegeneralparametersandstrategiestolocalgovernmentsandagenciestopromoteand
implement‘transitready’developmentpatterns.Focusinglanduseandurbandesignpolicies
towardstransitwillhelptooptimizefuturetransitinvestmentsandpotentialtransitridership.
FDOTisholdingaseriesofworkshopsthroughoutthestatetovettheTODDesignGuidelineswith
localgovernments,agencies,andthepublic.Basedonthisoutreachprocess,theresultingguidelines
areintendedtoprovideguidancetolocalgovernmentsinrefiningtheirComprehensivePlansand
LandDevelopmentCodestosupportvarioustransittechnologiesandTOD.
TODsaremoderatetohighdensity,mixed-use,andwalkabledevelopmentsdesignedtofacilitate
transitandaccommodatemultiplemodesoftransportation.Forthepurposesoftheseguidelines,
TODsaredefinedgenerallyastheareaencompassingaradiusofone-fourthtoone-halfmiles
aroundatransitstation,adistancemostpedestriansarewillingtowalk.Itincorporatesfeatures
suchasinterconnectedstreetnetworks,bicycleandpedestrianfacilities,andstreet-orientedsite
design,toencouragetransitridership.Thisformofdevelopmentoptimizesuseofthetransitnetwork
andmaximizespedestrianaccessibility.SuccessfulTODprovidesamixoflandusesanddensities
thatcreateaconvenient,interestingandvibrantcommunity.
TODsareoftenplannedassinglestationareasordevelopmentsites.Howeverincreatingeffective
TODpoliciesandguidelines,itisimportanttoplanforTODwithinthecontextoftheexistingor
futuretransitsystemasawhole.Dependinguponthetransittechnologyanticipated(e.g.fixedroute
bus,busrapidtransit,lightrail,orcommuterrail),thedensityandmixtureofusesmayvaryfrom
stationareatostationarea.Thedevelopmentpatternsmayalsovaryinresponsetotransitstation
areaspacing.Forexample,ifahighfrequencylightrailsystemisbeingplannedwithmultiplestops
locatedeveryonemilealongasinglecorridor,themixtureofusesanddevelopmentintensitymay
Introduction

DRAFT
varyfromstationtostationalongthatcorridor.Thistypeofsystemwouldlenditselftoplanningfor
transitcorridorsortransitdistricts.WhereasifaTODisbeingplannedalongacommuterrailline
withstationslocatedfivetotenmilesapart,thedevelopmentpatternswithintheone-halfmileradius
ofeachstationareaarelikelytobethefocus.Regardlessofthetransitsystemplanned,these
guidelinesareintendedtoestablishsomebaselinemetricsforcreatingandevaluatingTODs,butalso
shouldbeusedwithinthecontextofplanningforalargertransitsystem.
Benefits of Transit Oriented Development
BenefitsofTODgobeyondmaximizingtransitridershippotential.TODsbydesignarepedestrian
friendly,lesslandconsumptiveandincreaseaccessibilitythroughproximity.Multipledestinationsare
oftenlocatedwithincloseproximitytooneanother,therebyaddingconvenience,timeandcostsavings.
Higherdensity/intensitydevelopmentsalsoprovidewiderhousingchoicesandoftensupporthousing
affordability.BusinesseslocatedinTODscanoptimizetheuseoflandandbuildingspacewhileat
thesametimeincreaseaccessibilitytotheirclientsandworkforce,therebyresultinginmoreefficient
operatingcosts.
Mixeduse,compactdevelopmentscreateopportunitiestolive,workandshopincloseproximityand
ultimatelypromotegreatertransportationchoices.CreatingstrongTODpatternscanjointlybenefit
boththetransportationdisadvantagedpopulationsthroughincreasingaccessibilityandthegeneral
populationthroughreducedhouseholdcostsforautoownershipandoperation.TOD’screatestrong
jobstohousingbalances,decreasedependenceonsingleoccupantautotripsandreduceparking
requirements,allresultinginreductionstoarea-widevehiclemilestraveled(VMT)whichsupports
energyconservation.Publictransitcombinedwithreducedprivateautomobileusagereducesthe
consumptionoffossilfuelsandpotentialemissionofgreenhousegases,balanceddistributionofjobs
andhousing.Theaddedconvenience,accessibility,andamenityresultingfromcloseproximitytoa
diversityofusesresultsintravelcostandtimesavingsforresidentsandemployees.Accesstotransit
andothermodesoftransportationresultsinincreasedmobility,especiallyforthetransportation
disadvantagedpopulation,andreducedhouseholdcostsforautoownershipandoperation.Transit
providesaccesstoalargeremploymentpoolresultinginhigherproductivityforbusinesses.Decreased
dependenceonprivateautomobilesreducesparkingrequirementsandenhancesdevelopment
opportunities.
DRAFT
Forlocalgovernments,TODscanserveasafundingmechanismfortransit/transportationplansand
multi-modaltransportationimprovementsbyleveragingpublic-privatepartnerships.Byoptimizing
transitridershipthroughappropriatelandusestrategies,TODsfacilitatetheimplementationoftransit,
especiallyrailtransit.TODreducestheincentiveforsprawlingdevelopmentpatternsresultinginless
landconsumptionandpreservationofnaturalresources.Publictransitcombinedwithreducedprivate
automobileusagereducestheconsumptionoffossilfuelsandemissionofgreenhousegases.
Design Guidelines Framework
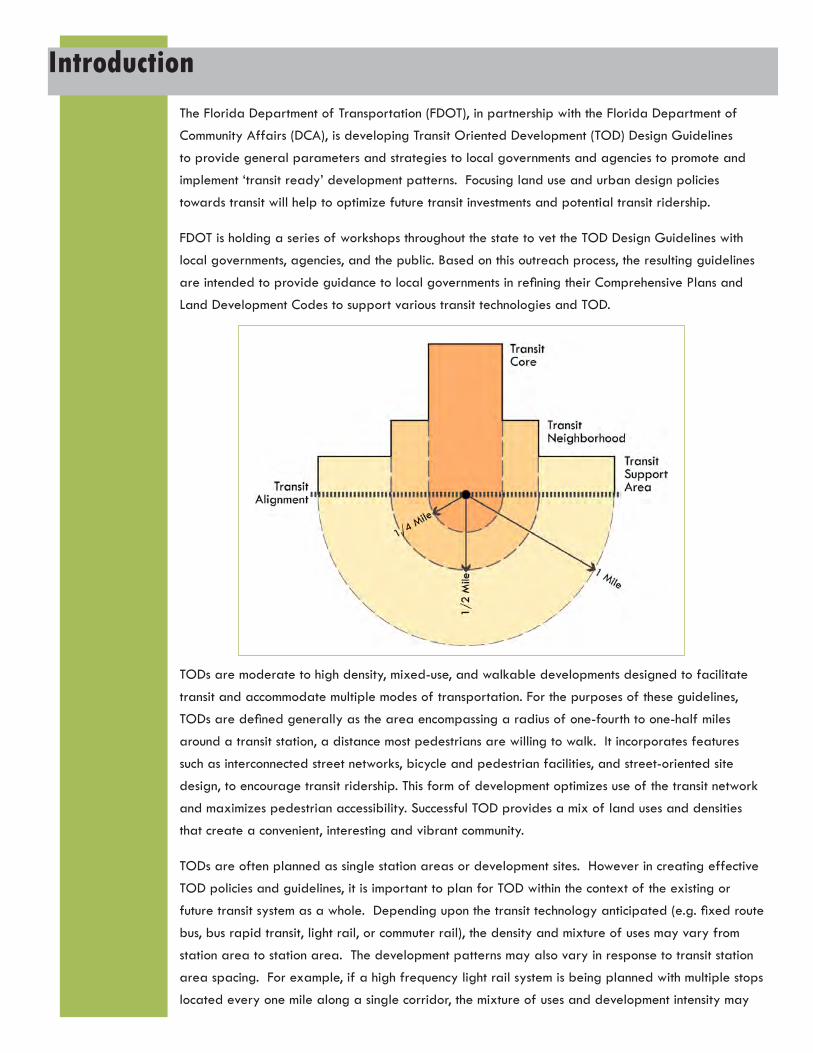
TheTODDesignGuidelinesframeworkidentifiesphysicalattributes,functionalcharacteristicsand
designcharacterwithintheone-halfandone-fourthmileradiusoftransitstations.Stationareasare
associatedwithspecificplacetypesbasedoncontextzone(locationonanurban-ruralcontinuum).
Forthepurposesofthisdraftframework,themetricsdescribedforeachzoneaddresstheminimum
intensities,densitiesandmixtureofusesmostdesirablewithineachstationarea.Whilenetdensities
areusedtodescribebuildingdevelopmentintensityrelativetothesitearea,grossdensitiesare
calculatedbasedonthetotalstationareaincludingroads,openspace,andothernon-buildableland.
Thesedensitiesandintensitiesrepresentthetargetswithintheone-fourthmileradius,howeveritisto
beexpectedthatthedensitiesarelikelytobehighestimmediatelyadjacenttothestation.

DRAFT
Theframeworkdescribesdevelopmentstandardsinstationareasaredescribedforarangeof
variablesbroadlyclassifiedintothefollowingcategories:
Intensity/Density of Use –floorarearatio,residentialdensity,buildingheight,lotcoverage,
streetfrontage
Parking–residentialparking,office/retailparking,surfaceparking,sharedparking,park
andridefacilities
Mixed Use and Diversity–hoursofsignificantactivity,jobs/housingratio,residential/non-
residentialmixofuses
Street Network –griddensity,blocksize
Development and potential ridership in station areas is measured using the following gross density
indicators:
ResidentialDensity–householdsordwellingunitsperacre
PopulationDensity–personsperacre(basedon2.49personsperhouseholdordwellingunit)
EmploymentDensity–jobsperacre(basedonFARandmixofuses)
StationAreadevelopmentstandardsandallassumptionsappliedtothestandardsaretabulatedin
theDesignGuidelinesMatrix.
Thestationareadevelopmentstandardsarealsosummarizedandillustratedbasedoncontext
zonesasranges.ThevariablescontainedwithintheseguidelinesareconsistentwiththeFederal
TransitAdministration’sstandardsforassessinglandusesthataresupportiveofmajortransitcapital
investment.Proposedtransitprojectsthatexhibitlandusecharacteristicswithintherangesdescribed
withintheseguidelineswouldreceivefavorableconsiderationfortheoveralllanduserating.
•
•
•
•
•
•
•

DRAFT
TheTODprinciplesaretobeusedasaguidetoaidlocalgovernmentsandpublicagenciesin
planningforandimplementingtransit.Theseguidelinesareintendedtobeusedinpartnership
withtheFDOTtoassistinpromotingmultimodalsystemplanningandmanagingcongestiononstate
roadways,especiallyontheStrategicIntermodalSystem(SIS).Implementationoftheprinciples
containedwithintheseguidelinescanassistlocalgovernmentstocomplywithFlorida’sGrowth
ManagementActof2005requiringthemitigationofimpactstotheSIS.
Thisdocumentprovidestheinitialframeworknecessarytofacilitatediscussionatworkshopsgeared
towardsrefiningTODguidelinesforultimateusebylocalgovernmentsandotherpublicagencies.
Basedontheinputgainedattheseworksessions,thedraftTODframeworkwillberefined,andthe
context,purposeanduseoftheguidelineswillbedefinedwithinaguidancedocumentfordistribution
andusebylocalgovernmentsandagencies.Thisfinalworkproductisintendedtoaddressthe
following:
Moredetailedbreakdownofdevelopmentcharacteristicsattheone-fourthandone-half
milescalesspecifictodifferingtransittechnologiesandexistingcommunitytypesincluding
considerationsofmixtureofuses,parking,stormwaterretentionandopenspacerequirements
Corridor-wideanddistrictwidetargetsforjobs/housingbalances,ridershippotentialand
stationspacingbasedonvaryingtransittechnologies
Implementationdiscussionaddressinguseoftheguidelinesforlocalgovernments,transit
systemplanners,sitereviewersandotherpotentialusergroups.
•
•
•

T5/T6
Sidewalk SidewalkTraffic LanesParking ParkingTurning Lane
Turning Lane
Raised Median Raised Median
LRT Traffic Lanes
Source: Visualizing Density. Julie Campoli, Alex S. MacLean
T6/T5
Gross Density Indicators
Residential Density - Dwelling Units per Acre > 35 Dwelling Units/Acre
Population Density - Persons per Acre > 85 Persons/Acre
Employment Density - Employees per Acre > 500 Jobs/Acre
Intensity/Density of Use
Minimum Floor Area Ratio (FAR) > 10.0
Minimum Net Residential Density > 55 Dwelling Units/Acre
Minimum Building Height 12 or more Stories
Minimum Lot Coverage 80%
Minimum Street Frontage 100% primary, 80% secondary
Parking
Maximum Residential Parking (Spaces per Unit) 1 space/unit
Maximum Office/Retail Parking (Spaces per 1,000 square feet)
1 spaces/1,000 sq.ft.
Maximum Surface Parking (% of Total Spaces) 10%
Shared vs. Single-Use Parking Facility Shared
Park & Ride and other considerations No
Mixed Use & Diversity
Minimum Hours of 'Significant' Activity 18 Hours
Average Jobs/Housing Ratio 10 Jobs : 1 Dwelling Unit
Mix of Uses (% Residential, % Non-Residential) 20% Residential and 80% Non-Residential
Street Network
Grid Density (Polygons per Square Mile.) - Bicycle, Pedestrian and Street Network
Min. 150
Average Block Size (in Feet) 200' x 400'

T4
Source: Visualizing Density. Julie Campoli, Alex S. MacLean
Sidewalk Mixed use Station Platform Platform Park and Ride StationRail TracksTraffic Lane Traffic LaneRaised Median
Sidewalk
T4
Gross Density Indicators
Residential Density - Dwelling Units per Acre 15 to 35 Dwelling Units/Acre
Population Density - Persons per Acre 45 to 85 Persons/Acre
Employment Density - Employees per Acre 75 to 150 Jobs/Acre
Intensity/Density of Use
Minimum Floor Area Ratio (FAR) 3.0 - 4.0
Minimum Net Residential Density 45 to 60 Dwelling Units/Acre
Minimum Building Height 4 or more Stories
Minimum Lot Coverage 70%
Minimum Street Frontage 70%
Parking
Maximum Residential Parking (Spaces per Unit) 1.5 Spaces/Unit
Maximum Office/Retail Parking (Spaces per 1,000 square feet)
2 spaces/1,000 sq.ft.
Maximum Surface Parking (% of Total Spaces) 15%
Shared vs. Single-Use Parking Facility Shared
Park & Ride and other considerations No
Mixed Use & Diversity
Minimum Hours of 'Significant' Activity 16 Hours
Average Jobs/Housing Ratio 5 Jobs : 1 Dwelling Unit
Mix of Uses (% Residential, % Non-Residential) 50% Residential and 50% Non-Residential
Street Network
Grid Density (Polygons per Square Mile.) - Bicycle, Pedestrian and Street Network
Min. 75
Average Block Size (in Feet) 200' x 600'

T3
Sidewalk SidewalkTraffic LanesParking ParkingTurning Lane
Turning Lane
Raised Median Raised Median
LRT Traffic Lanes
Source: Visualizing Density. Julie Campoli, Alex S. MacLean
T3
Gross Density Indicators
Residential Density - Dwelling Units per Acre 5 to 30 Dwelling Units/Acre
Population Density - Persons per Acre 15 to 80 Persons/Acre
Employment Density - Employees per Acre 5 to 40 Jobs/Acre
Intensity/Density of Use
Minimum Floor Area Ratio (FAR) 2.0 - 3.0
Minimum Net Residential Density 35 to 60 Dwelling Units/Acre
Minimum Building Height 3 or more Stories
Minimum Lot Coverage 80%
Minimum Street Frontage 80%
Parking
Maximum Residential Parking (Spaces per Unit) 2 Spaces/Unit
Maximum Office/Retail Parking (Spaces per 1,000 square feet)
3 spaces/1,000 sq.ft.
Maximum Surface Parking (% of Total Spaces) 20%
Shared vs. Single-Use Parking Facility Shared
Park & Ride and other considerations Yes
Mixed Use & Diversity
Minimum Hours of 'Significant' Activity 14 Hours
Average Jobs/Housing Ratio 1 Jobs : 1 Dwelling Unit
Mix of Uses (% Residential, % Non-Residential) 70% Residential and 30% Non-Residential
Street Network
Grid Density (Polygons per Square Mile.) - Bicycle, Pedestrian and Street Network
Min. 50
Average Block Size (in Feet) 200' x 800'

T2
Source: Visualizing Density. Julie Campoli, Alex S. MacLean
Sidewalk SidewalkTraffic LanesParking Parking/Bus Stop
T2
Gross Density Indicators
Residential Density - Dwelling Units per Acre 5 to 10 Dwelling Units/Acre
Population Density - Persons per Acre 10 to 25 Persons/Acre
Employment Density - Employees per Acre 2 to 5 Jobs/Acre
Intensity/Density of Use
Minimum Floor Area Ratio (FAR) .5 - 1.0
Minimum Net Residential Density 10 to 20 Dwelling Units/Acre
Minimum Building Height 1 or more Stories
Minimum Lot Coverage 50%
Minimum Street Frontage 70%
Parking
Maximum Residential Parking (Spaces per Unit) 2 Spaces/Unit
Maximum Office/Retail Parking (Spaces per 1,000 square feet)
4 spaces/1,000 sq.ft.
Maximum Surface Parking (% of Total Spaces) 40%
Shared vs. Single-Use Parking Facility N/A
Park & Ride and other considerations Yes
Mixed Use & Diversity
Minimum Hours of 'Significant' Activity N/A
Average Jobs/Housing Ratio 1 Job : 2 Dwelling Units
Mix of Uses (% Residential, % Non-Residential) 90% Residential & 10% Non-Residential
Street Network
Grid Density (Polygons per Square Mile.) - Bicycle, Pedestrian and Street Network
N/A
Average Block Size (in Feet) N/A

Transit Oriented Place Types
1 thru 9
Express Route Bus
Legend
Bus Rapid Transit
Heavy Rail Transit
High Speed Rail
Commuter Rail
Automated Fixed Guideway
Water-Bourne Ferry
Streetcar/Trolley
Light Rail Transit
Transit Modes
Special
TransectsT6, T5 T4 T3
1
5
T2
Local Bus
Fixed Route Bus
Demand Response Bus/Shuttle
Express Bus
6
3
2 4 7
Feasible under certain conditionsFeasibleDesign Guidelines Matrix Column No.
8 9


DRAFT
Design Guidelines Matrix
1 2 3 4 5 6 7 8 9
T6/T5 T6/T5 T4 T4 T3 T3 T3 T3 T2/T1 Remarks
Commuter Rail/LRT/BRT Local Bus Hub Commuter Rail/LRT/BRT Local Bus Hub LRT/BRT Commuter Rail Local Bus Hub Express Bus Express Bus See Note B
Gross Density
Residential Density - Dwelling Units per Acre
> 35 Dwelling Units/Acre 15 to 20 Dwelling Units/Acre 25 to 35 Dwelling Units/Acre 15 to 25 Dwelling Units/Acre 20 to 25 Dwelling Units/Acre 20 to 30 Dwelling Units/Acre 10 to 20 Dwelling Units/Acre 5 to 10 Dwelling Units/Acre 5 to 10 Dwelling Units/Acre See Notes A, C, F
Population Density - Persons per Acre > 85 Persons/Acre 40 to 50 Persons/Acre 65 to 85 Persons/Acre 45 to 65 Persons/Acre 45 to 70 Persons/Acre 50 to 80 Persons/Acre 25 to 50 Persons/Acre 15 to 30 Persons/Acre 10 to 25 Persons/Acre See Notes A, C, F
Employment Density - Employees per Acre
> 500 Jobs/Acre 150 to 200 Jobs/Acre 100 to 150 Jobs/Acre 75 to 100 Jobs/Acre 30 to 40 Jobs/Acre 20 to 30 Jobs/Acre 10 to 25 Jobs/Acre 2 to 5 Jobs/Acre 2 to 5 Jobs/Acre See Notes A, C, F
Intensity/Density of Use
Minimum Floor Area Ratio (FAR) > 10.0 3.0 - 4.0 3.0 - 4.0 2.0 - 3.0 2.0 - 3.0 2.0 - 3.0 1.0 - 2.0 .5 - 1.0 .5 - 1.0 See Notes A, C
Minimum Residential Density (Net) > 55 Dwelling Units/Acre 25 to 35 Dwelling Units/Acre 45 to 60 Dwelling Units/Acre 30 to 45 Dwelling Units/Acre 35 to 50 Dwelling Units/Acre 40 to 60 Dwelling Units/Acre 20 to 40 Dwelling Units/Acre 10 to 25 Dwelling Units/Acre 10 to 20 Dwelling Units/Acre See Note E, F
Minimum Building Height 12 or more Stories 4 or more Stories 4 or more Stories 3 or more Stories 3 or more Stories 3 or more Stories 2 or more Stories 2 or more Stories 1 or more Stories
Minimum Lot Coverage 80% 70% 70% 70% 80% 70% 70% 70% 50%
Minimum Street Frontage 100% primary, 80% secondary 80% 70% 70% 80% 70% 70% 70% 70% See Notes C, E
Parking
Maximum Residential Parking - Spaces per Unit
1 space/unit 1.5 Spaces/Unit 1.5 Spaces/Unit 1.5 Spaces/Unit 2 Spaces/Unit 2 Spaces/Unit 2 Spaces/Unit 2 Spaces/Unit 2 Spaces/Unit
Maximum Office/Retail Parking - Spaces per 1,000 square feet)
1 spaces/1,000 sq.ft. 2 spaces/1,000 sq.ft. 2 spaces/1,000 sq.ft. 2 spaces/1,000 sq.ft. 3 spaces/1,000 sq.ft. 3 spaces/1,000 sq.ft. 3 spaces/1,000 sq.ft. 3 spaces/1,000 sq.ft. 4 spaces/1,000 sq.ft.
Maximum Surface Parking - % of Total Spaces
10% 15% 15% 15% 20% 25% 30% 30% 40%
Shared vs. Single-Use Parking Facility Shared Shared Shared Shared Shared Shared Shared Shared N/A
Park & Ride and other considerations No No No No Yes Yes Yes Yes Yes
Mixed Use & Diversity
Minimum Hours of 'Significant' Activity 18 Hours 16 Hours 16 Hours 14 Hours 14 Hours 14 Hours 12 Hours N/A N/A
Average Jobs/Housing Ratio 15 Jobs : 1 Dwelling Unit 10 Jobs : 1 Dwelling Unit 5 Jobs : 1 Dwelling Unit 4 Jobs : 1 Dwelling Unit 1.5 Jobs : 1 Dwelling Unit 1 Jobs : 1 Dwelling Unit 1 Jobs : 1 Dwelling Unit 1 Job : 2 Dwelling Units 1 Job : 2 Dwelling Units
Mix of Uses - % Residential (Res) and % Non-Residential (Non-Res)
20% Res and 80% Non-Res 30% Res and 70% Non-Res 50% Res and 50% Non-Res 50% Res and 50% Non-Res 70% Res and 30% Non-Res 80% Res and 20% Non-Res 80% Res and 20% Non-Res 90% Res and 10% Non-Res 90% Res and 10% Non-Res See Notes C, D
Street Network
Grid Density - Polygons per Square Mile for Bike, Ped and Street
Min. 150 Min. 150 Min. 75 Min. 75 Min. 50 Min. 50 Min. 50 Min. 50 N/A
Average Block Size (in Feet) 200' x 400' 200' x 400' 200' x 600' 200' x 600' 200' x 800' 200' x 800' 200' x 800' 200' x 800' N/A
F. The variables listed under Intensity/Density of Use are minimum net development/design standards that project the anticipated development potential of a transit oriented development site based on it's context. The net development standards will require calibration to existing intensity/density, land availability (vacant or redevelopment), public infrastructure/open spaces, location within station areas, etc. The target gross density indicators guide the degree and direction of calibration.
D. The residential/non-residential mix is managed by transects to reflect preferences about living and working, but the general assumption is that residential uses are higher in suburban and rural areas compared to the urban core and urban general transects, which are more employment centric. The mix of uses could vary by approximately 15% based on the location of the development relative to the transit station and/or hub.
E. In the urban core and urban general transects, each dwelling unit is assumed to be 1,500 sq.ft. and each job is assigned 350 sq.ft. (average of retail and office employment). In suburban transects, each dwelling unit is assumed to be 1,800 sq.ft. and each job is assigned 500 sq.ft. (average of retail and office employment). In rural transects, each dwelling unit is assumed to be 2,000 sq.ft. and each job is assigned 500 sq.ft. (average of retail and office employment).
Assumptions and Notes:
A. The guidelines provides policy guidance (gross densities, development/design standards) for transit oriented development sites located within an approximately1/2 mile radius around a transit station or 1/4 mile around a local bus hub . The target density and intensity of specific developments could vary based on the size and location of the developments within the station area. This variation in density/intensity as well as design standards for streets and other public spaces should be addressed through a station area plan/overlay.
B. The development potential around Commuter Rail, Light Rail and Bus Rapid Transit stations are similar since the station spacing and service levels are within a comparable range. Commuter Rail and Commuter Bus have distinctly different transit service characteristics and development impact in station areas. Local or Fixed Route Bus is assumed to be supportive of transit oriented development at a transfer station or local bus hub consisting of a minimum of 3 routes and 30 minute headways, i.e. level of service D per the Transit Capacity and Quality of Service Manual. In suburban areas, the development around Commuter Rail is assumed to be rich in residential uses.
C. Intensity (FAR), net residential density, mix of uses (% residential / % non-residential) and lot coverage are variables used to calculate the gross density indicators (residential, employment, and population). The gross density indicators are adjusted for land development capacity (vacant, redevelopment, and not available for development or redevelopment) and public infrastructure/open space requirements. Gross population density assumes 2.49 persons per dwelling based on Florida Census data.