Embed Size (px)
Citation preview

FINAL REPORT
Flood Risk and Uncertainty: Assessing National Weather Service Flood Forecast and Warning Tools
Prepared by: Nurture Nature Center and
RMC Research Corporation, 2015
forNOAA Office of Weather and Air Quality

TABLE OF CONTENTS
ACKNOWLEDGMENTS
EXECUTIVE SUMMARY
INTRODUCTION
METHODOLOGY
Focus Group Process
Characteristics of Easton and Lambertville
FINDINGS
Interpreting Results
Pre-Survey Findings: Characteristics of the Participants and Their Flooding Experience
Demographics
Previous Flood Experience and Responses
Information Sources Consulted
Typical Actions in the Face of Impending Storm
Detailed Findings and Analysis about NWS Products
Cone
Inundation Map
MARFC Quantitative Precipitation Forecast (QPF)
Advanced Hydrologic Prediction Services (AHPS) Hydrograph
Significant River Flood Outlook (SFO)
Watches and Warnings
Meteorological Model Ensemble Forecast System
Post Survey Findings:
Preferences for Information Delivery
Other Important Content
Participant Barriers to Using National Weather Service Forecast and Warning Tools
Quality of the Focus Group Experience
DISCUSSION
CONCLUSION
Transition to Operations
Limitations and Future Research
APPENDICES
About the Research Methods
Surveys Administered During Study
Works Cited
Representative Summary of Presentations
FLOOD RISK AND UNCERTAINTY REPORT, NATIONAL WEATHER SERVICE
i Nurture Nature Center /RMC Research Corporation, 2015
iv
1
2
3
3
4
5
5
5
5
6
6
6
7
7
8
9
10
12
13
15
19
19
19
20
20
21
23
23
23
24
24
25
33
34

ii Nurture Nature Center /RMC Research Corporation, 2015
FLOOD RISK AND UNCERTAINTY REPORT, NATIONAL WEATHER SERVICE
LIST OF FIGURES, TABLES AND GRAPHICS
FIGURES
Figure 1. Map of Region
Figure 2. Demographic Characteristics of Participants
Figure 3. Locality Demographics of Participants
Figure 4. Preferences in Information Delivery
TABLES
Table 1. Top Ten Highest Historical Crests: Delaware River at Easton — 1903-2011
Table 2. Top Ten Highest Historical Crests: Delaware River at New Hope — 1903-2011
GRAPHICS
Graphic 1. Day T-3 Hurricane Rachel Cone Graphic
Graphic 2. Inundation Map Graphic
Graphic 3. Current Quantitative Precipitation Forecast Graphic
Graphic 4. Revised Quantitative Precipitation Forecast Graphic
Graphic 5. Current Advanced Hydrologic Prediction Services (AHPS) Hydrograph
Graphic 6. Revised Advanced Hydrologic Prediction Services (AHPS) Hydrograph
Graphic 7. Current Significant River Flood Outlook
Graphic 8. Revised Significant River Flood Outlook
Graphic 9. Current Flood Watch
Graphic 10. Revised Flood Watch
Graphic 11. Current Flash Flood Warning
Graphic 12. Revised Flash Flood Warning
Graphic 13. Revised Flood Warning
Graphic 14. Current MMEFS Dot and Line Graph
Graphic 15. Current MMEFS Spaghetti Graph
Graphic 16. Revised MMEFS Spaghetti Graph
Graphic 17. Current MMEFS Bar and Whiskers Graph
Graphic 18. Revised MMEFS Bar and Whiskers Graph (1)
Graphic 19. Revised MMEFS Bar and Whiskers Graph (2)
4
4
4
19
5
6
556667789
10
12
13
15
19
19
19
20
20
21
23

LIST OF ACRONYMS USED IN THIS REPORT
AHPS Advanced Hydrologic Prediction Services
CoCoRAHS Community Collaborative Rain, Hail & Snow Network
GEFS Global Ensemble Forecast System
HEFS Hydrologic Ensemble Forecast System
MARFC Middle Atlantic River Forecast Center
MMEFS Meteorological Model Ensemble River Forecasts
NAEFS North American Ensemble Forecast System
NOAA National Oceanic and Atmospheric Administration
NNC Nurture Nature Center
NWS National Weather Service
QPF Quantitative Precipitation Forecast
SFO Significant River Flood Outlook
WFO Weather Forecast Office
iii Nurture Nature Center /RMC Research Corporation, 2015
FLOOD RISK AND UNCERTAINTY REPORT, NATIONAL WEATHER SERVICE

ACKNOWLEDGMENTS
The authors would like to thank the National Weather Service offices and staff who helped implement this project. Specifically, for their help in drafting the scenario for the project, reviewing proposed revisions for technical accuracy, and disseminating findings to professional audiences, a sincere thank you to: Peter Ahnert, Hydrologist in Charge, and Patricia Wnek, Service Coordination Hydrologist, of the NWS Middle Atlantic River Forecast Center; Gary Szatkowski, Meteorologist in Charge, and Raymond Kruzdlo, Meteorologist, of the Mt. Holly, NJ/Philadelphia, PA Weather Forecast Office; and David Nicosia, Warning Coordination Meteorologist, and Erik Heden, Meteorologist, of the Binghamton, NY Weather Forecast Office.
This report was prepared by NNC under award number NA12OAR4590115 from NOAA, U.S. Dept. of Commerce. The statements, findings, conclusions and recommendations are those of the authors and do not necessarily reflect the view of NOAA or the U.S. Dept. of Commerce.
This project was directed by Nurture Nature Center, Inc., and research was led by co-Principal Investigators Rachel Hogan Carr, Executive Director of Nurture Nature Center and Dr. Burrell Montz of East Carolina University. The project team also included RMC Research Corporation.
iv Nurture Nature Center /RMC Research Corporation, 2015
FLOOD RISK AND UNCERTAINTY REPORT, NATIONAL WEATHER SERVICE

1 Nurture Nature Center /RMC Research Corporation, 2015
FLOOD RISK AND UNCERTAINTY REPORT, NATIONAL WEATHER SERVICE
EXECUTIVE SUMMARY
Nurture Nature Center’s research team conducted a series of focus groups and surveys designed to elicit feedback from river community residents about the ways in which they understand and use products from the NWS’s suite of flood forecast and warning tools. Participants from two flood-prone towns in the Delaware River Basin were ex-posed to a hurricane scenario that resulted in extreme, but historically recorded, flood levels for the area. Through this scenario, participants studied a series of NWS flood forecast products, and gave feedback about how the timing, clarity, graphic elements and inclusion of uncertainty information affected their understandings and anticipated responses.
Key findings about residents’ use of NWS products include:
• Residents of flood-prone river valleys use NWS forecast and warning tools as part of a suite of resources that also includes personal and community connections, experience, and local stories. They rely on elements of the suite differently as extreme weather and river flooding events emerge.
• Residents in both communities reported that a major barrier to their use of NWS forecast and warning tools is the overly technical nature of the products and the use of unfamiliar terms and unclear or inadequate explanations of visual data. Products that are completely text, such as watches and warnings, were found to be excessively wordy, with key information often buried. Some reported that use of all capital letters was burdensome to read.
• Residents rely heavily on the hydrograph, which shows observed and forecast river levels, for determining personal and community risk. In discussions, residents frequently relied on hydrograph river forecasts to deter-mine when to take protective actions.
• Visual factors in products - including the use of color, patterning and font - affected participants’ understanding of products in both helpful and unhelpful ways, and must be carefully considered.
• Increasing the level of geographic specificity in flood forecast products appeared to improve participants’ understanding of and response to products.
• Respondents preferred that products contain a combina-tion of graphic and text information, citing the need for
both quick visual identification of risk, along with more detailed explanations and specificity from the text.
• The Internet was by far the most heavily used source for flooding information, followed by TV and radio; to a lesser extent, Facebook and smartphone apps are accessed for flooding information.
• Respondents sought information about impending storms more than they sought information about prepar-ing for storms.
• More than any other action, residents identified a) dis-cussing information about storms with friends and family and b) seeking more information as they begin to take action during flood events.
Visual and text improvements made to NWS forecast and warning tools, made by the research team in response to user comments, appear to have increased the value of those tools for participants in the focus groups. A series of specific recommendations related to these changes are contained herein.
A number of procedural findings about the research process itself are also noted:
• Focusing discussion on recommendations for improve-ment, rather than on liking or not liking products or tools, appears to be an effective approach to developing user-friendly and useful river flood forecast and warning tools.
• The focus group process carried out in this project, including the use of a scenario and group discus-sion about the use of forecast and warning tools, is an effective communications and engagement strategy and merits consideration as a model for NWS outreach and education for lay audiences as well as professional audiences (Integrated Warning Teams, for example).
Future research suggestions include: replicating this research model in other geographic regions; studying how the public uses and would improve NWS delivery mecha-nisms (i.e., website, emergency briefings); evaluating how dissemination of these products via social media influences public use of the products; and examining the way that broadcast meteorologists use and share information with the public about riverine and coastal flood forecast tools.

2 Nurture Nature Center /RMC Research Corporation, 2015
FLOOD RISK AND UNCERTAINTY REPORT, NATIONAL WEATHER SERVICE
INTRODUCTION
Advances in science and technology have dramatically increased the scope, precision, and timeliness of forecasts and warnings for weather emergencies and hazards, including floods. Robust warning systems for weather hazards can significantly reduce loss of life and property—when they are heeded.
Through “Flood Risk and Uncertainty: Assessing National Weather Service Flood Forecast and Warning Tools,”
Nurture Nature Center (NNC), a non-profit organization in Easton, Pennsylvania, is addressing a fundamental challenge related to the forecasting of floods. Although the National Weather Service (NWS) issues a state-of-the-art and comprehensive suite of flood forecast and warn-ing products about imminent severe weather events, public audiences often still fail to evacuate or take other protective actions during acute events.
The social science research community has worked over time to identify factors that motivate citizens to protect themselves in the face of weather emergencies. Those factors include the reputation of the informant (Mileti and Sorenson, 1990); age, gender, and other demographic characteristics (Mileti and Sorenson,1990), socio-economic status (Phillips and Morrow, 2007; Zahran et al., 2008),
prior experience with similar weather (Leik et al., 1980); perception and actual risk (Drobot et al., 2007; Ruincet al., 2007); available options (Haynes et al., 2009); and, critically, how the message is framed and conveyed (Mileti and Sorenson, 1990).
NNC is contributing to and applying findings from this body of research in its 2012 – 2013 study of the ways that public audiences use the current suite of NWS flood forecast and warning tools to make decisions about their flood risk and, importantly, their response to impending floods. This study was designed to produce practical recommendations about ways NWS can modify its products to improve public response to flood forecasts, and also to advance social science understandings of what motivates the public to respond to flood warnings. The National Oceanic and Atmospheric Administration (NOAA), which funded this study, has identified the need for a social science understanding of its forecast technology. In its
2011 strategic plan for developing a “Weather-Ready Nation,” the National Weather Service noted:
We must go beyond the production of accurate forecasts and timely warnings and build in improved understanding and anticipation of the likely human and economic impacts of such events. We must enable our users to better exploit NWS information to plan and take preventive actions.
This Flood Risk and Uncertainty research project was one of four two-year projects funded by NOAA in 2012 to study decision-making during extreme weather events. These projects were awarded by the Office of Weather and Air Quality in the NOAA Office of Oceanic and Atmospheric Research with funding from the U.S. Weather Research Program and the NWS. The project was directed by co-Principal Investigators Rachel Hogan Carr, NNC Executive Director, and Dr. Burrell Montz, Professor and Chair of the Department of Geography, Planning and Environment at East Carolina University and a noted hazards researcher. NWS partnering offices and staff included: Middle Atlantic River Forecast Center, Peter Ahnert (Hydrologist-in-Charge) and Patricia Wnek, Service Coordination Hydrologist; Mt. Holly, NJ/Phila-delphia, PA Weather Forecast Office, Gary Szatkowski, Meteorologist-in-Charge and Raymond Kruzdlo, meteo-rologist; and Binghamton, NY Weather Forecast Office, David Nicosia, Warning Coordination Meteorologist and Meteorologist Erik Heden.
This report explains the methodology, results and deliver-ables for this project. The report contains general findings as well as specific recommendations to NWS about ways to improve flood forecast and warning products so that they are more easily understood by public audiences, and so that they better motivate people to take appropriate protective actions.

METHODOLOGY
The National Weather Service (NWS) issues numerous flood forecast and warning products when extreme weather events are forecast. This study sought to identify how focus group participants understand and use current NWS prod-ucts and how products might be revised so that they are a) easier to understand and b) more likely to motivate people to take appropriate actions in response to forecasts.
The project aimed to advance social science knowledge of how people seek out, understand, use, respond to and share information about flood risk during acute flood events. The project tested a set of NWS products to understand how participants access and understand the products, what kinds of actions were prompted by the products, and how participants would adapt the products to make them more “user friendly.” Specifically, the project tested the following NWS products: Flood Watches and Warnings (including Flash Flood); the Advanced Hydrologic Prediction Service (specifically, the hydrograph and flood inundation maps); Quantitative Precipitation Forecasts (QPFs) as presented by the regional Middle Atlantic River Forecast Center (MARFC); Significant River Flood Outlook; and Meteorological Model Ensemble River Forecasts.
The research team selected Easton, PA and Lambertville, NJ as representative of both urban and rural flood-prone communities in the Delaware River Basin, and contracted with RMC Research Corporation to evaluate the focus group process and analyze the findings with the aim of making recommendations to the NWS on selected river flood warnings and products.
Working with NWS staff from the MARFC and Weather Forecast Offices (WFOs) listed above, the research team developed a seven-day scenario of a hurricane approach-ing the Delaware River Basin. Scenario planning is a commonly used social science, educational and decision-making tool, first associated with the work of Herman Kahn in the 1960s (Kahn, 1962). By positing a hypothetical yet plausible emerging event, scenarios prompt participants to articulate, and reflect on, a possible future outside of the immediate context (i.e., not tethered to the here and now). The scenario described a hurricane approaching the Delaware River Basin. Although Hurricane “Rachel” was hypothetical, it was based on the flood of record (Diane, in 1955) in the area.
Focus Group Process
Two focus groups were held in both Easton and Lambert-ville in June 2013 (Round One) and again in December 2013 (Round Two). In each of the focus groups, Dr. Montz presented the hurricane scenario day by day (T-7, etc.), presenting mock-ups of weather forecast and warning products typically available from the NWS (and, by extension, news media and emergency personnel) in the days leading up to a hurricane’s landfall, and facilitated a group discussion. Participants were asked to interpret the message they thought each NWS product conveyed, discuss the circumstances under which they saw each as useful or potentially useful, and make recommendations for improving the products.
Participants made observations about the timing of the products, use of graphics and text, how they access prod-ucts, and also about the ways they share information about flood events and products with friends, family and neighbors. Improvements were offered in the context of motivating residents to respond appropriately to flood forecasts and warnings. Participants received modest compensation and were asked to complete both pre- and post-session surveys. Focus group sessions were audio-recorded with participants’ agreement.
Findings from the Round One surveys (n=56) and focus group discussions informed the redesigns of selected NWS Flood Forecast and Warning tools (seven of nine tools presented). Based on participants’ concerns, the research team, including NNC Art Director Keri Maxfield, identified a series of strategic changes to the use of layout, color, and text in the products. Using the research team’s findings and visual design principles for risk communication, Maxfield led a redesign of a series of revised mocked-up products for re-testing in Round Two. NWS partners were consulted during this process to ensure changes did not interfere with technical accuracy. The research team attempted to pro-pose changes that were within the apparent and reasonable capacity of NWS to implement.
Slides of these revised products were then used in the Round Two focus groups (n=48) with the same hurricane scenario that was presented to Round One participants. Based on feedback provided by the second round of focus group participants, the research team made further refine-
3 Nurture Nature Center /RMC Research Corporation, 2015
FLOOD RISK AND UNCERTAINTY REPORT, NATIONAL WEATHER SERVICE

ments to the designs. All participants were contacted via email to participate in an online survey to respond to this third iteration of product redesign. Twenty-four participants completed the online survey.
Survey data were analyzed using SPSS and Qualtrics soft-ware; open-ended survey responses were hand-coded; a content analysis of the focus group discourse was con-ducted using NVivo software.
Characteristics of Easton and Lambertville Study sites were Easton, PA and Lambertville, NJ (Figure 1). Both communities have extensive flood histories with the Delaware River and local streams (see Tables 1 and 2).
Easton, PA. With a population of nearly 27,000 in 2010 (U.S. Census), Easton is located at the confluence of the Delaware and Lehigh Rivers. Before its settlement by Euro-peans in 1739, it was home to the native Lenape people. It was an important military center during the American Revolutionary War and was a major transportation hub for the coal, iron, and steel industries until the 1950s. Downtown Easton is particularly flood prone; it is a low-lying area surrounded by hills to the north, west, and south. North of downtown is College Hill, a neighborhood on hills and the home of Lafayette College. The estimated median household income in 2012 was just over $37,000 (City-data.com), compared with the State household me-dian of $51,230.
Lambertville, NJ. Thirty miles downriver from Easton, Lambertville is smaller than Easton and was settled later. Together with New Hope, Pennsylvania, which is located directly across the Delaware River, Lambertville comprises just under 3,800 residents. The towns were known as “Coryell’s Ferry,” a major crossing point between New York City and Philadelphia. Lambertville, incorporated in 1849, became a factory town following the opening of the Delaware and Raritan Canal in 1834, and then declined with the advent of motorized transport in the early 20th century. The Delaware and Raritan Canal flows through the western half of Lambertville parallel to the Delaware River. A tourist destination today, Lambertville’s median household income was just under $75,000 in 2012 (City-data.com), compared with the State household average of $69,667 in 2012. Tables 1 and 2 list the dates and crest heights of the ten greatest floods between 1903 and 2011.*
Top Ten Highest Historical Crests: Delaware River at Easton — 1903-2011
TABLE 1 Highest Historical Crests: Easton
DATE OF FLOOD CREST (FT.)
8/19/1955
10/10/1903
4/4/2005
6/29/2006
9/19/2004
3/19/1936
1/20/1996
9/9/2011
3/12/2011
8/29/2011
43.70
38.10
37.20
37.09
33.35
32.80
30.65
29.23
26.12
25.15
Top Ten Highest Historical Crests: Delaware River at New Hope — 1903-2011
TABLE 2 Highest Historical Crests: New Hope
DATE OF FLOOD CREST (FT.)
8/20/1955
10/10/1903
4/4/2005
6/29/2006
3/19/1936
9/8/2011
1/20/1996
5/24/1942
5/30/1984
3/12/2011
24.27
21.80
19.60
19.08
18.00
16.14
15.34
14.23
13.21
13.07
*New Hope data applies to Lambertville, NJ.
PENNSYLANIA NEW JERSEYLambertville, NJ
Easton, PA
4 Nurture Nature Center /RMC Research Corporation, 2015
FLOOD RISK AND UNCERTAINTY REPORT, NATIONAL WEATHER SERVICE
FIGURE 1 Map of Region

FINDINGS
Interpreting Results
While some differences are evident between respondents in the focus groups in Easton and Lambertville, they appear largely associated with economic rather than rural or urban status. Previous research has identified how factors, including education and income, affect the vulner-ability of populations, by increasing the likelihood of pre-paredness, and by improving or decreasing a population’s access to and understanding of information (Fothergill and Peek, 2004; Cutter et al, 2003). Survey responses by the Lambertville and Easton participants reflected these findings; except for more proactive behavior by Lambertville residents, the researchers found the two communities more similar than different. Both groups of respondents were long-time residents of the area, living on floodplains in roughly equal numbers, expressing similar motivations for participating (knowledge, experi-ence, assistance), turning to similar information sources (the Internet), preferring information delivered by both text and graphics, and expressing similar confusions and criticisms of the NWS products under discussion. Participants in both groups expressed similar bafflements when confronted with some NWS products; they also shared preferences for specific NWS products such as the hurricane cone and Advanced Hydrologic Prediction Ser-vice (AHPS) hydrograph. In post-surveys, all respondents stated that they were likely to share what they had learned and seek NWS information in the future.
For these reasons, the researchers have chosen to analyze the data by treating respondents as a whole (n=98), attend-ing to differences between Rounds One and Two in the discussion of NWS product revisions.
Pre-Focus Group Survey Findings: Characteristics of the Participants and Flooding Experience
Pre-focus group surveys collected demographic data and data on length of time in the community, flood experience, perceived risk of flooding, information sources for learning about hazardous weather, and typical actions taken during past floods. It must be noted that not all respondents answered all questions, so totals do not necessarily add up to 98. (See Appendix B).
Demographics
Respondents in the Easton focus groups tended to be young-er and less well educated than Lambertville respondents. Respondents from both communities were roughly half male and half female; strong majorities (85%) in both groups had lived in their local community and along the Delaware River more than six years. More than half of the respondents identified as living on a floodplain. See Figures 2 and 3.
FIGURE 2 Demographic Characteristics of Participants
Percent of Participants by Age Group
Percent of Participants by Gender
Easton Lambertville Total
20-29 30-39 40-49 50-59 60-69 70+
otal TEaston Lambertville
60
50
40
30
20
10
0
Male
Female
50
40
30
20
10
0
Easton Lambertville Total
HS/GED AA or BA or Post 2-yr college 4-yr college Graduate
Percent of Participants by Education
5 Nurture Nature Center /RMC Research Corporation, 2015
FLOOD RISK AND UNCERTAINTY REPORT, NATIONAL WEATHER SERVICE
30
25
20
15
10
5
0

FIGURE 3 Locality Demographics of Participants
Years in Delaware River Basin (% of participants)
Years in Community (% of participants)
Percent Living in Floodplain
100908070605040302010
0
Less than 6 6 or more
100908070605040302010
0
Less than 6 6 or more
60
50
40
30
20
10
0
Easton Lambertville Total
Yes No Don’t Know
Previous Flood Experience and Responses Nearly two-thirds (64%) of respondents perceived their current risk of flooding as somewhat or extremely high. Most (76%) had previously experienced floods, more than half (56%) within the last five years. Of those who had experienced flooding, 85% of respondents indicated they had responded to official warnings.
Asked to describe preparations they had made in re-
sponse to flooding forecasts, respondents named more than one action. More than half (52%) said they had secured household items, including moving objects to higher floors. Two in five (39%) said they made plans or had taken action to stay in place during the storm, such as gathering supplies and ensuring generators were in order and electronic devices fully charged. Only 15% said they evacuated or planned to evacuate during the storm. Choosing from a list of options, nearly all (87%) discussed information about impending weather with friends and relatives and most (81%) sought more information. Almost three-quarters (72%) gathered supplies and one third (33%) contacted local officials.
Just under one third (32%) said they monitored events through media closely and a small number (7%) watched the weather, the river, or used known indicators such as sticks or building markers to gauge the speed and extent of rising waters.
Information Sources Consulted In seeking information about impending hazardous weather, most respondents (85%) turned to the Internet and nearly two-thirds (65%) used television. Fewer than half (44%) used radio. Smartphone and Facebook were mentioned by about a third of respondents (36% and 32%, respectively), although many noted that smartphones were often the only means of information when power was out. Twitter received very little mention.
Information about impending storms appeared more valuable to respondents than information about how to prepare for hazardous weather. Less than two-fifths (38%) cited television as a source of information for how to prepare; radio, smartphones, and Facebook were named by less than a quarter of respondents (24%, 20%, 15% respectively), and Twitter again had minimal mention.
Typical Actions in the Face of Impending StormsRespondents also indicated which, in a list of four steps, they typically do with information about storms and flooding: • 87% of respondents indicated they discussed the
information with friends and family, • 81% sought further information, • 72% gathered supplies, and • 33% contacted officials.
As data above confirm, a preponderance of focus group respondents were most inclined to gather supplies and “shelter in place.”
6 Nurture Nature Center /RMC Research Corporation, 2015
FLOOD RISK AND UNCERTAINTY REPORT, NATIONAL WEATHER SERVICE
Easton Lambertville
Easton Lambertville
To
To
ta
ta
l
l

Detailed Findings and Analysis about NWS Products
One of the primary objectives of this research study is to provide NWS with strategies for revising current forecast products so that they are more easily understood by public audiences, and more likely to motivate individuals to take protective actions. The following section provides a detailed overview of the feedback participants gave about each of the nine products included in the focus group scenario. This section also describes the graphic and text changes that were made to each product.
Products were introduced over the course of the scenario presentation in the following order:
• National Hurricane Center Cone (Cone);
• Significant River Flood Outlook (SFO);
• MARFC Quantitative Precipitation Forecast (QPF);
• Advanced Hydrologic Prediction Services Hydrograph
(AHPS);
• Weather Forecast Office Flood Watch (WFO Watch);
• WFO Flood Warning (Flood Warning);
• Advanced Hydrologic Prediction Services Flood
Inundation Map (Map);
• WFO Flash Flood Warning (FF Warning); and
• Meteorological Model Ensemble River Forecasts (MMEFS).
These NWS products underwent revisions based on survey responses and participant dialogue in Round One, with the exception of the hurricane cone, which has been previously studied, and the flood inundation map, which presented technical challenges to the revision and is primarily a planning rather than a forecast tool. Therefore, in both survey and discussions, Round One participants were responding to existing versions of these products, and Round Two participants were responding to revised graphic and text treatments implemented by the research team. Revised graphics as shown here are final products, reflecting feedback from both focus groups and all surveys, and include minor changes from Round Two graphics.
Overall observations: In both the Round One and Round Two groups, participants taking the post-survey were asked to rank the nine products in order of usefulness in learning about and preparing for flooding events, with 1 being the most the most useful and 9 being least useful. All respondents ranked the National Hurricane Center’s cone and the AHPS hydrograph most highly, either first
or second highest, in usefulness to them. The Flood and Flash Flood Warnings followed in the rankings. These four products were familiar to respondents and were generally trusted, which may have contributed to their consistently high rankings. Among products that were revised, respon-dents’ perceptions of the SFO, QPF and MMEFS products’ utility rose substantially between Rounds One and Two. In focus group discussions, initial (Round One) discussion of NWS products focused strongly on issues of intelligibil-ity, while Round Two discussions of revised products were richer and suggestions were better informed by knowledge and were often more specific. For example, while the initial MMEFS elicited some amusement and strong confusion, the revised products evoked more pointed discussions of the value of uncertainty metrics; in other instances, once products were easier to understand, participants wanted even more information.
In addition to ranking each product, respondents were also asked to offer an explanation for their rankings. Not all respondents offered explanations for each product ranking. The comments below reflect both respondent survey explanations and comments made by participants during the focus group presentations and recorded by researchers. T-7, T-5, etc. refer to days preceding the hurricane’s predicted landfall (T).
7 Nurture Nature Center /RMC Research Corporation, 2015
FLOOD RISK AND UNCERTAINTY REPORT, NATIONAL WEATHER SERVICE
Cone
The National Hurricane Cone (Graphic 1) was not selected for redesign. It is well-known and its efficacy has been tested in other studies. That said, during the presentation, participant interest in using the Cone peaked on days T-5 and T-3. Before T-5, the Cone appeared to have people’s peripheral attention but most said they were not yet concerned. By T-3, attention was riveted, while by T-2, although there was some interest in using the Cone to predict wind and some comfort in its familiarity, many said they were no longer looking at it. By T-1, participants said they certainly were not looking at the Cone—they were taking action instead. This held true for both rounds of focus groups and both communities. Focus group participants made some suggestions about the cone con-cerning more frequent updates and connections to local (Delaware River Basin) conditions as the storm advances. It should be noted that while this product rated highly on the list of preferred products, in many instances the audi-

Inundation MapThe inundation map (Graphic 2), as noted above, was also not revised. Survey respondents were mixed on its appeal. During some of the presentations, technical difficulties prevented a full demonstration of the map’s zoom capabili-ties, though they were described and showcased in most instances. Participants were most animated about this product at T-1. Their discussion included comments that the map was “good for people new to the area,”and a note that “this makes me happy.” Participants said they would use the map primarily to check on neighbors’ potential for flooding. Negative comments about this map focused on the confusing use of color; participants found it difficult to understand the variations in the blue coloring as a key to water depth. Although one commenter wished to have access to the map at T, most did not regard it as a priority tool during a weather crisis. Round Two participants sug-gested further improvements, such as an interactive list of local landmarks and making the map broadly available at day T.
GRAPHIC 2 Inundation Map Graphic (test script)
8 Nurture Nature Center /RMC Research Corporation, 2015
FLOOD RISK AND UNCERTAINTY REPORT, NATIONAL WEATHER SERVICE
GRAPHIC 1 Day T-3 Hurricane Rachel Cone Graphic
ence could not correctly interpret the product, and mis-understood what the hurricane cone and track information was intending to convey.

MARFC Quantitative Precipitation Forecast (QPF)
In surveys, fewer than one in three (28%) Round One respondents recorded positive remarks about the QPF (Graphic 3); chief concerns were difficulty understanding the graphic, while some noted that it lacked critical information about where the rain was falling. The revised QPF (Graphic 4) received much more positive discussion. The QPF is an in-stance of a product that presented barriers to participants in terms of color, patterning, and mapping; the revised version, now more ac-cessible to participants, elicited calls for more specific data—in this instance, data on upriver conditions, where the rain was concentrated, and ground saturation conditions. This revised product was well received with 80% of partici-pants responding positively and describing it as informative.
Design notes: Graphic revisions that were made to the QPF in response Round One participants’ concerns were made largely to add geographic specificity. A more clearly defined regional forecast boundary, state and county boundaries, and major cities were added to aid in orientation. A key was added that defines bound-aries. The graphic was titled clearly on top along with a location marker (Middle Atlantic Forecast Region) and forecast time frame. A brief text sum-mary of the graphic was added below the title. Respondents indicated that they would like to use the QPF along with the hydrograph, so a link was added to the product to connect it immediately to the hydrograph.
9 Nurture Nature Center /RMC Research Corporation, 2015
GRAPHIC 3 Current Quantitative Precipitation Forecast
GRAPHIC 4 Revised Quantitative Precipitation Forecast Graphic
FLOOD RISK AND UNCERTAINTY REPORT, NATIONAL WEATHER SERVICE

Advanced Hydrologic Prediction Services (AHPS) HydrographDuring the presentation, although the hydrograph (Graphic 5) appeared to be familiar to only about half of Round One participants, discussion about it was vigorous as the hypothetical hurricane approached. At T-3, interest and trust in the hydrograph were strong; most Round One participants were unqualified in their perception of its value — the hydrograph was all that many Round One participants consulted.
The hydrograph is another instance of a product that elicited requests for more, and more complex, data once initial intelligibility issues were diminished through the revision (Graphic 6). In this case, participants wished to have information about the rate of rainfall. Suggestions from participants to link the hydrograph to other products were implemented in the revision. In Round Two discus-sion, a couple of participants said T-3 was still too early for the hydrograph to be useful, and some wished to know upriver levels, but most swore by it, calling it their “bible” and the most useful product. Several said they checked it “constantly.” At T-2, participants in both Rounds said they used the hydrograph “a lot,” calling it accurate, useful, and convincing. There was some interest in a smartphone app of the hydrograph.
At T-1, participants’ positive regard for the hydrograph was strong and continuous; participants in both Rounds described it as “key” and “incredibly important,” although there was some discussion about perceived delays in
updating the hydrograph. At T, participants in both Rounds described themselves as “absorbed” by the hydrograph, used language like “love” to describe their attitude toward it, and rated it as the “gold” standard. As the scenario unfolded, the impact of the hydrograph was striking; participants reacted physically to projected changes in the river level and expressed some distress as they watched the progression of the river’s actual and predicted rises. Suggested improvements from the second round of focus group participants reveal that while users are not always understanding how the hydrograph derives data from a system of located stream gages, they favor it for its ability to provide detailed geographic information. For instance, recommendations that the data be presented by zip code rather than river gage were naïve, but suggest that the users are looking carefully for impacts on their specific area. Similarly, participants frequently reported that they rely on upriver gage data to extrapolate the risk to their own area. While the revised product did not include this revi-sion, multiple requests for information on the influence of reservoir flows suggests that audiences are trying to extrapolate potential for additional risk from the hydro-graph presentation.
Survey respondents were almost unanimously positive about the hydrograph, calling it clear and easy to read, most accurate and location specific, and frequently used. The sole negative comments appeared in Round One survey responses and characterized the product as “too obscure” and “too technical.”
10 Nurture Nature Center /RMC Research Corporation, 2015
GRAPHIC 5 Current Advanced Hydrologic Prediction Services (AHPS) Hydrograph
FLOOD RISK AND UNCERTAINTY REPORT, NATIONAL WEATHER SERVICE

Design notes: Revisions made to the hydrograph (Graphic 6) included a streamlining of information to increase readability of the graph. A concise title was added and the graph is labeled clearly at the top indi-cating “observed” and “forecast” time periods. During Round One, participants did not always understand the distinction between the observed and forecast areas on the hydrograph. In the revised version, the “observed” time period is slightly paler, indicating that as a period of time passed and drawing attention to the bolder, fore-casted data. All references to Universal Time were
removed to avoid confusion. “Forecast Issued” and “Graph Created” times were separated from the key and placed in chronological order to reduce confusion.
A color-coded bar was added directly below the gage title that allows for watches and warnings. Yellow, orange and red indicate “be aware” (yellow), “prepare now” (orange) and “act now” (red). A quick link was added to guide viewers quickly to more detailed watches and warnings. A legend was also added that includes flood stage definitions and their corresponding colors.
11 Nurture Nature Center /RMC Research Corporation, 2015
GRAPHIC 6 Revised Advanced Hydrologic Prediction Services (AHPS) Hydrograph
FLOOD RISK AND UNCERTAINTY REPORT, NATIONAL WEATHER SERVICE
5553
49
45
41
37
33
29
25
21
17
13
9
5
1
Observed and Forecast River Levels
SiteTime (EDT)
Forecast Issued (10:25PM Sep 29) — Graph Created (11:00PM Sep 29)
2 am 2 pm 2 am 2 pm 2 am 2 pm 2 am 2 pm 2 am 2 pm 2 am 2 pm 2 am Sep 27 Sep 27 Sep 28 Sep 28 Sep 29 Sep 29 Sep 30 Sep 30 Oct 1 Oct 1 Oct 2 Oct 2 Oct 3
Riv
er L
evel
(ft)
STREAM GAGE: DELAWARE RIVER AT EASTON
Record Flood Level: 43.7’
Minor Flooding: 22.0’
Moderate Flooding: 26.0’
ESTN4 (plotting HGIRG) “Gage 0” Datum: 155.43” Obeservations courtesy of US Geological Service
Latest observed level: 3.5 ft at 9:30 pmEDT 29 - Sep. Flood Level is 22 ft.
Action: 20.0’Minor Flooding: 22.0’
Major Flooding: 30.0’
OBSERVED FORECAST
OBSERVED FORECAST
Action Stage - a stream, lake or reservoir has risen to a level where you should prepare for possible signi�cant �ooding.
Minor Flooding - minimal or no property damage, but possibly some public threat.
Moderate Flooding - some �ooding of structures and roads near stream. Some evacuations of people/property to higher elevations.
Major Flooding - extensive inundation of structures and roads. Additional evacuations of people/property to higher elevations.
Record Flood Level - the highest stage or discharge at a given site during the period of record keeping.
PREPARE NOW: FLOODING IS POSSIBLE IN THE VICINITY OF THIS STREAM GAGE. Click for details.
Current Level: 3.50 ft

Significant River Flood Outlook (SFO)During the presentation, Round One participants were universally negative about the SFO (Graphic 7). At T-5, T-3, and T-1, Round One comments described the SFO as confusing, too broad, and too difficult to differentiate one area from another. Several participants expressed active dislike of this product. In surveys, Round One respondents repeated the fairly negative reaction to the SFO. Comments included “too vague,” “too general,” and “poor color differentiation.” Comments that were positive, made by 37% of Round One respondents, focused on the local specificity of the product and ease of reading it. It is notable that this perspective was not shared by the rest of participants, who cited opposite complaints about the product.
Although some Round Two participants had never seen the SFO (Graphic 8) and others saw its use as depending on external factors (reservoirs, saturation, river levels), a few saw themselves using the SFO at T-5. Most Round Two participants would not use the SFO at T-3 and none would use it at T-1. Some Round Two parti-cipants still found it not specific enough. Overall, however, Round Two survey respondents were more favorable about the product; nearly three-quarters (71%) noted that the SFO indicated it was time to prepare and indicated the probability of rainfall.
Design notes: The SFO (Graphic 8), like the QPF, was amended with a clearly marked forecast boundary (green) and major cities to help orient the viewer. The research team noted that several participants had assumed that the boundary around the forecast area was a delineation of where active weather patterns were happening, while in fact, the boundary references the service area for the MARFC. To address this misunderstanding, the surrounding land was marked in blue to indicate it was out of the forecast area while the forecast region remains white. The title was changed to more clearly identify the visual. A text summary was added directly above the graphic and the text appears in red if flooding is forecast. Additional text was added below the graphic that clearly
among participants as indicating active flooding). Patterns in the legend were further defined. The use of the word “significant” to indicate flood levels was changed to “damaging,” in response to audience confusion about what “significant” meant.
indicates potential impacts. Multiple audience members complained about the similarity of the patterns intended to distinguish between whether significant flood-ing was possible or likely. The patterns were changed to read less similarly. Patterns occurring along boundaries no longer create a red line (which had been misidentified
12 Nurture Nature Center /RMC Research Corporation, 2015
GRAPHIC 7 Current Significant River Flood Outlook
GRAPHIC 8 Revised Significant River Flood Outlook
FLOOD RISK AND UNCERTAINTY REPORT, NATIONAL WEATHER SERVICE

Watches and WarningsBeyond a general distaste for dense, all caps-text, many participants found both watches and warnings irrelevant in that they are seen as triggers for media outlets. These prod-ucts are used by broadcast meteorologists for forecasts and warnings and reach people indirectly, framed and present-ed by media. Where people were likely to access watches and warnings themselves, that is, more directly through the Internet or a phone app, they wished for a way to keep the terms “watch” and “warning” straight. Even with respect to the revised products, which are shorter and have promi-nent action steps, they would like less dense, more locally targeted information. Specific comments follow.
Flood WatchDuring the presentation, participant comments centered on T-2. Round One participants agreed that the Watch (Graphic 9) was familiar but insufficiently user-friendly,
GRAPHIC 10 Revised Flood Watch
mentioning the confusion between the terms “watch” and “warning” and criticizing both the formatting (especially on mobile phones) and sequence of statements. Participants described the Watch as “yelling” at them, stressed the need for a brief summary of critical information at the top of the Watch (Grphic 10), and wished to see affected towns, rather than counties, named. Round Two discussants were divided: half said it was still too dense and half said they would be paying attention to it at that stage of the storm. Round Two participants also sug-gested that the Watch state “prepare now” very clearly, arguing that advising residents to prepare via a Flood Warning was too late.
Fewer than half of Round One survey re-spondents had positive comments about the Flood Watch. Negative comments focused on difficulties in reading the Watch and the fact that flooding may have already begun, calling it “good but needs work.” The smaller num-ber of positive comments characterized the Watch as accurate, relevant, useful, and easy to understand. Round Two survey respondents were also largely negative; although some saw it as informative, the remainder saw it as irrelevant or available through other means, such as broadcast weather reports.
Flood Watch Day T-2
FLOOD WATCH
You should begin following local forecasts and checking river levels frequently.
Flood Watch Issued By National Weather Service, Mt. Holly, NJ:
Check current and projected river levels frequently:
visit http://water.weather.gov/ahps2/index.php?wfo=phi
AFFECTED AREAS: NJ COUNTIES: HUNTERDON, MIDDLESEX, MERCER, MORRIS, PASSAIC, SOMERSET, SUSSEX, WARREN, including the cities of Morristown, Flemington, Somerville. PA COUNTIES: BERKS, including Reading; BUCKS (Upper and Lower, including Morrisville); CARBON; CHESTER (Eastern and Western); DELAWARE; LEHIGH; MONROE, including Stroudsburg; MONTGOMERY (EASTERN AND WESTERN, including Norristown); NORTHAMPTON, including Bethlehem, Easton; PHILADELPHIA. DE COUNTIES: NEW CASTLE, including Wilmington. MD COUNTIES: CECIL.
DESCRIPTION: Rain associated with Hurricane Rachel will arrive tomorrow, and will increase in intensity and
coverage tomorrow night and last through the day on the 2nd.
Storm total rainfall could be as high as 5 to 7”.
the Schuylkill, Delaware and Passaic Rivers.
ACTION: Prepare now.develop. Start monitoring your local weather forecast. Check current and projected river levels frequently:
visit http://water.weather.gov/ahps2/index.php?wfo=phi
frequently as conditions change, so check often for updates. Spread the word. Tell others in your area about this Flood Watch and urge them to follow local forecasts and river levels. Charge mobile devices and NOAA Weather
Radios.
A FLOOD WATCH means that river in the next 24 to 48 hours. If conditions worsen, a Flood
immediately. If small streams and creeks are expected to rise, a separate Flash Flood Watch or Warning will be issued.
This Watch is issued by:
http://www.erh.noaa.gov/phi/.
Flood Watch
WGUS61 KPHI 291900
FFAPHI
FLOOD WATCH NATIONAL WEATHER SERVICE MONTU HOLLY NJ
300 PM EDT SUN SEP 29 2013
DEZ001-MDZ008-NJZ001-007>010-012-015-PAZ054-055-060>062-070-071- 101>106-020000
/0.NEW.KPHI.FF.A.0001.000000T0000Z-121002T0000Z
/00000.0.ER.000000T0000Z.000000T0000Z.000000T0000Z.OO
NEW CASTLE-CECIL-SUSSEX-WARREN-MORRIS-HUNTERDON-PASSAIC-SOMERSET-
MIDDLESEX-MERCER-CARBON-MONROE-BERKS-LEHIGH-NORTHAMPTON-DELAWARE-
PHILADELPHIA-WESTERN CHESTER- EASTERN CHESTER-WESTERN MONTGOMERY-
EASTERN MONTGOMERY-UPPER
BUCKS-LOWER BUCKS- INCLUDING THE CITITES OF WILMINGTON…MORRISTOWN…FLEMINGTON…
SOMERVILLE…STROUDSBURG…READING…BETHLEHEM…EASTON…NORRISTOWN… PHILADELPHIA…MORRISVILLE
300 PM EDT SUN SEP 29 2013
…FLOOD WATCH ISSUED UNTIL 8 PM EDT OCTOBER 2ND…
FLOOD WATCH ISSUED FOR
* PORTIONS OF NORTHERN DELAWARE…NORTHEAST MARYLAND…NEW JERSEY…AND PENNSYLVANIA.
* UNTIL 8 PM EDT OCTOBER 2ND
* RAIN ASSOCIATED WITH HURRICANE RACHEL WILL ARRIVE TOMORROW AND INCREASE IN INTENSITY AND COVERAGE TOMORROW NIGHT AND LAST THROUGH THE DAY ON THE 2ND.
* SMALLER CREEKS AND STREAMS WILL RESPOND FIRST FOLLOWED BY THE LARGER MAINSTEMS. FLOODING IS POSSIBLE ALONG THE SCHUYLKILL, DELAWARE, AND PASSAIC RIVERS.
* STORM TOTAL RAINFALL COULD BE AS HIGH AS FIVE TO SEVEN INCHES.
PRECUATIONARY/PREPAREDNESS ACTIONS…
A FLOOD WATCH MEANS THAT FLOODING CONDITIONS MAY DEVELOP IN THE NEXT 26 TO 48 HOURS. MONITOR LATER
FORECASTS AND BE PREPARED TO TAKE ACTION SHOULD FLOOD WARNINGS BE ISSUED.
13 Nurture Nature Center /RMC Research Corporation, 2015
GRAPHIC 9 Current Flood Watch
FLOOD RISK AND UNCERTAINTY REPORT, NATIONAL WEATHER SERVICE

Flash Flood WarningDuring the presentation, Round One participants were almost uniformly negative about the Flash Flood Warning (Graphic 11) at T-1, describing it as “screaming,” repetitious, and too much text; a few offered improvements such as altering the spacing and type treatment and summarizing key points at the top. At T, Round One participants were a little more positive, noting that text is more easily updat-ed than graphics. Some Round One participants also wished to know the heights of specific creeks. While some Round Two participants offered improve-ments such as providing links to local information and to the hydrograph, bullet points, and less dense text, others found the Warning (Graphic 12) helpful and “important for tributaries;” still others said they would have moved out by T-1. At T, participants were very attentive to the Flash Flood Warning, although some noted that a warning to “act now” was too late.
Flash Flood Warning
WGUS51 KPHI 302100
FFWPHI
NJC001-005-007-011-015-019-021-025-029-035-PAC017-029-045-091- 101-010600- /O.NEW.KPHI.FF.W.0043.000000T0000Z-121002T0600Z/
/00000.0.ER.000000T0000Z.000000T0000Z.000000T0000Z.OO/
BULLETIN – EAS ACTIVATION REQUESTED
FLASH FLOOD WARNING NATIONAL WEATHER SERVICE MOUNT HOLLY NJ 500 PM EDT MON SEP 30 2013
THE NATIONAL WEATHER SERVICE IN MOUNT HOLLY NJ HAS ISSUED A
* FLASH FLOOD WARNING FOR…
M ERCER COUNTY…
W ARREN COUNTY…
H UNTERDON COUNTY…
S USSEX COUNTY… P HILADELPHIA COUNTY…
M ONTGOMERY COUNTY…
BUCKS COUNTY… N ORTHAMPTON COUNTY…
C ARBON COUNTY…
M ONROE COUNTY…
* UNTIL 200 AM EDT TUESDAY…
* AT 500 PM EDT…NATIONAL WEATHER SERVICE DOPPLER RADAR INDICATED VERY HEAVY RAIN OUT AHEAD OF HURRICANE
RACHEL. THE RAIN HAS BEEN OVER THE CENTRAL AND LOWER PORTIONS OF THE DELAWARE RIVER FOR THE LAST SEVERAL HOURS AND MORE IS TO COME.
* LOCATIONS IN THE WARNING AREA INCLUDE BUT ARE NOT LIMITED TO PHILADELPHIA…READING… ALLENTOWN…EASTON…NEW HOPE/LAMBERTVILLE…AND TRENTON.
ONE TO TWO INCHES OF RAIN HAVE ALREADY FALLEN IN A SHORT TIME AND ANOTHER ONE TO TWO INCHES IS LIKELY OVER THE NEXT FEW HOURS. THIS WILL CAUSE FLOODING IN LOW LYING AND POOR DRAINAGE AREAS. SMALL CREEKS AND STREAMS
WILL ALSO QUICKLY RISE OUT OF THEIR BANKS.
PRECAUTIONARY/PREPAREDNESS ACTIONS…
PLEASE REPORT FLOODING …HAIL OR WIND DAMAGE TO THE NATIONAL WEATHER SERVICE BY CALLING TOLL FREE…1-877-633-6772.
IF FLASH FLOODING IS OBSERVED ACT QUICKLY. MOVE UP TO HIGHER GROUND TO ESCAPE FLOOD WATERS. DO NOT STAY IN
AREAS SUBJECT TO FLOODING WHEN WATER BEGINS TO RISE.
Flash Flood Warning T-1
*** FLASH FLOOD WARNING***EAS ACTIVATION/IMMEDIATE BROADCAST REQUESTED
ACT NOW to prepare for IMMINENT FLASH FLOODING.
Streams and creeks may rise very quickly, causing serious threats to safety and property.
Flood Watch Issued By National Weather Service, Mt. Holly NJ: 5:00 PM Monday, September 30, 2013.
AFFECTED AREAS INCLUDE BUT ARE NOT LIMITED TO:NJ COUNTIES: HUNTERDON, MERCER, SUSSEX, WARREN… including New Hope/Lambertville, and Trenton.PA COUNTIES: BUCKS, CARBON, MONROE, MONTGOMERY, NORTHAMPTON, PHILADELPHIA, including Easton, Allentown, Reading, Philadelphia
DESCRIPTION: AT 5 PM EDT National Weather Service Doppler Radar indicated very heavy rain out ahead of Hurricane Rachel. The rain has been over the central and lower portions of the Delaware river for the last several hours and more is to come. **ONE TO TWO INCHES OF RAIN HAVE ALREADY FALLEN IN A SHORT TIME AND ANOTHER ONE TO TWO INCHES IS LIKELY OVER THE NEXT FEW HOURS. THIS WILL CAUSE FLOODING IN LOW LYING AND POOR DRAINAGE AREAS. SMALL CREEKS AND STREAMS WILL ALSO QUICKLY RISE OUT OF THEIR BANKS. **
ACTION: ACT NOW
from underneath. SPREAD THE WORD: Contact neighbors and friends to make sure they get out of harm’s way. PLEASE REPORT FLOODING …HAIL OR WIND DAMAGE TO THE NATIONAL WEATHER SERVICE BY CALLING TOLLFREE…1-877-633-6772.
Nearly two-thirds (62%) of Round One survey respondents offered positive remarks about the Flash Flood Warning, primar-ily for its ease of reading and understanding, with some comments praising its local specificity and its accuracy. Negative comments character-ized the Warning as boring, hard to understand, and irrelevant, for example, “important but needs work.” Round Two survey respon-dents were also largely positive about the Flash Flood Warning, describing it as useful, crucial, and signifying immediate danger. Negative comments included the fact that weather reporters pro-vide the same information and that “so many” warnings are received.
14 Nurture Nature Center /RMC Research Corporation, 2015
GRAPHIC 11 Current Flash Flood Warning
GRAPHIC 12 Revised Flash Flood Warning
FLOOD RISK AND UNCERTAINTY REPORT, NATIONAL WEATHER SERVICE

Flood WarningIn Round One, participants mentioned difficulties in reading the Flood Warn-ing (not shown) (this difficulty may have been exacerbated in part as a result of its presentation on a screen in a PowerPoint presentation). Other than that, there was no discussion of the Warning. In Round Two, as in Round One, when the Flood Warning was shown at T-1, discussion centered mostly on the situation and not the product. Participants described mak-ing preparations at this point; they had determined the steps they would take and were not referencing the Warning. The revised Flood Warning (Graphic 13)in Round Two generated positive com-ments, particularly with respect to the use of color to catch participants’ attention.
Just under two-thirds (65%) of Round One survey respondents made positive comments about the Flood Warning, describing it as easy to read, accurate, localized, and useful. Negative com-ments concerned the “boring” nature of text and difficulty understanding the Warning. Round Two survey respondents were also largely positive, focusing on the certainty and utility of the Warning. Negative comments reported only a complaint about excessive text and the fact that weather reporters deliver the same information.
Flood Warning T-1
***FLOOD WARNING***ACT NOW*** IMMEDIATE BROADCAST REQUESTED
DELAWARE RIVER MAJOR FLOODING AT
EASTON FORECAST WITHIN THE NEXT 24 to 48 hours. RECORD FLOOD LEVELS EXPECTED AT
NEW HOPE/LAMBERTVILLE NJ. OTHER AREAS AFFECTED. MAJOR DAMAGE AND RISKS TO SAFETY ARE LIKELY. ACT NOW to ensure the safety of your household and to reduce losses
to property. Review and implement evacuation plans, if needed. Expect serious travel
interruptions. Check your local forecast and river levels every few hours to monitor any
changes that may increase your risks. Flood Watch Issued By National Weather Service, Mt. Holly, NJ: 10:00 PM Monday, September 30, 2013.
AFFECTED AREAS:
IN NJ: RECORD FLOODING EXPECTED FOR THE DELAWARE RIVER AT NEW HOPE/LAMBERTVILLE.IN PA: MAJOR FLOODING EXPECTED FOR DELAWARE RIVER AT EASTON.
DESCRIPTION:
DELAWARE RIVER AT EASTON:
is cancelled. At 10 p.m. Monday the river level was 8 feet. Flood level is 22 feet at Easton. FORECAST CREST IS 41.0 feet. highest point on Wednesday morning. IMPACTS WILL INCLUDE:
WIDESPREAD THREATS TO LIFE, SAFETY AND PROPERTY. TRAVEL WILL BE DIFFICULT OR IMPOSSIBLE IN AFFECTED AREAS. TURN AROUND, DON’T
DROWN: DON’T DRIVE ON FLOODED ROADWAYS – the water may be deeper than it appears. ROADS CAN WASH AWAY FROM UNDERNEATH. FLASH FLOODING CAN OCCUR PRIOR TO OR AT THE SAME TIME AS RIVER FLOODING.
DELAWARE RIVER AT NEW HOPE/LAMBERTVILLE: -day or until the warning is cancelled. At 10 p.m. Monday the river level was 11 feet. Flood level is 13 feet at New Hope, PA/Lambertville, NJ.
FORECAST CREST IS 26.0.Tuesday morning and crest at its highest point on Wednesday morning. IMPACTS WILL INCLUDE:
WIDE-SPREAD THREATS TO LIFE, SAFETY AND PROPERTY. TRAVEL WILL BE DIFFICULT OR IMPOSSIBLE IN AFFECTED AREAS. TURN AROUND, DON’T DROWN: DON’T DRIVE ON FLOODED ROADWAYS – the water may be deeper than it appears. ROADS CAN WASH AWAY FROM UNDERNEATH. FLASH FLOODING CAN OCCUR PRIOR TO OR AT THE SAME TIME AS RIVER FLOODING.
ACTION:
ACT NOW TO START ALL NECESSARY PRECAUTIONS. Elevate items to higher levels of buildings. Make travel arrangements and prepare family go-bags with needed items in case evacuation is required. If time permits,
charge mobile devices and NOAA Weather Radios. Follow all local instructions for preparation and evacuation. Protect SPREAD THE WORD: Check
on neighbors, friends and family to make sure they are safe, prepared and able to leave if necessary.
Design notes: Changes to Watches and Warnings (Graphics 10, 12, 13) were made to develop a hierarchy of importance within the text, giving the reader visual cues to quickly and accurately locate relevant informa-tion. Through the use of regular width text and boldface type, a mix of all caps and upper and lower case letters, and selective color, text is emphasized to provide clear guidance and reinforce key messages. Any coded text was removed and active web links were added to guide par-ticipants to important forecast tools. “Act Now” language was added prominently at the top of Warnings; “Prepare Now” language was added to the Watches. Note that this
same language was added to the bars at the top of the revised hydrograph, with the intention that if a Flood or Flash Flood Watch were in effect, the hydrograph would have an orange bar at the top indicating “Prepare Now,” that would link to Watch text; similarly, if a Flood or Flash Flood Warning were in place, the hydrograph would have a red “Act Now” bar that would link to the Warning text. This interactivity between products was included in response to multiple requests from participants for easy and quick access to the hydrograph from other warning products.
15 Nurture Nature Center /RMC Research Corporation, 2015
GRAPHIC 13 Revised Flood Warning
FLOOD RISK AND UNCERTAINTY REPORT, NATIONAL WEATHER SERVICE

Meteorological Model Ensemble River Forecasts (MMEFS)The MMEFS suite of tools is used by the Middle Atlantic River Forecast Center (MARFC) to represent uncertainty in river levels. In contrast to the other products in the scenario, the MMEFS products were designed with a pro-fessional user in mind, and specifically have been used by emergency management offices. This study examined whether these products have any utility for residential users. MMEFS is a regional system for the Middle Atlantic Region, but is designed similarly to a national model, the NWS Hydrologic Ensemble Forecast System (HEFS). The MARFC provided three styles of graphics that are used in the MMEFS, including spaghetti, bar and whisker, and dot and line formats. Because it was expected that the participants would have very little familiarity or initial com-fort with these products, they were presented separately, following the hurricane scenario. Participants were shown examples of each type and discussed them individually. Response to the products during Round One was very poor. Fewer than one fifth (15%) of Round One survey respon-dents had some positive comments about the MMEFS; one example is a comment that the MMEFS was useful for a few in showing the range of uncertainty. Most, however, found the suite difficult or impossible to read, not useful, and confusing. Most struggled to understand what was be-
ing conveyed. Although Round Two respondents also expressed confusion about the MMEFS, they were more positive than Round One respondents, describing the graphics as informative and a complement to other fore-casting tools. Round Two participants found the products easier to understand, and engaged in a much richer dialogue about the products’ utility. In particular, partici-pants appeared more open to the value of understanding uncertainty in weather forecasts and offered more specific improvements, for example, the ability to mask some uncertainty paths or to view them in isolation. Yet, con-cerns about their complexity remained.
The discussion that follows below is drawn from participant comments during presentation of the MMEFS graphs.
Dot and LineThis dot and line graph (Graphic 14) appeared to defeat Round One participants entirely. In addition to an initial silence, comments included “misleading,” “thoroughly con-fused,” “intimidating and disorienting,” and “it looks easier at first, then you realize you have no idea what it means.” Given the intensity of the response from participants, the research team decided not to revise this product for Round Two, but instead to present a revised spaghetti model and two variations of the bar and whiskers product, with differ-ent revisions to each.
16 Nurture Nature Center /RMC Research Corporation, 2015
GRAPHIC 14 Current MMEFS Dot and Line Graph
FLOOD RISK AND UNCERTAINTY REPORT, NATIONAL WEATHER SERVICE

Spaghetti Round One participants initially greeted the MMEFS spaghetti graph (Graphic 15) with laughter. Comments largely addressed its confusing nature, although one participant noted that “at least it shows there are multiple models.” Round Two participants initially greeted the spaghetti graph (Graphic 16) with silence and comments were primarily negative, such as “all jargon,” “too many lines,” “too much information,” and “messy.” The few positive comments characterized the spaghetti graph as “interesting,” and praised its “long-term perspective.” Some participants described how they would interpret the median line and coloration; most, however, offered improvements, such as enabling an option to turn different lines on and off, including explanations and changing the color scheme. Some Round Two participants asserted that the spaghetti graph (Graphic 16) still needed to offer users guidance in interpreting it.
Design notes: The spaghetti graphs were re-titled and rede-signed to more clearly represent and highlight the degree of cer-tainty (or uncertainty) within the model simulations. A three color overlay was added to unify the spaghetti graph’s many simulation lines under their range of cer-tainty (from 5% to 95%). A new legend added further definition. New titles on all graph formats served to clarify the source of the data and the time period of the forecast. As with other products the team revised, a brief text summary was included under the title. The logo in the background was replaced with graph lines that help guide the viewer in reading times and river levels. The flood stage was marked in each legend and flooding levels were further denoted by color. Links to additional information explaining the graph were included.
17 Nurture Nature Center /RMC Research Corporation, 2015
GRAPHIC 15 Current MMEFS Spaghetti Graph
GRAPHIC 16 Revised MMEFS Spaghetti Graph
FLOOD RISK AND UNCERTAINTY REPORT, NATIONAL WEATHER SERVICE

Bar and Whiskers Overall, Round One participants regarded the bar and whiskers graph as somewhat less confusing than the spaghetti graph (Graphic 17) and ap-peared to be mixed on the value of the median. Specific comments spoke to the “misleading” scale of the y axis and the need for explanation.
Round Two participants were considerably more positive, remarking that the bar and whiskers graph (Graphic 18 and 19) was clearer and more readable than the previous graphs and saw it as particularly helpful for decision-makers. Some participants criticized this graph as “too much in-formation” and too complicated but more offered improvements, such as enabling options to reduce the multiplicity of views, superimposing the hydro-graph, and offering a brief, one sentence text expla-
nation. Comparing the spaghetti graph to the bar and whiskers graph, one participant was enthusiastic: “[The Spaghetti] is like 21 radio stations at once!” Others agreed the bar and whisker graph seemed more intui-tive. Still, many described it in terms of “TMI” (too much information) and suggested it would be more valuable to emergency managers and plan-ners than the general public. A small number said they would use it, noting that it would “weight my preparation,” that is, influence planning. Some par-ticipants appeared to appreciate being able to visualize the uncertainty and have access to expert thinking; others simply want newscasters to tell them the level of certainty. A couple of participants suggested that it would be useful for “newbies.” Several partici-pants suggested including a link to the hydrograph with this product.
Design notes: The first revised ver-sion of the bar and whiskers graph (Graphic 18) was modified to include bars that are colored on a graduated scale from yellow to red indicating the degree of certainty among river level simulations. The minimum (5%)
17 Nurture Nature Center /RMC Research Corporation, 2015
GRAPHIC 17 Current MMEFS Bar and Whiskers Graph
GRAPHIC 18 Revised MMEFS Bar and Whiskers Graph (1)
FLOOD RISK AND UNCERTAINTY REPORT, NATIONAL WEATHER SERVICE

and maximum (95%) percentile whiskers, along with the median, were connected from hour to hour to be read more easily. More explanatory text was added on the right and bottom of the graph. Links to additional information explaining the graph were included.
The second revised version of the bar and whiskers graph (Graphic 19) plotted the information on a continuous curve. The delineated “whiskers” from the previous version were kept to mark the 5th and 95th percentiles; however, the range between the 25th to 75th percentiles was filled in with a graduated color scale representing the degree of certainty in the forecast. The color scale, ranging from yellow (less certain) to red (most certain) helped to focus the viewer on the level of probability. A summary of the forecast on top and a clearly labeled legend at the bottom help to guide the viewer in understanding the product. The flood stage was added to the legend along with a “Scale to Flood Stage” button that allows the viewer access to flood level information. (*Note: Further input on this ver-sion identified a potential risk of misinterpretation with the tested color scale. Concerns were raised that the colors
within the scale – which indicate level of confidence rather than river levels - might be seen as predicting flood threat, because they use red and orange tones commonly associ-ated with warnings. NWS may consider further testing or revision of this product using a monochromatic scale of a color not associated with a flood risk.)
This second revised version had a more positive reception (Graphic 19). “I like this better; it puts the meaning [uncer-tainty] in starker relief,” said one; another noted it is “more concise.”The title appeared unnecessarily opaque to one participant who observed, “the word ‘flood’ is missing….I’d never google ‘GEFS!’” Another suggested that “certainty” should be in the title. There was a suggestion to leave out the percentages and numerous suggestions to add a feature enabling a user to “mouse” over labels to clarify content, or to embed a hyperlinked video or text explanation. While a greater number appeared willing to use this product, there was still hesitation about general use: “it’s dangerous for the general public,” said one, “it’s too easy to misinterpret.” Shown the original (Graphic 17) version of this graph, participants expressed appreciation for the revisions.
GRAPHIC 19 Revised MMEFS Bar and Whiskers Graph (2)
18 Nurture Nature Center /RMC Research Corporation, 2015
FLOOD RISK AND UNCERTAINTY REPORT, NATIONAL WEATHER SERVICE

Post-Focus Group Survey Findings
Once each focus group session was concluded, partici-pants were asked to complete a final survey reflecting on their experiences with the products and on their use of these products. The discussion in this section, therefore, takes into account some of the focus group discussions that informed these survey responses.
Preferences for Information Delivery
Focus group participants discussed graphic and text features of each NWS product presented. Subsequently the survey asked about their preferences for information delivery—graphics and visuals, text, or a combination of the two.
More specifically, it emerged through the discussion that although participants found the immediacy of graphically displayed information to be powerful, they also wished to see text used succinctly, particularly with respect to all-text watches and warnings and legends for graphics.
In anticipation of an ever-greater mobile phone use, the researchers also asked survey respondents to identify their preferences for digital delivery and preferred sites. Survey respondents chose among Facebook, smartphone apps, Twitter, and “other” to identify their preferred platforms for information about weather emergencies:
• Smartphone apps: 70%
• Facebook: 58%
• Twitter: 5%
Under “other,” respondents mentioned telephone, com-munity email, blogs, and personal contacts. Asked about
preferred digital devices, respondents chose among four:
• Smartphone: 52%
• Laptop: 50%
• Desktop: 38%
• Tablet/Notebook: 11%
Smartphone applications appear to be a strong resource for information about weather emergencies and a preferred digital tool as well, not least because coverage often continues even after power outages.
Other Important Content Respondents were asked to identify other severe weather and flood-related content they turn to in gathering information about severe storms or preparing for them. Forty-eight percent of respondents identified information such as:
• Other weather features:
- Wind speed
- Temperature
• Specific local conditions:
- Upstream water flows
- Groundwater saturation levels
- Runoff patterns
- New York reservoir levels
• Accessible content:
- Central information source
- More smartphone weather emergency apps
- Continued use of radio, often the last resort for
information during power outages
A small number of respondents called for more publiceducation about floods and public practice drills similar to those used in earthquake-prone areas. During discussions, participants shared local resources such as http://readynotifypa.org/, which provides notification of emergent weather situations by county in Pennsylvania and parts of New Jersey.
19 Nurture Nature Center /RMC Research Corporation, 2015
63%
preferred a combination of text and visuals
32%
preferred graphics alone
5%preferred text alone
FLOOD RISK AND UNCERTAINTY REPORT, NATIONAL WEATHER SERVICE
FIGURE 4 Preferences in Information Delivery

Participant Barriers to Using NWS Forecast and Warning Tools
Eighty-three percent of respondents identified barriers to using NWS forecast and warning tools. Lack of electricity, understandably, was the major barrier to accessing NWS forecast and warning tools during emerging weather events. A number of respondents reported accessing information through cell phones even after they had lost electricity; they emphasized the potential value of an NWS smartphone app, given the phone’s greater usability in extreme weather conditions. A very small number of respondents said they used battery powered or hand-cranked weather radios.
After power issues, survey respondents indicated that the next greatest barrier to using NWS forecast and warning tools was the nature of the tools themselves. As with the scenario discussions detailed earlier, survey responses reflected concerns that terminology and explanations were unnecessarily technical or unclear. Inhibiting factors respondents cited include:
• Jargon and overly technical language • Inadequate explanations and legends for maps and graphs • Unclear or inconsistent graphic representations • Illegibly dense text and all caps • Difficulty navigating website • Lack of awareness of NWS products • Updates that are too infrequent
A small number of participants expressed distrust of the accuracy or reliability of NWS products.
Quality of the Focus Group Experience Of the 98% of respondents who answered the survey ques-tion, all agreed or strongly agreed that they felt comfortable voicing their views. They also concurred that the information was clearly presented, and that they knew more about NWS resources. Nearly all felt they could use NWS resources to judge their risk in an extreme weather event. More specifi-cally, the following percentages represented “very strong” agreement with the statement:
• Felt comfortable speaking: 92% • The information was clearly presented: 66% • More able to use NWS products: 64% • Know more about NWS products: 58%
Less than one-fifth (18%) of respondents overall indicated they found aspects of the presentation confusing. Graphs, acronyms, and the sheer complexity of weather forecasting were cited as sources of confusion.
To gauge the potential impact of the focus group on participants, survey respondents were asked about further actions they might take following the focus group. Respon-dents indicated their likelihood of taking three actions:
• Very likely to share what they had learned with others: 70%
• Very likely to seek NWS information in the future: 60% • Likely or very likely to create or revise plans for dealing
with weather-related emergencies: 31%
This feedback suggests that discussing flood forecast tools in the context of an actual scenario enabled participants to project themselves into real and typical events, and appears to have stimulated a greater commitment to action and information sharing.
Survey respondents were also invited to add comments about the focus group process. More than half of all written comments (52%) declared the focus group well done—in-formative and useful—while negative comments concerned technical issues with the presentation software used. Positive comments described the sessions as “informative and necessary,” “lively,” and noted that “a great deal of learning went on here today.” One respondent suggested exporting this discussion model: “it is a great forum to raise awareness for weather related disasters.” Although only one survey respondent articulated this idea, it emerged spontaneously in at least one focus group discussion, and in numerous informal follow-ups with project participants after the sessions were finished.
Participants appear to have learned a great deal in the course of presentations, not only about disaster forecasting and the NWS products, but about each other’s flood experi-ences and resources. Participants expressed gratitude for the opportunity to learn about forecast products and severe weather.
In addition, the participants’ interest in hearing other peo-ple’s experiences, information sources, and action plans, suggests that a deliberative model of this kind may be effective in engaging community members in recognizing weather dangers and acting appropriately in response. As opposed to more traditional “stand and deliver” formats for presenting information about impending storms, the focus group experience engaged participants intently—responses to the scenarios were vocal and strong—and enabled a great deal of peer sharing.
20 Nurture Nature Center /RMC Research Corporation, 2015
FLOOD RISK AND UNCERTAINTY REPORT, NATIONAL WEATHER SERVICE

DISCUSSION
Overall, participant discussion reflected the fact that during acute flood events, residents were eager to access information about their local flood risks. As noted above, in addition to checking traditional sources of information, residents were inclined to do things like ground-truth rainfall rates using sticks in their backyard, and frequently consulted neighbors and others to find out what to expect and to help one another. NWS’s flood forecast and warning products are an integral part of this suite of resources and are highly trusted by most participants.
River levels matter to these residents. Their clear preference for the hydrograph (alongside the cone, which was not a formal part of this study) was incorporated into the research team’s product redesign, and nearly all the product redesigns include a direct link back to the hydrograph.
Additionally, it was clear that the use of color, font, patterning and shading (alongside careful use of text) was critical foradvancing understanding of the products. Participants repeat-edly referred to red as a color that indicated warning or high risk and, in some instances, requested that critical informa-tion – such as high rates of rainfall in a flood watch or warning – be called out in red, bold text to catch their attention.
In the sections above, each of the graphic changes to the products is explained in detail. Overall, a series of design considerations were employed during product revisions in order to achieve uniformity and increased understanding by participants, and also to increase the likelihood the prod-ucts will motivate action.
Those design considerations include the following: • Graphic presentations should be kept as consistent
as possible across products. Logos, titles, geographic names, keys and legends that are uniformly placed quickly orient the viewer. Revised products in this study use a similar format and placement of logos.
• Logos separate from graphed areas serve to avoid visual confusion. An example is the hydrograph redesign, which eliminated the watermark behind the data graph.
• Colors indicating minor, moderate and major flooding should be congruous across graphics, texts and legends.
• Colors that can be easily distinguished from each other should be used especially since not all devices or moni-tors show colors the same way. Reuse of colors in a color bar should be avoided.
• Where possible, coded text, Universal Time zone in-formation and additional source information should be located toward the bottom of a graphic meant for public distribution.
• A fuller range of text styles and colors should be utilized to develop a hierarchy in messaging. The use of upper case font makes text watches and warnings difficult to read and lacks intonation. Organized text that quickly summarizes critical information can serve to highlight impacted areas and improve desired actions.
• Products should be titled clearly and concisely in easy-to-understand terms. A brief written summary of critical information near the top of a graph can aid in confi-dence and accuracy in interpretation. A link to other forecast tools placed prominently near the title allows easy access to other products. A color-coded banner can be added across the top of the graph to emphasize important take away messages during watches and warnings.
• Forecast products that involve a map should give the viewer enough locational markers (major cities, streams, municipal boundaries) to allow for quick establishment of one’s location without becoming visually overwhelm-ing. When forecasting for a region, the forecast area should be highlighted to emphasize that the forecast is being made for areas inside the boundaries only. Care should be taken not to denote boundaries with a color that could be misinterpreted as a warning color (see Significant River Outlook as an example; this product outlines the boundaries in a red color, which confused focus group audiences and led to a misunderstanding that the boundary showed coastal flooding underway).
• Any patterns used should be designed with enough contrast to be easily discernible.
• Legends and keys should be clearly marked. Terms that can be interpreted subjectively (such as “possible,” “likely” and “imminent”) should be further clarified with concrete actionable direction or level of threat (see leg-ends for hydrograph and SFO). As one participant noted, “my significant may be different from your significant.”
• In more complex representations, such as the MMEFS, additional guidance may be provided with extra labeling and a “how to interpret” link.
21 Nurture Nature Center /RMC Research Corporation, 2015
FLOOD RISK AND UNCERTAINTY REPORT, NATIONAL WEATHER SERVICE

Beyond design considerations, the study identified specific requests for information that participants made. Through-out the study, participants frequently referenced a desire to understand other facts, such as ground saturation (antecedent soil moisture), current reservoir levels, and anticipated wind conditions. In many cases, such as with the QPF, participants wanted to know the rate of rainfall, because they felt that the rate, in addition to the quantity, affected their vulnerability and in turn, their inclination to prepare or not. None of the products shown in the scenario provided that information, which was requested repeatedly. Notably, no participants referenced using a rain gage, but many referenced the potentially dangerous practice of using sticks in the ground near the river to observe and measure the rate of river rise. In some cases, it was suggested that a regional ground-truthing fo-rum to share information about rate of rainfall could help residents in bordering neighborhoods understand what was to come.
The research team addressed these kinds of issue (see for instance the QPF) with a “forecaster’s note” box, allowing for some personalized information from a forecaster, which could address either rate of rainfall, or ground saturation, or other relevant factors. Given the influence such factors have on residents’ intent to take action, NWS may consider cross-referencing such factors, which could meaningfully increase or decrease flood risk, into its existing products – either in a non-automated format, such as a forecaster’s note, or in an automated way, such as calling out time periods when rainfall will exceed a certain parameter (e.g., 1 inch).
With respect to reservoir management, some audience members wanted to understand if the forecasts incorpo-rated up-basin reservoir releases, and in some cases, were less confident in forecasts when they believed the role of the reservoirs was not accounted for in the presentation. Though a complete explanation of the role of reservoirs is an extensive undertaking for any given product, NWS may consider addressing these issues directly where appropriate, through explanatory comments or additional “help” links, in order to answer user questions.
Lastly, a large portion of participant discussion was cen-tered on the ways in which they shared information with one another. As noted earlier, more than any other ac-
tion in the face of an impending storm, people discussed weather information with friends and relatives, and sought out further information. Beginning as early as day T-7, participants began to express that they would start shar-ing news of a potential flood event with neighbors. As the event progressed, participants reported an increased level of community conversation, with participants frequently mentioning that they would begin to check on elderly neighbors, or those who had been particularly flood-prone in previous events.
Quite clearly, the chain of neighborhood information was an important factor in whether or not people chose to begin preparations and protective actions, and this factor remained strong throughout all seven days of the scenario. NWS should consider the mechanisms by which it encourages neighbors to share its flood forecast and warning products, to ensure that informal risk communi-cation during flood events provides accurate and timely information to those most at-risk. Although social media was not heavily referenced by this group, its role as a mechanism for community information sharing is increas-ing, and NWS should work to understand the ways in which information is shared – digitally, by verbal communication among neighbors, and through commu-nity chains of information, such as municipal distribution. For instance, Lambertville audiences made frequent reference to the trusted role of the emergency manage-ment office in that community, and relied heavily upon transmission of NWS products through that office. NWS might also consider how it works with municipalities in disseminating flood warnings, and communities might consider increasing their role as disseminators of NWS flood forecast and warning products.
Citizen science programs, including rain gaging efforts such as Community Collaborative Rain, Hail & Snow Network (CoCoRAHS), could help create a network of informal ambassadors to serve as vehicles for dissemina-tion about flood risk during acute events.
22 Nurture Nature Center /RMC Research Corporation, 2015
FLOOD RISK AND UNCERTAINTY REPORT, NATIONAL WEATHER SERVICE

CONCLUSION
This research study has focused on the ways in which residents in two highly flood-prone river communities in the Delaware River Basin use and respond to the suite of NWS flood forecast and warning products. The study has shared findings about the ways that the participants seek out information about storms and how to prepare, includ-ing what sources and platforms they use in identifying their risk. Moreover, the project has provided a series of mock-ups of NWS products, which include practical design and text changes. Participant response to the revised products suggests that these changes to the visual and graphic design of products, as well as careful attention to wording and use and placement of text, were helpful for increasing the audience’s understanding and intention to take protective actions in response to warning products.
Transition to OperationsNWS offices were involved in the design of this project from its inception, and worked closely with the research team in designing the scenario. Revisions to the products were made in consultation with partnering NWS offices, which provided meaningful guidance about the practicality of recommenda-tions. Some of the products studied, such as the MMEFS, are implemented on a regional basis, while others, including the hydrograph, are generated through national offices. Implementing these changes would therefore require a case- by-case study as appropriate. NWS Eastern Region has included in its Annual Operating Plan FY 2015 a study of the feasibility for implementing this report’s findings and recom-mendations for the MMEFS suite of products.
In order to help share information about recommendations, NNC has disseminated the findings of this project to a broad list of professional audiences, including NOAA and NWS offices as well as other interested audiences, such as floodplain managers. These presentations shared details about the participant feedback and rationale for the recom-mended changes to NWS personnel and other professional audiences. A summary of these presentations is included as Appendix D.
Limitations and Future Research
This study was conducted in two states (Pennsylvania and New Jersey) in the Delaware River Basin, a large and flood-prone watershed in the Northeastern region of the United States. The audience members were largely experienced
with flooding and had previous knowledge of and experience with at least some of NWS flood forecast and warning tools. Other regions of the country may have differing needs for some information, and audiences who are entirely unfamiliar with NWS flood products may have further recommenda-tions for improvements. Future research suggestions include a replication of this project across different geographic regions, and with participants who may be less familiar with NWS products at the start.
Findings from this project also suggest that these river residents are largely “pulling” information about flood risk from sources, including the Internet. Very few partici-pants received any “push” notifications, and few relied on broadcast TV for information about riverine flood events. This finding may stand in contrast to other flood events, such as major coastal flooding events, in which residents are exposed to extensive media coverage from broadcast news and elsewhere. Future research should explore the ways in which broadcast media use and disseminate NWS flood forecast products in both coastal and flood events. Research should also explore the influence of social media in potentially changing the ways in which people use and respond to NWS flood forecast and warning products. Additionally, the role and influence of “who” sends the NWS products to the audiences – and the influence the sender makes on whether the recipient decides to take action - could be further explored, particularly considering the substantially noted role that the Lambertville emer-gency management audience played in sharing information with that community.
Lastly, this study presented each of the 9 flood forecast products to the audience in a timed scenario, removing the natural process by which the audience would have to seek out each of the pieces. In many cases, audiences were unfamiliar with various products and how to find them from NWS. Future research should explore how audiences use NWS websites and other delivery mechanisms; specifically, research should look at the emerging use of emergency briefings as delivery mechanisms for riverine flood events, because these briefings provide a unified delivery format of these various products in a combined graphical/text format, as preferred by the respondents. A study of the use of these briefings in a coastal flooding context is being completed by Nurture Nature Center in 2015.
23 Nurture Nature Center /RMC Research Corporation, 2015
FLOOD RISK AND UNCERTAINTY REPORT, NATIONAL WEATHER SERVICE

24 Nurture Nature Center /RMC Research Corporation, 2015
FLOOD RISK AND UNCERTAINTY REPORT, NATIONAL WEATHER SERVICE
Appendix A:
ABOUT RESEARCH METHODS
The pragmatic, mixed methods approach taken for this study — including surveys and focus groups in each community for each round of investigation, with eight participant discourses during presentations— yielded both statistical data and participant reflections on how participants access information about hazardous weather and what they do with it. While statistical data enabled researchers to understand how respondents typically responded to forecasts of hazardous weather and the information sources they sought, analysis of participant discourse and open-ended survey questions permitted insight into individual respondents’ reflections and thinking and to their collective responses when they encountered the products as a group.
A short list of research related to the methodology for this project follows below:
Glaser, B.G. and Strauss A. (1999). The discovery of grounded theory. New Brunswick, NJ: Transaction Publishers.
Johnson, R.B., & Onwuegbuzie, A.J. (2004). Mixed methods research: A research paradigm whose time has come. Educa-tional Researcher 33, pp. 14-26.
Kahn, H. (1962). Thinking about the Unthinkable. New York: Horizon Press, 254 p.
Lincoln, Y.S., and Guba, E.G. (1985). Naturalistic inquiry. Newbury Park, CA: Sage.
Patton, M. Q. (2002). Qualitative research & evaluation methods. (3rd Ed.) Thousand Oaks, CA: Sage.
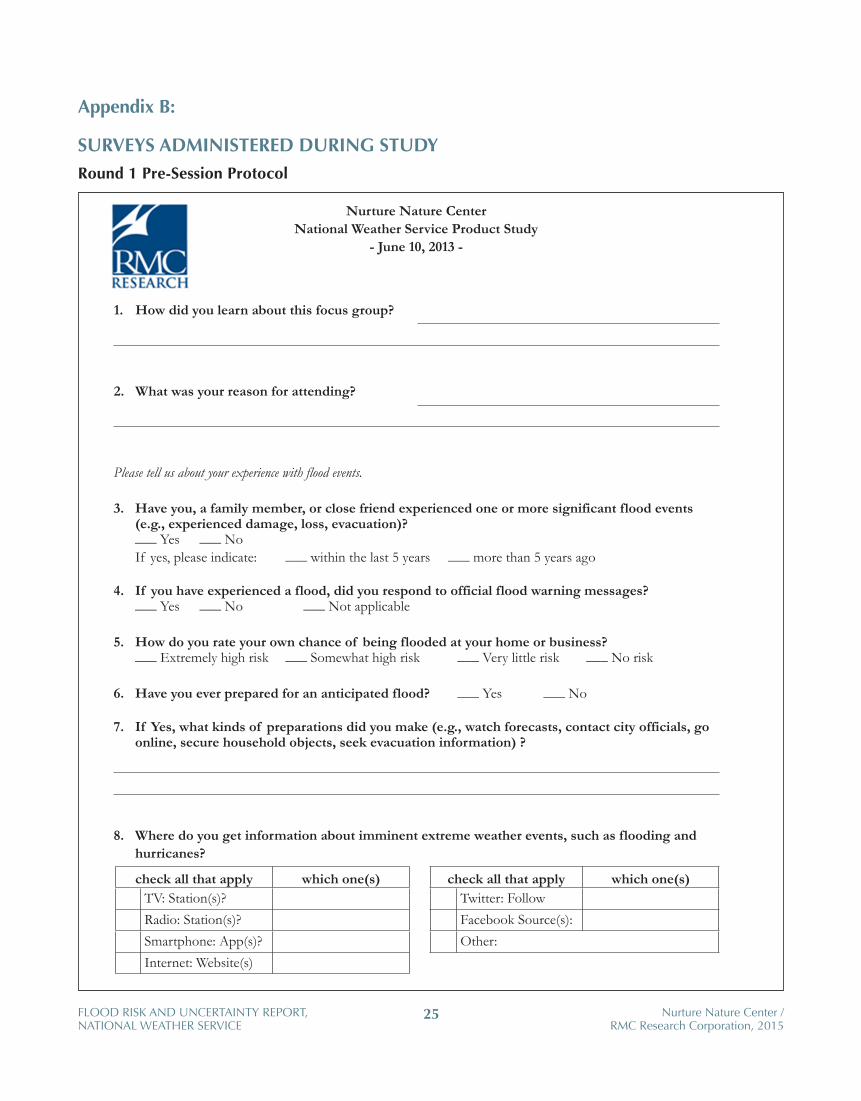
Nurture Nature CenterNational Weather Service Product Study
- June 10, 2013 -
1. How did you learn about this focus group?
2. What was your reason for attending?
Please tell us about your experience with flood events.
3. Have you, a family member, or close friend experienced one or more significant flood events (e.g., experienced damage, loss, evacuation)?___ Yes ___ No If yes, please indicate: ___ within the last 5 years ___ more than 5 years ago
4. If you have experienced a flood, did you respond to official flood warning messages? ___ Yes ___ No ___ Not applicable
5. How do you rate your own chance of being flooded at your home or business?___ Extremely high risk ___ Somewhat high risk ___ Very little risk ___ No risk
6. Have you ever prepared for an anticipated flood? ___ Yes ___ No
7. If Yes, what kinds of preparations did you make (e.g., watch forecasts, contact city officials, go online, secure household objects, seek evacuation information) ?
8. Where do you get information about imminent extreme weather events, such as flooding and hurricanes?
check all that applycheck all that apply which one(s) check all that applycheck all that apply which one(s)which one(s) TV: Station(s)? Twitter: Follow
Radio: Station(s)? Facebook Source(s):
Smartphone: App(s)? Other:Other:Other:
Internet: Website(s)
OVER
25 Nurture Nature Center /RMC Research Corporation, 2015
FLOOD RISK AND UNCERTAINTY REPORT, NATIONAL WEATHER SERVICE
Appendix B:
SURVEYS ADMINISTERED DURING STUDYRound 1 Pre-Session Protocol

9. Where do you get information about how to prepare for extreme weather events?
check all that applycheck all that apply which one(s) check all that applycheck all that apply which one(s)which one(s) TV: Station(s)? Twitter: Follow
Radio: Station(s)? Facebook Source(s):
Smartphone: App(s)? Other:Other:Other:
Internet: Website(s)
10. If you learn that a significant, hazardous weather is approaching your area, what do you typically do with that information?
Please check all that apply:
Discuss with family and friends
Seek further information
Contact local officials
Gather supplies
Other:
Please tell us about yourself.
11. Age: ___ under 20 ___ 20-29 ___ 30-39 ___ 40-49 ___ 50-59 ___ 60-69 ___ 70+
12. Gender: ___ Male ___ Female
13. Zip Code: _____________
14. Length of time living in the Delaware River Region:
___ under 1 year ___ 1-2 years ___ 3-5 years ___ 6-8 years ___ 8 or more years
15. Length of time living in Easton:
___ under 1 year ___ 1-2 years ___ 3-5 years ___ 6-8 years ___ 8 or more years
16. Do you currently live in a floodplain? _____ Yes _____ No _____ I don’t know
17. Highest level of education completed:
___ High School/GED ___ Associate’s degree or 2-year college degree
___ Bachelor’s degree or other 4-year college degree ___ Post graduate work
Thank you for participating. Your feedback is valuable.
26 Nurture Nature Center /RMC Research Corporation, 2015
FLOOD RISK AND UNCERTAINTY REPORT, NATIONAL WEATHER SERVICE
Round 1 Pre-Session Protocol (side 2)

Nurture Nature CenterNational Weather Service Product Study
June, 2013 - PM
1. Please rate your agreement with the following statements about the forum. Please check ONE box for each statement.
Strongly Agree Agree Disagree
Strongly Disagree
The information was clearly presented.
I felt comfortable voicing my opinion.
I know more about the National Weather Service (NWS) resources.
I feel I could use NWS resources to judge my risk in an extreme weather event.
2. What is the biggest barrier you face in possibly using NWS flood forecast and warning products?
3. Our goal today was to gather feedback to improve NWS flood forecast and warning tools. Beyond the questions asked today, what else would be important to know about how you gather information about extreme weather risks and your intended actions?
4. After attending today’s session, how likely are you to:
Please check ONE box for each statement.
Very LikelySomewhat
LikelySomewhat Unlikely Unlikely
Create or revise plans to deal with extreme weather events.
Share what I learned today with others.
Seek NWS information about extreme weather risks.
5. Do you prefer text-based or graphical/visual products in trying to understand your level of risk from flooding?
____ Text ____ Graphics ____ Combined text and graphics
Please explain why. ________________________________________________________________
OVER27 Nurture Nature Center /RMC Research Corporation, 2015
FLOOD RISK AND UNCERTAINTY REPORT, NATIONAL WEATHER SERVICE
Round 1 Post-Session Protocol

6. Of all the weather products discussed today, which would you use in order to learn about and prepare for extreme weather events?
Please rank in order of usefulness 1 = most useful and 9 = least.
Please rank in order of usefulness 1 = most useful and 9 = least.
Please explain why you ranked this product in this order.
National Hurricane Center ConeMid-Atlantic Region Forecast Center (MARFC) Significant Flood OutlookAdvanced Hydrologic Prediction Services (AHPS) Hydrograph
MARFC QPF
AHPS Flood Inundation Map
Weather Forecast Office (WFO) Flood Watch
WFO Flash Flood Warning
WFO Flood WarningMeteorological Model Ensemble River Forecasts (MMEFS): bar graph/ dot graph/ spaghetti graph
7. Which social media would you use to find information about the risk of flooding near you? Please check all that apply:___ Facebook ___ Twitter ___ Weather App:___________ Other:________________
8. Which social media would you use to find information about how to prepare for a flood? Please check all that apply: ___ Facebook ___ Twitter ___ Weather App:__________ ___ Other:________________
9. Which digital platform are you most likely to use to access NWS resources? ___ Smartphone ___ Tablet ___ Notebook ___ Laptop ___ Desktop ___Other: _____________
10. Was anything in the session confusing? ___ Yes ___ NoIf Yes, please explain:
11. What improvements could be made in the format or content?
12. Additional comments:
Thank you for participating!RMC Research Corporation
1000 Market Street, Building 2 Portsmouth, NH 03801 rmcportsmouth.com
Round 1 Post-Session Protocol (side 2)
28 Nurture Nature Center /RMC Research Corporation, 2015
FLOOD RISK AND UNCERTAINTY REPORT, NATIONAL WEATHER SERVICE

Nurture Nature Center
National Weather Service Product Study
Pre-Session Survey
December 6, 2013
1. How did you learn about this focus group?
_______________________________________________________________________________ ____________________________________________________________________________
2. What was your reason for attending?
______________________________________________________________________________________________________________________________________________________________
Please tell us about your experience with flood events.
3. Have you, a family member, or close friend experienced one or more significant flood events (e.g., experienced damage, loss, evacuation)?___Yes ___No
If yes, please indicate: ___within the last 5 years ___ more than 5 years ago
4. If you have experienced a flood, did you respond to official flood warning messages? ___Yes ___No ___Not applicable
5. How do you rate your own chance of being flooded at your home or business?Extremely high risk Somewhat high risk Very little risk No risk
6. Have you ever prepared for an anticipated flood? ___Yes ___No
7. If Yes, what kinds of preparations did you make? (e.g., watch forecasts, contact city officials, go online, secure household objects, seek evacuation information) ______________________________________________________________________________________________________________________________________________________________
8. Where do you get information about imminent extreme weather events, such as flooding and hurricanes? Please check all that apply. __TV: Station(s)? ____________________________________________________________
__Radio: Station(s)? ______________________________________________________
__Smartphone: App(s)? ______________________________________________________
__Internet: Website(s) ______________________________________________________
29 Nurture Nature Center /RMC Research Corporation, 2015
FLOOD RISK AND UNCERTAINTY REPORT, NATIONAL WEATHER SERVICE
Round 2 Pre-Session Protocol

__Twitter: Follow ____________________________________________________________
__Facebook: Source(s) ______________________________________________________
__Other: __________________________________________________________________
9. Where do you get information about how to prepare for extreme weather events? Please check all that apply and identify sources:
__TV: Station(s)? ____________________________________________________________
__Radio: Station(s)? __________________________________________________________
__Smartphone: App(s)? ________________________________________________________
__Internet: Website(s) ________________________________________________________
__Twitter: Follow____________________________________________________________
__Facebook: Source(s)_________________________________________________________
__Other: __________________________________________________________________
10. If you learn that a significant, hazardous weather is approaching your area, what do you typically do with that information?!Please check all that apply:
__Discuss with family and friends
__Seek further information
__Contact local officials
__Gather supplies
__Other ______________________________________________________
Please tell us about yourself.:
11. Age: ___under 20 ___20-29 ___30-39 ___40-49 ___50-59 ___60-69 ___70+
12. Gender: ___Male ___Female
13. Zip Code: __________
14. Length of time living in the Delaware River Region:
___under 1 year ___1-2 years ___3-5 years ___6-8 years ___8 or more years
15. Length of time living in [TOWN]:
___under 1 year ___1-2 years ___3-5 years ___6-8 years ___8 or more years
16. Do you currently live in a floodplain? _____Yes _____No _____I don’t know
17. Highest level of education completed:
___High School/GED ___Associate’s degree or 2-year college degree
___Bachelor’s degree or other 4-year college degree ___Post graduate work
Thank you for participating. Your feedback is valuable.
Round 2 Pre-Session Protocol (side 2)
30 Nurture Nature Center /RMC Research Corporation, 2015
FLOOD RISK AND UNCERTAINTY REPORT, NATIONAL WEATHER SERVICE

Nurture Nature Center
National Weather Service Product Study
Post-Session Survey
December 6, 2013
1. Please rate your agreement with the following statements about the forum. Please choose either “strongly agree,” “agree,” “disagree,” or “strongly disagree” for each statement.
Strongly Agree Agree Disagree
Strongly Disagree
The information was clearly presented.
I felt comfortable voicing my opinion.
I know more about the National Weather Service (NWS) resources. I feel I could use NWS resources to judge my risk in an extreme weather event.
2. What is the biggest barrier you face in possibly using NWS flood forecast and warning products? ________________________________________________________________________________________________________________________________
3. Our goal today was to gather feedback to improve NWS flood forecast and warning tools. Beyond the questions asked today, what else would be important to know about how you gather information about extreme weather risks and your intended actions? _________________________________________________________________________
4. After attending today’s session, how likely are you to:
Very Likely
Somewhat Likely
Somewhat Unlikely Unlikely
Create or revise plans to deal with extreme weather events.
Share what I learned today with others.
Seek NWS information about extreme weather risks.
5. Do you prefer text-based or graphical/visual products in trying to understand your level of risk from flooding? Text Graphics Combined text and graphics
Please explain why. ________________________________________________________
Round 2 Post-Session Protocol
31 Nurture Nature Center /RMC Research Corporation, 2015
FLOOD RISK AND UNCERTAINTY REPORT, NATIONAL WEATHER SERVICE

6. Of all the weather products discussed today, which would you use in order to learn about and prepare for extreme weather events? Please rank in order of usefulness, with 1 most useful and 9 least. ___National Hurricane Center Cone
__ Mid-Atlantic Region Forecast Center (MARFC) Significant Flood Outlook
__ Advanced Hydrologic Prediction Services (AHPS) Hydrograph
___MARFC QPF
___ AHPS Flood Inundation Map
___Weather Forecast Office (WFO) Flood Watch
___WFO Flash Flood Warning
___WFO Flood Warning
___Meteorological Model Ensemble River Forecasts (MMEFS): bar graph/ dot graph/spaghetti graph
Please explain why you ranked products in this order. ________________________________________________________________________
________________________________________________________________________
7. Which social media would you use to find information about the risk of flooding near you? Please check all that apply:
___Facebook ___Twitter ___Weather App:___________ Other:________________
8. Which social media would you use to find information about how to prepare for a flood? (please check all that apply: ___Facebook ___Twitter ___Weather App:___________ ___Other:________________
9. Which digital platform are you most likely to use to access NWS resources? ___Smartphone ___Tablet ___Notebook ___Laptop ___Desktop ___Other: _____________
10. Was anything in the session confusing? ___Yes ___NoIf Yes, please explain: ______________________________________________________________________________________________________________________________________________________________
11. What improvements could be made in the format or content?______________________________________________________________________________________________________________________________________________________________
12. Additional comments: ______________________________________________________________________________________________________________________________________________________________
Thank you for participating!RMC Research Corporation
1000 Market Street, Building 2 Portsmouth, NH 03801
Round 2 Post-Session Protocol (side 2)
32 Nurture Nature Center /RMC Research Corporation, 2015
FLOOD RISK AND UNCERTAINTY REPORT, NATIONAL WEATHER SERVICE

33 Nurture Nature Center /RMC Research Corporation, 2015
FLOOD RISK AND UNCERTAINTY REPORT, NATIONAL WEATHER SERVICE
Appendix C:
WORKS CITED
Cutter, S.L., Boruff, B.J., Shirley, W.L. (2003). Social vulnerability to environmental hazards. Social Science Quarterly 84, pp. 242-261.
Drobot, S.D., Benight, C. and Gruntfest, E.C. (2007). Risk factors associated with driving through flooded roads. Environmental Hazards 7, pp. 227-234.
Fothergill, A., & Peek, L.A. (2004). Poverty and disasters in the United States: A review of recent sociological findings. Natural Hazards 32, pp. 89-110.
Haynes, K., Coates, L., Leigh, R., Handmer, J., Whittaker, J., Gissing, A., Mcaneney, J., and Opper, S. (2009). ‘Shelter-in-place’ vs. evacuation in flash floods. Environmental Hazards 8(4), 291-303.
Kahn, H. (1962). Thinking about the Unthinkable. New York: Horizon Press, 254 p.
Leik, R., Carter, T. M., and Clark, J. (1981). Community response to natural hazard warnings: Final report. Final Report. University of Minnesota, Minneapolis.
Mileti, D. S., and Sorenson, J.H. (1990). Communication of emergency public warnings: A social science perspective and state of-the-art assessment. Oak Ridge National Laboratory Rep. ORNL-6609, 145 pp.
Phillips, B.D. and Morrow, B.H. (2007). Social science research needs: Focus on vulnerable populations, forecasting, and warnings. Natural Hazards Review 8, pp. 61-68.
Ruin, I., Gaillard, J.C., and Lutoff, C. (2007). How to get there? Assessing motorists’ flash flood risk perception on daily itineraries. Environmental Hazards 7, pp. 235-244.
Zahran, S., Brody, S.D., Peacock, W.G., Vedlitz, A., and Grover, H. (2008). Social vulnerability and the natural and built environment: A model of flood casualties in Texas. Disasters 32, pp. 537-560.

34 Nurture Nature Center /RMC Research Corporation, 2015
FLOOD RISK AND UNCERTAINTY REPORT, NATIONAL WEATHER SERVICE
Appendix D:
REPRESENTATIVE SUMMARY OF PRESENTATIONS
New Jersey Association of Floodplain Managers: Atlantic City, New Jersey, October 16, 2013
National Weather Association Annual Meeting: Charleston, South Carolina, October 2013.
Association of American Geographers Annual Meeting, Tampa, FL, April 8, 2014
Delaware River Basin Commission, Flood Advisory Committee: Easton, PA, November 6, 2014
American Meteorological Society: Atlanta, Georgia, February 3, 2014
World Weather Open Science Conference (WMO and Environment Canada): Montreal, Canada, August 18, 2014
PA Silver Jackets: Easton, Pennsylvania, April 24, 2014
NWS Eastern Region Managers Meeting, Bohemia, NY, by Peter Ahnert, Summer 2014.
Flash Flood Summit: Tuscaloosa, Alabama, September 8 to 11
NOAA Science Days: Silver Springs, MD and Washington, D.C., September 22 through 24, 2014 (7 Presentations total,
including 5 Congressional briefings).
New Jersey Association of Floodplain Managers: Atlantic City, NJ, Wednesday, October 15, 2014
Eastern Region NWS webinar, November 6, 2014. https://www.youtube.com/watch?v=PbLKcZ-i9B4&feature=youtube.
Western Region NWS webinar, November 18, 2014.
Pennsylvania Floodplain Managers, Oct. 1, 2014.
National Silver Jackets, webinar on November 12, 2014. http://www.nfrmp.us/state/webinars.cfm
Posters:
National Weather Association Annual Meeting: Charleston, South Carolina, October 2013.
NWS National Meeting of Warning Coordination Meteorologists and Service Coordination Hydrologists: NWS
Headquarters, Silver Spring, MD, June 2014.
Association of American Geographers Annual Conference: Los Angeles, CA, April 10, 2013.
American Meteorological Society Annual Conference: Austin, TX, January 7, 2013.