Embed Size (px)
Citation preview
FLOOD ON THE VIRGIN RIVER, JANUARY 1989,
IN UTAH, ARIZONA, AND NEVADA
By Darrell D. Carlson and David F. Meyer
U.S. GEOLOGICAL SURVEY
Water-Resources Investigations Report 94-4159
Salt Lake City, Utah 1995

U.S. DEPARTMENT OF THE INTERIOR
BRUCE BABBITT, Secretary
U.S. GEOLOGICAL SURVEY
Gordon P. Eaton, Director
For additional information write to: Copies of this report can be purchased from:
District Chief U.S. Geological SurveyU.S. Geological Survey Earth Science Information CenterRoom 1016 Administration Building Open-File Reports Section1745 West 1700 South Box 25286, MS 517Salt Lake City, Utah 84104 Denver Federal Center
Denver, Colorado 80225
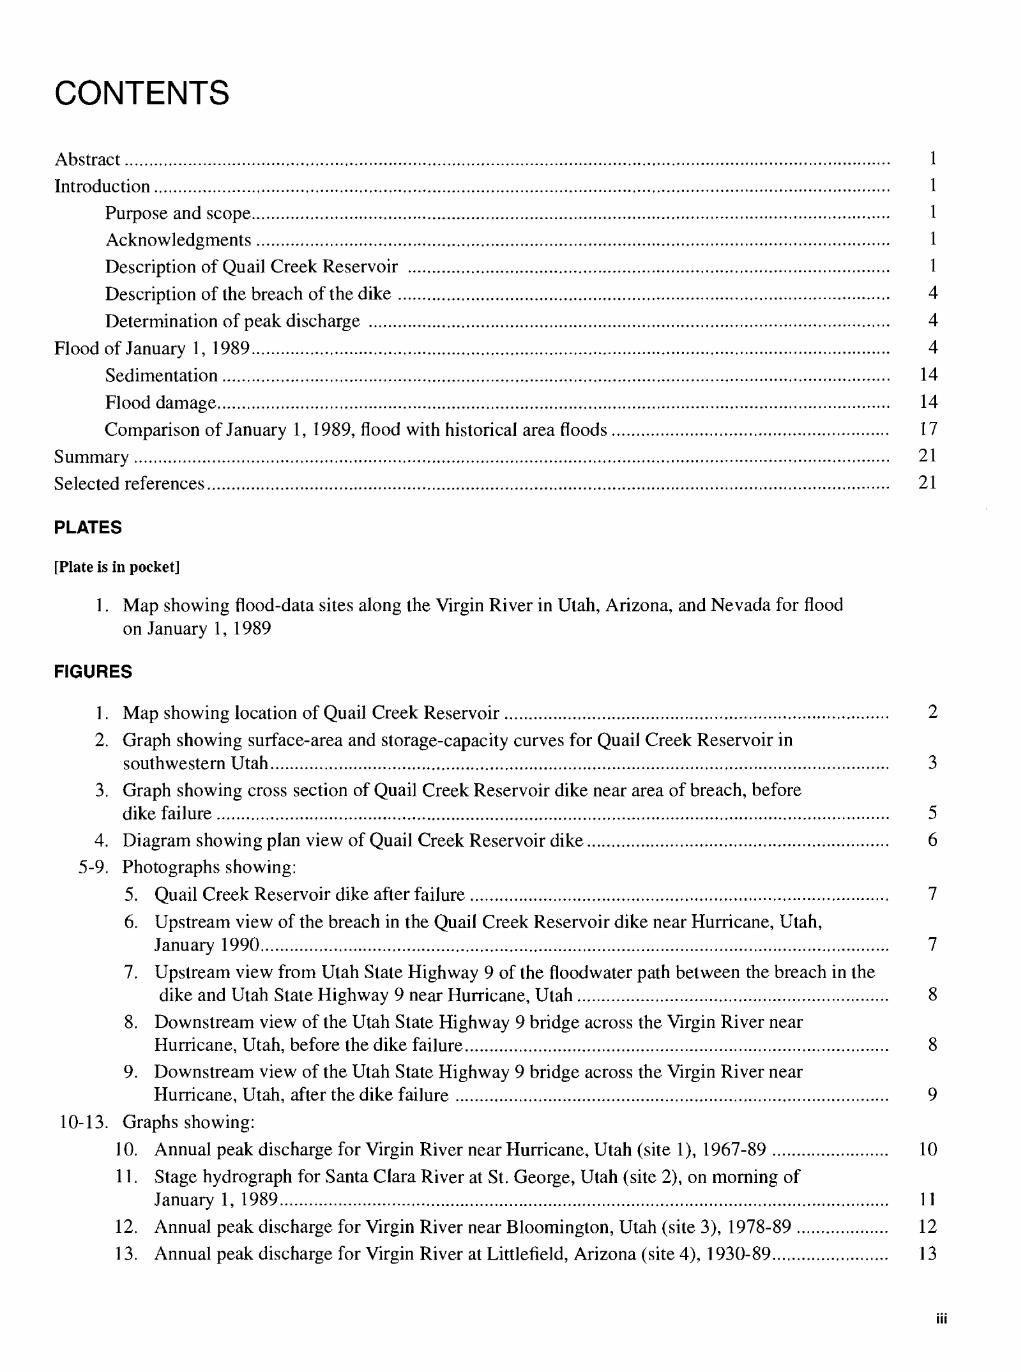
CONTENTS
Abstract............................................................................................................................................................. 1Introduction....................................................................................................................................................... 1
Purpose and scope................................................................................................................................... 1Acknowledgments.................................................................................................................................. 1Description of Quail Creek Reservoir ................................................................................................... 1
Description of the breach of the dike ..................................................................................................... 4
Determination of peak discharge ........................................................................................................... 4
Flood of January 1, 1989................................................................................................................................... 4
Sedimentation......................................................................................................................................... 14Flood damage.......................................................................................................................................... 14
Comparison of January 1, 1989, flood with historical area floods......................................................... 17Summary........................................................................................................................................................... 21Selected references............................................................................................................................................ 21
PLATES
[Plate is in pocket]
1. Map showing flood-data sites along the Virgin River in Utah, Arizona, and Nevada for flood on January 1, 1989
FIGURES
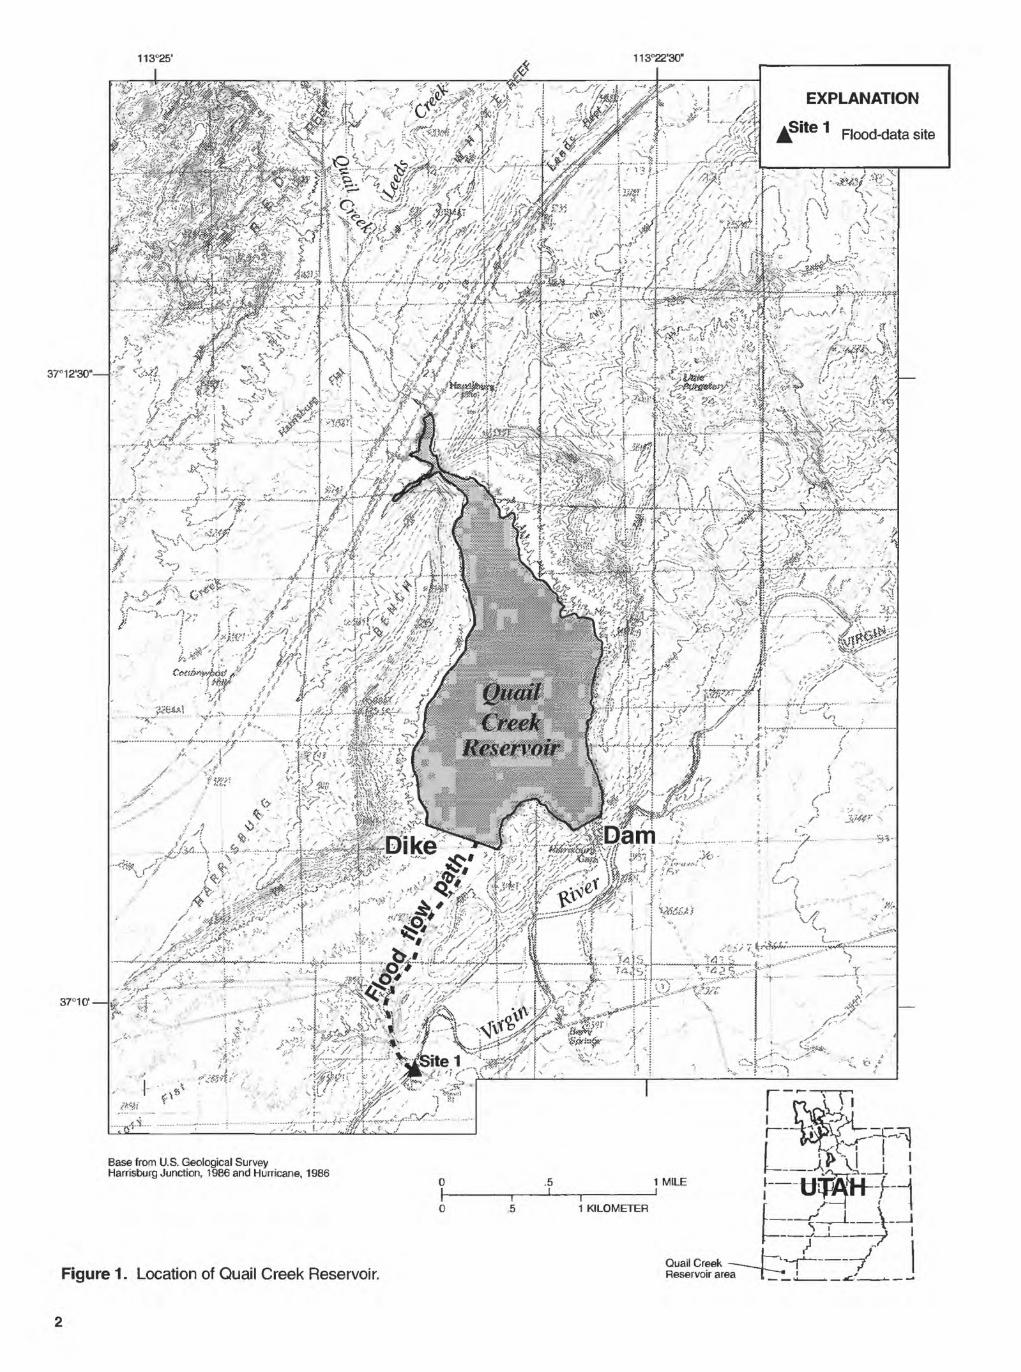
1. Map showing location of Quail Creek Reservoir ............................................................................... 2
2. Graph showing surface-area and storage-capacity curves for Quail Creek Reservoir insouthwestern Utah............................................................................................................................... 3
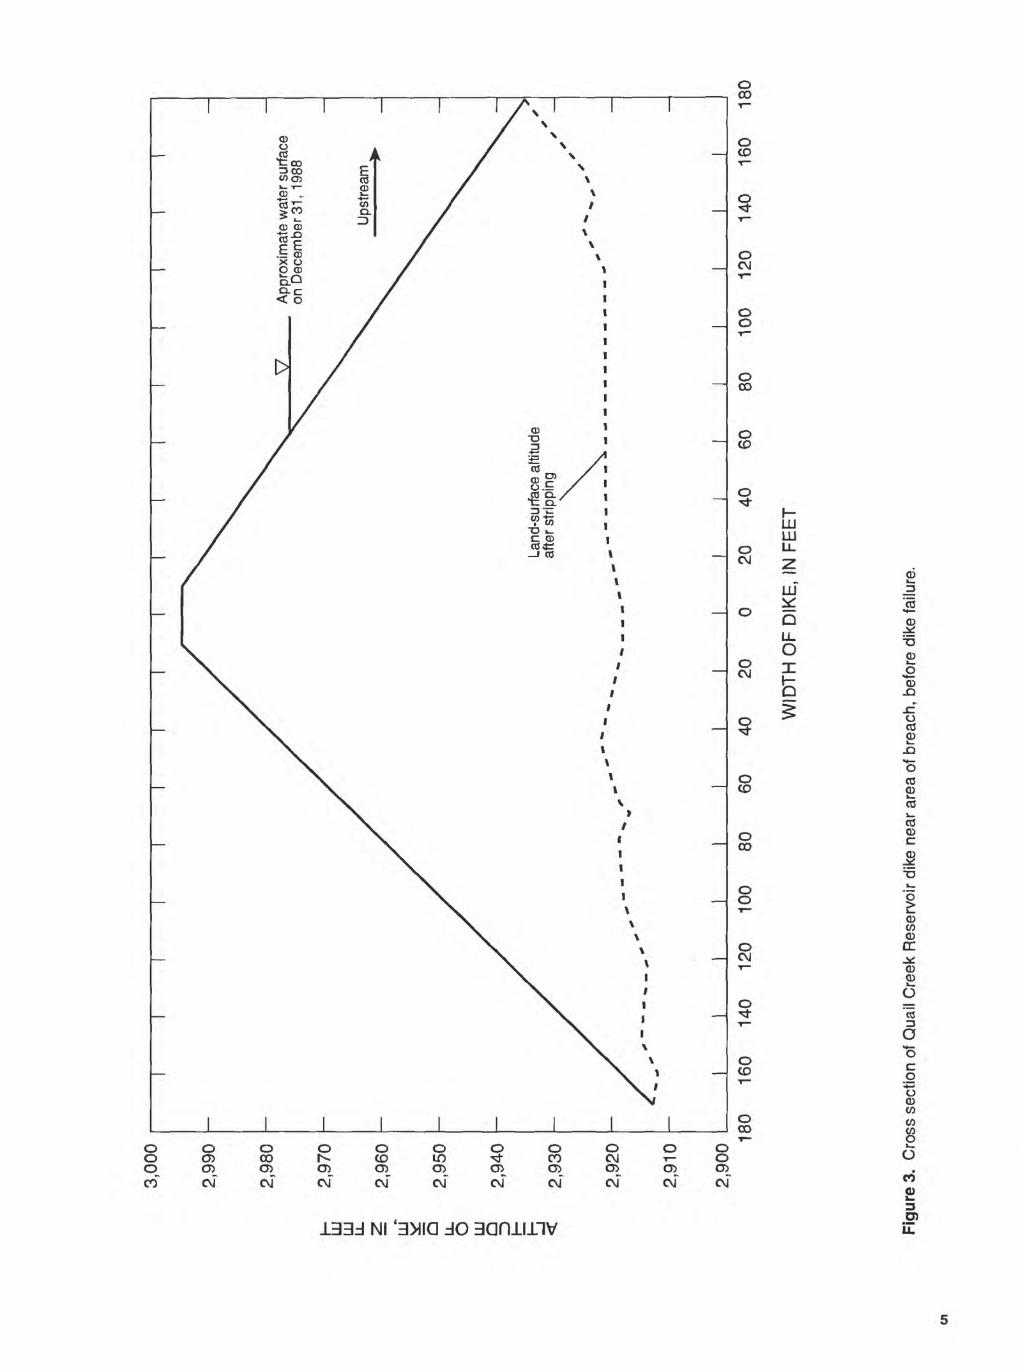
3. Graph showing cross section of Quail Creek Reservoir dike near area of breach, beforedike failure.......................................................................................................................................... 5
4. Diagram showing plan view of Quail Creek Reservoir dike.............................................................. 65-9. Photographs showing:
5. Quail Creek Reservoir dike after failure ...................................................................................... 7
6. Upstream view of the breach in the Quail Creek Reservoir dike near Hurricane, Utah,January 1990................................................................................................................................. 7
7. Upstream view from Utah State Highway 9 of the floodwater path between the breach in thedike and Utah State Highway 9 near Hurricane, Utah................................................................ 8
8. Downstream view of the Utah State Highway 9 bridge across the Virgin River nearHurricane, Utah, before the dike failure....................................................................................... 8
9. Downstream view of the Utah State Highway 9 bridge across the Virgin River nearHurricane, Utah, after the dike failure ......................................................................................... 9
10-13. Graphs showing:
10. Annual peak discharge for Virgin River near Hurricane, Utah (site 1), 1967-89 ........................ 10
11. Stage hydrograph for Santa Clara River at St. George, Utah (site 2), on morning ofJanuary 1, 1989............................................................................................................................. 11
12. Annual peak discharge for Virgin River near Bloomington, Utah (site 3), 1978-89 ................... 12
13. Annual peak discharge for Virgin River at Littlefield, Arizona (site 4), 1930-89........................ 13

FIGURES Continued
14-21. Photographs showing:
14. Deposition of sediment on an agricultural field near Washington, Utah, January 1990.............. 15
15. Headcutting near the Washington Fields diversion dam near Washington, Utah, January 1990 15
16. Erosion to downstream side of roadbed at approach to River Road bridge nearSt. George, Utah, January 1990.................................................................................................... 16
17. Eroded right bank of the Virgin River at site 5, Virgin River at Littlefield, Arizona,January 1990 ................................................................................................................................ 16
18. Upstream view of the washout of approach to Utah State Highway 9 bridge nearHurricane, Utah, January 1990 .................................................................................................... 18
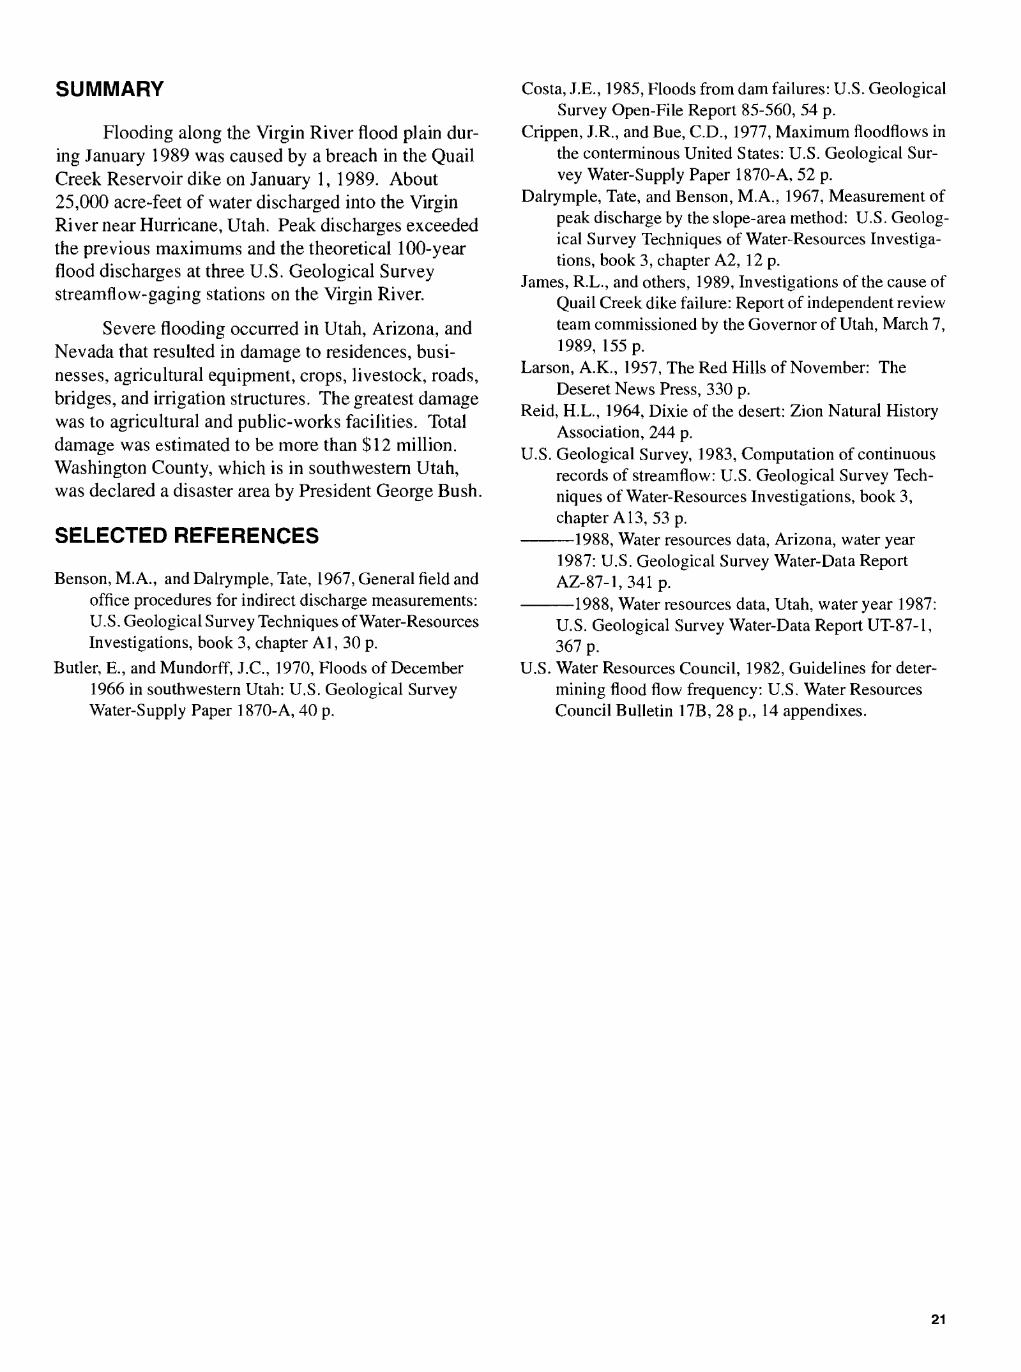
19. Upstream view of flood damage to River Road bridge near St. George, Utah, January 1990..... 18
20. Flood damage to Washington Fields diversion dam near Washington, Utah, January 1990........ 19
21. Upstream view of Washington Fields diversion dam and natural constriction in VirginRiver flood plain, Utah, January 1990.......................................................................................... 19
22. Graph showing relation of January 1989 peak discharge to maximum known flood peaks inthe Virgin River Basin area................................................................................................................. 20
TABLES
1. Summary of flood stages and discharges of January 1989 flood on the Virgin River........................ 9
2. Summary of flood damage in Utah, Arizona, and Nevada ................................................................ 17
CONVERSION FACTORS AND VERTICAL DATUM
____________Multiply_______________By______________To obtain________
acre 4,047 square meter
acre-foot (acre-ft) 1,233 cubic meter
cubic foot per second (ft /s) 0.02832 cubic meter per second
cubic yard (yd3) 0.7646 cubic meter
foot (ft) 0.3048 meter
foot per second (ft/s) 0.3048 meter per second
inch (in.) 25.4 millimeter
mile (mi) 1.609 kilometer-j
square mile (mi ) 2.59 square kilometer
Sea level: In this report, "sea level" refers to the National Geodetic Vertical Datum of 1929 a geodetic datum derived from a general adjustment of the first-order level nets of the United States and Canada, formerly called Sea Level Datum of 1929.

FLOOD ON THE VIRGIN RIVER, JANUARY 1989, IN UTAH, ARIZONA, AND NEVADA
By D.D. Carlson and D.F. Meyer
ABSTRACT
The impoundment of water in Quail Creek Res ervoir in southwestern Utah began in April 1985. The drainage area for the reservoir is 78.4 square miles, including Quail Creek and Leeds Creek watersheds. Water also is diverted from the Virgin River above Hur ricane, Utah, to supplement the filling of the reservoir.
A dike, which is one of the structures impound ing water in Quail Creek Reservoir, failed on January 1, 1989. This failure resulted in the release of about 25,000 acre-feet of water into the Virgin River near Hurricane, Utah.
Flooding occurred along the Virgin River flood plain in Utah, Arizona, and Nevada. The previous max imum discharge of record was exceeded at three U.S. Geological Survey streamflow-gaging stations, and the flood discharges exceeded the theoretical 100-year flood discharges. Peak discharge estimates ranged from 60,000 to 66,000 cubic feet per second at the three streamflow-gaging stations.
Damage to roads, bridges, agricultural land, live stock, irrigation structures, businesses, and residences totaled more than $12 million. The greatest damage was to agricultural and public-works facilities. Wash ington County, which is in southwestern Utah, was declared a disaster area by President George Bush.
INTRODUCTION
Water from Quail Creek drains into the Virgin River in southwestern Utah (pi. 1, fig. 1) and eventually flows into the Colorado River through the Overton Arm of Lake Mead. The impoundment of water in Quail Creek Reservoir began in 1985. Reservoir structures include a dam on Quail Creek and a separate dike in a topographically low area about 0.5 mi west of the dam.
Uses of Quail Creek Reservoir water include municipal and industrial supply, irrigation, power gen eration, and recreation. Flooding caused by failure of the dike on January 1, 1989, seriously affected 89 mi of the Virgin River valley in Utah, Arizona, and Nevada.
Purpose and Scope
The purpose of this report is to document the Jan uary 1, 1989, flood in the Virgin River Basin that was caused by failure of a dike in Quail Creek Reservoir in Utah. The report discusses characteristics of, and dam ages caused by, this flood, and includes information on the history of past floods in the Virgin River Basin.
Acknowledgments
The authors wish to acknowledge the assistance given by personnel of several agencies in the prepara tion of this report. Louis Ramirez of the Federal Emer gency Management Agency provided damage data, and Matthew Linden of the Utah Department of Natural Resources, Division of Water Rights, provided photo graphs and construction data for the dike.
Description of Quail Creek Reservoir
Quail Creek Reservoir in southwestern Utah (pi. 1) is owned and operated by the Washington County Water Conservancy District. Construction of the reservoir began in November 1983. The reservoir dike construction was completed in April 1984, and the dam, about 0.5 mi east of the dike, was completed in January 1985. Impoundment of water in the reservoir began in April 1985 (James and others, 1989).
The dike was a zoned earth embankment con structed on the Shnabkaib Member of the Moenkopi Formation (Triassic), which contains abundant gypsum deposits (James and others, 1989). The dike and dam crest altitude is 2,995 ft. The dam has an uncontrolled spillway with a crest altitude of 2,985 ft. The storage capacity of the reservoir at the spillway crest is 40,352 acre-ft (fig. 2). The surface area of the reservoir is 590 acres at the spillway crest altitude, and the average depth is about 68 ft.
Quail Creek and Leeds Creek contribute runoff to the reservoir. The total drainage area of the reservoir is 78.4 mi . Water also is diverted from the Virgin River
113°25
37°12'30"-
Base from U.S. Geological SurveyHarrisburg Junction, 19B6 and Hurricane, 1986
Figure 1. Location of Quail Creek Reservoir.
01 0 5
.51
1 KILOMETER
1 MILE j
Quail Creek Reservoir area
V

tD LU LU
LU tr
111 fee LLI
Q
100
200
SU
RF
AC
E A
RE
A,
IN A
CR
ES
300
400
500
10,0
00
20,0
0030
,000
40,0
0050
,000
600
700
Wat
er le
vel
on D
ecem
ber 3
1,19
88at
10:3
0PM
Wat
er le
vel
on J
anua
ry 1
,198
9at
1:0
0 PM
60,0
0070
,000
ST
OR
AG
E C
AP
AC
ITY
, IN
AC
RE
-FE
ET
Fig
ure
2.
Sur
face
-are
a an
d st
orag
e-ca
paci
ty c
urve
s fo
r Q
uail
Cre
ek R
eser
voir
in s
outh
wes
tern
Uta
h.

through a pipeline to the reservoir; the diversion dam is about 2 mi upstream from Hurricane, Utah (pi. 1).
Maximum dike height is about 80 ft, with a crest width of 20 ft and a length of nearly 2,000 ft. A typical cross section of the dike near the area of the breach is shown in figure 3, which was drawn from data in James and others (1989, figs. 2-5).
Description of the Breach of the Dike
Quail Creek Reservoir storage was about 35,000 acre-ft at a water-surface altitude of 2,976 ft on Decem ber 31, 1988. Seepage increased noticeably throughout the day, mainly at one location. Seepage through the dike began to substantially increase at 8:20 p.m. The leakage was estimated to be nearly 70 ft /s about 10:30 p.m., at which time the flow changed from a vertical to a horizontal direction and began to deteriorate the toe of the dike. A large part of the dike embankment sloughed in near the downstream toe of the dike between 11:00 p.m. and 11:30 p.m. As material was eroded, the embankment continued to slough in until the dike breached completely at about 12:30 a.m. on January 1, 1989.
The breach was estimated to be 140 ft wide and 80 ft deep (fig. 4). Land-surface altitude upstream of the breach was about 2,928 ft (fig. 3). Water was bypassing the 2,928-ft land-surface altitude on the right side because a small earthen dike was constructed in this area (fig. 5). Reservoir storage was about 10,000 acre-ft at an altitude of 2,922 ft; therefore, about 25,000 acre-ft of water spilled through the breach. Flow through the breach stopped about 1:00 p.m. on January 1, 1989 (James and others, 1989).
The path the water took after the dike breached is shown in figures 5, 6, and 7. The water entered the Virgin River at the Utah State Highway 9 bridge cross ing (fig. 1, site 1). Top soil was completely removed between the dike and the confluence with the Virgin River (fig. 6). In addition, it is estimated that about
o
75,000 yd of material were removed from the dike at the breach. Most of this material was deposited in the Virgin River channel at the Utah State Highway 9 bridge crossing (figs. 8 and 9).
Determination of Peak Discharge
The sudden breaching of the Quail Creek Reser voir dike did not allow sufficient time to obtain current- meter measurements of the flood; therefore, indirect
discharge measurements were made after the flood peak had passed. Indirect discharge measurements are com puted using established hydraulic principles based on channel geometry and the slope of the water surface within a given reach of a river (Benson and Dalrymple, 1967). Azimuth-stadia surveys of the channel geome try and high-water marks provide the data needed to theoretically compute discharge.
Indirect measurement methods were used to compute peak discharge at all sites on the Virgin River. Hydraulic conditions at three sites were not considered favorable for this type of measurement, so computa tions of peak discharge are considered to be estimates at site 1, Virgin River near Hurricane, Utah; site 3, Vir gin River near Bloomington, Utah; and site 5, Virgin River near Mesquite, Arizona.
FLOOD OF JANUARY 1,1989
The flood of January 1, 1989, along the Virgin River flood plain was caused by the failure of the Quail Creek Reservoir dike. The theoretical 100-year flood discharge was exceeded at three U.S. Geological Sur vey streamflow-gaging stations in the Virgin River Basin (table 1) during this flood.
The floodwater traveled about 1 mi before enter ing the Virgin River at the Utah State Highway 9 bridge crossing. The floodwater entered the Virgin River at an angle of about 90 degrees and destroyed the right approach to the bridge. The left bank of the Virgin River at the Utah State Highway 9 bridge crossing con sists of a high vertical bank made up of volcanic rock (fig. 8). Sediment deposition at the highway crossing (fig. 9) indicates that this bank dissipated a large quan tity of the energy associated with the translatory wave.
The floodwater diverged both upstream and downstream in the Virgin River. The slope in this reach of the Virgin River is about 20 ft/mi. The depth of water 1.5 mi downstream of the Utah State Highway 9 bridge crossing where the indirect measurement data was collected averaged 35 ft. Transferring this depth upstream to the bridge crossing, the effects of the flood would extend about 1.75 mi upstream of the Utah State Highway 9 bridge. The width of the channel upstream of the bridge averages 2,000 ft in this reach. The vol ume of water that filled the channel upstream of the bridge was estimated to be about 6,000 acre-ft. Chan nel storage between the bridge and the site of the indi rect measurement, 1.5 mi downstream, was estimated to be 4,000 acre-ft using an average depth of 35 ft and an average width of 700 ft.
tD LU LU Q
u_
O LLI
Q
3,00
0
2,99
0
2,9
80
2,97
0
2,9
60
2,9
50
2,9
40
2,9
30
2,9
20
2,91
0
2,9
00
Land
-sur
face
alti
tude
af
ter
strip
ping
II
II
II
II
V___
App
roxi
mat
e w
ater
sur
face
on
Dec
embe
r 31
,198
8
Ups
tream
I
180
160
140
120
100
80
6040
20
0 20
40
WID
TH
OF
DIK
E,
IN F
EE
T
60
80
100
120
140
160
180
Figu
re 3
. C
ross
sec
tion
of Q
uail
Cre
ek R
eser
voir
dike
nea
r ar
ea o
f br
each
, be
fore
dik
e fa
ilure
.

0 10
0 20
0 30
0 40
0 F
EE
T
5010
0 M
ET
ER
S
Figu
re 4
. Pl
an v
iew
of Q
uail
Cre
ek R
eser
voir
dike
.

Utah State Highway 9 Virgin River
Figure 5. Quail Creek Reservoir dike after failure. (Photograph from the Utah Department of Natural Resources. Division of Water Rights.)
Figure 6. Upstream view of the breach in the Quail Creek Reservoir dike near Hurricane, Utah, January 1990.

Figure 7. Upstream view from Utah State Highway 9 of the floodwater path between the breach in the dike and Utah State Highway 9 near Hurricane, Utah.
Figure 8. Downstream view of the Utah State Highway 9 bridge across the Virgin River near Hurricane, Utah, before the dike failure.

Figure 9. Downstream view of the Utah State Highway 9 bridge across the Virgin River near Hurricane, Utah, after the dike failure.
Table 1. Summary of flood stages and discharges of January 1989 flood on the Virgin River
[ . no data: >. greater than |
Maximum flood Flood previously of January
known 1989Stationnumber
Station name Period of Date(site number) record,
water year
09408150
09413000
09413200
09415000
Virgin River near
Hurricane. Utah ( 1 1
Santa Clara Riverat St. George. Utah <2i
Virgin River nearBloomington. L'tah (3i
Virgin River atLittlefield. Arizona (4i
Virgin River atMesquite. Arizona (5 1
1967-88 12-06-66
1951-56. U8-24-551984-88
1978-88 03-05-78
1930-88 12-06-66
Gage Discharge Dateheight (cubic feet(feet) per second)
17.34 20.100 01-01-89
10.02 4.200 01-01-89
17.000 01-01-89
15.66 35.200 01-01-89
Gage Discharge Recurrenceheight (cubic feet(feet) per second)
'66.000
10.49
25.48 '60.000
61.000
'43.000
interval(years)
>100
>100
>100
Estimated.
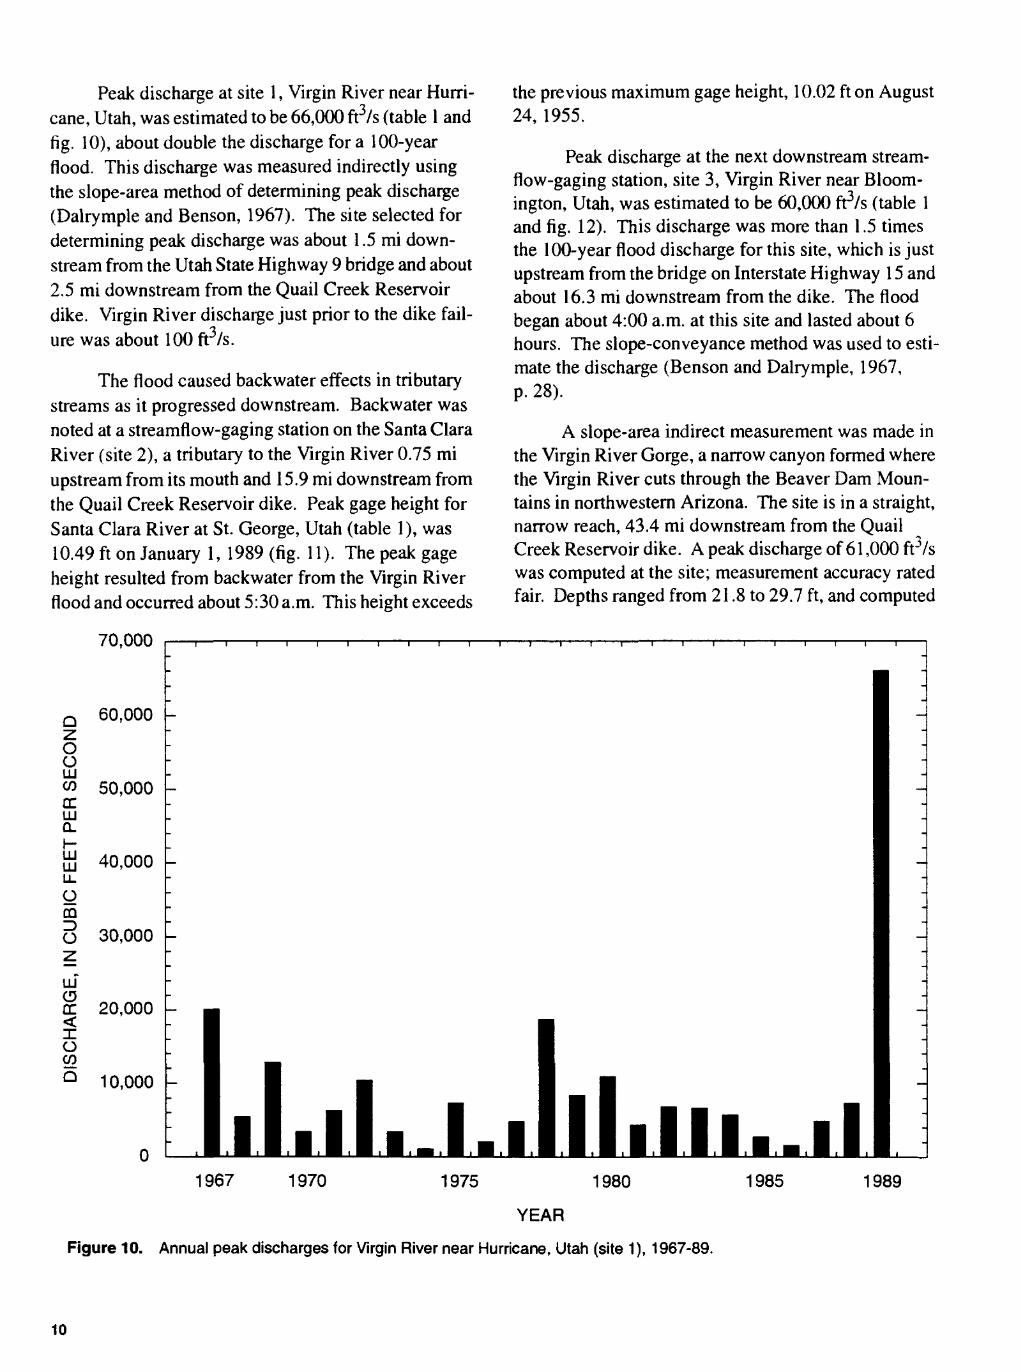
Peak discharge at site 1, Virgin River near Hurri cane, Utah, was estimated to be 66,000 ft3/s (table 1 and fig. 10), about double the discharge for a 100-year flood. This discharge was measured indirectly using the slope-area method of determining peak discharge (Dalrymple and Benson, 1967). The site selected for determining peak discharge was about 1.5 mi down stream from the Utah State Highway 9 bridge and about 2.5 mi downstream from the Quail Creek Reservoir dike. Virgin River discharge just prior to the dike fail ure was about 100 ft3/s.
The flood caused backwater effects in tributary streams as it progressed downstream. Backwater was noted at a streamflow-gaging station on the Santa Clara River (site 2), a tributary to the Virgin River 0.75 mi upstream from its mouth and 15.9 mi downstream from the Quail Creek Reservoir dike. Peak gage height for Santa Clara River at St. George, Utah (table 1), was 10.49 ft on January 1, 1989 (fig. 11). The peak gage height resulted from backwater from the Virgin River flood and occurred about 5:30 a.m. This height exceeds
the previous maximum gage height, 10.02 ft on August 24, 1955.
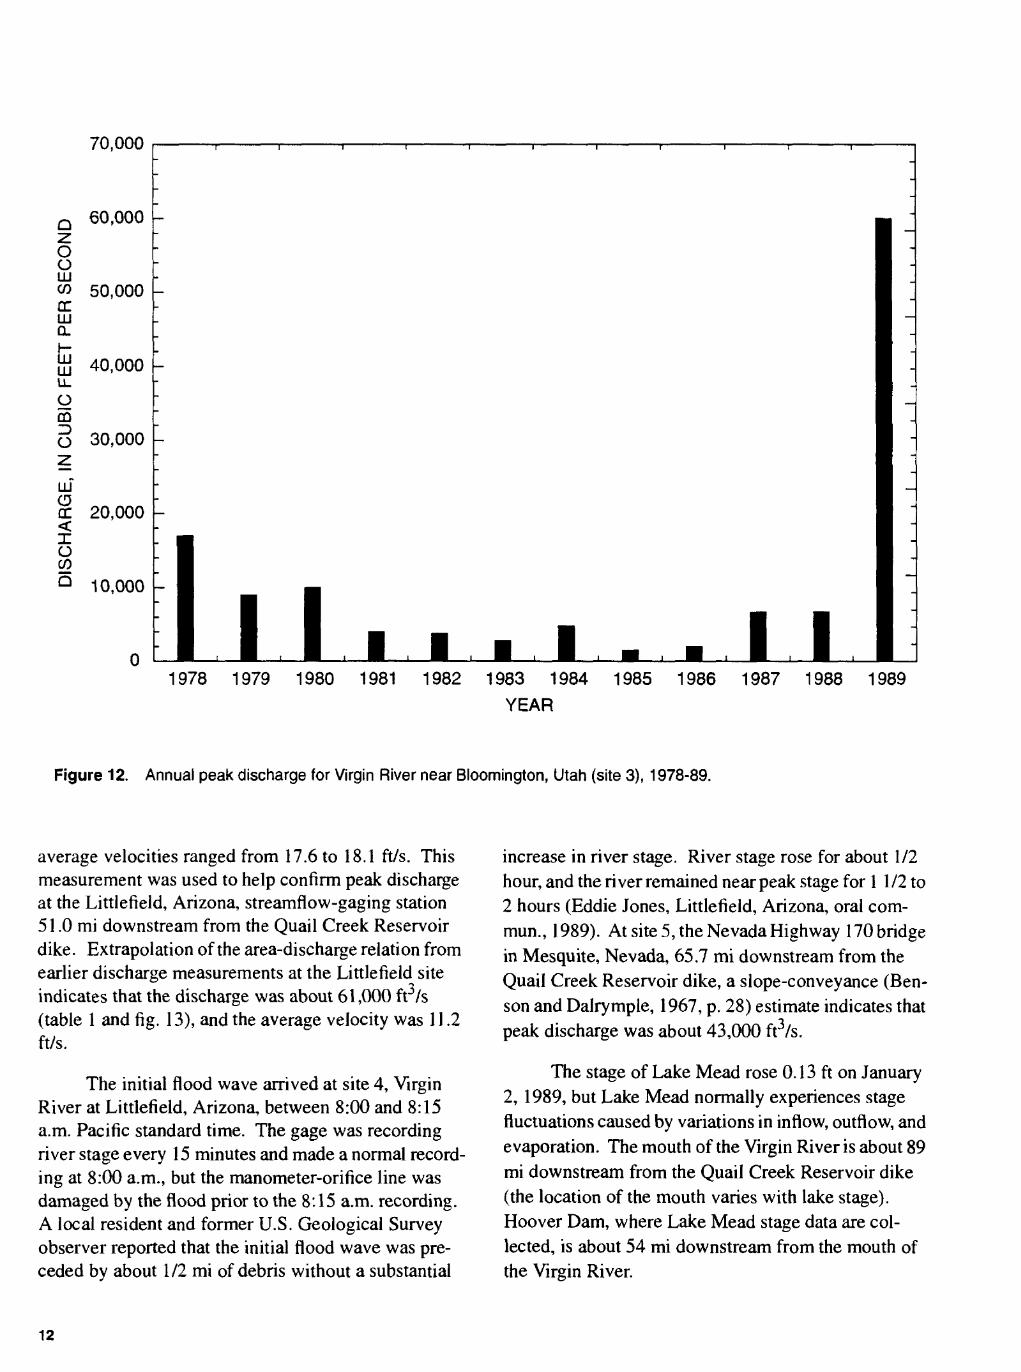
Peak discharge at the next downstream stream- flow-gaging station, site 3, Virgin River near Bloom- ington, Utah, was estimated to be 60,000 f^/s (table 1 and fig. 12). This discharge was more than 1.5 times the 100-year flood discharge for this site, which is just upstream from the bridge on Interstate Highway 15 and about 16.3 mi downstream from the dike. The flood began about 4:00 a.m. at this site and lasted about 6 hours. The slope-conveyance method was used to esti mate the discharge (Benson and Dalrymple, 1967, p. 28).
A slope-area indirect measurement was made in the Virgin River Gorge, a narrow canyon formed where the Virgin River cuts through the Beaver Dam Moun tains in northwestern Arizona. The site is in a straight, narrow reach, 43.4 mi downstream from the Quail Creek Reservoir dike. A peak discharge of 61,000 ft3/s was computed at the site; measurement accuracy rated fair. Depths ranged from 21.8 to 29.7 ft, and computed
70,000
Q 60,000
50,000
.o owDC 111 Q.Huj 40,000LL
O CO
O 30,000
tilCC 20,000<
O 03
Q 10,000
1967 1970 1975 1980
YEAR
Figure 10. Annual peak discharges for Virgin River near Hurricane, Utah (site 1), 1967-89.
1985 1989
10

I I I I I I I I I
4:30 5:00 5:30 6:00 6:30 7:00 7:30 8:00 8:30 9:00 9:30 10:00 10:30 11:00
TIME, IN HOURS
Figure 11. Stage hydrograph for Santa Clara River at St. George, Utah (site 2), on morning of January 1, 1989.
11
70,000
Q 60,000
O O
w 50,000CC LUo. H LU 40,000LL
OcoO 30,000
LU
a: 20,000XoCO
Q 10,000
I I -. I I1978 1979 1980 1981 1982 1983 1984 1985 1986 1987 1988 1989
YEAR
Figure 12. Annual peak discharge for Virgin River near Bloomington, Utah (site 3), 1978-89.
average velocities ranged from 17.6 to 18.1 ft/s. This measurement was used to help confirm peak discharge at the Littlefield, Arizona, streamflow-gaging station 51.0 mi downstream from the Quail Creek Reservoir dike. Extrapolation of the area-discharge relation from earlier discharge measurements at the Littlefield site indicates that the discharge was about 61,000 ft/s (table 1 and fig. 13), and the average velocity was 11.2 ft/s.
The initial flood wave arrived at site 4, Virgin River at Littlefield, Arizona, between 8:00 and 8:15 a.m. Pacific standard time. The gage was recording river stage every 15 minutes and made a normal record ing at 8:00 a.m., but the manometer-orifice line was damaged by the flood prior to the 8:15 a.m. recording. A local resident and former U.S. Geological Survey observer reported that the initial flood wave was pre ceded by about 1/2 mi of debris without a substantial
increase in river stage. River stage rose for about 1/2 hour, and the river remained near peak stage for 1 1/2 to 2 hours (Eddie Jones, Littlefield, Arizona, oral com- mun., 1989). At site 5, the Nevada Highway 170 bridge in Mesquite, Nevada, 65.7 mi downstream from the Quail Creek Reservoir dike, a slope-conveyance (Ben- son and Dalrymple, 1967, p. 28) estimate indicates that peak discharge was about 43,000 ft3/s.
The stage of Lake Mead rose 0.13 ft on January 2, 1989, but Lake Mead normally experiences stage fluctuations caused by variations in inflow, outflow, and evaporation. The mouth of the Virgin River is about 89 mi downstream from the Quail Creek Reservoir dike (the location of the mouth varies with lake stage). Hoover Dam, where Lake Mead stage data are col lected, is about 54 mi downstream from the mouth of the Virgin River.
12

(Q
3
GO
D D C
T3 CDffl
Q. S'
ZT ffl
(3CD3"
<<3'
D
CD
S>isi'
oQJ
CO COcp cioCO
DISCHARGE, IN CUBIC FEET PER SECOND
m

Sedimentation
Sedimentation, including erosion, headcutting, channel degradation, deposition, and other physical processes, was readily evident in the first 50 miles of the Virgin River downstream from the failed dike and was present, but less evident, all the way to the river's mouth. No quantitative sediment data were collected during this event.
The topsoil was completely eroded between the dike and the Utah State Highway 9 bridge where the flood entered the Virgin River (fig. 6). Most of this top- soil, along with the eroded dike material, was deposited at the Utah State Highway 9 bridge crossing over the Virgin River and blocked a large part of the bridge opening (fig. 9).
The main channel of the Virgin River was unable to contain the flood; therefore, the floodwater was forced out onto the flood plain. The velocity of the water decreased across the flood plain, causing sedi ment to be deposited (fig. 14).
Headcutting also occurred during this flood. The headcut near the Washington Fields diversion dam was about 10 ft deep (fig. 15).
Erosion of roadbeds from Hurricane, Utah, to Bloomington, Utah, occurred during this flood (fig. 16). Some degradation of the Virgin River channel occurred at the Man-of-War bridge. The scour at this bridge was severe enough to expose the piles under two of the piers.
The flood redistributed bed material, but net sed imentation was negligible in the Virgin River Gorge. A local resident reported that sand and gravel bars were altered and moved by the flood and that debris and riparian vegetation were eroded. The low-water chan nels were similar in size and shape before and after the flood (James Miller, Virgin River Canyon Recreation Area, oral commun., 1989).
Downstream from the Virgin River Gorge, at the Littlefield streamflow-gaging station (site 4), discharge measurements made before and after the flood indicate that the channel filled about 0.10 ft, with mostly sand. The flood plain at Littlefield had areas of aggradation and degradation. Flood-plain deposits from the flood were more than 10 ft thick in backwater areas, but where floodwater overflowed the channel on the out side of meander bends, several feet of scour was indi cated by erosion of an A-frame cableway foundation. Medium- to fine-grained sand dunes that had average
amplitudes of about 3 ft and average lengths of about 50 ft were deposited on the flood plain here.
An irrigation ditch occupied the right bank (out side bank of the meander) at the Littlefield gage prior to January 1, 1989. Photographs of the gage taken follow ing the flood of December 6, 1966, indicate that at that time a pipe or aqueduct existed along the right bank. Fill was placed along this bank between 1966 and 1987 about 25 ft from the bank and about 25 ft high. The Jan uary 1, 1989, flood eroded about 20 ft of this fill at the gage (fig. 17), including beam-and-cable bank protec tion along the irrigation ditch.
Downstream from Littlefield, Nevada, vertical scour and bank erosion became progressively less severe. At Mesquite, Nevada, banks without vegetation are rare, and where they are present, tree roots indicate that no more than 10 ft of bank erosion occurred during the January 1, 1989, flood. Near-channel flood-plain deposits decrease in thickness downstream from about 1 ft at Mesquite to about 0.3 ft near the mouth of the Virgin River.
Flood Damage
President George Bush declared Washington County in Utah a disaster area on January 31, 1989, qualifying the area for Federal funds. Flood damage estimates were compiled by several State and Federal agencies and were made available by the Federal Emer gency Management Agency (John Swanson, written commun., 1989). Substantial losses were incurred because of damage to private, public, and agricultural facilities. Estimated damage in Utah, Arizona, and Nevada from the January 1989 flood totaled more than $12 million and is listed in table 2. The greatest dam age was to agricultural and public-works facilities.
Businesses and residences in the towns of St. George and Bloomington, Utah, incurred substantial damage. About 30 homes in Bloomington, Utah, sus tained some degree of flood damage. Fifty-eight apart ments were affected by floodwater in St. George, Utah. Cost for flood-related damages to private-sector prop erty in St. George and other communities was estimated to be nearly $1.5 million.
Damage to public property also was substantial. The Utah State Highway 9 bridge near Hurricane (fig. 9) had to be replaced, and the approach roadway to the bridge was washed out (fig. 18). The River Road bridge near St. George, Utah, was completely washed out (fig. 19). The Interstate Highway 15 bridge near St. George
14

Figure 14. Deposition of sediment on an agricultural field near Washington. Utah, January 1990.
Figure 15. Headcutting near the Washington Fields diversion dam near Washington, Utah. January 1990.
15
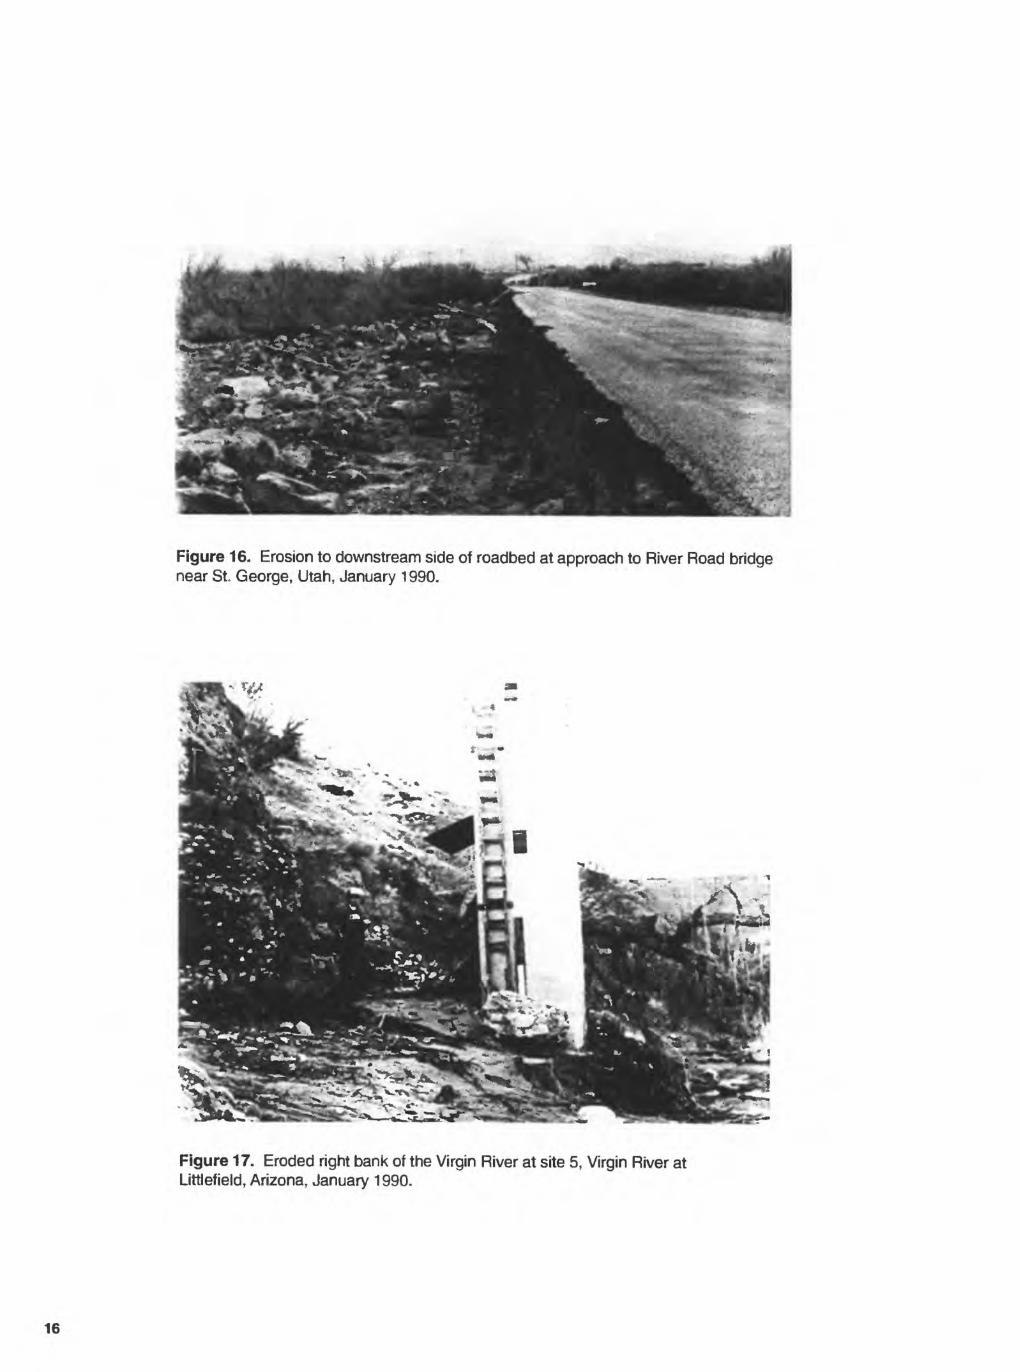
Figure 16. Erosion to downstream side of roadbed at approach to River Road bridge near St. George, Utah, January 1990.
».«*.
Figure 17. Eroded right bank of the Virgin River at site 5. Virgin River at Littlefield, Arizona, January 1990.
16

Table 2. Summary of flood damage in Utah, Arizona, and Nevada
[*, indicates some damage occurred but was not quantified]
Type of damage Utah Arizona Nevada
Private damage: Residential Business
Subtotal
$ 848,000 589,500
1,437,500
$81,000 0
81,000
Agricultural damage:EquipmentCrop lossLivestock lossMiscellaneous
SubtotalPublic damage:
Road systemsPublic utilitiesDebris removalProtective measuresWater-control facilitiesMiscellaneous
SubtotalTotal
670,0001,110,000
70,000250,000
2,100,000
3,121,000347,700
12,500110,100
5,257.40012,100
8,860,80012,398,300
0***
230,000
0*
0*
30
12,000
12,000123,000
0**
'$90,000
90,000
0000
335,0000
35,000125,000
1 Pierre, Labarry, Agricultural Stabilization and Conservation Service, oral commun. (1989).2 Estimated damage, Steve Cassady, [U.S.] Soil Conservation Service, oral commun. (1989).
Many of the irrigation works that serve Nevada have their headworks in Arizona; these are included with Nevada damage.
and the Man-of-War bridge at Bloomington, Utah, were damaged. The Washington Fields diversion dam was completely destroyed (fig. 20). This diversion dam was relocated to the present site in January 1891 after a pile dam about 5 mi downstream was swept away by the floods of January 1889 (Reid, 1964). The present site was selected in 1889 to allow the natural constriction in the flood plain to form part of the dam (fig. 21). A solid rock ledge creates part of this constriction on the north side of the Virgin River. Irrigation utilities in Utah incurred losses amounting to more than $5 million, including the estimated cost to repair the dike, add a more extensive cutoff trench for the dike, and repair other irrigation utilities.
The agricultural community sustained damage to crops, equipment, and livestock. About 450 acres of farmland sustained crop damage. Livestock losses included 130 pigs and 40 mature cows. The total esti mate for agricultural damages in Utah was more than $2 million.
The flood plain in Arizona and Nevada is much less developed than in Utah, and damage in these states was substantially less (table 2). Two houses in Little- field were inundated; one was destroyed, and the other was damaged but repairable. Agricultural fields (mainly alfalfa and pasture) were inundated, buried, and eroded by the flood (fig. 14). Fences were damaged and an unknown, but minor, number of livestock were drowned. Irrigation utilities serving Mesquite, River side, and Bunkerville, Nevada, were destroyed both at the headworks in Arizona, and along canals inundated or eroded by the flood.
Comparison of January 1,1989, Flood with Historical Area Floods
The relation between the January 1989 flood dis charge and greatest known flood discharge in the same area is shown in figure 22. This figure relates discharge to the corresponding drainage area, and the curve defines the limit of the largest documented floods.
17
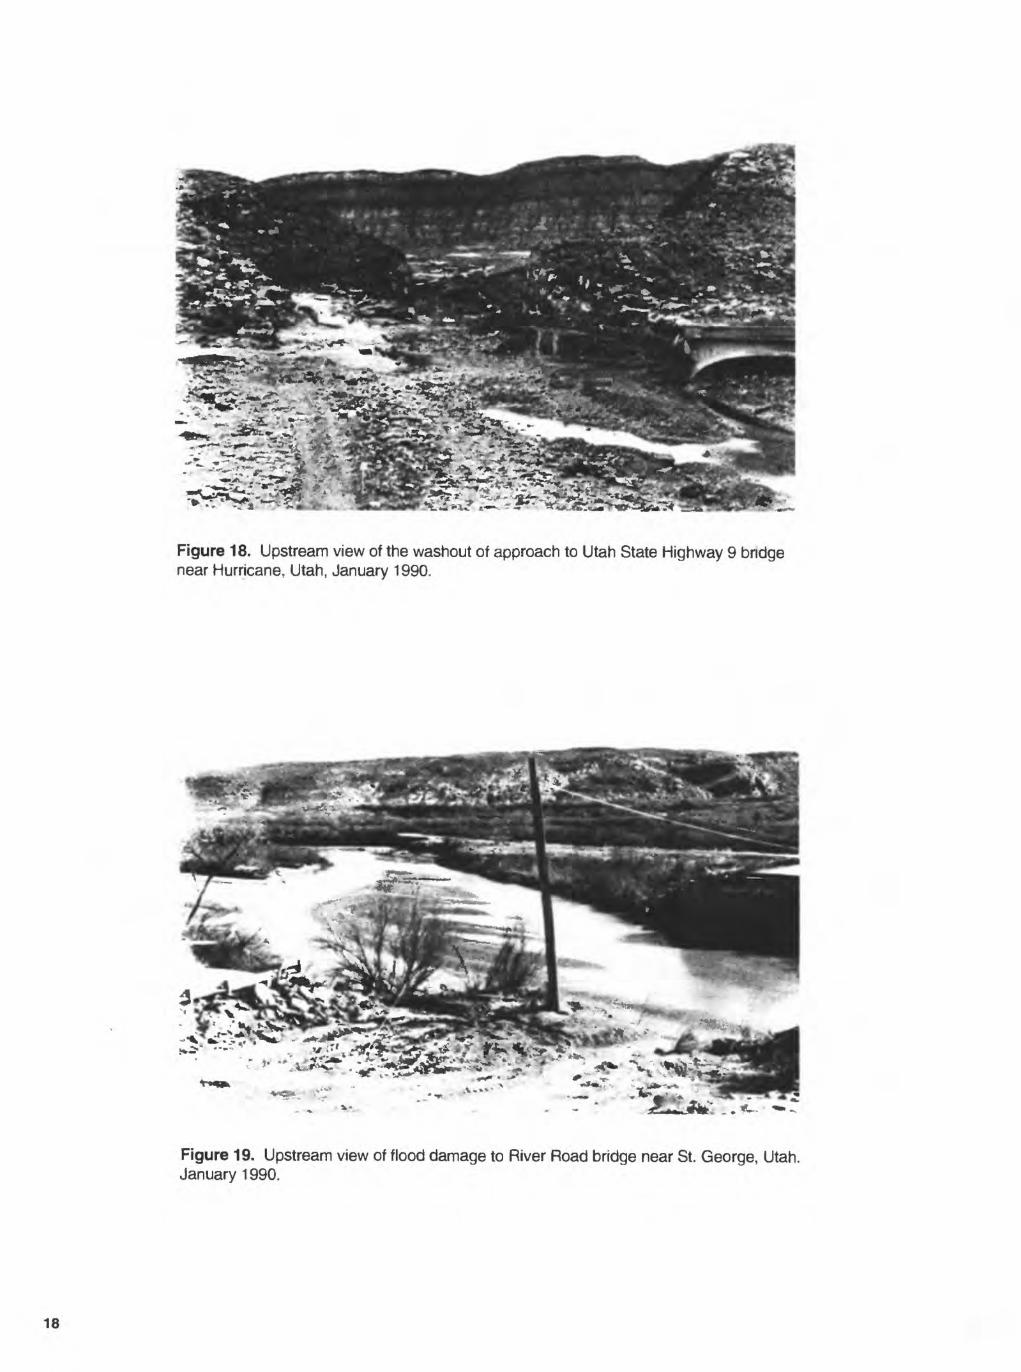
Figure 18. Upstream view of the washout of approach to Utah State Highway 9 bridge near Hurricane, Utah, January 1990.
* * * ,_ - - ....-» »««.,-.» ;_u»»-^ - f^B*-..«- -
Figure 19. Upstream view of flood damage to River Road bridge near St. George, Utah. January 1990.
18

Figure 20. Flood damage to Washington Fields diversion dam near Washington, Utah, January 1990.
Figure 21 . Upstream view of Washington Fields diversion dam and natural constriction in Virgin River flood plain, Utah, January 1990.
19

100,000
o oLJJ CO
LJJ LJJ LL
oCQ1) o
LJJoDC<I oCO Q
10,000
1,000
100
I 1 1 I I I I I I T 1 I I I I I I I I I I I I I I I I I I I I I I I
x Maximum discharge previously known
1 Maximum discharge during January 1989- number corresponds to site in table 1
i i i i i i i i I i i i i i i i i i i i i i i i i i i i i i i i i i i i i i i i
0.1 1.0 10 100
DRAINAGE AREA, IN SQUARE MILES
1,000 10,000
Figure 22. Relation of January 1989 peak discharge with maximum known flood peaks in the Virgin River Basin area.
Floods resulting from unusual conditions such as ice jams or dam breaks were not used to develop this figure (Crippen and Bue, 1977), which is presented here only to give the reader an idea of the historical flooding that has occurred in this general area. The January 1, 1989, flood can be compared with other floods caused by dam failures (Costa, 1985).
The first reported major flooding of the Virgin River occurred during December 25, 1861, to January 8,1862, along the Virgin and Santa Clara Rivers (Reid, 1964). Most of the towns and irrigation diversions along the Virgin River were damaged or destroyed (Larson, 1957). Another flood of unknown magnitude destroyed irrigation diversions during December 1889 (Larson, 1957).
A flood occurred March 3, 1938, that had a peak discharge of 22,000 ft3/s, measured at Littlefield, Ari zona. No other gages were in operation at that time.
The largest flood for which discharge measure ments or estimates exist occurred on December 6,1966.
This flood resulted from an intense rainfall that affected Utah, Nevada, and California (Butler and Mundorff, 1970). Peak discharge was 20,100 ft3/s measured near Hurricane, Utah, and 35,200 ft3/s measured at Little- field, Arizona. The recurrence interval for these dis charges ranges from 30 years at the Hurricane site to 60 years at the Littlefield site.
A series of storms during early March 1978 pro duced floodflow throughout the Virgin River Basin. The Virgin River peaked at a discharge of 18,700 ft3/s at Hurricane, Utah, on March 5; 17,000 ft3/s at Bloom- ington, Utah, on March 5; and 22,000 ft3/s at Littlefield, Arizona, on March 2.
These previous floods were natural occurrences resulting from rainfall or snowmelt runoff. No peaks were augmented by dams breaching or similar occur rences. Annual peak discharge prior to the January 1, 1989, flood for streamflow-gaging stations in the Virgin River Basin is shown in figures 10, 12, and 13.
20
SUMMARY
Flooding along the Virgin River flood plain dur ing January 1989 was caused by a breach in the Quail Creek Reservoir dike on January 1, 1989. About 25,000 acre-feet of water discharged into the Virgin River near Hurricane, Utah. Peak discharges exceeded the previous maximums and the theoretical 100-year flood discharges at three U.S. Geological Survey streamflow-gaging stations on the Virgin River.
Severe flooding occurred in Utah, Arizona, and Nevada that resulted in damage to residences, busi nesses, agricultural equipment, crops, livestock, roads, bridges, and irrigation structures. The greatest damage was to agricultural and public-works facilities. Total damage was estimated to be more than $12 million. Washington County, which is in southwestern Utah, was declared a disaster area by President George Bush.
SELECTED REFERENCES
Benson, M.A., and Dalrymple, Tate, 1967, General field and office procedures for indirect discharge measurements: U.S. Geological Survey Techniques of Water-Resources Investigations, book 3, chapter Al, 30 p.
Butler, E., and Mundorff, J.C., 1970, Floods of December 1966 in southwestern Utah: U.S. Geological Survey Water-Supply Paper 1870-A, 40 p.
Costa, J.E., 1985, Floods from dam failures: U.S. Geological Survey Open-File Report 85-560, 54 p.
Crippen, J.R., and Bue, C.D., 1977, Maximum floodflows in the conterminous United States: U.S. Geological Sur vey Water-Supply Paper 1870-A, 52 p.
Dalrymple, Tate, and Benson, M.A., 1967, Measurement of peak discharge by the slope-area method: U.S. Geolog ical Survey Techniques of Water-Resources Investiga tions, book 3, chapter A2, 12 p.
James, R.L., and others, 1989, Investigations of the cause of Quail Creek dike failure: Report of independent review team commissioned by the Governor of Utah, March 7, 1989, 155 p.
Larson, A.K., 1957, The Red Hills of November: The Deseret News Press, 330 p.
Reid, H.L., 1964, Dixie of the desert: Zion Natural History Association, 244 p.
U.S. Geological Survey, 1983, Computation of continuous records of streamflow: U.S. Geological Survey Tech niques of Water-Resources Investigations, book 3, chapter A13, 53 p.
1988, Water resources data, Arizona, water year 1987: U.S. Geological Survey Water-Data Report AZ-87-1, 341 p.
1988, Water resources data, Utah, water year 1987:U.S. Geological Survey Water-Data Report UT-87-1, 367 p.
U.S. Water Resources Council, 1982, Guidelines for deter mining flood flow frequency: U.S. Water Resources Council Bulletin 17B, 28 p., 14 appendixes.
21