Embed Size (px)
Citation preview

1
FLOOD HAZARD AND RISK ASSESSMENT IN MID-
EASTERN PART OF DHAKA, BANGLADESH
Muhammad MASOOD∗∗∗∗ Supervisor: Prof. Kuniyoshi TAKEUCHI
∗∗∗∗∗∗∗∗
MEE07180
ABSTRACT
An inundation simulation has been done for the mid-eastern Dhaka (37.16 km
2) on the basis of Digital
Elevation Model (DEM) data from Shuttle Radar Topography Mission (SRTM) and the observed flood
data for 32 years (1972-2004). The topography of the project area has been considerably changed due to rapid land-filling by land developers. So, collected DEM data has been modified according to the
recent satellite image. The inundation simulation has been conducted using HEC-RAS program for
100 year flood. Both present natural condition and condition after construction of proposed levee (top elevation ranges from 8.60 m to 9.00 m) have been considered for simulation. The simulation has
revealed that the maximum depth is 7.55 m at the south-eastern part of that area and affected area is
more than 50%.
Finally, according to the simulation result, a Flood Hazard Map has been prepared using the software ArcGIS. And risk assessment has been done and a Risk Map has been prepared for this area.
Keywords: Inundation simulation, Flood Hazard, Risk Map
INTRODUCTION
Dhaka is the largest and densely populated city in Bangladesh. The main natural hazards affecting
Dhaka include floods, which are associated with river water overflow and rain water stagnation. In fact it is observed that some 60% of the Greater Dhaka East area regularly goes under water every year
between June and October due to lack of flood protection in that area.
In 1991, JICA and ADB conducted feasibility study on this area. And in 2006, Halcrow Group Limited, UK, have done a study for updating/upgrading the Feasibility Study of Dhaka Integrated
Flood Control Embankment. They divided the whole eastern part of Dhaka into three compartments.
They proposed some structural measures which includes construction of embankment, flood wall, pump station and buildup of some pond area. But non-structural measures like preparation of Flood
hazard map has not included. In this paper, middle part (compartment-2) is selected as study area and
the main objective of this study is to do Flood hazard and risk assessment of that area.
DATA
For this study two types of data have been used. Topographic data which includes DEM (Fig. 1),
satellite image (Fig. 2) and river cross-section and hydrologic data covering rainfall, discharge and
water level etc. And two software are used; ArcGIS (ESRI, 1999) for DEM data processing & mapping and HEC-RAS (Hydrologic Engineering Center, 2002) for hydrologic simulation.
∗ Assistant Engineer, Bangladesh Water Development Board (BWDB), Bangladesh. ∗∗ Director, International Centre for Water Hazard and Risk Management (ICHARM), PWRI, Japan.

2
METHODOLOGY
The methodology can be divided into three phases: Preparation Phase, Execution Phase and
Verification & Flood Hazard Mapping Phase (Flow chart shown in Fig. 3). Some important steps of these phases have been briefly described below.
Geo-referencing and Projection
Collected Satellite image has been Geo-referenced according to the geographic coordinate system
(GCS_WGS_1984). DEM was also in geographical coordinate system. Geographic coordinate systems
indicate location using longitude and latitude based on a sphere (or spheroid) while projected coordinate systems use X and Y based on a plane. Projections manage the distortion that is inevitable
when a spherical earth is viewed as a flat map. Projected coordinate system used for this study is
WGS_1984_UTM_Zone_45N which is suitable for Bangladesh.
DEM Modification
Grid resolution of collected DEM data is 90 m. The average width of the Balu river (passes through the study area) is around 100 m. So it is difficult to find elevation value on the river path line in that 90
m resolution DEM data. Another problem I faced was that the obtained DEM data was based on
satellite image of year 2000. After that, a lot of land development work have been completed in this area which is observed in recent satellite image. So the DEM has been modified according to current
topography. The steps are briefly described below.
1. In DEM, elevation values are integer format. So the DEM has been converted to float format.
2. The 90 m DEM has been re-sampled to 30 m resolution DEM using Bilinear interpolation method.
Fig. 1 Digital Elevation Model
(DEM) of study area Fig. 2 Satellite Image of the study area
3
3. Then the DEM data through the
river path has been extracted and
converted into ASCII format and finally modified the
elevation according to actual
cross-section of the river in Microsoft Excel.
4. The DEM data of land filled
area has also been extracted by
observing recent satellite image and then raised the elevation.
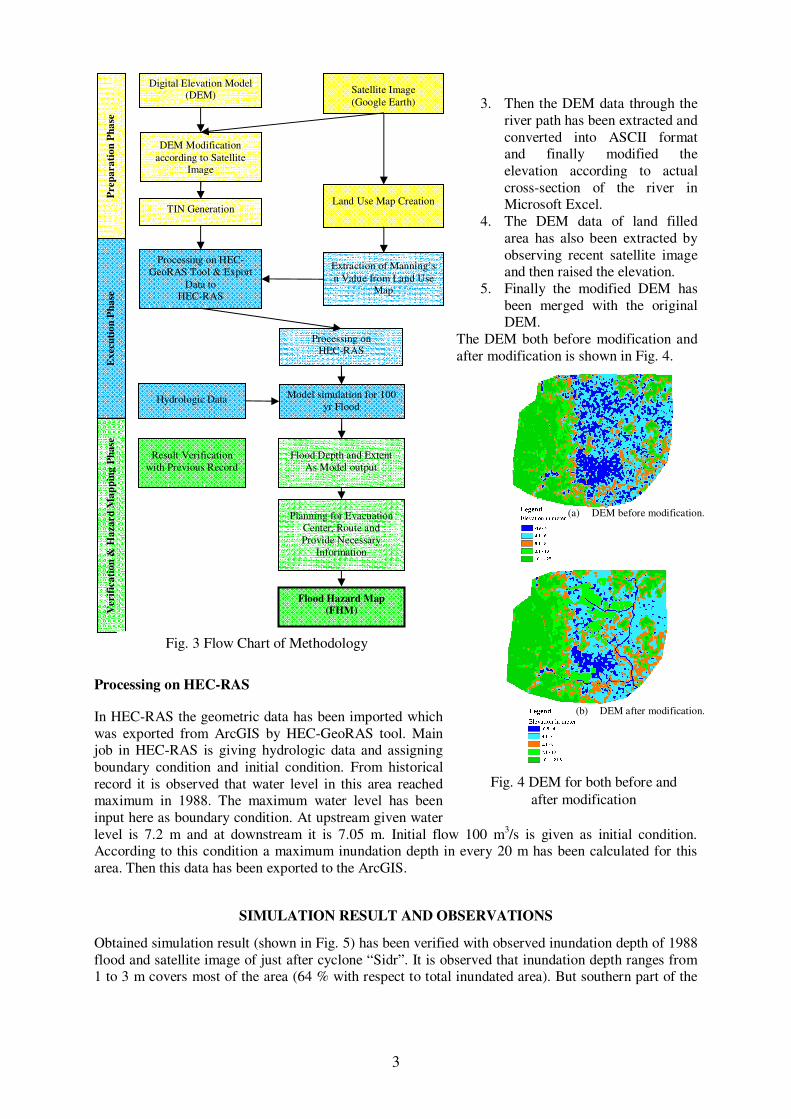
5. Finally the modified DEM has
been merged with the original DEM.
The DEM both before modification and
after modification is shown in Fig. 4.
Processing on HEC-RAS
In HEC-RAS the geometric data has been imported which
was exported from ArcGIS by HEC-GeoRAS tool. Main job in HEC-RAS is giving hydrologic data and assigning
boundary condition and initial condition. From historical
record it is observed that water level in this area reached maximum in 1988. The maximum water level has been
input here as boundary condition. At upstream given water
level is 7.2 m and at downstream it is 7.05 m. Initial flow 100 m3/s is given as initial condition.
According to this condition a maximum inundation depth in every 20 m has been calculated for this
area. Then this data has been exported to the ArcGIS.
SIMULATION RESULT AND OBSERVATIONS
Obtained simulation result (shown in Fig. 5) has been verified with observed inundation depth of 1988
flood and satellite image of just after cyclone “Sidr”. It is observed that inundation depth ranges from 1 to 3 m covers most of the area (64 % with respect to total inundated area). But southern part of the
Digital Elevation Model (DEM)
Satellite Image
(Google Earth)
DEM Modification
according to Satellite Image
Land Use Map Creation
Extraction of Manning’s
n Value from Land Use Map
Model simulation for 100
yr Flood
Processing on HEC-RAS
Hydrologic Data
TIN Generation
Flood Hazard Map (FHM)
Flood Depth and Extent
As Model output
Result Verification
with Previous Record
Planning for Evacuation
Center, Route and
Provide Necessary
Information
Processing on HEC-
GeoRAS Tool & Export
Data to HEC-RAS
Prep
ara
tio
n P
ha
se
Ex
ecu
tio
n P
ha
se
Verif
ica
tio
n &
Ha
za
rd
Ma
pp
ing
Ph
ase
Fig. 3 Flow Chart of Methodology
Fig. 4 DEM for both before and
after modification
(b) DEM after modification.
(a) DEM before modification.

4
study area is relatively low-lying where inundation depth is more than 3 m. However, buildup area
located in western part is mostly unaffected due to higher topography. Percentage inundated area in
the study area (compartment-2 shown in encircled by red line) is 54.5 %. Result obtained from this
analysis is presented in Table 1.
Table 1 Percentage area inundated according to
varying inundation depth
Inundation
Depth
Inundat
ed area
(sq. km)
% with
respect to
total
inundated
area
% with
respect
to
whole
area
4 m or higher 1.09 5 3
3 to less than 4 m 3.33 16 9
2 to less than 3 m 7.01 35 19
1 to less than 2 m 5.84 29 16
Less than 1 m 2.97 15 8
Total 20.24 100 54.5
FLOOD HAZARD MAPPING AND RISK ASSESSMENT
Preparation of Flood Hazard Map
A Flood Hazard Map has been prepared using the inundation status which was found from hydrologic
simulation, as shown in Fig. 6. According to inundation depth the whole area has been divided into five categories. Some evacuation centers have been
proposed in the high area. Some important places
such as hospital and police box have been marked in this map which are identified from satellite image.
Risk Assessment
The risk faced by people must be seen as a cross-
cutting combination of vulnerability and hazard.
Disasters are a result of the interaction of both; there cannot be a disaster if there are hazards but
vulnerability is (theoretically) nil, or if there is a
vulnerable population but no hazard event (Wisner
B. ; Blaikie P. ; Cannon T. and Davis I., 2004). These three elements: risk (R), vulnerability (V), and
hazard (H), can be written in a simple form:
(1)
Risk Map
In this study an attempt has been taken to make a
Risk Map. Risk index has been calculated by
multiplying vulnerability and hazard index. Average depth of inundation has been assigned as hazard
index. And for calculating vulnerability index,
R = H x V
About Flood Hazard Map
This Flood Hazard Map
shows inundation areas and depths based on a simulation
for 100 year flood.
1
2
3
4
6
5
Legend 2 1
1 Evacuation
Hospital
Police Box
Fig. 5 Inundation status obtained from Simulation
Fig. 6 Flood Hazard Map of Mid-eastern part
of Dhaka

5
Table 3 Area classification according to Risk Index
percentage of area covered with house/living place and agricultural land have been considered. The
followed steps are described below:
1. The whole study area has been divided into 300m - 300m block. Total number of block is 624.
2. For calculating average inundation depth in each block, obtained 20m-20m resolution inundation map has been re-sampled to 300m resolution using Bilinear interpolation method.
3. For each block an integer value ranging from 0 to 5 has been assigned as a Hazard index
according to inundation depth (shown in (Table 2).
4. For Vulnerability index, a value ranging from
0 to 10 has been calculated for each block. Weight factor 10 and 2 used for area covered
by house and agricultural land respectively.
Equation 2 has been used for calculating
Vulnerability Index.
Table 2 Assigned Hazard Index (H) for varying
inundation depth
Inundation Depth Hazard Index
(H)
No inundation 0
Less than 1 m 1
1 to less than 2 m 2
2 to less than 3 m 3
3 to less than 4 m 4
4 m or more 5
5. A Risk index for each block has been
calculated by multiplying Hazard and
Vulnerability index (Equation 3). 6. Then these Risk values have been converted
to raster format and imported to ArcGIS.
7. A Risk Map (Fig. 7) has been prepared by
classifying into three categories: Low, Medium
and High risk area according to Risk index (Table 3).
Risk Index Level of Risk
1 to less than 5 Low risk area
5 to less than 10 Medium risk area
More than 10 High risk area
V Index =
10 x A House + 2 x A Agriculture + 0 x A No Use
A Total
V Index = Vulnerability Index ( ranging from 0 to 10 ) Where
A House = Area Covered by House/Living Place
A Agriculture = Area Covered by Agricultural Land
A No Use = Area used for neither Living nor Agricultural
A Total = Total Area of each Block
(2)
R Index = H Index x V Index
R Index = Risk Index ( ranging from 0 to 50 ) Where
H Index = Hazard Index ( ranging from 0 to 5 )
V Index = Vulnerability Index ( ranging from 0 to 10 )
(3)
Fig 7 Risk Map of Mid-eastern part of Dhaka

6
CONCLUSION
It is observed in Risk Map that high risk zone covers very few areas and it is located mostly near river
bank and in transitional zone between western built up area and low-lying area. In this area risk is high because, area coverage with houses is high this means population density is also high in the area. High
risk area represents the area where people are more exposed to hazard than those living in other
locations. It is observed that western built up area is completely risk-free though the area is densely populated.
There is no inundation in this area and it means risk index is zero. Southern area where inundation
depth is maximum, falls in medium risk category though no people living there. Because this area mostly covered by agricultural field.
RECOMMENDATION
The objective of Flood Hazard Map is to provide residents with the information on the range of
possible damage and the disaster prevention activities. The effective use of Hazard Map can decrease the magnitude of disasters. From the resident point of view, it is an effective tool to reduce flood
damage. On the other hand, Flood Risk Map represents the current scenario of that area according to
degree of risk. This is very much useful for government. By using it government can prioritize some area according to degree of risk. In emergency, government can take necessary steps as soon as
possible according to priority basis. As land development and urbanization is going on that area both
maps should be updated regularly. The following recommendations are made for upgrading these
maps: 1. Rainfall, evaporation, percolation which are ignored in current study can be included for
further studies.
2. Town watching, conversation with local people and survey are very important work for making an effective Flood Hazard Map. But this work could not be performed for this study.
For future studies this should be conducted.
3. For risk mapping, Hazard index has been assigned according to inundation depth. But other
factors such as frequency of flood, duration of flood, etc. should be considered. For assigning Vulnerability index, two factors such as percentage of area covered with house and
agricultural field have been considered. But there are lots of factors other than that responsible
for degree of vulnerability which should be considered for future studies.
ACKNOWLEDGEMENT
I would like to express my sincere gratitude to Prof. Kuniyoshi TAKEUCHI, Director, International
Centre for Water Hazard and Risk Management (ICHARM), PWRI, Japan for his continuous support,
valuable suggestion and guidance during my study.
REFERENCES
ESRI, 1999, http://www.esri.com/software/arcgis/index.html
Halcrow Group Ltd, 2006, Briefing Report on Updating/Upgrading the Feasibility Study of Dhaka
Integrated Flood Control cum Eastern Bypass Road Multipurpose Project. Hydrologic Engineering Center, 2002, HEC-RAS (Version 3.1.2), River Analysis System, User's
Manual, U.S. Army Corps of Engineers (USACE), Davis, CA.
Wisner B. ; Blaikie P. ; Cannon T. and Davis I., 2004, At Risk, Natural hazard, people’s vulnerability
and disasters, 2nd
edition, Routledge Taylor & Francis Group.