Embed Size (px)
Citation preview

December 13, 2010
Flood Awareness & Preparedness Survey
Research Findings

About the Survey• Prepared for King County by Cocker Fennessy, Inc. for the King
County Department of Natural Resources and Parks.
• Follow up survey to benchmark 2009 survey of Green River flood preparedness & awareness conducted for the King County Flood Control District.
• 2009 survey conducted to provide information about, and assess awareness of, the increased flood risk due to operational changes at the Howard Hanson Dam; assess outreach effectiveness; and assess current level of preparedness.
2

Objectives• Assess public awareness & concern of flood risk
• Identify actions residents are taking to prepare
• Determine communication practices and preferences
• Provide information about Howard Hanson Dam situation and flooding risk
• Compare to 2009 baseline
3

Methodology
• Telephone survey (n=753) of residents in Cedar, Green, Snoqualmie and White River basins (not entire county)
• Quotas and weighting to reflect regional demographics
• Margin of error +/- 3.6% at 95% confidence interval
• Survey fielded November 8-17, 2010
4

Respondents in the Cedar, Green, Snoqualmie and White River basins completed the telephone survey.
5
Responses by Zipcode, per shaded area

A majority (57%) are not concerned about flooding. Findings are consistent with 2009 results.
6
57%
31%
12%
54%
29%15%
1%
Not concerned Somewhat concerned
Very concerned Don't know
Q6. With regard to floods, would you say you are…
2010
2009(Cedar, Green, White &Snoqualmie River Basins)
(Green River Basin)

7
Not Concerned Somewhat Concerned Very ConcernedMaleIncome >$30KCollege degreeWhiteSingle-family homeLow risk of flooding1 or more miles from river,Do not live in a flood plainLive in the Cedar River basinNo flood insurance
Under $30KNon-WhiteMedium or high risk of floodingSnoqualmie , Green and White River basinsLive in a flood plain
Under $30KNon-WhiteNot in a single-family homeHigh risk of floodingGreen or Snoqualmie River basinsLive in a flood plainHave flood insurance
Those with incomes less than $30,000 per year, people who are non-White and those in non-single family homes are among the most concerned about flooding.
Flooding ConcernStatistically significant cross-tabulations

7 in 10 feel they live in an area with a low risk of flooding.
8
70%
16% 13%1%
75%
10% 6% 9%
Low risk Medium risk High risk Don't know
Q7. To the best of your knowledge, how would you describe the level of risk for flooding in the
area where you live?2010
2009(Cedar, Green, White &Snoqualmie River Basins)
(Green River Basin)

Respondents in the Snoqualmie River basin are significantly more likely to say “high risk.”
88%
9%3%
58%
11%
30%
1%
68%
21%
9%2%
Low risk Medium risk High risk Don't know
Q7. To the best of your knowledge, how would you describe the level of risk for flooding in the area where you live?
(Responses by River Basin)CEDAR SNOQUALMIE GREEN/WHITE

10
Low Risk Medium Risk High RiskMale$50K+College degreeEnglish-speakingOwn homeSingle-family home1+ miles from riverCedar River basin
<$30KNo college degreeNot a single-family homeRentNo petsGreen River basin Live in a flood plainHave flood insurance
FemaleHave children35-54 years oldNot a single-family homeSnoqualmie River basinLive in a flood plainHave flood insurance
Women, people with children, people ages 35-54 and those in the Snoqualmie River basin are more likely to say, “high risk”.
Risk PerceptionStatistically significant cross-tabulations

44% are currently prepared or recently began preparing for a major flooding event.
11
36%
8%
10%
5%
17%
24%
33%
12%
7%
4%
18%
24%
3%
I am currently prepared
I recently began preparing
I have not yet prepared but I intend to in the next month
I have not yet prepared but I intend to in the next 6 months
I am not planning to do anything about preparing
I haven’t thought about it
Don't know
Q8. In thinking about preparing for a major flooding event, which best represents your preparedness?
2010
2009
Those more likely to be prepared:Male35-54 years oldCollege degreeWhite/CaucasianExperienced a prior emergencyHigh risk of flooding1-1/2 mi. from riverLive in Snoqualmie River basinHave flood insuranceLive in flood plain
(Cedar, Green, White &Snoqualmie River Basins)
(Green River Basin)
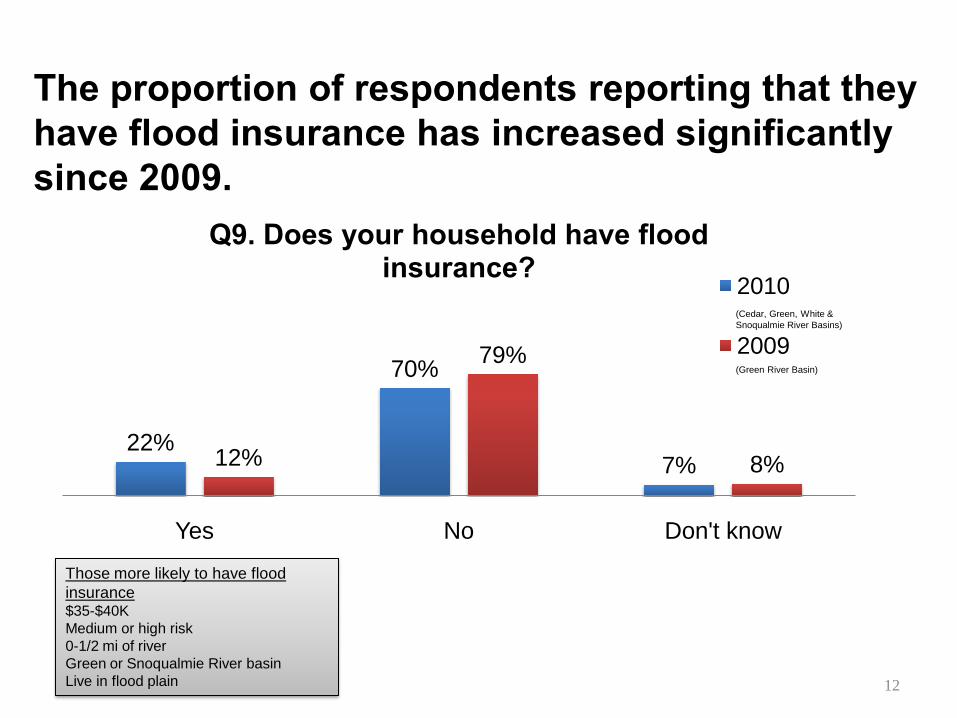
The proportion of respondents reporting that they have flood insurance has increased significantly since 2009.
22%
70%
7%12%
79%
8%
Yes No Don't know
Q9. Does your household have flood insurance?
2010
2009
Those more likely to have flood insurance$35-$40KMedium or high risk0-1/2 mi of riverGreen or Snoqualmie River basinLive in flood plain 12
(Cedar, Green, White &Snoqualmie River Basins)
(Green River Basin)

22% have flood insurance.
Yes22%
No70%
Don't know8%
Q9. Does your householdhave flood insurance?
48%
26%
8%
6%
4%
3%
2%
3%
Not located in the floodplain/ Live on a hill
Not necessary
Too expensive
I rent/Live in apartment/ Not homeowner
Not available
Don't know
Never thought about it/ Hadn't crossed my mind
Other
Q10. [IF Q9=NO] What is the main reason your household does not
have flood insurance?
13

A strong majority of those in the Green River basin (72%) are aware of the current risk of flooding.
14
72%
27%
75%
25%
Yes/ aware of current risk No/ unaware of current risk
[GREEN RIVER ZIPS, ONLY] Q11. Prior to me reading this statement had you heard anything about the need to prepare for
a higher risk of flooding during the current flood season?
2010
2009(Green River Basin)
Those more likely to be awareExperienced an emergency35-54 years old$100K+Spanish-speakingOwn home
(Green River Basin)
Statements read to respondents in 2009 and 2010 differed. In each case, the current risk was described.

71% in the Green River basin feel their community is somewhat or very prepared for a flood emergency. This is a significant increase from 26% in 2009.
15
22%
49%
7%
10%
12%
6%
20%
17%
22%
35%
Very prepared
Somewhat prepared
Barely prepared
Not at all prepared
Don't know/not sure
[GREEN RIVER ZIPS, ONLY] Q12. Overall, how prepared is your community for a flood emergency? Would you say your
community is…2010
2009
Those more likely to say not at all prepared:<$30KNo collegeRentNon-WhiteHaven’t experienced emergencyNot aware of Howard Hanson Dam riskNo flood insurance
(Green River Basins)
(Green River Basin)

85% have supplies at home to last several days in the event of an emergency.
16
85%
80%
68%
13%
15%
31%
2%
5%
1%
Q14. At home, do you have enough food, water and necessary supplies,
such as medicine, to last several days in the event of a flood emergency?
Q20. In the event of a flood emergency, are you prepared to evacuate or do you know several routes to higher ground?
Q16. Do you own a hand-crank or battery-operated radio?
Flood Emergency Preparedness Summary (Top 3 Responses)
YES NO DK/REF.

17
56%
32%
20%
42%
65%
71%
2%
3%
9%
Q18. Have you identified an out-of-state contact your family would
communicate with in the event of a flood emergency?
Q17. Have you established a specific meeting place to reunite in the event
you and your family cannot return home or are evacuated?
Q19. Are you signed up for a King County Flood Alert or other flood alert
system?
Flood Emergency Preparedness Summary (Bottom 3 Responses)
YES NO DK/REF.

18
Men, respondents 35 years and older, and those with incomes greater than $30,000/year were more likely to have taken the specific preparation steps we queried.
Specific Emergency Preparations (Those more likely to be prepared)Statistically significant cross-tabulations
Food, water, supplies to last several daysMale35+ years old$50K+WhiteEnglishSingle family homeNo childrenExperienced emergency0-1/2 mi or 5+ mi of riverSnoqualmie River basin
Hand-crank or battery radioMale35+ years old$30K+WhiteSingle family homeOwn homePetsNo childrenCollege degreeExperienced emergencyWhite or Cedar River basinHHD awareness
Emergency supply kitMale$30K+WhiteEnglishPetsNo childrenExperienced emergencyHave flood insurance
Out-of-state contact35-54 years old$50K+College degreeEnglishExperienced emergencyLow risk of flooding
Meeting placeExperienced emergencyLow risk of flooding
Flood Alerts<$100KMed-High risk0-1/2 mi of riverGreen or SnoqualmieFlood plainHave flood insurance

6%
24%
55%
56%
68%
72%
86%
20%
39%
61%
67%
72%
85%
89%
27%
32%
53%
59%
66%
81%
82%
Are you signed up for a King County Flood Alert or other flood alert system
Have you established a specific meeting place to reunite in the event you and your family cannot return
home or are evacuated
Have you identified an out-of-state contact your family would communicate with in the event of a flood
emergency
Do you have a kit of emergency supplies that you keep at home, in your car or where you work
Do you own a hand-crank or battery-operated radio
Are you prepared to evacuate or know several routes to higher ground?
Do you have enough food, water and necessary supplies to last several days in the event of a flood
emergency
Flood Preparedness Summary Table (% Responding Yes, by River Basin)
Green/White Snoqualmie Cedar
19

Of those who are not prepared to evacuate to higher ground, most say this is because they are already on high ground.
54%
12%
4%
3%
3%
2%
2%
20%
Doesn't apply/ Already on high ground
Don't know what do to/ where to go
Take the bus/ Don't have a car
Don't want to leave a family member or …
New to area/ Hadn't thought about it
Won't leave my house/ property
Other
Don't know
Q21. [IF Q20=B/NO (Not prepared to evacuate to higher ground.)] Why do you say this?
20
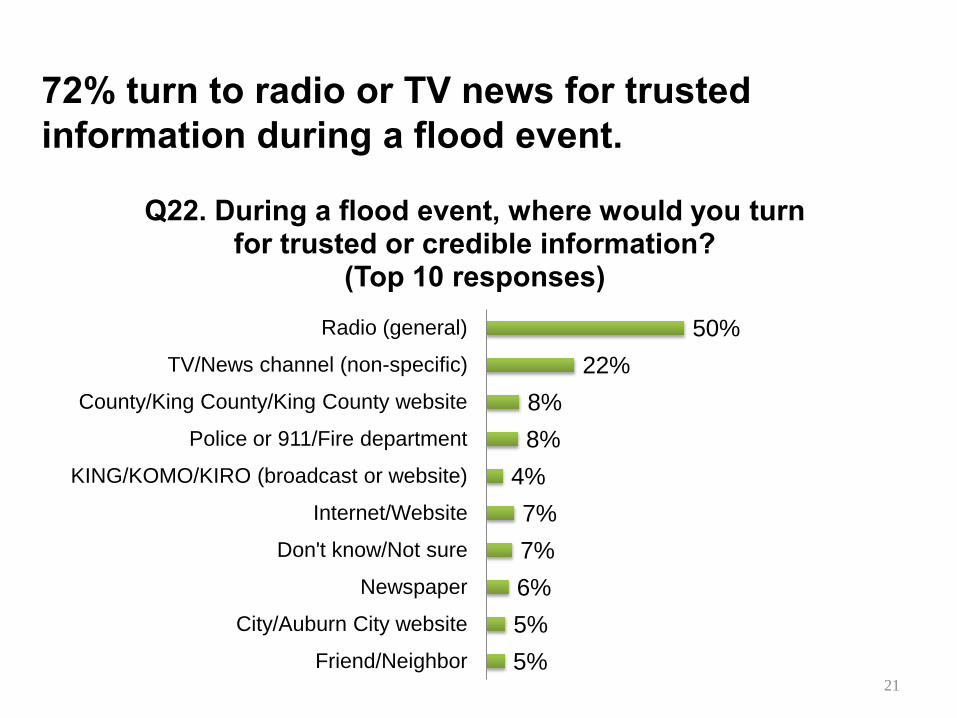
72% turn to radio or TV news for trusted information during a flood event.
50%22%
8%8%
4%7%7%6%5%5%
Radio (general)
TV/News channel (non-specific)
County/King County/King County website
Police or 911/Fire department
KING/KOMO/KIRO (broadcast or website)
Internet/Website
Don't know/Not sure
Newspaper
City/Auburn City website
Friend/Neighbor
Q22. During a flood event, where would you turn for trusted or credible information?
(Top 10 responses)
21

When it comes to flood preparation and emergencies, electronic communication and direct mail are preferred forms of communication.
32%
28%
26%
19%
15%
5%
5%
2%
2%
1%
6%
Internet (web, e-mail)
Mail / Direct mail
TV news
Radio
Telephone calls
Don't know
Newspapers
Text messaging
Refused
Word of mouth
Other
Q23. What is the best way to get information to you about flood preparation and emergencies?
22

Mail and electronic communications are also the preferred means of communication from and about King County and other local governments.
37%
30%
24%
14%
8%
7%
5%
1%
1%
4%
Mail / Direct mail
Internet (web, e-mail)
TV news
Radio
Telephone calls
Newspapers (e.g., Seattle Times, Renton …
Don't know
Public meetings
Text messaging
Other
Q24. What is the best way to get general information to you from and about King County and other local
governments?
23

Key Findings
24
• A strong majority believe they are at a low-risk of flooding• Those most likely to be concerned about flooding:
– Lower-income, non-Whites, multi-family residence, live in the Green or Snoqualmie River basins
• There’s been a significant increase in the proportion of respondents who feel their community is somewhat or very prepared for a flood emergency
• High levels of awareness of the current risk along the Green River
• Significant increase in proportion reporting they have flood insurance

Key Findings
25
• Men and those who have experienced a flooding event are more likely to take make specific preparations
• Radio and TV are top sources for information during a flood event
• Internet, mail and broadcast news are preferred sources of information about flood preparation and emergencies
• People prefer to receive county information via direct mail and internet

Background &Demographics
26

Respondents from Cedar, Green, Snoqualmie and White River basins completed the survey.
23%
44%29%
4%
Q2. Before we get started, may I have your home zipcode?
27
22%37%
27%
8%
Q29. Which of the following rivers is closest to your home?

71% have lived in King County 10 or more years.
4%
11%
13%
23%
18%
22%
9%
1%
1 year or less
2 to 5 years
6 to 10 years
11 to 20 years
21 to 30 years
31 to 50 years
51 or more years
Refused
Q26. How many years have you lived in King County?
28
Median:20 years

Only 20% of respondents indicated that they currently live in a flood plain.
20%
74%
5%
Yes No Don't know
Q27. Do you currently live in a flood plain?
29

31% live within one mile of a river stream or creek.
5%
26%
28%
18%
19%
3%
I live on a river, stream or creek
less than half a mile
1-2 miles
2-4 miles
5 or more miles
Don't know
Q28. How close do you live to a river, stream or creek?
30

A significant majority live (75%) in single family homes.
75%
12%
4%
3%
2%
2%
1%
Single family home
Apartment
Condominium or …
A mobile home or RV
A manufactured home
Duplex
Something else
Q30. Which of the following best describes the place you live now?
Is it a…
31

Most respondents (73%) own their own home.
32
25%
73%
Rent Own
Q31. Do you rent or own your own home?

A majority (61%) have a pet or animals.
61%
38%
1%
Yes No Refused
Q32. Does your household or property have a pet or any animals?
33

Nearly half (48%) have personally been involved in an emergency situation as the result of a natural disaster.
48% 51%
Yes No
Q25. Have you ever personally been involved in an emergency situation before as a result of a natural disaster such as a flood, earthquake,
hurricane or tornado?
34

Respondents’ ages are consistent with the ages of the study area population.
18-3436%
35-5442%
55 or older 22%
Q3. Which of the following categories includes your current age?
35

50% live in households with children under age 18. Most of these children (83%) attend school outside of the home.
50% 49%
1%
Yes No Refused
Q33. Are there any children under the age of 18 living in
your home?
36
Yes83%
No16%
Refused1%
Q34. [IF Q33=A/YES] Does this child/or any of these children
currently attend a school outside of your home, including day care or
part time kindergarten?

71% have some education beyond high school.
2% 4%
18% 21%
10%
22%18%
1% 3%
9th grade or less
Some high school, no
degree
High school degree or
GED
Some college, no
degree
Associate's degree
Bachelor's degree
Graduate or Professional
degree
Don't know Refused
Q35. What is the highest grade or year of school that you have ever completed?
37

24% describe their race or ethnicity as something other than White/ Caucasian.
72%2%
6%1%2%
9%3%
1%5%
White or Caucasian
Black or African American
Asian
American Indian or Alaska Native
Native Hawaiian or Other Pacific Islander
Hispanic or Latino
Multi-racial
Something else
Refused
Q36. How would you describe your race or ethnicity?
38

33 interviews (7%) were conducted in Spanish.
English93%
Spanish7%
Survey language
39

Department of Natural Resources and Parks201 S. Jackson St., Ste. 600Seattle, WA 98104206-296-8001TTY Relay: 711 Alternate Formats Available