Embed Size (px)
Citation preview

J. exp. Biol. 128, 335-34 7(1987) 335Printed in Great Britain © The Company of Biologists Limited 1987
FLIGHT OF AUKS (ALCIDAE) AND OTHER NORTHERNSEABIRDS COMPARED WITH SOUTHERN
PROCELLARIIFORMES: ORNITHODOLITE OBSERVATIONS
B Y C . J. PENNYCUICK
Department of Biology, University of Miami, PO Box 249118, Coral Gables,FL 33124, USA
Accepted 17 November 1986
SUMMARY
Airspeeds in flapping and flap-gliding flight were measured at Foula, Shetland forthree species of auks (Alcidae), three gulls (Landae), two skuas (Stercorariidae), thefulmar (Procellariidae), the gannet (Sulidae) and the shag (Phalacrocoracidae). Theairspeed distributions were consistent with calculated speeds for minimum powerand maximum range, except that observed speeds in the shag were unexpectedly lowin relation to the calculated speeds. This is attributed to scale effects that cause theshag to have insufficient muscle power to fly much faster than its minimum powerspeed. The wing adaptations seen in different species are considered as deviationsfrom a 'procellariiform standard', which produce separate effects on flapping andgliding speeds. Procellariiformes and the gannet flap-glide in cruising flight, butbirds that swim with their wings do not, because their gliding speeds are too high inrelation to their flapping speeds. Other species in the sample also do not flap-glide,but the reason is that their gliding speeds are too low in relation to their flappingspeeds.
INTRODUCTION
This paper records ornithodolite observations of flight speeds in 11 seabirdspecies, comprising several different adaptive types. They are compared with earlierobservations (Pennycuick, 19826) on a set of procellariiform species, which covered awider range of body mass, but were more homogeneous in other ways. The species inthe present set can be seen as deviating from a 'procellariiform standard', in variousways, which affect their flight performance and style of flight.
Study area
Flight speed measurements were made between 28 June and 9 July 1986 on theisland of Foula, in Shetland. Foula is an isolated island of about 12 km2 projectedarea, centred at 60° 08' N, 2 ° 04' W, about 24 km west of the main island of Shetland,and noted for its concentrations of breeding seabirds. A detailed account of its birds,and the status of their populations in recent years, has been compiled by Furness
Key words: flight, seabirds, ornithodolite.

336 C. J. PENNYCUICK
(1983). Most flight observations were made from the southern tip of the island,where continuous streams of birds could usually be seen flying around the SouthNess, between the main breeding areas on the western cliffs and feeding areas to theeast.
MATERIALS AND METHODS
Body measurements
The body masses of Shetland birds listed in Table 2 are means for breeding adults,weighed during July over a period of years, and kindly supplied by Dr R. W. Furness(personal communication). The number in each sample is listed as nm. The gannetmass is from means of breeding adults weighed at the Bass Rock and Ailsa Craig byNelson (1978). The masses for South Georgia birds are means for breeding adults,published by Croxall & Prince (1980). Wing measurements were taken by theauthor, the number in each sample being listed as nw. The measurements of Shetlandbirds were collected during a visit to Fair Isle, Shetland, in 1975, except for five greatskuas measured on Foula during the present study. Those of South Georgia birdswere collected on Bird Island, South Georgia in 1979-1980.
Flight speed measurements
Flight speeds were measured by ornithodolite. The instrument and method ofoperation were essentially the same as described by Pennycuick (1982a,b, 1983).The same 'Mariner 1' anemometer set was used as on previous occasions, mounted ona pole 2-8 m above ground. A 'run' consisted of a series of timed, three-dimensionalpositions of the bird in space, and a speed 'observation' was obtained by comparingeach two successive positions. The Nascom 1 computer, originally used to controlthe instrument, was replaced by an Epson PX8 battery-powered computer, con-nected via a home-made parallel interface. After each run, the bird's groundspeed,track direction, airspeed, heading, height and vertical speed were calculated anddisplayed immediately on the PX8's liquid crystal display. Two BASIC programs,incorporating machine-code routines to control the ornithodolite, were used, one foraligning and testing the instrument, and the other for acquiring and recording data.The raw ornithodolite data (not computed speeds etc.) were recorded as a tape file onthe PX8's built-in microcassette recorder. On return to the laboratory, the tape fileswere transferred from the PX8 to disc files on a Nascom 2 computer. All subsequentanalysis was done by BASIC programs on the Nascom 2.
RESULTS
The species on which new flight observations are reported are listed in Table 1,with two-letter identifiers which are used in subsequent tables and graphs. This is todistinguish them from South Georgia seabird species reported on by Pennycuick(19826), which are also listed in Table 1, with the three-letter identifiers used in theearlier publication. Some additional South Georgia species, not covered in the earlier

Flight of seabirds 337
paper, are included in Table 1. Table 2 shows morphological data for the same set ofspecies, classified into three functional groups. Measurements of observed andcalculated speeds, and other quantities derived from these, are listed for the Shetlandspecies in Table 3.
Reynolds number and parasite drag
The 'mean flapping speed' (Vmf in Table 3) for each species is the mean airspeedfor observations in which the bird was either flapping or flap-gliding. Reynoldsnumbers, based on this speed, are listed in Table 3 for the body and the wing. Thebody Reynolds number is based on the diameter of a circle whose area is the same asthe maximum cross-sectional area of the body, which is itself estimated from themass as indicated by Pennycuick (1975). The wing Reynolds number is based on themean chord. Body Reynolds numbers ranged from 61000 (kittiwake) to 127 000(gannet), and wing Reynolds numbers from 77 100 (razorbill) to 161 000 (great skua,great black-backed gull, shag).
To estimate the speeds for minimum power and maximum range (Vmp and Vmr) anestimate is needed for the drag coefficient of the body, in order to calculate itseffective flat-plate area. Prior (1984) reported from wind tunnel measurements thatthe drag coefficients of the bodies of ducks, geese and swans declined as Reynoldsnumber increased through the range observed here, levelling off at about 0-2 (or a
Table 1. Species codes used in subsequent tables and figures
Foula birds (present study)
FaUaAtCsSPRtLmLaFgMbPa
PuffinGuillemotRazorbillGreat skuaArctic skuaKittiwakeGreat black-backed gullHerring gullFulmarGannetShag
South Georgia birds (from Pennycuick, 1
WANBBAGHASTYMACWCPCAPPRNWILSDPCDPBES
Wandering albatrossBlack-browed albatrossGrey-headed albatrossSooty albatrossGiant petrelWhite-chinned petrelCape pigeonDove prionWilson's storm petrelS. Georgia diving petrelCommon diving petrelBlue-eyed shag
Fratercula arcticaUria aalgeAlca tordaCatharacta skuaStercoranus parasiticusRissa tridactylaLarus marinusLarus argentatusFulmarus glacialisMoms bassanusPhalacmcorax aristotelis
982£)
Diomedea exulansDiomedea melanophrisDiomedea chrysostomaPhoebetria palpebrataMacronectes giganteus/M. halliProcellaria aequinoctialisDaption capensisPachyptila desolataOceanites oceanicusPelecanoides georgicusPelecanoides urinatrixPhalacmcorax atriceps

338 C. J. PENNYCUICK
little less) at Reynolds numbers above 200 000. It would appear that the value of 0-43assumed by Pennycuick (1975) for the parasite drag coefficient of any bird, on thebasis of measurements on the domestic pigeon (Columba livid) and Rueppell'sgriffon vulture (Gyps rueppellii), is too high for birds with well-streamlined bodies,flying at Reynolds numbers of 60000 and above. The speeds for minimum power(Vmp) and maximum range (Vmr) were estimated by the method of Pennycuick(1975), using a value of 0-25 for the parasite drag coefficient for all species. Probablythe drag coefficient should be a declining function of Reynolds number, which wouldhave the effect of slightly decreasing the speed estimates for the birds that fly at lowerReynolds numbers, and vice versa. However, the effect would be small, and Prior'sresults, as presented, would not allow such a function to be estimated with asufficient degree of precision to justify this added complication.
Table 2. Morphological data
Species nm
Albatrosses, petrelsWANBBAGHASTYMACWCPCAPPRNWILFg
Auks andFaUaAtSDPCDP
350
nw
jnd storm3311422533
diving petrels15010050
Other seabirdsCsSpRtLmLaMbPaBES
4012375
808943
203332
65311141
Mass(kg)
-petrels
8-733-793-792-845191-370-43301680-0380-815
0-3980-9500-6200-1140-137
1-350-3900-3871-560-9403-011-812-23
Wingspan(m)
3-032-162-182-181-991-400-8750-6260-3931-13
0-5490-7070-6610-3810-393
1-371-050-9651-691-311-851-041-13
Wingarea(m2)
0-6110-3560-3520-3380-3310-1690-07730-04600-02190-124
00369005440-04620-02000-0221
0-21401170-1010-31701810-26201580183
Wingloading(Nm"2)
14010410682-4
15479-555-035-817-064-5
10617113255-960-8
61-932-737-648-350-9
113112120
Aspectratio
15013113-514-112-011-69-90 (8-52 (7-05 (
10-3 (
8-179-199-467-266-99
8-77 (9-42 (9-22 (901 (9-48 (
13-16-85 (6-98 (
CLI
•16•08•10•04•19•05
)-98)-86)-69)-97
•25•46•3905
•05
>81>75>79>71)-81116D-91D-92
T h e species groupings correspond to the lines in Figs 2 and 4.n m , number in each sample for mass measurements; nw, number in each sample for wing
measurements ; C L I , l'ft coefficient when the gliding speed equals the minimum power speed.
Flight of seabirds 339
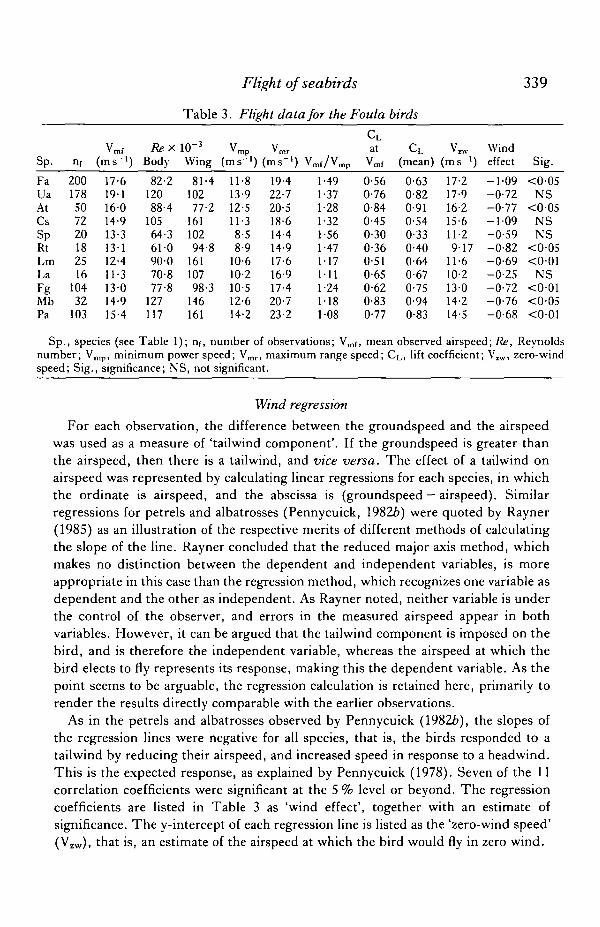
Table 3. Flight data for the Foula birds
Sp.
FaUaAtCsSpRtLmLaFgMbPa
nf
200178507220182516
10432
103
vmf(ms-')
17-619116014-913-313-112-411-313-014-915-4
RexBody
82-212088-4
10564-361-090-070-877-8
127117
io-3
Wing
81-410277-2
16110294-8
16110798-3
146161
* mp(ms-')
11-813-912-511-38-58-9
10-610-210-512-614-2
vmr(ms-1) 1
19-422-720-518-614-414-917-616-917-420-723-2
O/vmp1-491-371-281-321-561-471-171111-241181-08
CLat
Vraf
0-560-760-840-450-300-360-510-650-620-830-77
CL(mean)
0-630-820-910-540-330-400-640-670-750-940-83
(ms">)
17-217-916-215-611-29-17
11-610-213014-214-5
Windeffect
- 1 0 9-0-72-0-77- 1 0 9-0-59-0-82-0-69-0-25-0-72-0-76-0-68
Sig.
<0-05NS
<005NSNS
<0-05<0-01
NS<001<0-05<0-01
Sp., species (see Table 1); nf, number of observations; V ^ , mean observed airspeed; Re, Reynoldsnumber; Vmp, minimum power speed; Vmr, maximum range speed; CL, lift coefficient; V1W, zero-windspeed; Sig., significance; NS, not significant.
Wind regression
For each observation, the difference between the groundspeed and the airspeedwas used as a measure of 'tailwind component'. If the groundspeed is greater thanthe airspeed, then there is a tailwind, and vice versa. The effect of a tailwind onairspeed was represented by calculating linear regressions for each species, in whichthe ordinate is airspeed, and the abscissa is (groundspeed — airspeed). Similarregressions for petrels and albatrosses (Pennycuick, 19826) were quoted by Rayner(1985) as an illustration of the respective merits of different methods of calculatingthe slope of the line. Rayner concluded that the reduced major axis method, whichmakes no distinction between the dependent and independent variables, is moreappropriate in this case than the regression method, which recognizes one variable asdependent and the other as independent. As Rayner noted, neither variable is underthe control of the observer, and errors in the measured airspeed appear in bothvariables. However, it can be argued that the tailwind component is imposed on thebird, and is therefore the independent variable, whereas the airspeed at which thebird elects to fly represents its response, making this the dependent variable. As thepoint seems to be arguable, the regression calculation is retained here, primarily torender the results directly comparable with the earlier observations.
As in the petrels and albatrosses observed by Pennycuick (19826), the slopes ofthe regression lines were negative for all species, that is, the birds responded to atailwind by reducing their airspeed, and increased speed in response to a headwind.This is the expected response, as explained by Pennycuick (1978). Seven of the 11correlation coefficients were significant at the 5 % level or beyond. The regressioncoefficients are listed in Table 3 as 'wind effect', together with an estimate ofsignificance. The y-intercept of each regression line is listed as the 'zero-wind speed'(Vzw), that is, an estimate of the airspeed at which the bird would fly in zero wind.

340 C. J. PENNYCUICK
Airspeed histograms
Fig. 1 shows histograms of observed airspeeds for all species, in flapping andflap-gliding flight. The minimum power speed (Vmp), and maximum range speed(Vmr), calculated from the mass and wing span by the method of Pennycuick (1975),are listed in Table 3, and also marked on each histogram, together with thepercentages of observations falling below Vmp, and above Vmr. In all species, boththe mean observed airspeed (Vmf) and the zero-wind speed (VIW) fall between thecalculated values for Vmp and Vmr.
26 >26
Airspeed (ms )
Fig. 1. Airspeed histograms for flapping and flap-gliding flight. The species codes on theleft are identified in Table 1. The mean airspeeds are shown as vertical dotted lines. Thespeeds for minimum power (Vmp) and maximum range (Vmr) are shown as thin verticallines with left- and right-pointing arrowheads, respectively. The numbers on the left andright are percentages of observations falling below Vmp and above Vmr.

Flight of seabirds 341
Of the three species that showed large percentages of observed speeds above thecalculated maximum range speed, the puffin also showed a significant negativecorrelation between airspeed and vertical speed. The reason appears to be that manyof the puffins passed the observation site in a shallow dive, on their way from nearbycliff nesting areas to the sea, and increased their speed accordingly. The other twospecies (arctic skua and kittiwake) were represented by small samples, dominatedby birds flying at increased speed against headwinds. Their zero-wind speedswere much less than their mean speeds (Table 3). Several species showed largepercentages of observations below the calculated minimum power speed. Of these,the great skua, great black-backed gull and fulmar were reducing speed in someobservations as they made use of slope-lift along the cliff. Gannets were flying wellout from the cliff, but were often seen reducing speed and looking down, presumablyat fish. The shag is the only species whose speed distribution is not easily explained interms of behaviour. It showed the highest percentage of observations below Vmp
(32%), and none above Vmr. The shags were flying steadily along over the sea, andwere not slope-soaring, preparing to land or looking out for prey. Their speeddistribution calls for another explanation (see below).
Lift coefficients
Lift coefficients for the gliding phase of flap-gliding flight were calculated for eachobservation from the formula
CL = 2m£r/pV2S. (1)
The ratio mg/S is listed in Table 2 as the wing loading, m being the mass, g theacceleration due to gravity, S the wing area, and V the airspeed. The air density (p)was calculated separately for each run from the temperature and pressure, whichwere recorded on the data tapes. In the case of a bird in flapping flight, equation 1gives the lift coefficient that would apply if the bird were gliding at the observedspeed. The speed distributions of Fig. 1 are fairly symmetrical, consequently the liftcoefficient distributions are skewed, on account of the inverse square relationship ofequation 1. Because of this, the mean lift coefficient for each set of observations isgenerally different from (higher than) the lift coefficient corresponding to the meanspeed (Vmf). Both lift coefficients are listed in Table 3.
DISCUSSION
Flight style
Flap-gliding is the characteristic style of powered, cruising flight in 'normal'Procellariiformes - that is, albatrosses, petrels and storm-petrels, but excludingdiving petrels (Diomedeidae, Procellariidae and Hydrobatidae but not Pele-canoididae). Among the species in the present sample, the gannet also regularly flap-glides in cruising flight, but the others typically flap most or all of the time. A birdthat flap-glides when cruising must be able to flap reasonably efficiently, at a speedpot too far from that for the best glide ratio in gliding flight. The required flapping

342 C. J. PENNYCUICK
10
Body mass (kg)
Fig. 2. Lower line: lift coefficients corresponding to mean airspeed in flapping and flap-gliding flight for Procellariiformes other than diving petrels. Upper line: lift coefficientfor gliding at a speed equal to the calculated minimum power speed in the same species.The species codes are given in Table 1.
speed cannot be too much above or below the best gliding speed, otherwise thegliding phase of the flap-glide will be unacceptably inefficient.
One might suppose that the normal Procellariiformes, whose body masses rangefrom about 30 g to 9 kg, would choose a constant value of the lift coefficient for thegliding phase of flap-gliding flight, but this is not so. These lift coefficients weredetermined by Pennycuick (19826) for seven procellariiform species, and rangedfrom 0*28 for Wilson's storm petrel to 1-08 for the giant petrel. These results areplotted (together with the new value for the fulmar) as the lower line in Fig. 2. Itshows that the lift coefficient varies with the 0-24 power of the body mass. The slopesof all the lines of Figs 2 and 4 were calculated by the reduced major axis method, asrecommended by Rayner (1985).
Relationship of flapping to gliding speeds
Another way to represent the problem is to ask: at what value of the lift coefficientwould the gliding speed be equal to the minimum power speed? This question can beanswered from body measurements alone. The resulting value of the lift coefficient islisted as 'C^i', along with the morphological data in Table 2. It is determined asfollows. The minimum power speed, on the assumptions of Pennycuick (1975), isgiven by
Vmp = (2)
where k is the induced power factor, m is the body mass, gis the acceleration due togravity, p is the air density, A is the equivalent flat-plate area of the body (equal tothe actual cross-sectional area times the body drag coefficient), and Sj is the discarea. Sj can be expressed in terms of the wing span, and A can be replaced by afunction of the body mass, after Pennycuick (1975). If this is done, and numerical,

Flight of seabirds 343
values of 1 -2 for k and 0-25 for the body drag coefficient are assumed, equation 2 canbe expressed as:
Vmp = 4-19m 1 VV 1 / 2 b- 1 / 2 , (3)
where b is the wing span. The gliding speed (Vg) is simply
V g = V(2m*/pCLS). (4)
If we now set the gliding speed equal to Vmp, and solve for the lift coefficient, theresult can be expressed as
CL1 = 0-114m1/3A/b, (5)
where A is the aspect ratio, defined as
A = b2/S. (6)
CLI being dimensionless, the numerical constant in equation 5 has the dimensions of(mass""1'3 X length). These curious dimensions result from the substitution of afunction of the mass, in place of the cross-sectional area of the body. If the latter wereused explicitly, equation 5 would take a more overtly dimensionless form. The upperline in Fig. 2 represents CLI plotted against body mass for normal Procellariiformes.Like the observed lift coefficient, CLI also increases with mass, but only as the 0-077power of the mass. The line converges with the one for observed flap-gliding liftcoefficients at a body mass of 10-9 kg, and a lift coefficient of 1 -21. This means that ifan 11-kg albatross were to fly at Vmp during the flapping phase (which is too slow forefficient flapping flight), it would have to glide at a lift coefficient of 1-2 (which is toohigh for efficient gliding). It may be noted that the largest species, the wanderingalbatross, deviates below the line, that is it flies somewhat faster than the relationshippredicts, and thus at a lower lift coefficient. It would appear that the largest speciesdo not have sufficient muscle power to fly much faster than Vmp, and thus have nochoice but to fly at a speed too low to be efficient. Not surprisingly, they avoidpowered flight whenever possible, and rely heavily on soaring. At the other extreme,CLI f°r the Wilson's storm petrel is lower than that for the large albatrosses, but farabove the lift coefficient at which it actually flies. It was noted by Pennycuick (19826)that only this smallest species actually flies at a speed near its calculated maximumrange speed.
Species adapted to wing-propelled swimming
The three auks (Alcidae) are the only species in the present sample that use theirwings in a flapping motion for propulsion under water. An incipient form of thisadaptation can be seen in underwater films of plunge diving boobies (Sulidae), whichsteer with the partially opened wings. However, these birds do not show the penguin-like motion seen in the auks, and their forward motion seems to be derived fromthe momentum of the dive, or from buoyancy when returning to the surface, ratherthan from flapping the wings. In the Southern Hemisphere, the diving petrels(Pelecanoididae) swim in a similar way to the auks, and are generally considered to beconvergent on them. Since water is some 800 times denser than air at sea level, it is
344 C. J. PENNYCUICK
remarkable that auks and diving petrels can use the same wing, and even a similarmotion, for propulsion in both media. The flapping frequency is, of course, muchlower in water, and the wings are held with the wrist and elbow joints sharply flexed.
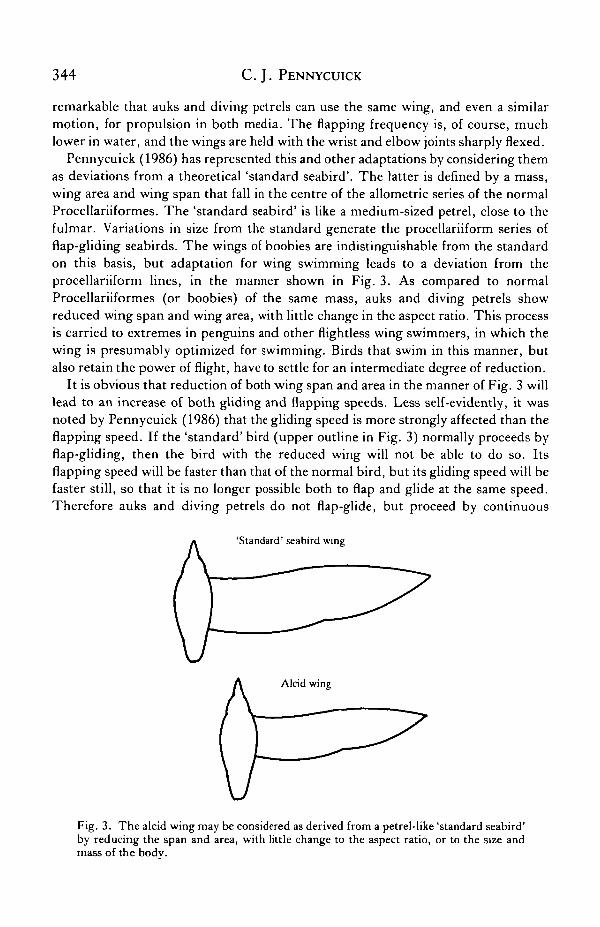
Pennycuick (1986) has represented this and other adaptations by considering themas deviations from a theoretical 'standard seabird'. The latter is defined by a mass,wing area and wing span that fall in the centre of the allometric series of the normalProcellariiformes. The 'standard seabird' is like a medium-sized petrel, close to thefulmar. Variations in size from the standard generate the procellariiform series offlap-gliding seabirds. The wings of boobies are indistinguishable from the standardon this basis, but adaptation for wing swimming leads to a deviation from theprocellariiform lines, in the manner shown in Fig. 3. As compared to normalProcellariiformes (or boobies) of the same mass, auks and diving petrels showreduced wing span and wing area, with little change in the aspect ratio. This processis carried to extremes in penguins and other flightless wing swimmers, in which thewing is presumably optimized for swimming. Birds that swim in this manner, butalso retain the power of flight, have to settle for an intermediate degree of reduction.
It is obvious that reduction of both wing span and area in the manner of Fig. 3 willlead to an increase of both gliding and flapping speeds. Less self-evidently, it wasnoted by Pennycuick (1986) that the gliding speed is more strongly affected than theflapping speed. If the 'standard' bird (upper outline in Fig. 3) normally proceeds byflap-gliding, then the bird with the reduced wing will not be able to do so. Itsflapping speed will be faster than that of the normal bird, but its gliding speed will befaster still, so that it is no longer possible both to flap and glide at the same speed.Therefore auks and diving petrels do not flap-glide, but proceed by continuous
'Standard' seabird wing
Fig. 3. The alcid wing may be considered as derived from a petrel-like 'standard seabird'by reducing the span and area, with little change to the aspect ratio, or to the size andmass of the body.

Flight of seabirds 345
8 l
0-5
SDP^ — -CDP
Fa
_
Sp
At
. •
-
Ua.̂ - • -
La.^—-• '
Cs•—s—"
Lm
- * —Pa
Mb•
BES
•
0 1 0-2 0-5 1
Body mass (kg)
Fig. 4. Lift coefficient for gliding at a speed equal to the calculated minimum powerspeed. Upper line: alcids and pelecanoidids. Lower line: larids, stercorariids, phalacro-coracids. Middle (dotted) line: Procellariiformes other than diving petrels, transferredfrom the upper line of Fig. 2. Data are from Table 2; the species codes are given inTable 1.
flapping. This does not mean that these birds are unable to glide. The three speciesof auks in the present sample do glide when slope-soaring along cliffs in strong winds.Presumably they do so at airspeeds above their normal flapping speeds. Regrettably,this conjecture could not be tested directly, as no suitable observing site was found onthe cliffs, from which ornithodolite observations of gliding auks could be obtained.The difficulty was to find a site at which meaningful readings could be obtained fromthe anemometer. Suitable sites most probably do exist on other islands with lessprecipitous cliffs.
The effect can be seen indirectly by considering CLi, the lift coefficient for glidingat the minimum power speed. This is much higher in auks than in normalProcellariiformes of similar mass (Table 2; Fig. 4). The top line in Fig. 4 representsCLi for the three auks and two diving petrels in Table 2, for comparison with thedotted line, which is the procellariiform line transferred from Fig. 2. With a value of1-46 for CL1, the guillemot would be almost stalled if it attempted to glide at itsminimum power speed. The mean flapping speed for guillemots was 1-37 times theestimated Vmp (Table 3), but this is evidently still too slow for flap-gliding to bepracticable. Values of CL1 for the diving petrels, with body masses below 150 g, arenear those for albatrosses. The latter flap-glide, whereas the diving petrels do not.Probably there are two reasons for this. First, the albatrosses are obliged by lack ofmuscle power to fly not much faster than their minimum power speeds, whereas thediving petrels, like the auks in the present survey, probably fly considerably fasterthan this. Second, the albatrosses can probably glide efficiently at higher liftcoefficients than diving petrels, because of the higher Reynolds numbers at whichthey fly.
Other adaptations
The seven remaining species in the Shetland sample comprise three gulls(Laridae), two skuas (Stercorariidae), the shag (Phalacrocoracidae) and the gannet

346 C. J. PENNYCUICK
(Sulidae). Their values for CLI are plotted on Fig. 4, together with that for theblue-eyed shag. The lower line is fitted through this group of points, excluding thatfor the gannet. The points for this more heterogeneous group of species showconsiderably more scatter about their line than do the normal Procellariiformes orthe wing-swimming species. The point for the gannet falls very near the normalprocellariiform line. As noted by Pennycuick (1986), gannets and boobies areindistinguishable from normal procellariiform birds on the basis of their wing span orarea, and, like Procellariiformes, they flap-glide in cruising flight. Gulls, skuas andcormorants mostly flap continuously in cruising flight, but not for the same reason asthe wing-swimming birds. Their CLI values fall below the normal procellariiformline (lower line in Fig. 4), which means that their gliding speeds are lower than theirflapping speeds, rather than higher as in the wing-swimmers. When gulls, skuas andcormorants glide, they do so at speeds slower than their cruising speeds in flappingflight, rather than faster.
Landing manoeuvres
Birds with a low CLI change from flapping to gliding as they slow down, whereasthose with a high CLI, if they happen to be gliding, have to change to flapping beforethey can reduce speed. A gull or cormorant preparing to alight on the water, firststops flapping and glides, as it decelerates prior to touching down, whereas an aukcontinues flapping as it flies on to the surface. An auk preparing for a cliff landing willoften approach the cliff in a shallow, fast, gliding dive. It pulls up to approach thelanding ledge in a steep, decelerating climb, and as it slows down, it changes fromgliding to flapping, invariably flapping vigorously just before touching down.
Anomalous speeds in the shag
As noted above, the mean flapping speed observed for the shag was only 1 -08 timesthe calculated minimum power speed, and 32 % of the observations were below Vmp.The observations were not distributed upwards towards the calculated maximumrange speed, as in other species, and there were no observations over Vmr. The highestimates for Vmp and Vmr (14-2 and 23-2ms~1, respectively) reflect the fact that theshag's wing span (l-04m) is very short in relation to its mass (1-81 kg). To reduce theestimate for Vmp to, say, 12 ms"1 (which would remove the anomaly) one couldargue that the induced power is much lower than assumed. On present assumptions,the wing would have to behave as though its span were about 1-35 m, which seemsimprobable. Alternatively, the parasite drag, or perhaps the wing profile drag, wouldhave to be very much greater than assumed. This does not seem likely either, as suchan assumption, applied to the auks, would produce an anomaly in the other direction.
The best interpretation seems to be that shags, unlike the other species, really doundertake foraging flights at speeds only a little above their minimum power speed.The observation may reflect a simple scale effect, which has been discussed else-where (Pennycuick, 1975). As flying animals increase in size, the power required tofly increases more steeply than the power available from the muscles. There is somevalue of body mass at which a bird of a particular morphological type has only just

Flight of seabirds 347
enough power to maintain its maximum range speed in level flight. As the bird isscaled up further, its muscle power becomes insufficient to reach Vmr, and the speedsavailable to it become restricted to a progressively narrower range about Vmp. Thedimensional argument predicts the trend, but does not supply a numerical estimatefor any particular combination of mass and wing span at which flight at the maximumrange speed should no longer be possible. The present observations suggest that theshag is beyond this point. If this interpretation is correct it can be used as acalibration, to insert numerical values into the dimensional theory.
My thanks are due to the people of Foula for their well-informed guidance to thebird life of their island, and most especially to John and Isobel Holbourn for theirhospitality, and help with practical problems. I am especially indebted to Dr R. W.Furness for his help with arrangements for the trip, and for supplying informationwhich has been used in this paper.
REFERENCESCROXALL, J. P. & PRINCE, P. A. (1980). Food, feeding ecology and ecological segregation of
seabirds at South Georgia. J. Linn. Soc. (Biol.) 14, 103-131.FURNESS, R. W. (1983). The Birds of Foula. Ambleside: Brathay Trust.NELSON, J. B. (1978). The Gannet. Berkhampstead: Poyser.PENNYCUICK, C. J. (1975). Mechanics of flight. In Avian Biology, vol. 5 (ed. D. S. Farner & J. R.
King), pp. 1-75. New York: Academic Press.PENNYCUICK, C. J. (1978). Fifteen testable predictions about bird flight. Oikos 30, 165-176.PENNYCUICK, C. J. (1982a). The ornithodolite: an instrument for collecting large samples of bird
speed measurements. Phil. Trans. R. Soc. Ser. B 300, 61-73.PENNYCUICK, C. J. (1982Z>). The flight of petrels and albatrosses (Procellariiformes), observed in
South Georgia and its vicinity. Phil. Trans. R. Soc. Ser. B 300, 75-106.PENNYCUICK, C. J. (1983). Thermal soaring compared in three dissimilar tropical bird species,
Fregata magnificens, Pelecanus occidentalis and Coragyps atratus.J. exp. Biol. 102, 307-325.PENNYCUICK, C. J. (1986). Flight of seabirds. In Seabirds: Feeding Ecology and Role in Marine
Ecosystems (ed. J. P. Croxall). Cambridge: Cambridge University Press.PRIOR, N. C. (1984). Flight energetics and migration performance of swans. Ph.D. thesis,
University of Bristol.RAYNER, J. M. V. (1985). Linear relations in biomechanics: the statistics of scaling functions.
J. Zool., Lond. A 206, 415-439.