Embed Size (px)
Citation preview

1 2 3 4
FLEXURAL TESTS OF FOAM-VOID PRECAST DOUBLE TEE MEMBERS FOR 5 PARKING DECKS 6
7 Srimaruthi Jonnalagadda, PhD, Metromont Corp., Greenville, SC 8
Sachin Sreedhara, MS Student, Clemson University, Clemson, SC [email protected] 9 Mahmoodreza Soltani, PhD, EIT, Lecturer, Clemson University, Clemson, SC 10
Brandon E. Ross, PhD, PE, Assistant Professor, Clemson University, Clemson, SC 11 12 13
ABSTRACT 14 15 Gross vehicular weight restrictions limit the shipping of typical prestressed concrete 16 double-tees (DT) for parking decks to one member per trip. The objective of this study 17 is to reduce the self-weight of these members to facilitate two-at-a-time shipping, and 18 thus enable lower shipping costs and reduced environmental footprint. In this research 19 two 35 foot-long DT members were fabricated and tested to study strategies for 20 reducing self-weight. Foam boards were placed inside the stems of the DT members to 21 produce foam-void double-tees (FVDT). One inch and two inch-thick foam boards were 22 used along with normal and semi-light weight concretes. The two FVDT members were 23 cut length-wise through the top flanges to create four unique single-tee specimens, 24 which were then load tested to evaluate structural capacity and behavior. This paper 25 discusses the experimental setup and results of flexural testing. The test results 26 demonstrated that the presence of foam boards had negligible effect on flexural 27 performance; each of the foam-void specimens supported an experimental moment that 28 was greater than the calculated nominal moment capacity. Furthermore, the foam-29 void specimens displayed significant ductility. 30
31 32 Keywords: Parking Garages, Trucking, Shipping, Testing, Flexure, Self-weight 33 34 35

Jonnalagadda, Sreedhara, Soltani and Ross 2018 PCI/NBC
2
INTRODUCTION 36 37 Double-Tees (hereafter referred to as “DT”) members (Fig. 1) are a staple of the precast 38 concrete industry. Millions of square foot of DT members are fabricated in the United States 39 annually. These members offer flexibility in design and construction, and are an ideal choice 40 for structures such as parking garages that require long uninterrupted spans and high load 41 carrying capability. Because of their widespread use, small improvements in the efficiency of 42 DT members can have a significant effect on the overall environmental footprint and economic 43 competitiveness of the precast industry. 44 45
46 Fig. 1. Double-tee members 47 48 The Gross Vehicular Weight (GVW) limit for US highways – 80 kip in most states and 49 circumstances – can limit the economical use of DT members. Due to the magnitude of their 50 self-weight, typical 60 ft.-long parking garage DTs cannot be legally transported two per truck. 51 The current research is motivated by a desire for two-at-a-time transport, which would improve 52 both economic and environmental efficiency. Two-at-a-time shipping has the potential to 53 reduce both costs and emissions from trucking. This paper describes an experimental program 54 that was conducted to evaluate the suitability of foam-void double-tee (FVDT) members (Fig. 55 2). Placing foam voids in the webs of FVDT reduces self-weight and contributes to the 56 possibility of two-at-a-time transport. 57 58

Jonnalagadda, Sreedhara, Soltani and Ross 2018 PCI/NBC
3
59 Fig. 2. Foam-void double-tee (FVDT) 60 61 62 BACKGROUND 63 64 Precast-pretensioned concrete double-tees were first built in 1951. The history of these 65 members in the precast industry has been documented by Nasser et al.1, Wilden2, and 66 Edwards3. The overall form of DT members is well suited for precast concrete construction; 67 standardized cross sections lead to fabrication efficiency and the cross section shape provides 68 structural stability for storage, shipping, erection, and service. The original double-tee cross 69 section (Fig. 3, left) has changed and evolved over the years. The cross section has been 70 modified to account for changes in steel and concrete material properties and to suit different 71 loading conditions. Double-tees have been used as floor, roof, and wall structures of buildings 72 and have also been used in industrial applications and in bridges. The New England Extreme 73 Tee (NEXT) beam (Fig. 3, right) is being used in highway bridges and is one example of a 74 modern DT member. Parking garages are currently one of (if not the) most common 75 applications of DT members. Parking garage DT members (shown in Fig. 1) are the primary 76 focus of the current research, and are relatively more slender than NEXT beams. 77 78
79 Fig. 3. Early DT (left, figure from Edwards) and NEXT beams (right, photo from L. C. 80 Whitford Materials Co., Inc.) 81 82 DT members are fabricated as field-topped or factory-topped (Fig. 4). Factory-topped DTs 83 have thicker top flanges. Once erected, the flanges act as floor and roof diaphragms. 84 Connections between adjacent factory-topped members are detailed to resist differential 85

Jonnalagadda, Sreedhara, Soltani and Ross 2018 PCI/NBC
4
vertical movement and to carry diagraph forces. Field-topped members have thinner top 86 flanges and have a concrete topping placed on them after erection. The topping acts 87 compositely with the precast to carry vertical and diaphragm loads. Reinforcement for the 88 diagram is placed in the cast-in-place topping. Field-topped members are commonly used in 89 regions with high seismic loads. The current study focuses exclusively on field-topped DTs. 90 91
92 Fig. 4. Field-topped (left) and factory-topped (right) 93 94 Reducing the self-weight of DT members has been the subject of previous research. Barney 95 et al.4 , Savage et al.5 and Saleh et al.6 studied DT beams with web openings (Fig. 5). In these 96 studies, concrete was eliminated from locations in the web that do not contribute significantly 97 to stiffness or flexural strength. Special reinforcement was used around the web openings to 98 carry shear forces. Researchers considered the location of openings and reinforcement around 99 the openings as variables. When tested, the behavior of the beams was similar to that of a 100 Vierendeel truss. The test specimens with web openings demonstrated satisfactory strength or 101 serviceability. To achieve adequate structural performance for this type of member, shear 102 reinforcement must be provided adjacent to openings and the openings must be placed away 103 from the end regions. 104 105
106 Fig. 5. Single tee with web openings (photo courtesy- M. Tadros5) 107

Jonnalagadda, Sreedhara, Soltani and Ross 2018 PCI/NBC
5
The proprietary BubbleDeck system7 is another example of reducing structure self-weight by 108 placing voids where concrete is not needed for structural capacity. The BubbleDeck system 109 has won numerous awards for its “green” features. The current research on foam-void double-110 tee members takes a similar approach to BubbleDeck; foam is used to displace concrete (and 111 thus reduce self-weight) at locations where the concrete is not needed for structural purposes. 112 Development of FVDT members aims to enhance the precast industry’s ability to produce 113 products that are competitive in an increasingly eco-aware and green construction marketplace. 114 115 116 EXPERIMENTAL PROGRAM 117 118 The experimental program was conducted to study flexural and shear capacities of members 119 with foam voids. For efficiency in testing, each “specimen” in the study was a single-tee 120 member. Four total specimens were fabricated by cutting two FVDT members lengthwise. 121 This paper will focus on flexural testing of three of the specimens; results from the fourth 122 specimen were not available at the time of writing. Four point bending tests were conducted 123 on the specimens in different load stages from 50% of service load to ultimate load. A 124 comprehensive report of the test program will be available in a forthcoming thesis. 125 126 SPECIMEN DETAILS AND CONSTRUCTION 127 128 Specimens were created from two 35’ long 12DT28 members. One of the members was cast 129 with normal weight concrete (145 pcf) and the other with semi-light weight concrete (126 130 pcf). One stem of each DT member had a 1 in.-thick foam board, and the other stem had a 2 131 in.-thick foam board. The percentage of weight reduction relative to a solid (non-foam void) 132 specimen due to the inclusion of 1 in.-thick foam board was 4.0 % and due to 2 in.-thick 133 foam board was 8.1 %. Cross section, elevations, prestressing, and reinforcement details of 134 the specimens are shown in Fig. 6 and Fig. 7. The cut-off location (5 ft. from the ends), 135 length (25 ft.), and depth (12 in.) of the foam boards were the same in all four specimens. 136 Each specimen was given a unique identification based on its variables (Fig. 8). 137 138 The foam boards were Extruded Polystyrene (XPS) foam. EPS (Expanded polystyrene foam) 139 foam is also commonly used in precast members. Foam boards have relatively low weight 140 and high R-value and are typically used as insulation in precast sandwich panels. EPS is less 141 costly than XPS, but has lower mechanical and thermal properties relative to XPS. Because 142 XPS is more robust, XPS foam boards were used in this project. 143 The test specimens were fabricated in the same bed as production members for a building 144 project, and the strand pattern (Fig. 6) was based on the production members. Because the test 145 specimens had a shorter span that the production members, stresses in the specimens were 146 controlled by debonding the top-most strand. For safety purposes, a 3 ft. segment of the top-147 most strand was bonded at mid-span. 148 149 Transverse reinforcement in the specimens were custom-made #3 stirrups (Fig. 9), which 150 included a gap for holding the foam board. The transverse reinforcement was anchored down 151 by the strands, and the foam was anchored down by the stirrups. Concrete and reinforcement 152

Jonnalagadda, Sreedhara, Soltani and Ross 2018 PCI/NBC
6
material properties are listed in Table 2. The members were fabricated at a plant in 153 Spartanburg, South Carolina in fall 2015. Photos of construction are shown in Fig. 10 and Fig. 154 11. 155 156
157 Fig. 6. Specimen cross section 158 159

Jonnalagadda, Sreedhara, Soltani and Ross 2018 PCI/NBC
7
160 Fig. 7. Specimen vertical reinforcement 161 162 163
164 Fig. 8. Specimen identification based on variables 165 166 167

Jonnalagadda, Sreedhara, Soltani and Ross 2018 PCI/NBC
8
168 Fig. 9. Custom #3 stirrup used as transverse reinforcement 169 170
171 Fig. 10. FVDT prior to casting 172 173

Jonnalagadda, Sreedhara, Soltani and Ross 2018 PCI/NBC
9
174 Fig. 11. Concrete placement in stem 175 176 177
Table 1. Material properties of concrete and reinforcement 178
179
Material Properties
Semi-light weight concrete
28 day compressive strength: 7810 psi 401 day compressive strength: 11310 psi 441 day compressive strength: 10360 psi Unit weight: 126 pcf Note: The same concrete was used for all LWC beams. Load tests were conducted between days 401 and 441.
Normal weight concrete
28 day compressive strength: 7270 psi 464 day compressive strength: 9610 psi 576 day compressive strength: 10790 psi Unit weight: 145 pcf Note: The same concrete was used for all NWC beams. Load tests were conducted between days 464 and 576.
#3 reinforcing bars
ASTM 615M-14 Grade 420/60 Yield Strength: 77.4 ksi (534 MPa) Tensile strength: 107 ksi (738 MPa) Note: properties based on rebar supplier documentation
9/16 in. diameter strands Type: Low- Relaxation Strands Tensile Strength: 270 ksi

Jonnalagadda, Sreedhara, Soltani and Ross 2018 PCI/NBC
10
180 TEST SET-UP AND PROCEDURES 181 182 Specimens were loaded in four-point bending (Fig. 12). Steel “saddles” provided stability to 183 the single-tee specimens at each support (Fig. 13). Load was applied quasi-statically using a 184 hydraulic jack system. A steel I-beam was used spread load from the jack to the specimen 185 (Fig. 14). Rubber bearing pads were used at all support and load points. 186 187
188 Fig. 12. Four-point bending test set-up. All dimensions are with respect to centerline of 189 supports and load points. 190 191
192 Fig. 13. Specimen braced by “saddle” at each support 193

Jonnalagadda, Sreedhara, Soltani and Ross 2018 PCI/NBC
11
194 Fig. 14. I-beam used for spreading load from jack 195 196 The specimens, boundary conditions, and load locations were designed such that the shear 197 forces and flexural-tension stresses in the specimens mimicked those of a typical 60 ft.-long 198 parking garage DT member. At an experimental load of approximately 28 kip (total for both 199 load points), the flexural-tension stress in the specimens was approximately equal to the 200 service-level stress in a parking garage DT. Also at a load of 28 kip, shear force in the 201 specimens was approximately the same as the service-level shear force in a parking garage DT. 202 203 Displacement, strain, and force were monitored and logged using a computer data acquisition 204 system. The instrumentation placement is shown in Fig. 15 and Fig. 16. Six strain gauges 205 monitored the concrete strain; two were placed at the edges of the foam voids, two at the bottom 206 of the member below the load points, and two on top of the flange at mid-span. Four string 207 potentiometers measured vertical displacement at mid-span; two were attached to the stem and 208 two were attached to the flange. 209 210
211 Fig. 15. Strain gauge (SG) locations 212

Jonnalagadda, Sreedhara, Soltani and Ross 2018 PCI/NBC
12
213 Fig. 16. String pots (SP) locations. All SPs attached at mid-span 214 215 Specimens were loaded in seven different stages, in the following order: 216 217
1. Load to 50 % of flexural service load 218 2. 100 cycles between 20% to 50% of flexural service load 219 3. Load to 100% of service load 220 4. 100 cycles between 20% to 100% of flexural service load 221 5. 24-hour sustained load test (specimen L2 only) 222 6. Load to ultimate flexural capacity 223 7. Shear load test (used different boundary conditions) 224
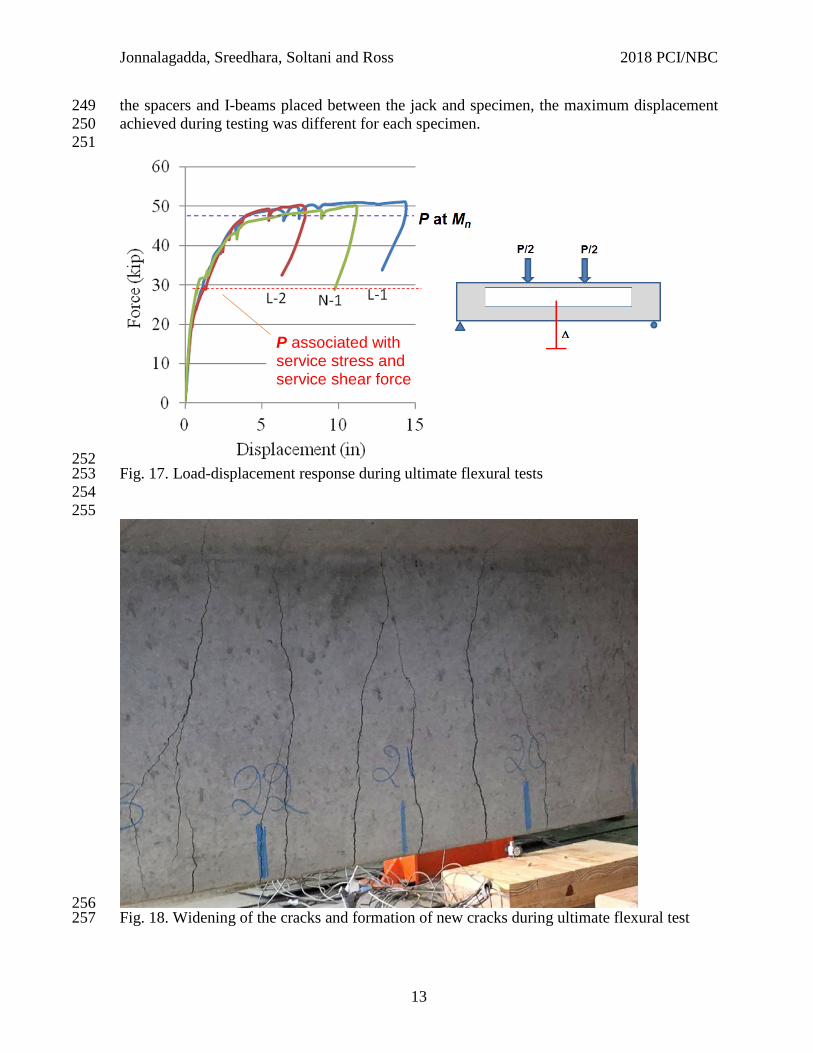
225 This paper will focus on the results of the load stage 6, quasi-static loading to ultimate flexural 226 capacity. Other than flexural cracking, the specimens did not experience any damage during 227 load stages 1 to 5. A complete discussion of service, cyclic, and shear load stages will be 228 available in the forthcoming thesis. 229 230 RESULTS AND DISCUSSION 231 232 Load-displacement behavior during ultimate flexural tests is shown in Fig. 17. Load in the 233 figure is the total applied load from the hydraulic jack; self-weight is not included. 234 Displacement is the mid-span displacement due to applied loads only, and is the average of all 235 string potentiometers. The figure also shows the loads associated with service stress, factored 236 shear, and nominal flexural capacity. Comparisons with flexural capacity will be made in the 237 next section. 238 239 Load-displacement behavior was similar for all specimens during the ultimate flexural tests. 240 Response was initially linear-elastic. Stiffness decreased as flexural cracking opened at a load 241 of approximately 15 kip. Note that these cracks had already formed during service load testing, 242 so opening of the cracks at 15 kip corresponded to decompression of the pre-stress. 243 244 New cracks formed and existing cracks extended (Fig. 18) as load was increased beyond the 245 previous peak of 28 kip (from the service load tests). As the force approached 50 kip, stiffness 246 was effectively gone and the displacement was imposed without significant increase in load. 247 Testing continued until the jack reached its maximum stroke length. Because of changes in 248
Jonnalagadda, Sreedhara, Soltani and Ross 2018 PCI/NBC
13
the spacers and I-beams placed between the jack and specimen, the maximum displacement 249 achieved during testing was different for each specimen. 250 251
252 Fig. 17. Load-displacement response during ultimate flexural tests 253 254 255
256 Fig. 18. Widening of the cracks and formation of new cracks during ultimate flexural test 257
P associated with service stress and service shear force

Jonnalagadda, Sreedhara, Soltani and Ross 2018 PCI/NBC
14
Crushing of the top flange was not observed in any of the specimens during the ultimate 258 flexural tests. It is likely that the specimens could have supported additional displacement prior 259 to crushing of the flange; however, it is not likely that the peak load would not have increased 260 significantly. Residual displacement of approximately 4 to 9 inches was observed in the 261 specimens after the load was removed. 262 263 Each specimen’s behavior was ductile at loads near the peak experimental load. However, 264 relative ductility of specimens cannot be compared using the available data. As previously 265 mentioned, testing was terminated when the hydraulic jack reached the maximum stroke; based 266 on differences (height of spreader beam and spacers between the specimen and jack) in test 267 setups, the available stroke length was different for each test. Thus, the apparent differences in 268 ductility are a function of testing limitations and not a function of the specimens. 269 270 Strain gages G1 and G4 were placed at angle on the concrete surface near the foam ends (Fig. 271 19) to monitor for cracking. This location is of interest because of the abrupt change in cross 272 section due to termination of the foam. Load-strain response of these gages was effectively 273 linear-elastic throughout the ultimate flexural tests (Fig. 19), suggesting that cracks did not 274 form at this location. Visual inspection during testing also confirmed that cracks did not form 275 in the concrete adjacent to the ends of the foam. Thus, it is considered unlikely that shear cracks 276 would form at this location in FVDT parking garage members having similar detailing and 277 material properties at the test specimens. 278 279
280 Fig. 19. Load-strain response at edges of the foam during ultimate flexural tests 281 282

Jonnalagadda, Sreedhara, Soltani and Ross 2018 PCI/NBC
15
COMPARISON WITH NOMINAL FLEXURAL CAPACITY 283 284 Flexural capacity was calculated using the strain compatibility approach. Calculations used the 285 constitutive model for strands from the PCI Design Handbook8. Average concrete compressive 286 strength was taken to be 9380 psi for NWC and 9880 psi for LWC. The presence of foam did 287 not impact the calculations because the theoretical compression block was within the flange at 288 nominal capacity. In each case, the maximum experimental moment exceeded the calculated 289 nominal flexural capacity (Table 3). On an average the specimens supported experimental 290 moments that were 15% larger than their nominal flexural capacities. 291 292 Table 2. Comparison of experimental and nominal moments 293
Specimen
Max moment due
to self-weight (kip-ft)
Max moment due to applied
load (kip-ft)
Total experimental
moment, Mexp
(kip-ft)
Nominal flexural capacity,
Mn (kip-ft)
Strength
ratio, Mexp/Mn
L1 36.1 318.8 354.9 307.1 1.16 L2 34.6 312.5 347.1 307.1 1.13 N1 41.6 312.5 354.1 306.9 1.15
Average 1.15 294 295 SUMMARY AND CONCLUSIONS 296 297 This paper reports the results of flexural testing on three foam-void precast pre-stressed tee-298 beams. The tests were part of a larger experimental program focusing on the use of foam voids 299 to reduce self-weight of precast DT members. The motivation for the research was to reduce 300 the self-weight of parking garage DT members such that two members can be shipped in one 301 load. 302 303 Three key observations are made regarding the testing: First, the foam-void test specimens 304 demonstrated ductile flexural behavior at ultimate loads. Second, the specimens supported 305 experimental moments that exceeded theoretical nominal capacity. The ratios of experimental-306 to-nominal moment were 1.16, 1.13, and 1.15 for specimens L1, L2, and N1 respectively. 307 Third, cracking was not observed at the end of the foam voids at ultimate load levels. Thus, 308 cracking at the foam ends would not be expected in service conditions for similar foam-void 309 members. 310 311 The above observations are specific to the specimens and are conditional on the concrete 312 strength, transverse reinforcement, and other structural details. The minimum compressive 313 strength for any specimens at the time of testing was 9610 psi. Transverse reinforcement 314 consisted of double-leg #3 stirrups spaced at 12 in. It is recommended that follow-up studies 315 consider members with lower concrete strengths and less shear reinforcement. 316 317 318

Jonnalagadda, Sreedhara, Soltani and Ross 2018 PCI/NBC
16
ACKNOWLEDGEMENTS 319 320 Funding for Dr. Srimaruthi Jonnalagadda was provided by the Daniel P. Jenny Fellowship 321 Program. Specimens were donated by Tindall Corporation. Mr. Sreedhara’s work was funded 322 by the Clemson University Glenn Department of Engineering and by the Clemson University 323 School of Architecture. Assistance in the lab was provided by Scott Black, Danny Metz, Sam 324 Biemann, Frank Filosa, Anish Uppala, Ahmad Tarawneh, Mathew Thorn, and Ninad 325 Deshpande. 326 327 328 REFERENCES 329
330 1. Nasser, G., Tadros, M., Sevenker A., and Nasser D., “The Legacy and Future of an 331
American Icon: The Precast, Prestressed Concrete Double Tee,” PCI Journal (2015). 332 2. Wilden H. “Setting the Record Straight on the Origin of the Prestressed Double Tee” 333
(2014) http://www.enconunited.com/pdf/Double%20Tee%20Origin.pdf Accessed 334 28 June 2017. 335
3. Edwards, H., “The Innovators of Prestressed Concrete in Florida.” PCI Journal 336 (1978). 337
4. Barney, G., Corley, W., Hanson, J., and Parmelee, R., “Behavior and Design of 338 Prestressed Concrete Beams with Large Web Openings,” PCI Journal (1977). 339
5. Savage, J., Tadros, M., Arumugasaamy, P., and Fischer, L “Behavior and Design of 340 Double Tees with Web Openings,” PCI Journal (1996). 341
6. Saleh, M., Tadros, M., Einea, A., Fischer, L., and Foster, E “Standardized Design of 342 Double Tees with Large Web Openings.” PCI Journal, (1999). 343
7. BubbleDeck Systems. (2008), http://www.bubbledeck.com/ Accessed 28 June 2017. 344 8. PCI. “PCI Design Handbook 7th Edition” Precast/Prestressed Concrete Institute 345
(2010). 346