Embed Size (px)
Citation preview

Advanced Steel Construction Vol. 10, No. 4, pp. 385-403 (2014) 385
FLEXURAL BEHAVIOR OF LIGHTWEIGHT AGGREGATE CONCRETE FILLED STEEL TUBE
Fu Zhongqiu, Ji Bohai*, Maeno Hirofumi, Eizien A. and Chen Jiashu
College of Civil and Transportation Engineering, Hohai University, Nanjing 210098, China
*(Corresponding author: E-mail: [email protected])
Received: 28 September 2012; Revised: 24 March 2013; Accepted: 18 October 2013
ABSTRACT: To study the flexural behaviour of lightweight aggregate concrete filled steel tubes (LACFST), 21 LACFST specimens and 8 steel tubes without filling concrete were tested under pure bending load. The parameters considered are: steel tube diameter and thickness, lightweight aggregate concrete (LAC) strength and shear span ratio. According to the test results, the failure mode, deflection and failure process were studied and their influence on the flexural behaviour of LACFST was analyzed. Several codes were used to calculate the stiffness and moment capacity. Based on the mechanical equilibrium and combined strength, two methods were provided to calculate the moment capacity in this paper. The calculated results were verified with the test ones. The constitutive model of confined LAC in compressive region was also proposed and used in the FEM to analyze the flexural behaviour of LACFST. This study showed the strain distribution agreed with the Bernoulli-Euler’s theory. The deflection along the length distributed as half sine wave curve during the test. The moment capacity of LACFST increased as the steel ratio and LAC strength increased. But the shear span ratio had almost no influence on the flexural behaviour of LACFST. The comparison between the calculation and the test showed the results of AIJ (1997) for stiffness and DL/T5085 for moment capacity fitted with the test ones well. But the results using the two proposed methods had a better accuracy to calculate the moment capacity. The FEM analysis showed the constitutive model of confined LAC in compressive region was also proved having a good accuracy. Keywords: Lightweight aggregate concrete filled steel tube, flexural behaviour, stiffness, moment capacity, calculation method
1. INTRODUCTION Recently concrete filled steel tube (CFST) has wide applications in structures because of its high bearing capacity, lightweight, small cross section, good seismic performance and so on [1-4]. Under compressive loading, steel casing in CFST provides potential confinement to the concrete core which boosts the capacity and ductility of the concrete. Also concrete core can delay steel tube local buckling appearance. Therefore, CFST is always used as compression members. But because of the high bearing capacity and small cross-sectional area, it is application as a beam structure has advantages too. Many researchers have focused their studies on the behavior of CFST at the practical application [5-7]. Therefore, a flexural performance of CFST needs to be studied more deep theoretically [8-10]. In fact, CFST has already been used as flexural member of bridges, such as the composite beam of Shinkansen bridge in Japan [11]. In China, there are 5 CFST space truss beam bridges already which are Zidong Bridge in Guangdong, Xiangjiaba Bridge in Hubei, Wanzhou Bridge in Chongqing, Wan`ang Bridge in Chongqing, Ganhaizi Bridge in Sichuan. According to the beam, especially the large span ones, their self-weight has a significant impact on their structural behavior. Thus, as the lightweight aggregate concrete has lighter weight than the normal concrete it may replace the second one to fill the steel tubes. Previous researches [12-13] show that LACFST has excellent mechanical performance which is similar to that of CFST. Also, they confirmed that LACFST can be used in structures instead of CFST. In addition, if LACFST applied in beams, the height of the beam section and the cost of the basis will obviously reduced.

386 Flexural Behavior of Lightweight Aggregate Concrete Filled Steel Tube
In 2003, Assi IM studied 34 square and rectangular steel tubes (1000mm length) filled with foamed and lightweight aggregate concrete experimentally to evaluate the ultimate moment of these beams [14]. But till now, there is a few researches concern the flexural performance of LACFST beams. Although, there are some flexural performance conclusions about normal CFST, it is not decided yet whether these conclusions are applicable to LACFST or not till now. Thus, there is a need for more studies in this concern. Based on the previous studies carried by the authors [15-16] on the compressive performance of LACFST, the behavior of circular LACFST under pure bending was studied. 2. EXPERIMENTAL INVESTIGATIONS 2.1 Material The coarse aggregate of lightweight aggregate concrete is haydite. The bulk density is 814 kg/m3, the cylindrical compressive strength is 8.5MPa, and the ratio of water absorption ratio is 6% an hour. Ordinary Portland cement was used for the concrete. According to the relevant Chinese standards, compression tests were carried out on a number of standard cubes ([150×150×150] mm) to determine the concrete grade and prisms [150×150×300] mm in order to determine the compressive strength (fck) and elastic modulus (Ec) of the unconfined concrete. The cubes and prisms were cured at room temperature. The concrete mix proportion and mechanical properties are given in Table 1 and Table 2 respectively.
Table 1. Mixture Mass per Cubic Meter LAC Concrete (kg)
Item Cement Haydite Sand Water Mineral powder Water reducer
Mix 1 460 670 650 170 0 0 Mix 2 450 650 650 125 50 3
Table 2. Mechanical Properties of LAC Concrete
Item Cubic strength 28d fcu (MPa)
Cubic strength 105d fcu (MPa)
Prism strength 105d fck (MPa)
Elastic Modulus Ec (GPa)
Bulk density (kg/m3)
Mix 1 44.8 49.9 31.3 24.0 1810 Mix 2 53.6 59.2 41.2 26.8 1910
Straight welded steel tube Q235 was used in the test. A group of three standard specimens tested to determine the tensile strength of the steel where the thickness of each section of steel tube made into the interception of the standard specimen. The test method followed the regulations of Chinese standard "Metallic materials at ambient temperature tensile test method" (GB/T228-2002) (2002). The data was collected by TS3890 pseudo-dynamic strain instrument during the test process. The stress and strain relationship of specimen is shown in Figure 1. The Yield strength is 298.5 MPa and 274.7MPa for the steel with 2.5mm thickness and 3.8mm thickness respectively. The yield strain can be taken asε= 2000×10-6 from Figure 1.

Fu Zhongqiu, Ji Bohai*, Maeno Hirofumi, ElZIEN A. and Chen Jiashu 387
0 4000 8000 12000 16000 200000
50
100
150
200
250
300
350
=2000×10-6
/M
Pa
(×10-6)
0 4000 8000 12000 16000 20000
50
100
150
200
250
300
(×10-6)
=2000×10-6
/M
Pa
(a) t=2.5mm (b) t=3.8mm
Figure 1. Stress versus Strain Curve of Steel 2.2 Specimen In this study, 21 LACFST specimens and 8 steel tube specimens without filling concrete were tested. Two types of steel tube used with diameters of 114mm and 165mm. The total length L of steel tube was 1400mm and 1700mm with effective span Lo =1200mm and 1500mm respectively. The two ends of the steel tube were flatted then, before concrete pouring, a circular plate with 8mm thickness welded on one end of each tube. During concrete pouring, the angle between the steel tube and the ground was larger than 70o. Then, a concrete shaking table used to vibrate it and to ensure its density. Two weeks later, surface hollows due to shrinkage filled up with grout to confirm the specimen side smoothness. To observe the slip between the steel tube and LAC, two identical circular plates welded on both ends of some of the test specimens, while the rest of the specimens welded on one end only. The specimens cured by natural conditions. The details of the test specimens are shown in Table 3.
Table 3. Details of the Test Specimens
Specimens Pipe size (mm) Lo
(mm) La
(mm)λ
fy (MPa)
fck
(MPa)
Mu
(kN·m) D t L
CS114-2.5-30-A 114 2.5 1400 1200 300 2.6 11.47 CS114-2.5-30-B 114 2.5 1400 1200 300 2.6 0.09
4298.5 31.3 11.75
CS114-2.5-30-C 114 2.5 1400 1200 300 2.6 12.02
CS114-2.5-50-A 114 2.5 1400 1200 300 2.6 13.17
CS114-2.5-50-B 114 2.5 1400 1200 300 2.6 0.094
298.5 41.2 11.94
CS114-2.5-50-C 114 2.5 1400 1200 300 2.6 12.3
CS114-3.8-30-A 114 3.8 1400 1200 300 2.6 14.72
CS114-3.8-30-B 114 3.8 1400 1200 300 2.6 0.148
274.7 31.3 15.88
CS114-3.8-30-C 114 3.8 1400 1200 300 2.6 15.08
CS114-3.8-50-A 114 3.8 1400 1200 300 2.6 17.56 CS114-3.8-50-B 114 3.8 1400 1200 300 2.6 0.14
8274.7 41.2 16.13
CS114-3.8-50-C 114 3.8 1400 1200 300 2.6 16.56
CS165-2.5-30-A 165 2.5 1400 1200 300 1.8 20.72
CS165-2.5-30-B 165 2.5 1400 1200 400 2.4 0.063
298.5 31.3 22.96
CS165-2.5-30-C 165 2.5 1700 1500 500 3.0 21.48
CS165-3.8-30-A 165 3.8 1400 1200 300 1.8 37.81

388 Flexural Behavior of Lightweight Aggregate Concrete Filled Steel Tube
CS165-3.8-30-B 165 3.8 1400 1200 400 2.4 0.099
274.7 31.3 36.93
CS165-3.8-30-C 165 3.8 1700 1500 500 3.0 37.9
CS165-3.8-50-A 165 3.8 1400 1200 300 1.8 37.8 CS165-3.8-50-B 165 3.8 1400 1200 400 2.4 0.09
9274.7 41.2 40.08
CS165-3.8-50-C 165 3.8 1700 1500 500 3.0 38.7
ST114-2.5-A 114 2.5 1400 1200 300 298.5
9.73
ST114-2.5-B 114 2.5 1400 1200 300 9.78
ST114-3.8-A 114 2.5 1400 1200 300 274.7
12.57
ST114-3.8-B 114 3.8 1400 1200 300 12.48
ST165-2.5-A 165 2.5 1400 1200 300 298.5
16.38
ST165-2.5-B 165 2.5 1400 1200 300 16.00
ST165-3.8-A 165 3.8 1400 1200 300 274.7
31.45 ST168-3.8-B 165 38 1400 1200 300 30.64
Note: 1. D is the external diameter, t is the thickness, L, Lo, La stand for the length in Figure 2;
2. fy is the yield strength of steel, fck is the prism strength at 105d; 3. is steel ratio, =As/Ac , here As is the area of steel, Ac is the area of concrete; 4. λ is the shear span ratio, λ=La /D; 5. Mu is test ultimate moment corresponding to the load when the steel strain is 0.01.
2.3 Test Instruments and Procedure This experiment performed in the structural engineering laboratory of Hohai University. The details of the test instruments sketched in Figure 2. The load applied on a rigid beam by a hydraulic jack and measured by a pressure sensor. A four-point bending rig used to apply the moment (see Figure 2a). 4 groups and 8 groups of strain gauges set at midspan of each specimen and spread eventually through the beam diameter (114mm and 165mm) respectively. Each group had a longitudinal strain gauge and a hoop strain gauge. There were 5 displacement transducers set to measure the deflection along the span, 3 of them set at one–quarter point and 2 of them set at the supports positions.
displacementtransducer
straingauge
12
3
4
56
7
8
rigid beam
P
LLo
La La1
24
3
D=114mm D=165mm
(a) Loading installations (b) Distribution of strain gauges
Figure 2. Loading and Measurement System
The specimens loaded at rate of 1/10 and 1/15 of the predicted ultimate load in the elastic phase and in the yielding phase respectively. Each load maintained about 2-3 minutes to enable the full deformation development. When approaching the predicted ultimate load, the load added slowly. All the gauges used in this experiment connected to a computer data acquisition system to record their values in the whole test phases (See Figure 3).

Fu Zhongqiu, Ji Bohai*, Maeno Hirofumi, ElZIEN A. and Chen Jiashu 389
Figure 3. General View of the Test Setup Figure 4. Specimen Failure Modes 3. EXPERIMENTAL RESULTS 3.1 Failure Mode Figure 4 shows typical failure modes of LACFST beam. Although, most specimens failed without local buckling but a few of the specimens show unobvious local bucking at the rigid beam supports due to stress concentration caused by supports. Specimens welded on one end only show no slip between steel tube and LAC core. The cracked concrete took the shape of the deformed steel section. Besides, the cracks penetrated the whole section from tension area to compression area and spread evenly as was noticed after removing the steel wall as can be seen in Figure 4. This proved the section acted as a composite one, and the concrete confined by the steel tube. For the steel tube without filling, all specimens failed due to local buckling at the supports locations and mid-span. 3.2 Deflection of Specimen Figure 5 shows a typically measured bending moment versus deflection curves of a group of specimens. From these curves noticed the defection increased slowly as the moment increased before the steel tube reach to the yield strain where, it is almost a straight line. After the steel tube yielding, the deflection increased rapidly. Moreover, all the curves showed no downward tendency when the test was stopped. Figure 6 shows deflection curve along one of a typical tested specimen length under flexure. From this figure it is observed the curves are not symmetrical at the beginning of the test because of the discontinuity of materials. As the load increased, specimen deflection increased and distributed symmetrically due to stress redistribution between the concrete core and steel tube. Also it seemed the deflection curves coincided with half sine wave curves. And this had been improved in Figure 7 which showed the moment versus curvature curves of some specimens.
390 Flexural Behavior of Lightweight Aggregate Concrete Filled Steel Tube
0 2 4 6 8 10 12 14 16 180
2
4
6
8
10
12
14
M/(
kNm
)
u/mm
CS114-2.5-30-A CS114-2.5-30-B CS114-2.5-30-C
0 300 600 900 1200
-80
-60
-40
-20
0
(specimen:CS114-3.8-30-B)
8.20kN.m 14.2kN.m 15.8kN.m 16.6kN.m 17.0kN.m 17.6kN.m 17.9kN.m 18.3kN.m
distance along the length L/mm
defl
ecti
on u
/mm
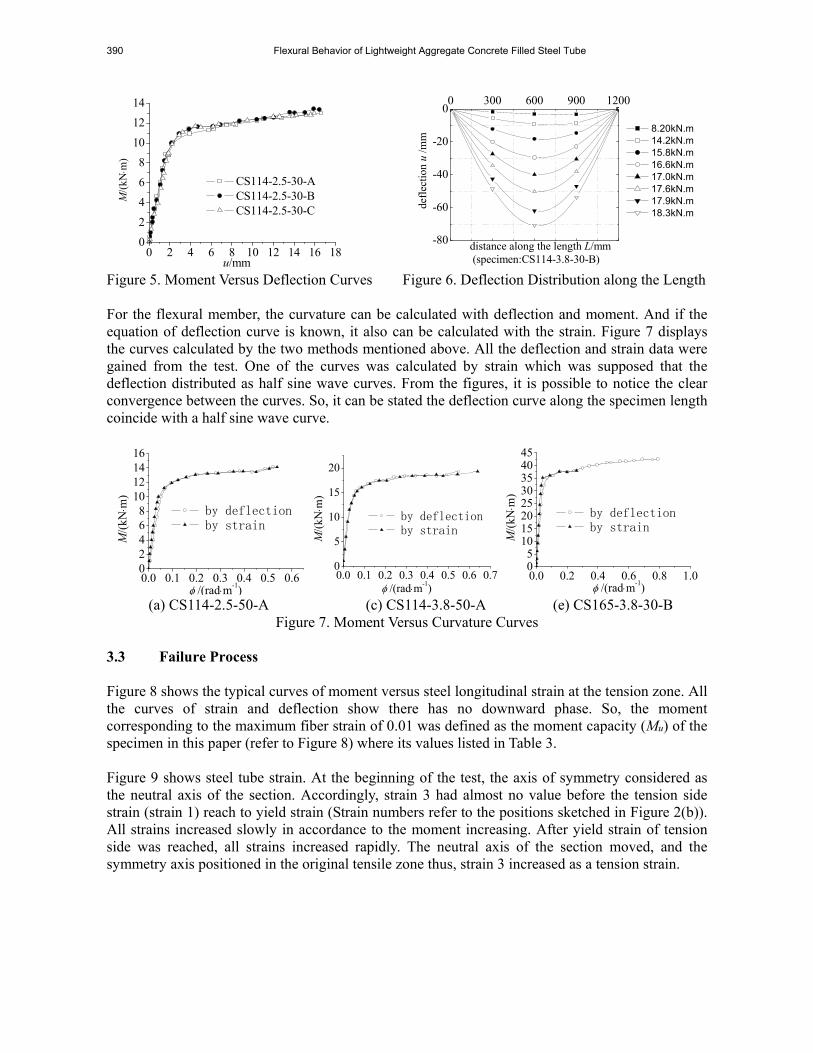
Figure 5. Moment Versus Deflection Curves Figure 6. Deflection Distribution along the Length For the flexural member, the curvature can be calculated with deflection and moment. And if the equation of deflection curve is known, it also can be calculated with the strain. Figure 7 displays the curves calculated by the two methods mentioned above. All the deflection and strain data were gained from the test. One of the curves was calculated by strain which was supposed that the deflection distributed as half sine wave curves. From the figures, it is possible to notice the clear convergence between the curves. So, it can be stated the deflection curve along the specimen length coincide with a half sine wave curve.
0.0 0.1 0.2 0.3 0.4 0.5 0.602468
10121416
M/(
kNm
)
/(radm-1)
by deflection by strain
0.0 0.1 0.2 0.3 0.4 0.5 0.6 0.70
5
10
15
20
M/(
kNm
)
/(radm-1)
by deflection by strain
0.0 0.2 0.4 0.6 0.8 1.005
1015202530354045
M/(
kNm
)
/(radm-1)
by deflection by strain
(a) CS114-2.5-50-A (c) CS114-3.8-50-A (e) CS165-3.8-30-B
Figure 7. Moment Versus Curvature Curves 3.3 Failure Process Figure 8 shows the typical curves of moment versus steel longitudinal strain at the tension zone. All the curves of strain and deflection show there has no downward phase. So, the moment corresponding to the maximum fiber strain of 0.01 was defined as the moment capacity (Mu) of the specimen in this paper (refer to Figure 8) where its values listed in Table 3. Figure 9 shows steel tube strain. At the beginning of the test, the axis of symmetry considered as the neutral axis of the section. Accordingly, strain 3 had almost no value before the tension side strain (strain 1) reach to yield strain (Strain numbers refer to the positions sketched in Figure 2(b)). All strains increased slowly in accordance to the moment increasing. After yield strain of tension side was reached, all strains increased rapidly. The neutral axis of the section moved, and the symmetry axis positioned in the original tensile zone thus, strain 3 increased as a tension strain.

Fu Zhongqiu, Ji Bohai*, Maeno Hirofumi, ElZIEN A. and Chen Jiashu 391
0 8000 16000 24000 320000
3
6
9
12
15
18
21
u
u
=2000×10-6
=10000×10-6
(×10-6)longtidude strain 3
CS114-3.8-30-B
CS114-2.5-30-AM
/(kN
m)
-8000 0 8000 16000 240000
10
20
30
40
(specimen:CS165-3.8-30-B)
(×10-6)
M/(
kNm
)
strain 1 strain 2 strain 3 strain 4 strain 5
Figure 8. Demonstration of Moment Capacity Figure 9. Longitudinal Strain of Steel Tube Figure 10 describes the distribution curves of the longitudinal strains along the beam height. From the Figure it is noticed the section deformation of specimen's agree with the Bernoulli-Euler’s theory at various loading stages. Neutral axis movement pointed out by the change of intersection point between connection line and symmetry axis.
-8000 -4000 0 4000 8000 12000 16000
-8000 -4000 0 4000 8000 12000 16000
-80
-60
-40
-20
0
20
40
60
80
(specimen:CS165-3.8-30-A)
(×10-6)
3.07kN.m 7.40kN.m 13.2kN.m 23.4kN.m 27.7kN.m 31.7kN.m 35.3kN.m 36.3kN.m 37.3kN.m 37.6kN.m 38.4kN.m 38.7kN.m 38.8kN.m 39.1kN.mheight /m
m
Figure 10. Distribution Curves of the Longitudinal Strain along the Beam Height
4. BEARING CAPACITY ANALYSIS 4.1 Influencing Factor Figure 11(a) presents the moment - curvature curves of a specimen with different steel ratios. From the figure, it can be seen the initial stiffness of the specimen and the moment capacity increased as the steel ratio enlarged. In this test, specimens with t=3.8mm showed almost 30% moment capacity higher than the ones with t=2.5mm. As the steel has a higher bearing capacity; higher steel ratio will lead to more effective restrain to the concrete core. So, the higher steel ratio is the larger moment capacity and initial stiffness obtained. From Figure 11(b) it is observed that specimen with higher LAC strength has a larger moment capacity. But, as it is known the moment mainly resisted by the steel tube, therefore; moment capacity increment was unobvious in compare with LAC strength improvement. Figure 11(c) shows the flexural behavior of LACFST and steel tube without concrete filling. From the figure it can be stated that LACFST has a better ductility and bearing capacity than the steel tube without concrete filling. Also, it can be concluded that filling steel tube with LAC can improve its flexural behavior well.

392 Flexural Behavior of Lightweight Aggregate Concrete Filled Steel Tube
0.0 0.1 0.2 0.3 0.4 0.5 0.6 0.7 0.8 0.902468
101214161820
M/(
kNm
)
/(radm-1)
CS114-2.5-50-A CS114-2.5-50-B CS114-2.5-50-C CS114-3.8-50-A CS114-3.8-50-B CS114-3.8-50-C
0.0 0.1 0.2 0.3 0.4 0.5 0.6 0.7 0.802468
10121416182022
CS114-3.8-30-A CS114-3.8-30-B CS114-3.8-30-C CS114-3.8-50-A CS114-3.8-50-B CS114-3.8-50-C
M/(
kNm
)
/(radm-1) (a) Different ratio (b) Different LAC strength
0.0 0.1 0.2 0.3 0.4 0.5 0.6 0.7 0.805
101520253035404550
ST165-3.8-A ST165-3.8-B CS165-3.8-30-A CS165-3.8-30-B CS165-3.8-30-C
M/(
kNm
)
/(radm-1)
0.0 0.1 0.2 0.3 0.4 0.5 0.6 0.7 0.805
101520253035404550
CS165-2.5-30-A; CS165-2.5-30-B CS165-2.5-30-C; CS165-3.8-50-A CS165-3.8-50-B; CS165-3.8-50-C
M/(
kNm
)
/(radm-1) (c) Comparison with steel tube (d) Different shear span ratio Figure 11. Moment Versus Curvature Curves with Different Influencing Factor
Figure 11(d) displays the moment-curvature curves of specimens with different shear span ratio. From the figure it is possible to say the shear span ratio has almost no influence on the flexural behavior of LACFST.
4.2 Stiffness Calculation from the Codes The stiffness of LACFST is a contribution of steel tube and LAC and not only the superposition of the two materials. When the specimen was flexural, the concrete would crack. The concrete could not provide enough stiffness to the composite beam and concrete core contribution to stiffness was reduced. A comparison between calculation formulas from different design codes carried out to study the stiffness of CFST, including AIJ (1997) [17], BS 5400 (1979) [18], EC4(1994) [19], AISC-LRFD (1999)[20] and DBJ13-15(2003)[21]. It was found that all the formulas can be described by expression (1).
ccss ImEIEK (1)
where Es and Ec are the elastic modulus of steel and concrete; Is and Ic are the moment of inertia of steel and concrete; m is concrete contribution reduction factor. In different codes, Es, Ec are defined different ways and determined from the constituent’s materials. The reduction coefficient m takes various values in the different design codes as following: m=0.2 in AIJ (1997); m=1 in BS5400 (1979); m=0.26 in EC4 (1994); m=0.8 in AISC-LRFD (1999) and DBJ13-15(2003).

Fu Zhongqiu, Ji Bohai*, Maeno Hirofumi, ElZIEN A. and Chen Jiashu 393
Table 4 Calculation and Test Results of Stiffness
Specimen
Test value AIJ
(1997) BS5400 (1979)
EC4 (1994)
AISC-LRFD (1999)
DBJ13-51 (2003)
K0.2 K0.6 0.2
CK
K 0.6
CK
K 0.2
CK
K 0.6
CK
K 0.2
CK
K 0.6
CK
K 0.2
CK
K0.6
CK
K 0.2
CK
K 0.6
CK
K
CS114-2.5-30 318.1 268.5 0.98 1.16 1.17 1.39 1.28 1.51 1.26 1.49 1.22 1.45
CS114-2.5-50 309.8 261.1 1.04 1.23 1.39 1.64 1.36 1.62 1.40 1.66 1.29 1.53
CS114-3.8-30 433.3 335.8 1.02 1.31 1.15 1.48 1.21 1.57 1.19 1.53 1.18 1.52
CS114-3.8-50 414.0 347.6 1.08 1.29 1.32 1.57 1.31 1.56 1.32 1.57 1.26 1.50
CS165-2.5-30 960.3 875.6 1.05 1.16 1.35 1.48 1.51 1.66 1.49 1.64 1.42 1.56
CS165-3.8-30 1313.0 1157.6 1.09 1.23 1.29 1.46 1.40 1.58 1.37 1.56 1.34 1.52
CS165-3.8-50 1292.1 1174.3 1.13 1.25 1.50 1.65 1.47 1.62 1.51 1.66 1.40 1.54
MEAN 1.06 1.23 1.31 1.53 1.36 1.59 1.36 1.59 1.30 1.52
STDEV 0.046 0.053 0.113 0.091 0.099 0.045 0.110 0.063 0.085 0.034
Different moments gained from the test due to the different stiffness. So, two stiffness values adopted to check the calculation results. The stiffness corresponding to 0.2Mu and 0.6Mu were defined as initial stiffness (K0.2) and serviceability-level stiffness (K0.6) respectively. Table 4 lists a comparison between the calculation and test results where, the test values are the average ones, and KC is the value calculated by the codes. From Table 4, AIJ code gave the best precision among the other codes compared in this paper. A mean value = 1.06 and a standard deviation (STDEV) = 0.046 for K0.2 gained by AIJ code, while the other codes gave mean values with almost 30% more than the test results. For K0.6, although AIJ gave a mean value =1.23 and STDEV = 0.053 which is not perfect result, the other codes gave mean values with 50% more the test results. So, it is possible to judge that AIJ code is the best predictor for LACFST beam stiffness and can be used to calculate it. Referring to Han Linhai [6], it can be decided the calculation results of LACFST are similar to those of normal concrete (CFST). Therefore, a value equal to 0.2 adopted for m in expression (1). And AIJ code is also suggested to calculate stiffness of LACFST. 4.3 Moment Capacity Calculation of Codes Several expressions in different design codes for normal CFST used to calculate the moment capacity of the specimens. These expressions may be described as follows: For AIJ (1997) [17]
yftDD
ZfM yu 6
)2( 33 (2)
where fy is the yield strength of steel; D is the diameter ; t is the thickness of steel tube. For AISC-LRFD(1999)[20]

394 Flexural Behavior of Lightweight Aggregate Concrete Filled Steel Tube
yftDD
ZfM bybu 6
)2( 33 (3)
where φb=0.9, the other parameters have similar definitions as it is described in Eq. 3. For EC4 (1994) [19]
ccpcnsypanccpcsypau fWfWfWfWM /2
1//
2
1/ '' (4)
)5.0)(4(3/24/)2( 233 rtDrrtDWpc (5)
pcpa WrtDtrtrDW )5.0)(4()(3/)(24/ 233 (6) 2)2( npcn htDW (7)
pcnnpan WDhW 2 (8)
)''
'
//2(4/2
/
ccsycc
ccc
fftDf
fAhn
(9)
where γc=1.5; γs=1.1; fc’ is the cylindrical compressive strength of concrete; r is the internal radius; Ac is the area of concrete; the other parameters have similar definitions as description in Eq. 3.
For DLT5085 (1999) [22]
scscmu fWM (10)
7629.14047.0 m (11)
cksc fCBf )212.1( 211 (12)
974.0235/1759.01 yfB (13)
0309.020/1038.01 ckfC (14)
where ξ=Asfy/(Acfck); Wsc=πD4/32; fck is the concrete strength; As and Ac is the area of steel and concrete respectively. For DBJ13-51(2003) [21]
scscmu fWM (15)
)1.0ln(48.01.1 m (16)
cksc ff )02.114.1( (17)
where all the parameters have the same meanings as it is described in DLT5085 (1999) code above. The results gained from different codes are listed in Table 4. Mu is the average moment capacity value of a group of specimens, Mu
T is the calculated value. Referring to AIJ, BS5400, EC4, AISC-LRFD and DBJ13-15, the mean values for CS-165-2.5-30 group are 0.907, 0.817, 1.007, 1.352 and 1.041 which are larger and abnormal in compare with the other group’s results. So, (CS-165-2.5-30) group is not included in Table 5 because it can’t describe the real condition.

Fu Zhongqiu, Ji Bohai*, Maeno Hirofumi, ElZIEN A. and Chen Jiashu 395
Table 5. Calculated Flexural Capacity Results
Specimen M BuB/
kN·m
AIJ AISC-LRFD EC4 DL/T5085 DBJ13-51 Method 1 Method 2
Cu
u
M
M
Cu
u
M
M
Cu
u
M
M
Cu
u
M
M
Cu
u
M
M
Cu
u
M
M
Cu
u
M
M
CS-114-2.5-30 11.75 0.790 0.711 0.846 1.101 0.873 1.046 0.997 CS-114-2.5-50 12.47 0.744 0.670 0.808 1.099 0.864 1.000 1.095 CS-114-3.8-30 15.23 0.833 0.749 0.863 1.118 0.929 1.077 0.888 CS-114-3.8-50 16.75 0.757 0.681 0.795 1.062 0.875 0.993 0.919 CS-165-3.8-30 37.55 0.723 0.650 0.775 1.014 0.807 0.958 0.928 CS-165-3.8-50 38.86 0.698 0.628 0.760 1.040 0.820 0.940 1.049
MEAN 0.757 0.682 0.808 1.072 0.861 1.002 0.979 STDEV 0.048 0.043 0.040 0.041 0.044 0.052 0.093
By comparing the mean values and standard deviations (STDEV) that listed in table5; it can be recognized; DL/T5085 code gave the best accuracy among the codes consulted in this paper which, gave conservative results and moment capacity with more than 10% deviation from the test results. The results calculated by AIJ and AICS-LRFD are obviously small with deviation ratios more than 24% and 30% respectively and that may attributed to AIJ and AICS-LRFD calculation methods which ignore concrete contribution. Besides, in AICS-LRFD an extra reduction coefficient for the steel tube capacity have been considered. 5. FLEXURAL CAPACITY CALCULATION METHOD 5.1 Method of Mechanical Equilibrium The stress distribution of steel apparently influences the capacity of specimen. So, the strain of steel tube corresponding to moment capacity is listed in Table 6. In this test, the moment capacity took the value when the maximum steel fiber strain was 0.01. Because strain 1 in Figure 2 is the maximum steel fiber strain, all the strains in Table 6 took the values when strain 1 is 0.01.
Table 6. The longitudinal strains of steel tube corresponding to the moment capacity
Specimen Strain 1 (×10-6)
Strain 2 (×10-6)
Strain 3 (×10-6)
Strain 4 (×10-6)
Strain 5 (×10-6)
CFST114-2.5-30-A 10000 2195 -8408 2884
CFST114-2.5-30-B 10012 2987 -7927 2650
CFST114-2.5-30-C 10003 1806 -7350 2940
CFST114-2.5-50-A 10029 2669 -8284 1909
CFST114-2.5-50-B 10051 2791 -3790 2689
CFST114-2.5-50-C 9994 3163 -8256 2445
CFST114-3.8-30-A 10034 1381 -7373 2130
CFST114-3.8-30-B 10024 2445 -7408 -
CFST114-3.8-30-C 10001 1517 -7416 2423
CFST114-3.8-50-A 10033 2793 -9585 2479
CFST114-3.8-50-B 9966 1216 -8032 1603
CFST114-3.8-50-C 10107 464 -8683 1361
CFST165-2.5-30-A 10010 7144 3043 -5542 -5976
CFST165-2.5-30-B 10093 9238 4193 -1962 -3886

396 Flexural Behavior of Lightweight Aggregate Concrete Filled Steel Tube
CFST165-2.5-30-C 9995 7626 2342 -1326 -3040
CFST165-3.8-30-A 10031 7065 2528 -3475 -5494
CFST165-3.8-30-B 10056 6194 2526 -3429 -4309
CFST165-3.8-30-C 10061 7442 2846 -2663 -4246
CFST165-3.8-50-A 9981 9047 1805 -1715 -5824
CFST165-3.8-50-B 10003 7869 3528 -5346 -4892
CFST165-3.8-50-C 10000 7600 2849 -1814 -3685
Referring to table 6, almost all the strain values are larger than 2000×10-6 in response to the beam moment capacity. As the yield strain of steel in this test is about 2000×10-6; the whole steel section yielded corresponding to the moment capacity. If the strain of concrete assumed to reach to the concrete strength corresponding to the moment capacity, then stress distribution and calculation chart may describe as it can be seen in Figure 12.
A'
L L
hR
-hRr
t
¦ Õ¦ È
A's
As
f y
f y
f cA'c
Compression
Tension
Neutral axis
x2
x3
x1
(a) Whole section (b) Steel tube (c) Concrete
Figure 12. Cross-Sectional Stress Distribution Corresponding to Moment Capacity Due to the concrete weakness in tension its impact in the tension zone was ignored. Based on the mechanical equilibrium on the whole section, an equilibrium equation can be expressed in Eq. 18.
''' ysccys fAfAfA (18)
where, As is the tension area of steel; As’ is the compression area of steel; Ac’ is the compression area of concrete; fy’ = fy is the compressive strength of steel; fc is the constrained concrete strength. All the area can be calculated with the size of the section. From the previous study carried [23], the strength of constrained concrete of steel may calculated by expression (19).
pkff kcc (19)
where, k is an enhancing coefficient and according to this study result for LACFST can take a value equal to 3.4 and P is the confining force.
DtDtp lsh /2/2 (20)
where, σsh is the circumferential stress; σl is the longitudinal stress; υ is the lateral deformation coefficient. When reaching to the beam moment capacity, σl=fy and υ can take the Poisson's ratio of steel. So, the following expression can be got.
Dfkff yckc /2 (21)
Fu Zhongqiu, Ji Bohai*, Maeno Hirofumi, ElZIEN A. and Chen Jiashu 397
After calculating the height of the compression area (h) the moment capacity of the section can be found from expression (22).
321 ''' xfAxfAxfAM ysysccu (22)
where, x1, x2 and x3 are the distances between the centroid of compression concrete, compression steel and tension steel area to the neutral axis respectively. 5.2 Method of Combined Strength The method of mechanical equilibrium seems complex. So, an attempt to find a simple method similar to that one proposed by Han Linhai [6] was carried out. Accordingly; the moment capacity Mu can be calculated by using expression (23).
scscmu fWM (23)
scusc ANf / (24)
where, γm is an enhancement coefficient considering the contribution of steel after yielded; Nu is the compressive capacity of a stub LACFST specimen. If the concrete increment strength Considered; Nu can be following expressed according to previous study [24]. Nu= fyAs+βfckAc (25) Where β is the concrete strength increment coefficient and expressed by the following form according to previous study [24]: β=1.36+0.3 ξ (26) Therefore, the capacity of LACFST short stub may calculate by expression (17), and can simplify as shown in Eq. 28. The two expressions (27) and (28) have showed good accuracy to calculate the bearing capacity. The results of expression (27) had a mean of 1.011 with STDEV of 0.045, while the results of expression of (28) had a mean of 0.997 with STDEV of 0.045[24] hence, they are reliable to use. Nu=1.3fyAs+1.36fckAc (27)
)(35.1 ckcsyu AfAfN (28)
So, the two Eqs 29 and 30 can be used to calculate the strength of LACFST and the moment capacity respectively. Steel tube yielded when the section reached to its moment capacity, thus, the enhancement coefficientγm can take a value of 1.1.
cs
cck
cs
ckcsy
sc
usc AA
Af
AA
AfAf
A
Nf
)1(35.1)(35.1
(29)
cckmu AfDM )1(17.0 (30)

398 Flexural Behavior of Lightweight Aggregate Concrete Filled Steel Tube
5.3 Comparison of the Results Table 5 shows the results of the two methods used in this paper to calculate the moment capacity. Besides, Figure 13 was drawn to compare the calculated results and the test ones (Method 1 and Method 2 referred to the method of mechanical equilibrium and the method of combined strength respectively). From the figure, it can be seen that method 1 and method 2 has a mean of 1.002 and 0.979 with STDEV of 0.052 and 0.081 respectively where these figures reflect the good accuracy of the two methods. Because of the simplicity of method 2; the relation between the concrete strength increment coefficient and the confinement coefficient (ξ) expressed linearly. But it is proposed that this linear relation subject to further studies to get a more reliable expression. As a result of this comparison it is suggested to use method 1 to calculate the moment capacity.
10 15 20 25 30 35 40 4510
15
20
25
30
35
40
45
Test Mu (kN.m)
Cal
cul
atio
n M
`uT (
kN.m
)
+10%
-10%
10 15 20 25 30 35 40 4510
15
20
25
30
35
40
45
+10%
-10%
Calculation
M`uT
(kN
.m)
Test Mu (kN.m)
(a)Method 1 (b) Method 2
Figure 13. Comparison of Calculation and Test Results 6. NUMERICAL ANALYSIS
6.1 Constitutive Model of LAC
Formula of cc f58.171788 was proposed to calculation the strain peak value of LAC without constraint [25]. It was used to establish the numerical mode of confined concrete in compressive region. Based on the model of confined normal concrete by Han Linhai [26], the model of confined LAC was proposed. In the model of this paper, the boundary value of confinement coefficient ξ was higher than the one in the model of confined normal concrete. This is because the enhanced strength by the restrain of steel tube for LAC is lower than the one of normal concrete. The relationship between strain and material strength was also fitted based on the previous experimental results [23]. The model of confined LAC in compressive region was proposed as following.
2
0.10 0
0
0 20 0 0
[ ( ) ]
(1 ) ( )
1( )
( / 1) /
oo o
A B
q q
( )
( 1.22)
( 1.22)
o
o
o
,
,
(31)

Fu Zhongqiu, Ji Bohai*, Maeno Hirofumi, ElZIEN A. and Chen Jiashu 399
where, )]5789.007485.0()13
(194.1[ 245.0 ck
cko ff
2.0)]24
24(8001000[
ck
co
f
ckc f58.171788 kA 0.2 kB 0.1 745.01.0 k
1.02.0
kq
42])5.0(25.0[5 100.5)1036.2(7 ckf
The above model was used to calculate the relationship between stress and strain for confined LAC. In Figure 14, the calculation result was compared to the previous experimental one. The detailed introduction about the experiment can be found in reference [23]. In the figure, the specimens were the same one in reference [23]. The load acted on the steel was eliminated and the experiment curves of concrete were gained. From the figures, it shows that the model calculation results were identical with the experiment ones as well. So, the proposed model for confined LAC in this paper was reasonable and can be used in the analysis.
0 3000 6000 9000 12000 150000
20
40
60
80
100
(M
Pa)
experiment result model calculation
0 3000 6000 9000 12000 150000
20
40
60
80
100
(M
Pa
)
experiment result model caculation
(a) SC2-A (b) SC3-A
0 3000 6000 9000 12000 150000
20
40
60
80
100
(M
Pa
)
experiment result model caculation
0 3000 6000 9000 12000 150000
20
40
60
80
100
(M
Pa)
experiment result model caculation
(c) SC4-A (d) SC5-A
Figure 14. Comparison of Confined LAC Model and Experiment Result
The model of confined LAC in tensile region used the model proposed by Han Linhai [26] as following.
6
2 1.7
[1.2 / 0.2( / ) ]
/
0.31 ( / 1) /
p c p c p
c c pp
p c p c p
c p
c p
(32)

400 Flexural Behavior of Lightweight Aggregate Concrete Filled Steel Tube
where, p is the peak value of stress, it can be calculated as 2/30.26(1.25 )p ckf . p is the
strain corresponding to the peak value of stress, it can be calculated as 643.1 10p p .
6.2 The analysis model and result In order to make FEM model, following assumptions were adopted. (1) The deformation of specimen's section agrees with the Bernoulli-Euler’s theory at various loading stages. (2) There was no slip between the steel tube and LAC. (3) The deflection along the length distributed as half sine wave. All of the above three assumptions were proved by the experimental results.
m
ax
x
y
F
BA
x
l
Figure 15. The Simplified Calculation Model for Flexural Behavior of LACFST
The calculation model was simplified to be a cantilever beam model which could reflect the same behavior of the test process. The simplified calculation model is shown in Figure 15. In ANSYS program, SOLID65 was used for LAC and SOLID186 was used for steel tube. Element of TARGE170 and CONTA173 were used for the contact relationship between steel tube and LAC. The mechanical properties of LAC and steel were the same to the results from the test. Von Mises kinematic hardening rule was adopted for steel material. In the stage of plastic hardening, the tangent modulus of steel took 0.01Es (Es is Elastic modulus of steel). In this analysis, the displacement loading method was used.
0.0 0.1 0.2 0.3 0.4 0.5 0.602468
101214
M/(
kNm
)
/(rad,m-1)
CFST-114-2.5-30-A CFST-114-2.5-30-B CFST-114-2.5-30-C calculation
0.0 0.1 0.2 0.3 0.4 0.5 0.6 0.7 0.802468
10121416
M/(
kN.m
)
/(rad.m-1)
CFST-114-2.5-50-A CFST-114-2.5-50-B CFST-114-2.5-50-C calculation
0.0 0.1 0.2 0.3 0.4 0.5 0.6 0.70
4
8
12
16
20
M/(
kN.m
)
/(rad.m-1)
CFST-114-3.8-30-A CFST-114-3.8-30-B CFST-114-3.8-30-C calculation
(a) (b) (c)
0.0 0.1 0.2 0.3 0.4 0.5 0.6 0.70
4
8
12
16
20
M/(
kN.m
)
/(rad.m-1)
CFST-114-3.8-50-A CFST-114-3.8-50-B CFST-114-3.8-50-C calculation
0.0 0.1 0.2 0.3 0.4 0.5 0.6 0.7048
121620242832
M/(
kN.m
)
/(kN.m-1)
CFST-165-2.5-30-A CFST-165-2.5-30-B CFST-165-2.5-30-C calculation
0.0 0.1 0.2 0.3 0.4 0.5 0.6 0.705
1015202530354045
M/(
kN.m
)
/(rad.m-1)
CFST-165-3.8-30-A CFST-165-3.8-30-B CFST-165-3.8-30-C calculation
(d) (e) (f)
Figure 16. Comparison of Test and Calculation Results

Fu Zhongqiu, Ji Bohai*, Maeno Hirofumi, ElZIEN A. and Chen Jiashu 401
The calculation results are shown in Figure 16. As the figure shows, the calculation results fit with the experiment results well. So, it can be got that the constitutive model of LAC established in this paper can be used for the analysis of LACFST with good accuracy. 7. CONCLUSIONS (1) From the test noticed the strain distribution and the deflection distribution along the length at various loading stages agrees with the Bernoulli-Euler’s theory and half sine wave curve respectively. (2) Filling with LAC can obviously improve the flexural behavior of steel tube. The moment capacity of LACFST increased as the steel ratio and LAC concrete strength increased. The shear span ratio almost has no influence on the flexural behavior of LACFST. The increment of moment capacity was not obvious when the high strength LAC used. (3) Compared to other codes mentioned in this paper, the method of AIJ (1997) has a good accuracy for calculation the stiffness. And the results using DL/T5085 to calculate moment capacity are closest to the test ones with a mean of 1.072 and STDEV of 0.041. Besides, the deviation of moment capacity calculation using other codes is 10% more or less than the test one. (4) Two methods were provided in this paper; the method of mechanical equilibrium and the method of combined strength which has a mean of 1.002 and 0.979 with STDEV of 0.052 and 0.081 respectively. Therefore, from this study it is possible to suggest that both methods can be used to calculate the moment capacity. (5) The constitutive model of confined LAC in compressive region was established. And it was proved to be accuracy enough. Based on some assumptions which were proved reasonable by the test, the constitutive model was used in the FEM to analyze the flexural behavior and the results fit with the experiment results well. ACKNOWLEDGMENTS The authors appreciate the support of The National Natural Science Fund (No.51208176); The authors appreciate the support of China Postdoctoral Science Foundation (2012M511187), The Fundamental Research Funds for the Central Universities (2012B02914).
REFERENCES [1] Ge, H.B., Susantha, K.A.S., Satake, Y., et al., “Seismic Demand Predictions of
Cconcrete-filled Steel Box Columns”, Engineering Structures, 2003,Vol. 25, No. 3, pp. 337-345.
[2] Gao, S.B. and Ge, H.B., “Numerical Simulation of Hollow and Concrete-filled Steel Columns”, Advanced Steel Construction, 2007, Vol. 3, No. 3, pp. 668-678.
[3] Montejo, L.A., Gonzalez-Roman, L.A. and Kowalsky, M.J., “Seismic Performance Evaluation of Reinforced Concrete-Filled Steel Tube Pile/Column Bridge Bents”, Journal of Earthquake Engineering, 2012, Vol. 16, No. 3, pp. 401-424.

402 Flexural Behavior of Lightweight Aggregate Concrete Filled Steel Tube
[4] Morcous, G., Hanna, K., Deng, Y., et al., “Concrete-Filled Steel Tubular Tied Arch Bridge System: Application to Columbus Viaduct ”, Journal of Bridge Engineering, 2012, Vol. 17, No. 1, pp. 107-116.
[5] Kang, J.Y., Choi, E.S., Chin, W.J., et al, “Flexural Behavior of Concrete-filled Steel Tube Members and its Application”, International Journal of Steel Structures, 2007, Vol. 7, No. 4, pp.319-324.
[6] Mossahebi, N., Yakel, A. and Azizinamini, A., “Experimental Investigation of a Bridge Girder made of Steel Tube Filled with Concrete”, Journal of Constructional Steel Research, 2005, Vol. 61, No. 3, pp. 371-386.
[7] Mohamed, H.M. and Masmoudi, R., “Flexural Strength and Behavior of Steel and FRP-reinforced Concrete-filled FRP Tube Beams”, Engineering Structures, 2010, Vol. 32, No. 11, pp. 3789-3800.
[8] Soundararajan, A. and Shanmugasundaram, K., “Flexural Behaviour of Concrete-Filled Steel Hollow Sections Beams”, Journal of Civil Engineering and Management, 2008, Vol.14, No. 2, pp. 107-114.
[9] Han, LH, “Flexural Behaviour of Concrete-filled Steel Tubes”, Journal of Constructional Steel Research, 2004, Vol. 60, No. 2, pp. 313-337.
[10] Deng, Y., Tuan, C.Y. and Xiao, Y., “Flexural Behavior of Concrete-Filled Circular Steel Tubes under High-Strain Rate Impact Loading”, Journal of Structural Engineering-ASCE, 2012, Vol. 138, No. 3, pp. 449-456.
[11] Nakamura, S., Momiyama, Y., Hosaka, T., et al., “New Technologies of Steel/Concrete Composite Bridges”, Journal of Constructional Steel Research, 2002, Vol. 58, No. 1, pp. 99-130.
[12] Ghannam, S, Jawad, Y.A. and Hunaiti, Y., “Failure of Lightweight Aggregate Concrete-Filled Steel tTubular Columns”, Steel and Composite Structures, 2004, Vol. 4, No. 1, pp. 1-8.
[13] Mouli, M. and Khelafi, H., “Strength of Short Composite Rectangular Hollow Section Columns Filled with Lightweight Aggregate Concrete”, Engineering Structures, 2007, Vol. 29, No. 8, pp. 1791-1797.
[14] Assi, I.M., Qudeimat, E.M. and Hunaiti, Y., “Ultimate Moment Capacity of Foamed and Lightweight Aggregate Concrete-filled Steel Tubes”, Steel and Composite Structures, 2003, Vol. 3, No. 3, pp. 199-212.
[15] Fu, Z.Q., Ji B.H, Lv, L. and Zhou, W.J., “The Behavior of Lightweight Aggregate Concrete Filled Steel Tube Slender Columns under Axial Compression”, Advanced Steel Construction, 2011, Vol. 7, No. 2, pp. 144-156.
[16] Elzien, A., Ji, B.H., Fu, Z.Q. and Hu, Z.Q, “The Behavior of Lightweight Aggregate Concrete Filled Steel Tube Columns under Eccentric Loading”, Steel and Composite Structures, 2011, Vol. 11, No. 6, pp. 469-488.
[17] Architectural Institute of Japan (AIJ), “Recommendations for Design and Construction of Concrete Filled Steel Tubular Structures”, 1997.
[18] British Standard Institute, “BS5400, Part 5, Concrete and Composite Bridges”, 1979. [19] Eurocode 4, “Design of Composite Steel and Concrete Structures”, 1994. [20] AISC, “Load and Resistance Factor Design Specification for Structural Steel Buildings”,
1999. [21] Engineering Construction Standard of Fujian Province of China, “Technical Specification
for Concrete-Filled Steel Tubular Structures”, 2003. (In Chinese) [22] Electric Power Industry Standard of China, “Code for Design of Steel-Concrete Composite
Structures”, 1999. (In Chinese) [23] Fu, Z.Q., Ji B.H., Lv, L. and Yang M., “The Mechanical Properties of Lightweight
Aggregate Concrete Constrained by Steel Tube”, Geotechnical Special Publication ASCE, 2011, No. 219, pp. 33-39.

Fu Zhongqiu, Ji Bohai*, Maeno Hirofumi, ElZIEN A. and Chen Jiashu 403
[24] Fu, Z.Q., Ji B.H., Zhou, Y. and Wang X.L., “An Experimental Behavior of Lightweight Aggregate Concrete Filled Steel Tubular Stub under Axial Compression”, Geotechnical Special Publication ASCE, 2011, No. 219, pp. 24-32.
[25] Wang, P. T., Shah, S. P. and Naaman, A.E., “Stress-Strain Curves of Normal and Lightweight Concrete in Compression”, Journal of American Concrete Institute, 1978, Vol. 75, No. 11, pp. 603-611.
[26] Han, L.H., “Concrete Filled Steel Tube Structure - Theory and Application (Second Edition)”, Science Press, 2007. (In Chinese)