Embed Size (px)
Citation preview

Flexible querying of Volunteered GeographicInformation for risk management
Paolo Arcaini1 Gloria Bordogna1 Simone Sterlacchini1
1CNR – Institute for the Study of the Dynamics of Environmental Processes (IDPA)
Abstract
The paper presents an approach to manage volun-teered geographic information (VGI) to point outanomalous conditions of the environment to helpadministrators in charge of the governance andmaintenance of the territory to plan mitigation andsafeguard interventions. To this end they can for-mulate flexible queries on the VGI reports to an-alyze their contents. The novelty of the proposalis the search framework of VGI reports designed tosupport distinct needs, among which the assessmentof VGI quality which is an important issue in suchapplications. Flexible queries are formulated andevaluated within a fuzzy database approach.
Keywords: environmental risk, Volunteered Ge-ographic Information, fuzzy databases, flexiblequerying, VGI quality assessment
1. Introduction
Citizen science is a term currently used to de-scribe the scientific efforts that are based on thecontribution of citizen volunteers engaged in col-lecting crucial information for the project, whichwould not be possible to acquire based solely onthe commitment of scientists [15]. These contribu-tions can be collected due to the wide availabilityof computers and mobile devices connected to theInternet. Volunteers are asked to make contribu-tions of various types, which include georeferencedreports, i.e., Volunteered Geographic Information(VGI) [13], on anomalous environmental conditionslike in the project “Did You Feel It?”1.The many citizen science projects that collect
contributions in the form of VGI use crowdsourc-ing platforms such as Ushahidi [18], accessible overthe Internet, for acquiring, storing and representingthe VGI reports, which are visualized by post-itson a map of the territory. To analyze the contentsof the VGI reports one has to click on the post-its shown on the map, while querying facilities onthe reports contents are generally missing. Never-theless, in practical applications, VGI reports con-tents need to be analyzed and filtered with respectto several information needs, serving distinct pur-poses. For example, in our context, VGI provided
1http://earthquake.usgs.gov/earthquakes
by citizens has the objective of pointing out anoma-lous conditions of the territory and requests of mit-igation and safeguard interventions. Analysing thereports contents can aid to plan mitigation inter-ventions, to monitor areas that are susceptible tospecific kinds of risks (such as landslides, wildfires,etc.), and finally to assess the quality of the VGI re-ports themselves which is one of the major concernwhen using VGI [10, 14]. In this paper we proposea set of flexible query types and their evaluationmechanism defined within the framework of fuzzydatabases [4, 5, 12] in order to effectively analyzeVGI. The motivation of this approach is that VGIreports are often affected by imprecision both in thegeoreference and content. Further, the operators incharge of managing the territory are not expert informal query languages and thus they need practicalways to formulate their needs. Specifically, in Sec-tion 2 we summarize the application context and inSection 3 the system architecture and types of flex-ible queries. In Section 4 the data model is definedand in Section 5 the quality assessment method ofVGI reports is presented. Section 6 reports somerelated works and Section 7 summarizes the maincontent and novelty of the proposal.
2. The application context of the proposal
The SISTEMATI project2 is developing a dis-tributed communication system to inform the op-erators responsible for the governance and mainte-nance activities of the territory on the anomaloussituations that need assistance for the prevention ofenvironmental and industrial risks in the pre-alertphases. This is done to prevent the occurrence ofemergency situations. To this end, the project usesthe geographic information provided by volunteercitizens (VGI) who are so involved in land manage-ment in the early stages of defining the priority ar-eas of intervention. In local geoportals connectedto the Internet the municipalities receive, recordand display on a map VGI reports created by theircitizens witnessed of abnormal situations. This lo-cal acquisition of VGI allows the municipalities tocross-check the VGI authorships with personal datain order to validate them. These reports, along withthe date of their creation and the spatial positionmay include free text annotations, audio and videorecordings of events, categories and risk levels ob-
2http://www.idpa.cnr.it/sistemati.htm
8th Conference of the European Society for Fuzzy Logic and Technology (EUSFLAT 2013)
© 2013. The authors - Published by Atlantis Press

Figure 1: SISTEMATI framework
served in the vicinity of the locations. These localgeoportals are connected to a central Spatial DataInfrastructure (SDI) that provides querying facili-ties of VGI reports of all municipalities. The opera-tor can carry out various searches specifying variouskinds of selection conditions of the reports:• free text to select reports requiring specific in-terventions, such as requests of repairing ofcrumbling roads, cleaning river banks, etc., inorder to plan actions of safeguard and mitiga-tion;• categories of users, such as citizens, civil pro-tection volunteers, etc., and levels of risk, suchas reports of fires with sighting of flames, tomonitor the response to an emergency;• space-time conditions, to restrict the analysisto the VGI reports located in regions suscep-tible to risks, for example, to select reports inthe vicinity of areas with a high density of po-tentially polluting industries;• space-time density conditions for the selectionof areas with a minimum number of reportsthat meet one or more of the above mentionedconditions.
The conditions on the space-time density of reportscan be useful to validate the contents of the recordsthemselves. In fact, one of the primary problems inthe use of VGI is estimating the quality of the in-formation that depends on several factors, such asthe reputation of the source, the truthfulness andaccuracy of the contents [10, 14]. A method forestimating the quality may be based on a compari-son between the textual contents of the VGI reportsclose to each other both in space and in time. A highdensity of records that point out the same risk in agiven region at the same time reinforces the truth-fulness of their contents, and thus increases the levelof attention of the operator responsible for the man-agement of interventions in the area.
3. The SISTEMATI system architecture
We propose a distributed framework, named SIS-TEMATI, depicted in Figure 1, in which each mu-nicipality (at the local level) hosts an independentUshahidi installation [18]. These local systems are
Figure 2: Municipal VGI report geoportal based onUshahidi
Field MandatoryLatitude, Longitude YesDate YesTitle YesDescription YesUser category YesRisk classification YesImages NoVideos NoLinks to web-pages NoComments No
Table 1: SISTEMATI VGI report fields
connected to a central Spatial Data Infrastructure(SDI) (at the regional level) implemented as an ex-tension of the Geonetwork [22] and Geoserver [9]open source systems.
Citizens belonging to a municipality (hereafternamed users) can connect to a local Ushahidi serverand submit reports either about dangers they havewitnessed or about requests of mitigation interven-tions (see Figure 2). For example, a user could sig-nal the burnt smell he perceives at the railway sta-tion. This can be done by sending a report fromhis/her smartphone.
Each report contains at least the geographic foot-prints represented by either a georeferenced polygonor, in the simplest case, a point provided by coor-dinates (latitude and longitude) of the place wherethe risk has been observed, the date of the reportsubmission, a title, a description, and a classifica-tion of the risk. Table 1 presents a complete de-scription of the report fields we have identified inthe personalization of the Ushahidi platform for theSISTEMATI project.
Users are categorized according to their role (e.g.,unregistered citizens, citizen belonging to the civilregister of the municipality, firemen, etc.). The dis-tributed Ushahidi servers are connected through theInternet to the SISTEMATI SDI (compliant withINSPIRE SDI architecture3), which is made avail-able at the staff in charge of managing the terri-tory; the SDI consists of three main components: a
3http://inspire.jrc.ec.europa.eu/

VGI crawler, a catalog service, a mapping compo-nent and a cross-validation component. The VGIcrawler periodically collects all the remote VGI re-ports hosted on the different municipality serversand builds metadata for them [17]. Such metadata,which comprise the textual content of the VGI andthe centroid of the geographic footprints, are orga-nized in a catalog and indexed in a collection of VGIindexes so that they can be queried by the adminis-trative staff (operators) based on distinct selectionconditions through the geoportal catalog service ofthe SDI. The SDI also allows accessing the contentsof the VGI reports and their remote geographic foot-prints on the municipality servers by the mappingcomponent through their links. Finally the SDI pro-vides WFS and WMS services to allow accessingremote spatial data. In the following subsection weintroduce the querying facilities.
3.1. Querying facilities
We want to allow the administrative operators incharge of the management of the territory to expressin a simple way as well as to execute different kindsof queries over the VGI reports:• Spatial range queries: one can demand to re-trieve all the VGI reports whose geographicfootprints overlap a specified region specifiedby a (fuzzy) Bounding Box (BB). We must per-mit the operator to execute also a search acrossthe tiling regions identifying the administrativeboundaries of the municipalities with the localinstallations of Ushahidi.• Content-based queries: the textual fields ofthe reports (e.g., title, description, . . . ) mustbe searchable in full-text mode and retrievedbased on the matching of their contents withrespect to the operator textual query.• User category-based queries: all the reports ofa given user category (or a group of user cat-egories) can be retrieved based on a controlledvocabulary of categories.• Risk level-based queries: all the reports of agiven risk type and risk level (or a group ofrisk levels) can be retrieved.• Temporal queries: all the reports that havebeen submitted in a given temporal (fuzzy)range can be retrieved.• Spatial/temporal density queries: the operatorshould be able to specify (fuzzy) density thresh-olds (e.g., about 10 reports/km2, about 5 re-ports/hour, etc.) to select the reports belong-ing to regions (spatial clusters) and/or tempo-ral intervals (temporal clusters) in which thedensity is greater than the (fuzzy) threshold.This can be useful to further analyze if the se-lected reports deal with the same events, risk,requests and to validate their quality as it willbe better described in Section 5.
One may require that the results are retrievedwith some tolerance of the selection conditions,
which can be formulated by specifying linguisticterms defining soft constraints, and thus admittingdegrees of satisfaction to the query (the relevancedegree) [6]. These flexible queries are modeled byadopting the fuzzy database framework [4, 5, 12].The retrieved reports can be presented in decreas-ing order of their relevance to the query or can bevisualized by post-its with distinct size on the map,so that the greater the relevance, the bigger thepost-it. Tolerant queries should be available for spa-tial, temporal-based and spatial/temporal densityqueries as defined in the following subsections [3].
3.1.1. Spatial range query
This type of query compares the centroid of the ge-ographic footprint of VGI reports with the bound-ing box specified by the operator. The BoundingBox (BB) can be defined with a fuzzy boundary sothat reports contained in the inner boundary haverelevance value equal to 1, whereas those outsidethe outer boundary have a null relevance, and thosebetween the two boundaries get a relevance valueinversely proportional to their distance from the in-ner boundary. The fuzzy boundary can be specifiedby the operator who may draw the inner boundaryby a bounding box on the map and may specify atolerance on the distance from it where the reportsbecome totally irrelevant, thus implicitly definingthe outer boundary. A practical way is to choosea buffer with a given size δ and draw the BB. Thisis translated into the coordinates (xsw, ysw) of theSW point and the coordinates (xne, yne) of the NEpoint, with δ indicating the required tolerance of thequery (distance from the BB); if the buffer is notspecified, we assume δ = 0, i.e., the query is crispand only reports strictly contained in BB must beretrieved. Figure 3 shows an example of BB withthe buffer indicating the tolerance δ.We define the BB centroid vector as follows:
C = (xc, yc) =(xsw + xne
2 ,ysw + yne
2
)Being (xr, yr) the coordinates representing the
geographic footprint of a report r, we introduce fas follows:
f(r,BB) = max(|xr − xc| − (xc − xsw),|yr − yc| − (yc − ysw)
)f(r,BB) is negative if r is contained in the BB, f ∈[0, δ] if r belongs to the fuzzy boundary, and f > δif r is outside both BB and the fuzzy boundary.The degree of satisfaction (Relevance Status
Value (RSV)) of a tolerant spatial range query iscomputed by the following function:
RSV = inBB(r,BB, δ) =1 if f(r,BB) ≤ 0δ−f(r,BB)
δ if 0 < f(r,BB) < δ0 otherwise
(1)

Figure 3: Bounding box with fuzzy boundary
Figure 4: Soft temporal constraint
3.1.2. Temporal range query
The operator can formulate tolerant temporalqueries by specifying linguistic values defining softtemporal constraints on the dates [8] of the re-ports with trapezoidal shaped membership func-tions µDate as the one shown in Figure 4.
Trapezoidal functions are defined by providingfour values (a, b, c, d) with a ≤ b ≤ c ≤ d on thedomain Date. The evaluation mechanism of thesequeries computes as RSV the degree of satisfac-tion of the soft constraint by the report date d asRSV = µDate(d), where µDate is defined as in for-mula 2 below.
3.1.3. Density-based query
The operator can formulate tolerant density-basedqueries by soft constraints on either the spatial den-sity or temporal density of the reports. Thus theresults of these queries are ranked reports, each sat-isfying the request to a given degree, according tothe density of the clusters they belong to.Notice that, as it will be described in Section 4,
the reports are previously clustered and may belongto several clusters, each one with a distinct spa-tial, temporal and spatial-temporal density. Thesoft constraints are defined with piecewise linearmembership functions µSdensity and µTdensity, forthe spatial and temporal densities respectively. Theevaluation mechanism of these queries computes aRSV for each cluster of reports and, thus, each re-port may have several RSVs since it can belong todistinct clusters. We take the maximum of the RSVsto rank the reports.
3.1.4. Combined queries
To select the reports, the operator may specify com-bined queries by multiple soft constraints of distinct
kind. In this case, the RSVs are combined by con-sidering the simultaneous satisfaction of the con-straints, thus by taking the minimum of the RSVs.
3.2. Visualizations facilities
At the regional level we also build a global VGI mapdisplaying all the reports of the single municipali-ties. Each metadata of a single report contains alink to the global map that zooms in the area of thecorresponding report: in this way a single reportcan be analyzed together with the (maybe related)surrounding reports. Each metadata also containssome fields of the original report, and a link to theoriginal report with its geographic footprint on theUshahidi municipality server. The central SDI alsopermits to graphically browse the reports, filteringthem by risk level and user category.
4. Data model
In order to describe the structure of the reports or-ganized into fields whose values are defined on dis-tinct domains, and the operator types that can beused for querying them, we define the data model.
4.1. Basic data model
Let U = {u1, . . . , un} be a set of municipalities, eachhosting an installation of Ushahidi. From now on,we only consider a single u ∈ U .
Let UC = {uc1, . . . , ucm} be the set of user cat-egories (e.g., citizen, administrator, officer, . . . ).
Let RC = {rc1, . . . , rcs} be the set of risk cate-gories (e.g., fire, flood, avalanche, . . . ). Each riskcategory is further divided in levels of risk; for eachrisk category rci ∈ RC we define its correspondingset of risk levels RLi = {rli1, . . . , rlih}. For exam-ple, for the risk category fire, we can identify therisk levels {high flames, low flames, smoke, burntsmell, extinguished fire}.
We define RL = ∪si=1RLi as the set of all the risklevels of all the risk categories.
Let Ru be the set of reports of a single munici-pality u ∈ U and R = ∪nu=1Ru the set of all reports.Each report r ∈ R is associated with the categoryuck of the user who submitted the report, and witha risk level rlij . We define the mappings:
getUc :R→UC getRc :R→RC getRl :R→RL
that retrieve, from a report, the associated usercategory, risk category, and risk level, respectively.Note that the correct mapping getRl must guaran-tee that, for any r ∈ R, if getRC (r) = rci (withrci ∈ RC), then getRl(r) ∈ RLi .
4.2. Density classification model
Let Ddens be the domain of values of the densities;they can be number of reports over units of eithertime, or space, or both.
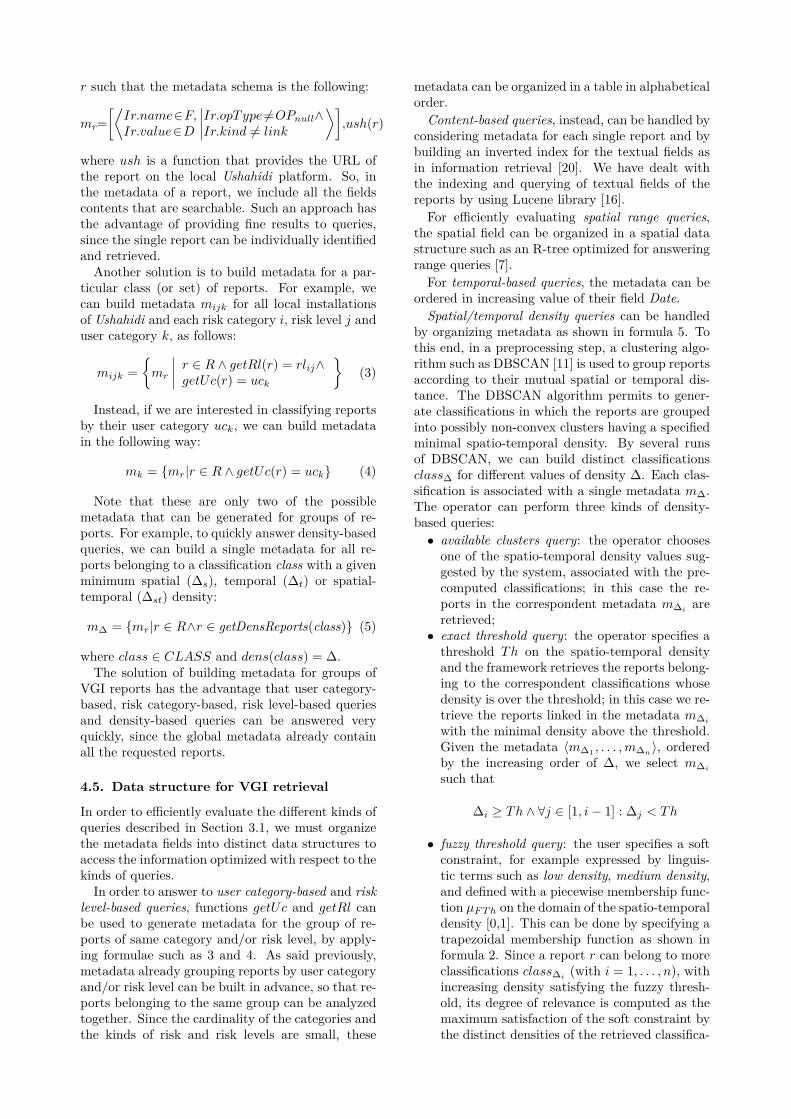
Let CLASS be a set of classifications of reports inclusters with the same minimum density ∆ ∈ Ddens.Function
dens : CLASS → Ddens
indicates, for each classification, the minimum den-sity of the clusters of the classification. We requirethe function to be injective, since we need to distin-guish the classifications by their minimum density.So, a classification class∆ ∈ CLASS (with
dens(class∆) = ∆) is defined as follows:
class∆ ⊆ 2R ∧ ∀cl1, cl2 ∈ class∆ : cl1 ∩ cl2 = ∅
where cl1 and cl2 are clusters of class∆ and theirdensities are greater than or equal to ∆.
Notice that, given a classification class∆, a singlereport may be not part of any cluster cl ∈ class∆;all these reports are marked as noise reports of theclassification and collected in the set noise∆. So,the set {{cli ∈ class∆}, noise∆} establishes a par-tition of R. Note that a classification for a given ∆may be empty, i.e., noise∆ = R.
Function:
getDensReports : CLASS → 2R
retrieves, for each classification, the re-ports clustered by the classification (i.e.,getDensReports(class∆) = R\noise∆).
4.3. Intensional definition
We now introduce the notation used to define theschema of a report:• F the set of fields names in which a report canbe structured;• C={spatial, temporal, textual, link, userCate-gory, riskLevel} the set of possible kinds of thefields;• D the set of possible primitive data types. Theprimitive data types contained in D can beBoolean, String, Integer, Real, Date, Url andenumerative domains (e.g., user category, riskcategory, risk level);• fc : F → C a function that identifies, for eachfield name ni ∈ F , a kind cj ∈ C;• fd : F → D a function that identifies, for eachfield name ni ∈ F , a primitive data type dj ∈D;• fm : F → {1, ∗,+} a function that signals themultiplicity of the field; “1” means that onesingle occurrence of the field is mandatory, “*”that 0 or more occurrences of the field can bepresent, and “+” that at least one occurrenceof the field is required;• OP is a set of operator types {OPtext, OPrel,OPsel, OPBB , OPnull} where– opi ∈ OPtext is defined for D = String
and gives values in [0,1]. It is based onstatistical functions of the occurrences ofterms in the reports as in information re-trieval systems [20].
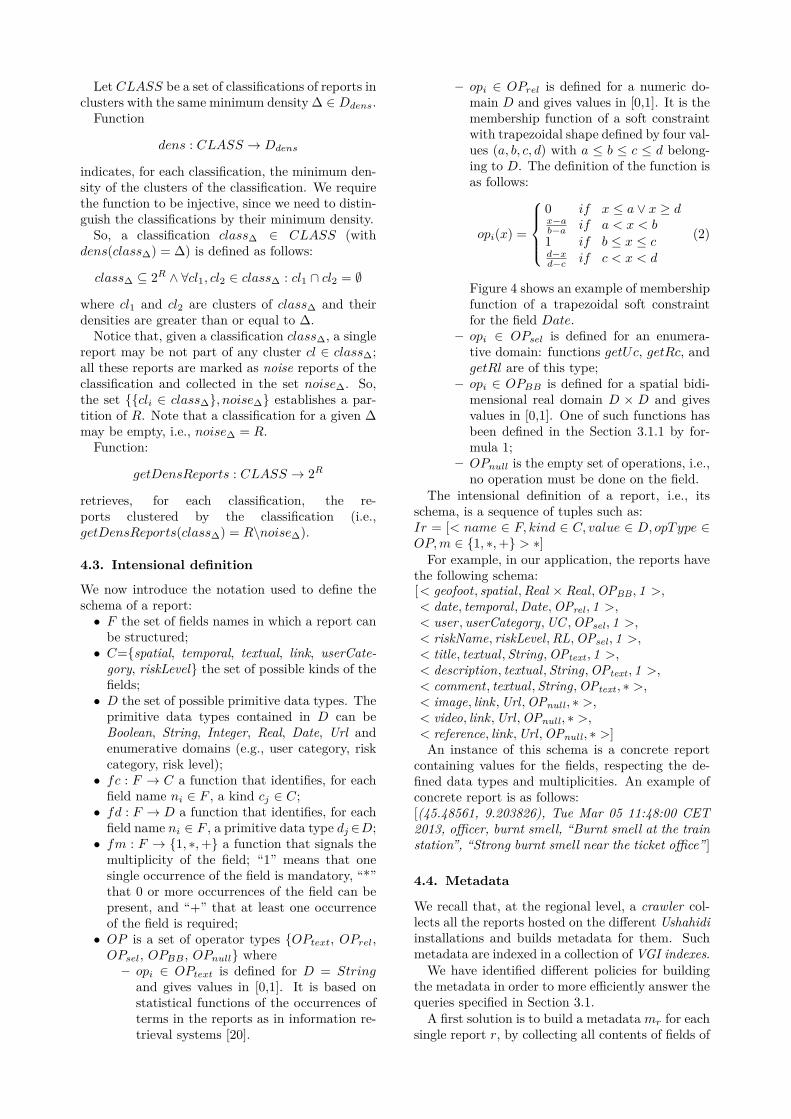
– opi ∈ OPrel is defined for a numeric do-main D and gives values in [0,1]. It is themembership function of a soft constraintwith trapezoidal shape defined by four val-ues (a, b, c, d) with a ≤ b ≤ c ≤ d belong-ing to D. The definition of the function isas follows:
opi(x) =
0 if x ≤ a ∨ x ≥ dx−ab−a if a < x < b
1 if b ≤ x ≤ cd−xd−c if c < x < d
(2)
Figure 4 shows an example of membershipfunction of a trapezoidal soft constraintfor the field Date.
– opi ∈ OPsel is defined for an enumera-tive domain: functions getUc, getRc, andgetRl are of this type;
– opi ∈ OPBB is defined for a spatial bidi-mensional real domain D × D and givesvalues in [0,1]. One of such functions hasbeen defined in the Section 3.1.1 by for-mula 1;
– OPnull is the empty set of operations, i.e.,no operation must be done on the field.
The intensional definition of a report, i.e., itsschema, is a sequence of tuples such as:Ir = [< name ∈ F, kind ∈ C, value ∈ D, opType ∈OP,m ∈ {1, ∗,+} > ∗]For example, in our application, the reports have
the following schema:[< geofoot, spatial,Real × Real,OPBB, 1 >,< date, temporal,Date,OPrel , 1 >,< user , userCategory,UC ,OPsel , 1 >,< riskName, riskLevel,RL,OPsel , 1 >,< title, textual,String,OPtext , 1 >,< description, textual,String,OPtext , 1 >,< comment, textual,String,OPtext , ∗ >,< image, link,Url,OPnull , ∗ >,< video, link,Url,OPnull , ∗ >,< reference, link,Url,OPnull , ∗ >]An instance of this schema is a concrete report
containing values for the fields, respecting the de-fined data types and multiplicities. An example ofconcrete report is as follows:[(45.48561, 9.203826), Tue Mar 05 11:48:00 CET2013, officer, burnt smell, “Burnt smell at the trainstation”, “Strong burnt smell near the ticket office” ]
4.4. Metadata
We recall that, at the regional level, a crawler col-lects all the reports hosted on the different Ushahidiinstallations and builds metadata for them. Suchmetadata are indexed in a collection of VGI indexes.We have identified different policies for building
the metadata in order to more efficiently answer thequeries specified in Section 3.1.A first solution is to build a metadatamr for each
single report r, by collecting all contents of fields of
r such that the metadata schema is the following:
mr=[⟨Ir.name∈F,Ir.value∈D
∣∣∣∣Ir.opType 6=OPnull∧Ir.kind 6= link
⟩],ush(r)
where ush is a function that provides the URL ofthe report on the local Ushahidi platform. So, inthe metadata of a report, we include all the fieldscontents that are searchable. Such an approach hasthe advantage of providing fine results to queries,since the single report can be individually identifiedand retrieved.Another solution is to build metadata for a par-
ticular class (or set) of reports. For example, wecan build metadata mijk for all local installationsof Ushahidi and each risk category i, risk level j anduser category k, as follows:
mijk ={mr
∣∣∣∣ r ∈ R ∧ getRl(r) = rlij∧getUc(r) = uck
}(3)
Instead, if we are interested in classifying reportsby their user category uck, we can build metadatain the following way:
mk = {mr|r ∈ R ∧ getUc(r) = uck} (4)
Note that these are only two of the possiblemetadata that can be generated for groups of re-ports. For example, to quickly answer density-basedqueries, we can build a single metadata for all re-ports belonging to a classification class with a givenminimum spatial (∆s), temporal (∆t) or spatial-temporal (∆st) density:
m∆ = {mr|r ∈ R∧r ∈ getDensReports(class)} (5)
where class ∈ CLASS and dens(class) = ∆.The solution of building metadata for groups of
VGI reports has the advantage that user category-based, risk category-based, risk level-based queriesand density-based queries can be answered veryquickly, since the global metadata already containall the requested reports.
4.5. Data structure for VGI retrieval
In order to efficiently evaluate the different kinds ofqueries described in Section 3.1, we must organizethe metadata fields into distinct data structures toaccess the information optimized with respect to thekinds of queries.
In order to answer to user category-based and risklevel-based queries, functions getUc and getRl canbe used to generate metadata for the group of re-ports of same category and/or risk level, by apply-ing formulae such as 3 and 4. As said previously,metadata already grouping reports by user categoryand/or risk level can be built in advance, so that re-ports belonging to the same group can be analyzedtogether. Since the cardinality of the categories andthe kinds of risk and risk levels are small, these
metadata can be organized in a table in alphabeticalorder.Content-based queries, instead, can be handled by
considering metadata for each single report and bybuilding an inverted index for the textual fields asin information retrieval [20]. We have dealt withthe indexing and querying of textual fields of thereports by using Lucene library [16].
For efficiently evaluating spatial range queries,the spatial field can be organized in a spatial datastructure such as an R-tree optimized for answeringrange queries [7].
For temporal-based queries, the metadata can beordered in increasing value of their field Date.Spatial/temporal density queries can be handled
by organizing metadata as shown in formula 5. Tothis end, in a preprocessing step, a clustering algo-rithm such as DBSCAN [11] is used to group reportsaccording to their mutual spatial or temporal dis-tance. The DBSCAN algorithm permits to gener-ate classifications in which the reports are groupedinto possibly non-convex clusters having a specifiedminimal spatio-temporal density. By several runsof DBSCAN, we can build distinct classificationsclass∆ for different values of density ∆. Each clas-sification is associated with a single metadata m∆.The operator can perform three kinds of density-based queries:• available clusters query: the operator choosesone of the spatio-temporal density values sug-gested by the system, associated with the pre-computed classifications; in this case the re-ports in the correspondent metadata m∆i
areretrieved;• exact threshold query: the operator specifies athreshold Th on the spatio-temporal densityand the framework retrieves the reports belong-ing to the correspondent classifications whosedensity is over the threshold; in this case we re-trieve the reports linked in the metadata m∆i
with the minimal density above the threshold.Given the metadata 〈m∆1 , . . . ,m∆n
〉, orderedby the increasing order of ∆, we select m∆i
such that
∆i ≥ Th ∧ ∀j ∈ [1, i− 1] : ∆j < Th
• fuzzy threshold query: the user specifies a softconstraint, for example expressed by linguis-tic terms such as low density, medium density,and defined with a piecewise membership func-tion µFTh on the domain of the spatio-temporaldensity [0,1]. This can be done by specifying atrapezoidal membership function as shown informula 2. Since a report r can belong to moreclassifications class∆i
(with i = 1, . . . , n), withincreasing density satisfying the fuzzy thresh-old, its degree of relevance is computed as themaximum satisfaction of the soft constraint bythe distinct densities of the retrieved classifica-

tions class∆i:
RSV (r) = max(µFTh(∆1), . . . , µFTh(∆n))
5. Validating VGI reports
When dealing with VGI, there is the problem ofvalidating its quality. Indeed a user may report afalse warning for different reasons:• (s)he misuses the platform (e.g., (s)he wronglyclassifies a risk report by accidental clicking onthe wrong checkbox);• (s)he overestimates/underestimates an ob-served risk;• (s)he could be a malicious user who reportsfalse warnings on purpose.
In order to validate the provided information, wecan use two different kinds of techniques, ex-anteand ex-post, distinguished by the time when the in-formation is validated [2].Ex-ante techniques aim to prevent the creation
of low quality VGI by supporting the user in thecreation of correct reports:• only particular classes of trusted users can sub-mit reports;• a report form is provided to help the user inproviding a correct information. For example,if the user wants to submit information about afire, the system may show some examples to beused for comparison with the observed fire. Insuch a way the user is supported in identifyingthe risk level.
Ex-post techniques, instead, remove low qualityreports or classify the reports after these have beenproduced:• the user authority and category can be used toassign a value to the reports. Warnings pro-vided by registered users are considered moretrustworthy than those provided by unregis-tered users. Moreover, among the registeredusers, reports of expert users (e.g., firemen)could be more considered than those of volun-teers;• a risk forecasting system could be used to val-idate the reports. The risk forecasting sys-tem, given the current values of some dynamicparameters (e.g., temperature, humidity, . . . ),furnishes a risk map representing the scenarioprobability that a given natural/environmentaldisaster can happen in the area of interest. Itscross-validation with VGI can lead to two sit-uations:– Inconsistency: VGI reports about risks
occur within areas that are considered safeby the risk maps. A single risk report in asafe area may be considered unreliable. Ahigh density of reports in a safe area, in-stead, demands for a control and possiblerevision of the risk map.
– Concurrency: risk reports occur withinareas considered risky by the risk maps.
High density of VGI annotations confirmsthe reliability of the risk map.
6. Related work
The first contribution of our proposal is the use ofVGI in emergency management. The definition ofVGI can be applied to different scenarios in whichthe users contribute in different ways. In projectsas BOINC [1], a computationally expensive processis parallelized in different sub-processes executed bythe users that make available the computing time oftheir PCs. In other projects the users make sometasks in which humans outperform computers, asshape classification of galaxies in the Galaxy Zooproject [19]. In some other projects, instead, theusers act as sensors, i.e., they perform some mea-surements on the object of interest: in the project“Did you feel it?”4 and in the analogue Italianproject “Hai sentito il terremoto?”5, the users canprovide information about their perception of anearthquake. They use VGI after the crisis has oc-curred, while we want to use it to prevent the oc-currence of emergencies.
A second aspect of our proposal is to indicate amethod for the quality assessment of VGI reports.The problem of validating VGI has been alreadytackled in literature. In [21] an approach for val-idating VGI is presented. The approach is basedon the evaluation of the reputation of the source,on the consideration of the temporal and spatialdistribution of the VGI items, and on the cross-referencing of different VGIs coming from differ-ent sources (e.g., Twitter messages and Flickr pho-tos). In [14] the authors propose three approachesfor validating VGI. In the crowd-sourcing approachthe final users themselves validate the information.In the social approach some users are consideredmore trustworthy than others (e.g., since they pro-vided several correct VGI in the past), and theyhave privileges (e.g., deleting pages or blocking userin Wikipedia) not granted to standard users. Inthe geographic approach, standard geographic rulesthat are known to be true are applied to identifyVGI deviating from the rules. For example, if anarea is known to be a natural reserve without busi-ness activities, a VGI indicating the presence of arestaurant in the area is considered unreliable. Asfar as we know, the proposal of validating VGI basedon content and spatio-temporal analysis, performedby submitting queries to the database of VGI re-ports, is novel.
7. Conclusions and future work
Classical VGI managing systems usually provide ba-sic filtering facilities to select subsets of VGI reports,e.g., those of a given category of users, category of
4http://earthquake.usgs.gov/earthquakes/dyfi/5http://www.haisentitoilterremoto.it

risk, etc. As far as we know, none has still pro-posed a system for indexing and querying the con-tents of VGI reports to the aim of assessing theirquality which is the main issue we have in mindwith the current proposal. Specifically, the density-based queries have been defined in order to assessthe trustfulness of VGI reports based on cross com-parisons of the contents of the nearby geographicfootprints of reports created in close dates. In thisrespect we propose the adoption of a flexible querylanguage in order to allow the specification of toler-ant selection conditions, thus yielding discriminatedanswers.As future work, in the near future we plan to ex-
periment the querying approach presented in thispaper to existing Ushahidi installations of activeprojects, in order to have meaningful data thatwould permit us to draw some conclusions aboutthe effectiveness of the proposed queries (in partic-ular the density-based queries). In more advancedphases of the SISTEMATI project, instead, we willexperiment our approach with the data provided bysome partners of the project (local municipalities).
AcknowledgementThis work has been carried out within the projectSISTEMATI “Geomatics Supporting Environmen-tal, Technological and Infrastructural DisasterManagement”, funded by the Italian Ministry of Re-search jointly with Regione Lombardia.
References
[1] D. P. Anderson. Boinc: A system for public-resource computing and storage. In 5thIEEE/ACM International Workshop on GridComputing, pages 4–10, 2004.
[2] G. Bordogna, L. Criscuolo, P. Carrara, andM. Pepe. An approach to assess the qualityof volunteer geographic information for citi-zen science. Information Sciences (submitted),2012.
[3] G. Bordogna, M. Pagani, G. Pasi, andG. Psaila. Managing uncertainty in location-based queries. Fuzzy Sets and Systems,160(15):2241–2252, 2009.
[4] G. Bordogna and G. Pasi. Recent issues onfuzzy databases, volume 53. Physica-VerlagHD, 2000.
[5] P. Bosc and J. Kacprzyk. Fuzziness in databasemanagement systems. Physica-Verlag, 1996.
[6] P. Bosc and H. Prade. An introduction to thefuzzy set and possibility theory-based treat-ment of flexible queries and uncertain or impre-cise databases. In Uncertainty management ininformation systems, pages 285–324. Springer,1997.
[7] P. Ciaccia, M. Patella, and P. Zezula. M-tree:An efficient access method for similarity searchin metric spaces. In Proc. of the 23rd Interna-
tional Conference on Very Large Data Bases,VLDB ’97, pages 426–435, San Francisco, CA,USA, 1997. Morgan Kaufmann Publishers Inc.
[8] R. De Caluwe, G. De Tré, B. VanDer Cruyssen, F. Devos, and P. Maes-franckx. Time management in fuzzy anduncertain object-oriented databases, volume 39of Knowledge management in fuzzy databases,pages 67–88. Physica-Verlag, 2000.
[9] J. Deoliveira. Geoserver: uniting the geoweband spatial data infrastructures. In Proc. ofthe 10th International Conference for SpatialData Infrastructure, Trinidad, 2008.
[10] R. Devillers, R. Jeansoulin, et al. Fundamen-tals of spatial data quality. ISTE London, 2006.
[11] M. Ester, H.-P. Kriegel, J. Sander, and X. Xu.A Density-Based Algorithm for DiscoveringClusters in Large Spatial Databases withNoise. In E. Simoudis, J. Han, and U. Fayyad,editors, Second International Conference onKnowledge Discovery and Data Mining, pages226–231, Portland, Oregon, 1996. AAAI Press.
[12] J. Galindo, editor. Handbook of Researchon Fuzzy Information Processing in Databases.IGI Global, 2008.
[13] M. F. Goodchild. Citizens as voluntary sensors:spatial data infrastructure in the world of web2.0. International Journal of Spatial Data In-frastructures Research, 2:24–32, 2007.
[14] M. F. Goodchild and L. Li. Assuring the qual-ity of volunteered geographic information. Spa-tial Statistics, 1:110–120, 2012.
[15] E. Hand. Citizen science: People power. Na-ture, 466(7307):685–687, Aug. 2010.
[16] E. Hatcher, O. Gospodnetic, and M. McCand-less. Lucene in action, 2004.
[17] L. Litwin and M. Rossa. Geoinformation Meta-data in INSPIRE and SDI. Lecture notesin geoinformation and cartography. SpringerBerlin Heidelberg, 2011.
[18] O. Okolloh. Ushahidi, or ’testimony’: Web2.0 tools for crowdsourcing crisis information.Participatory learning and action, 59(1):65–70,2009.
[19] M. J. Raddick, G. Bracey, P. L. Gay, C. J. Lin-tott, P. Murray, K. Schawinski, A. S. Szalay,and J. Vandenberg. Galaxy zoo: Exploring themotivations of citizen science volunteers. As-tronomy Education Review, 9:010103, 2010.
[20] G. Salton. Automatic Text Processing: TheAnalysis, Transformation and Retrieval of In-formation by Computer, 1989.
[21] L. Spinsanti and F. O. Ostermann. Validationand relevance assessment of volunteered geo-graphic information in the case of forest fires.In ValGeo Workshop, Ispra, 2010.
[22] J. Ticheler and J. U. Hielkema. Geonetworkopensource internationally standardized dis-tributed spatial information management. OS-Geo Journal, 2(1), 2007.