Embed Size (px)
Citation preview

Working with you
Fletcher Building Ltd
Building Products Investor Day20 October 2016

Disclaimer
This presentation contains not only a review of operations, but also some forward looking statements about Fletcher Building and the environment in which the company operates. Because these statements are forward looking, Fletcher Building’s actual results could differ materially. Statistics included in this presentation are sourced from Statistics NZ unless otherwise stated.
2 Fletcher Building Building Products Investor Day Presentation | © October 2016

Agenda
3
8:30am - 9:00am Coffee/Registration
9:00am - 9:30am Introduction Mark Adamson – Chief Executive Officer
9:30am - 10:00am Securing the future:Accelerate Lee Finney – Chief Transformation Officer
10:00am - 10:30am Overview of Building Products Matt Crockett – CE, Building Products
10.30am - 11:00am NZ Concrete Value Chain:GBC Winstone & Firth
Ian Jones – GM, GBC WinstoneAndrew Moss – GM, Firth
11:00am - 11:15am Morning tea
11:15am - 11.45amManaging productconvergence : Humes NZ & Iplex NZ
Logan Aves – GM, HumesDavid Welsh – GM, Iplex NZ
11.45am - 12:15pm Managing channels:Winstone Wallboards David Thomas – General Manager
12:15pm - 12:45pm Regaining momentum: Fletcher Insulation Justin Hollis – General Manager
12:45pm - 1:15pm Lunch
Fletcher Building Building Products Investor Day Presentation | © October 2016

Agenda
4
1:15pm - 1:45pm Competing on customer service: Iplex Australia Nicole Sumich – General Manager
1:45pm - 2:15pmDriving top line margin: Commercial centres of excellence
Becky Lloyd – Chief Marketing Officer
2:15pm - 2:45pm Innovation driven growth:International Francisco Irazusta – CE, International
2:45pm - 3:00pm Afternoon tea
3:00pm - 3:30pm How good can it get:Residential
Steve Evans – CE, Residential & Land Development
3:30pm - 4:00pm Wrap upQ&A Session
Mark Adamson – Chief Executive OfficerGerry Bollman – Chief Financial Officer
Fletcher Building Building Products Investor Day Presentation | © October 2016

Working with you
Introduction
Fletcher Building Building Products Investor Day 2016
5
Mark Adamson

Working with you
Fletcher Building Building Products Investor Day 2016
Securing the future: Accelerate
Lee Finney

Chief Transformation Officer role created to build capability across the group
Fletcher Building Building Products Investor Day Presentation | © October 20167
Accelerate Core Team
Sales & Marketing
Procurement
Innovation
Health & Safety
Operational Excellence
• Manufacturing
• Supply Chain
Centres of Excellence
Commercial:• Pricing
• Mix/Volume
• Cost-to-serve
• Sales Force Effectiveness
Innovation:• Product
• Digital solutions
• Service
Growth Initiatives
Accounts Payable & Receivable – standardised Process
Manufacturing Excellence -Conversion Cost
Network & Inventory OptimisationProcurement Performance
Overhead Productivity
Synergies - Fletcher System
Cost & Cash Initiatives
Chief Transformation Officer
Divisional Business Units
Sales & Operations Planning (S&OP)
‘Accelerate’ Transformation Program Delivery
Accelerate is at the core of everything we do
Fletcher Building Building Products Investor Day Presentation | © October 20168
StructureThe Transformation Office governs and supports the Accelerate programme, driven by the Group GM of Transformation and supported by divisional and BU Transformation roles
SystemOnline tool provides a “single source of truth” for initiative management across the group -measuring gross incremental benefit
CadenceWeekly cadence cycle ensures focus on accountability, commerciality and execution as well as providing the opportunity for an agile approach to decision making

Accelerate leverages early capability that was developed under the FBUnite program
Fletcher Building Building Products Investor Day Presentation | © October 20169
• Accelerate builds on the work done in the ‘Art of the Possible’ bottom up analysis and ‘Top down’ validation.
• Builds capability in the centralised functions and Centres of Excellence.
• Co-ordinated through Group Transformation Office - tracked weekly.
• Business-led approach to deliver sustainable results.
=Art of the Possible
+ +Top Down validation

Accelerate helps us deliver our organisational goals…faster
Fletcher Building Building Products Investor Day Presentation | © October 201610
• Go home safe every day• Develop leadership and capability across the company• Create a performance culture & foster engagement
PeopleCreate a great place to work
• Exceed cost of capital• Develop sustainable new sources of earnings• Drive a credible plan to profitably grow the business
Profitable growth
Invest where we can win
• Lift market share• Increase customer satisfaction• Achieve sustainable pricing
CustomersDeliver what they value
• Reduce production & procurement unit costs• Optimise the supply chain• Increase productivity & working capital efficiency
EfficiencyWork smarter together

Accelerate drives transparency and discipline
Fletcher Building Building Products Investor Day Presentation | © October 201611
Identify Ideas
Value identification Value captureL2
L3L4
L5
L1
TrackPlan ImplementValidate Realise Value
Requirements to pass the gate
An idea generated with a high level estimate of benefit
Initiative owner identified
Estimate of benefit
Idea analysed for feasibility, impact and risks
L3 and L4 estimated dates
Detailed implementation plan developed (L4 date locked in)
Mechanism to track benefit delivery
Where and how will benefit be realised
All activities completed in implementation plan
Final delivered benefit calculated
Full ramp-up of recurring benefit

Accelerate drives behaviour & culture change
Fletcher Building Building Products Investor Day Presentation | © October 201612
• Structured approach—To help businesses identify opportunities, size them, confirm feasibility and benefits, then execute
• Fast cadence and high intensity—weekly TO meetings
• Focus on quality—challenge the inputs and the benefit assumptions
• Clear ownership—Initiative Owners are accountable for the Project Management, delivering the milestones and the end results
• Fast Escalation of variances or milestone delay.
• The role of the Transformation Office = “personal trainer” to push and “coach” the business to build and implement the Plan
Accelerate is about realising the full potential of Fletcher Building, making it a truly great place to work and delivering upon our
financial goals

Key achievements to date
Fletcher Building Building Products Investor Day Presentation | © October 201613
• Improved communication: Weekly interactions with BUs, divisions and the corporate centre to track and drive initiatives
• Mechanisms in place to capture ideas from all levels of the business
• World class reporting & guidance developed to drive fast decision making
• Gross initiatives more than offsetting cost-in headwinds
• Accelerate has clear alignment with the 3 year plan and to date…
Accelerate has generated 1,750 L3+ initiatives that are supported by detailed implementation plans
With more than 380 initiative owners across the group
More than 320 people responsible for delivering ~5,000 milestones
Supported by 13 centrally governed weekly Accelerate meetings and more than 25 BU / functional meetings each week

Accelerate opportunity is balanced between cost and top line growth
Fletcher Building Building Products Investor Day Presentation | © October 201614
% OF TOTAL IDENTIFIED OPPORTUNITY
Commercial (“Sell”) 50%
Cost- External spend (“Source”)- Overhead (“Staff”)
20%8%
Manufacturing- Manufacturing (“Make”)- Distribution and Construction (“Deliver”)
15%7%
DIVISIONS
Building Products 25%
International 25%
Distribution 30%
Construction & Residential 16%
Corporate 4%
Total 100%
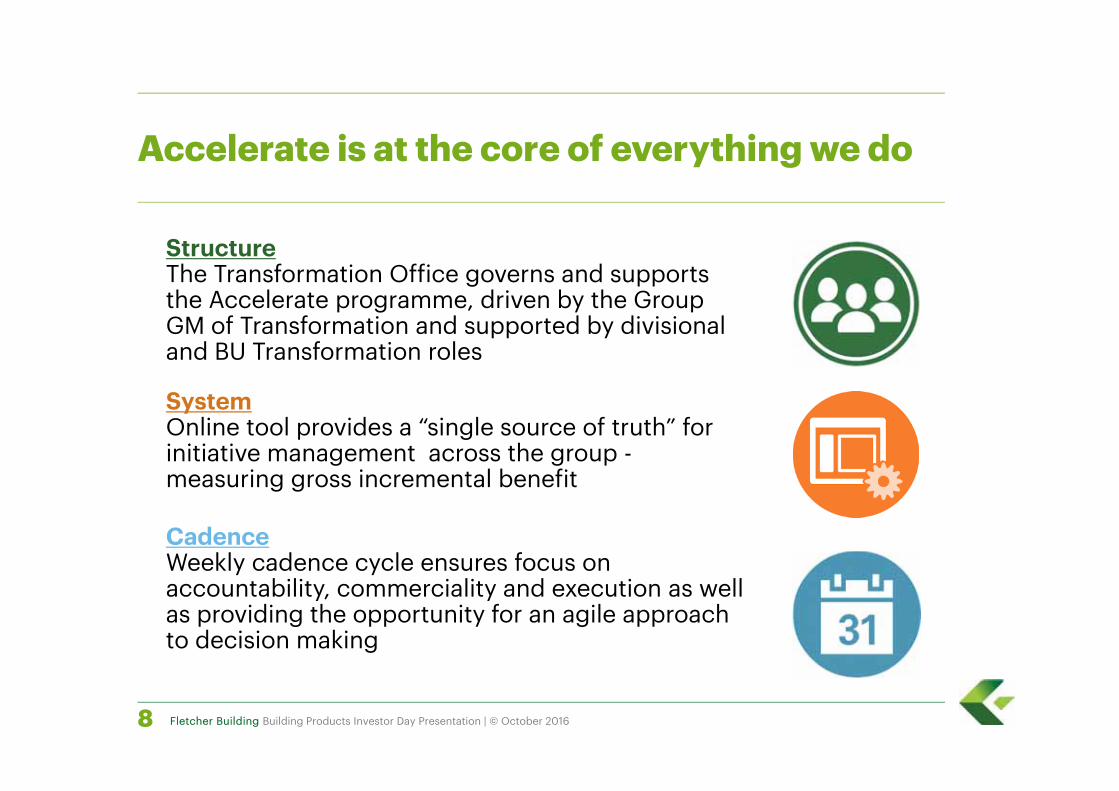
Accelerate is an extension of our values
Fletcher Building Building Products Investor Day Presentation | © October 201615

Working with you
Fletcher BuildingBuilding Products Investor Day 2016
Overview of Building Products
Matt Crockett

Agenda
• Building Products overview
• Performance and priorities
• Impact of Accelerate
• Australian and NZ market outlooks
Fletcher Building Building Products Investor Day Presentation | © October 201617

Building Products lead team
Fletcher Building Building Products Investor Day Presentation | © October 201618
GM GBCWinstone:Ian Jones25 years at FB
GM Fletcher Insulation:Justin Hollis1 year at FB
GM Rocla:Bruce Nicholson2 months at FB
GM Iplex AU:Nicole Sumich2 years at FB
MD Fanalco:Ron Holden15+ Years NALCO
GM Firth:Andrew Moss25 years at FB
GM Humes:Logan Aves2 years at FB
GM Winstone Wallboards:David Thomas40 years at FB
GM Iplex NZ:David Welsh1 year at FB

Building Products Division Overview
Fletcher Building Building Products Investor Day Presentation | © October 2016
Plastic Pipes & FittingsQuarries Cement ReadyMix
ConcreteConcrete Products
New
Zea
land
Aus
tral
ia
• PE Pipe• PVC Pipe• PVC fittings
• Pipes, Poles• Sleepers• Masonry• Barriers
• Aggregates• Sand
Building Materials
• Wallboards• Insulation• Aluminium
FANALCO
19

We have continued to simplify and focus the portfolio, only acquiring/partnering where there is clear logic
Fletcher Building Building Products Investor Day Presentation | © October 2016
June 2014
February 2016
Businesses exited Disposal/closure date
Logical bolt-on acquisitions/JVs Acquisition/JV date
July 2016
July 2016
FANALCO
20

Divisional revenue and earnings are diversified along the value chain
Fletcher Building Building Products Investor Day Presentation | © October 201621
$372
$302
$468
$546
$553
$71 $136
FY16 Revenue (NZ$m)
$71
$22
$41 $14
$106
$3 $18
FY16 EBIT (NZ$m)

Substantial progress made over the last two years, though challenges remain
Fletcher Building Building Products Investor Day Presentation | © October 201622
Australia
• Strong, customer leading, turnarounds in Iplex AU and Fletcher Insulation
• Rocla Quarries divestment
New Zealand• Defended/extended share in all
businesses• National cement distribution model
embedded with smooth transition • FANALCO aluminium JV – strong
business trajectory
Highlights Challenges
Australia
• Returning Rocla to growth
• Some weak state markets, notably WA
• Ongoing intense competition
New Zealand• Strong competition in NZ concrete
chain with associated pricing pressure
• Christchurch post peak; managing the transition to Auckland/Waikato/BOP
• Addressing capacity constraints

Accelerate is underpinning our business improvement efforts
Fletcher Building Building Products Investor Day Presentation | © October 201623
• Getting the basics in place - building performance mindsets and capabilities
• Immediate interventions to support turnarounds – cost right-sizing and market share recovery
• Pricing optimisation
• Overhead efficiencies
• Building operational excellence capabilities – capacity and cost
• Multi-year initiative portfolio agreed
Focus to date Go forward priorities
• Execution of existing initiatives
• Refining and delivering powerful customer value propositions in all businesses
• Ongoing ideation and planning to fully solution targets – increased focus on bigger, more transformative/innovative opportunities
• Building commercial excellence, procurement and digital capabilities
• Ensuring medium-long term sustainability

-
2
4
6
8
10
200
720
08
200
920
1020
1120
1220
1320
1420
1520
16F
2017
F20
18F
2019
F20
20F
2021
F
$NZ
Bn
-
5
10
15
20
200
720
08
200
920
1020
1120
1220
1320
1420
1520
16F
2017
F20
18F
2019
F20
20F
2021
F
$NZ
Bn
New dwellings Additions & Alterations
Source: Infometrics. Last Update March 2016 All metrics at current value
NZ market outlook positive
Fletcher Building Building Products Investor Day Presentation | © October 201624
NZ Residential WPIP
NZ Non Residential WPIP NZ Infrastructure WPIP
-
2
4
6
8
10
200
720
08
200
920
1020
1120
1220
1320
1420
1520
16F
2017
F20
18F
2019
F20
20F
2021
F
$NZ
Bn

Source: BIS Shrapnel. Last Update 9th June 2016. All metrics at current value
0
50
100
150
200
250
2006
2007
2008
2009
2010
2011
2012
2013
2014
2015
2016
F
2017
F
2018
F
2019
F
2020
F
'000s
Aus Residential Commencements
Standalone houses Other dwelling types
‐ 10 20 30 40 50 60 70
2006
2007
2008
2009
2010
2011
2012
2013
2014
2015
2016
F
2017
F
2018
F
2019
F
2020
F
AU$ bn
Aus Residential Work Value
New dwellings Additions & Alterations
‐
10
20
30
40
50
2006
2007
2008
2009
2010
2011
2012
2013
2014
2015
2016
F
2017
F
2018
F
2019
F
2020
F
AU$ bn
Aus Non‐Residential Work Value
Non residential
‐ 20 40 60 80
100 120 140
2006
2007
2008
2009
2010
2011
2012
2013
2014
2015
2016
F
2017
F
2018
F
2019
F
2020
F
AU$ bn
Aus Infrastructure Work Value
Infrastructure
Australian market outlook coming off peaks but remains solid
Fletcher Building Building Products Investor Day Presentation | © October 201625
Key Building Products messages
• High quality, diversified, yet coherent portfolio• World class team – good balance of FB and external
experience• Market leading assets in NZ successfully defending share and
well positioned to maximise returns from strong NZ market• Australian businesses successfully turning around and well
positioned to drive further value capture• Accelerate program driving disciplined execution and
building key capabilities underpinning short and long term success
• Market stronger for longer than previously expected, especially in New Zealand
Fletcher Building Building Products Investor Day Presentation | © October 201626

Working with you
Fletcher BuildingBuilding Products Investor Day 2016
27
NZ Concrete Value Chain:GBC Winstone & Firth
Ian JonesAndrew Moss

GBC WinstoneOverview
Fletcher Building Building Products Investor Day Presentation | © October 201628
National Manufacturing & Distribution
CAGR 9% p.a.
Revenue split and market segments
Golden Bay Cement Manufacturing
Golden Bay Cement Service Centre
Key Aggregate Sites
Golden Bay Cement IsoveyerDistribution Point
0
100
200
300
400
FY12 FY13 FY14 FY15 FY16
NZ$m
Firth Cement Firth Aggregates Domestic CementExport Cement Aggregates Other sales
CAGR 9% p.a.

0
100
200
300
400
FY12 FY13 FY14 FY15 FY16
NZ$m
Certified Masonry Dricon Other
Firth OverviewFirth is NZ’s largest ready-mixed concrete, concrete masonry, and pre-mixed bagged mortar supplier
Fletcher Building Building Products Investor Day Presentation | © October 201629
Revenue split and performanceNational Manufacturing & Distribution
CAGR 13% p.a.
Firth Certified Concrete plants (70)
Joint Venture Concrete plants (3)
Masonry Plants (8)
Joint Venture Concrete Pumping (1)
Dricon Plants (2)

GBC Winstone and Firth hold a unique integrated position in the NZ concrete value chain
Fletcher Building Building Products Investor Day Presentation | © October 201630
Aggregates
100%
0%
Cement Concrete Concrete Masonry Mortars
Firth
Allied / Holcim JV
AtlasBridgeman
Higgins
Other
FirthDriconGBC
Winstone Aggregates
Holcim
Import (Drymix)Import (HR)
Other BowersCemix
Other
ViblocDrymix
KaiparaStevensons
Holcim
Stevensons
GBC Winstone markets Firth markets

NZ cement industry has changed but FB has a fully integrated value chain, competitive cost position, and strong independent customers1. Industry has changed over last five years but FB has done a good job retaining share whilst facing new
import competition
2. Both Holcim and FB have their features and benefits but FB’s model is difficult for others to replicate. FB continues to focus on customer relationships, service, and bringing value to customers
3. FB costs compared to Holcim are similar in Auckland but FB is lower on a national weighted average basis
31 Fletcher Building Building Products Investor Day Presentation | © October 2016
* Holcim exposure to FX, shipping rates & global
commodity prices
Cost ex-Auckland Service Centre, 2017
Cement FoBInternational Shipping(incl. Unloading)Domestic Distribution
Delivered Cost to Customer Weighted NZ Average, 2017
Sources: Japanese Ministry of Finance Statistics GBC Winstone actual costs Industry intelligence
*
Note: Graphs illustrate future state for Fletcher Building and Holcim models (fully costed models)
$pe
rton
ne

New distribution model will improve EBIT by ~$7m p.a.The distribution model revamp consists of three key components which all interact, creating a more robust
supply chain, and providing capability to supply all NZ regions (Completion February 2017)
32 Fletcher Building Building Products Investor Day Presentation | © October 2016
2. New ship capable of over twice current ship capacity will be commissioned in December 2016. This allows retirement of current ship and contracted barge
3. New 6,000 tonne storage silo and ship loading upgrade (total $28m) under construction at Portland, Whangarei. This is key to the supply chain, allowing for greater storage while ship is away, faster ship loading and decreased business risk
1. With imminent end of Reciprocal Supply Agreement with Holcim, GBCW implemented a new supply chain for the South Island utilising 500 ISO Tanks. These are typically filled in Auckland but system is very flexible and scalable
New ship during construction
New Silo under construction (foreground) at manufacturing plant, Whangarei
ISO Tank Stock

Aggregates business addresses both growth and sustainability and well positioned to capture market upsideHunua $30m development sets up resource for further 30 years of Auckland supply and creates platform for Firth Block Plant
Hunua has been an increasingly busy quarry with a record production F16 year. A new quarry pit is being developed on the Hunua site and will phase into commercial production by February ‘17
33Fletcher Building Building Products Investor Day Presentation | © October 2016
Higgins Quarries are now integrated into GBCWAcquisition complementary to current footprint with infill in Manawatu, where we previously had little presence
Hawkes Bay and Canterbury footprints also highly complementary
Future focus is on extending certainty of resource and consenting
Canterbury is the priority region to identify the next resource which will be required in ~7 yearsWhilst many of our quarries have long resource life, planning is being extended to ensure there are economic overburden sites available
Masterton
Baldwins
Kapiti
Ashurst, Te Matai, Awapuni
Roys Hill
Selwyn
Vinegar Hill, Sanson, Bulls
Hunua, Pukekawa, Three Kings, Helensville, Flat Top
Otamarakau, Pacific Pumice
Wiremu
Waikanae, Otaki
Petone, Belmont,Dry Creek Cleanfill
Yaldhurst, Yaldhurst Cleanfill, Amberly Sand
Whitehall
Otaika
Awatoto

Firth has been successful at both growing share and lifting margins in ready-mixed concrete
Fletcher Building Building Products Investor Day Presentation | © October 201634
NZ Concrete Market and Firth Share Firth Concrete Price Performance
Cost Components – Ready-Mixed ConcreteGiven channel value pull through, Firth has targeted sustainable concrete share growth, while looking to lift price and maximise margin opportunities• Cement and aggregates comprise ~65% of the
delivered cost of ready-mixed concrete• Firth has lifted it’s National concrete share by 3%
over the last three years, with volumes up 40% including market growth
• Despite price pressure from competitor’s use of cement imports, Firth has been able to achieve modest price and margin improvements
Cement
Aggs
Admix
Plant Cost
Delivery Cost
Margin
FB Materials
0
1,000
2,000
3,000
4,000
Jun-
06
Jun-
07
Jun-
08
Jun-
09
Jun-
10
Jun-
11
Jun-
12
Jun-
13
Jun-
14
Jun-
15
Jun-
16
00
0m
3
Annual Market Size (m3) 4 Quarter Moving Share

Delivering segmented value propositions, innovation, and proprietary installed solutions, are key to Firth’s ongoing success
35 Fletcher Building Building Products Investor Day Presentation | © October 2016
Dis
trib
utor
s
Resi
dent
ial
Com
mer
cial
Infr
astr
uc-t
ure
SME
Gro
up
Build
erLa
rge
Inst
alle
rs &
Con
trac
tors
Smal
l In
stal
ler
Market Customer Channel Supply
Operational Capability• 70 plant and 400 truck network
• Integrated pour planning and management
Engineering and Technical Expertise• Value engineering at design and construction
• Proprietary mix designs for specialist applications (piling, self compacting, foundations)
• Technical support, testing and verification
Innovation in Installed Solutions• Firth RibRaft® foundation range
• Firth HotEdge® foundation insulation
• Concrete and masonry packaged solutions
Innovation in Digital Technology• Order and delivery management (trucks on
maps, ConText, mobile APP)
• Information and account management (MyPour)

To meet surging Auckland demand for concrete, Firth is implementing substantial capacity and capability enhancements
36Fletcher Building Building Products Investor Day Presentation | © October 2016
• Firth presently operates eight concrete batching plants, and 110 trucks across the Auckland network
• Currently constructing a large central-mix plant in Manukau to service South and East Auckland growth. Plans underway to add additional plants in West and South Auckland, plus augment Wharehine capacity in Rodney
• Auckland customer service, orders and despatch function centralised to support network optimisation. Utilise real-time demand and capacity tools
• Dedicated demand planning team, work with key customers on project and major pour management
• Mobile APP introduced to provide customers order visibility and enhance confirmation process
• Cost to Serve programme (activity based GPS enabled) supports pricing disciplines and targeting of higher value sales
Silverdale
Albany
East Tamaki
Pukekohe
Penrose
Waiheke
City
Henderson
Papakura**
Westgate*
Manukau**
Firth Auckland Certified Plant Network
Cap
acity
Cap
abili
ty
• Additional plant and truck resource will add ~35% network capacity, with planning and process improvement targeted to add a further 15-20% * Planned capacity to be plant-shared with competitor
** Firth capacity under construction or planning

Firth has leading positions in all concrete masonry segments, with significant growth and network optimisation opportunities
37 Fletcher Building Building Products Investor Day Presentation | © October 2016
Product Category
CategoryShare
Channel Opportunity
Concrete Paving
65%
Distributor70%Installer 25%Contractor 5%
• Landscaping growth (outdoor rooms)
• Honed and architectural series
• Commercial and civic • Permeable systems
ConcreteRetaining
75%
Distributor 50%Installer 40%Contractor 10%
• Residential retaining and garden
• Roading and infrastructure
Grey Masonry
60%
Distributor 60%Installer 40%
• Mortarless systems for intertenancy
• Installer barrier• Architectural masonry
Concrete Brick
70%
Distributor 60% Installer 30%GHB 10%
• Clay brick substitution
• Pull-through demand from GHB’s
Pre-mixed Concrete
55%
Distributor 70%Installer 30%
• Coloured mortars to compliment bricks
• Specialty sands
• Firth operates 8 masonry plants and 2 Driconpre-mixed mortar bagging plants throughout NZ. Five masonry plants are double shifting and operating close to capacity
• Growth is strongest in higher margin cladding, paving and retaining segments
• Demand is heavily skewed North, with ~75% of sales from the Central North Island up
• Capacity constraints in the Upper North Island are resulting in higher inter-region freight costs as product is shipped in from other plants
• Firth is currently constructing a new state of the art $22m masonry plant in GBCWinstone’s Hunua (Akl) quarry, due to be commissioned June 2017
• Hunua plant will provide in excess of 200% lift in Auckland capacity, and enable the closure of the East Tamaki plant and product optimisation at other plants delivering substantial manufacturing and freight benefits
Manufacturing Plant Consolidation

Key concrete value chain messages
• Fletcher Building has a strong value chain and strong external customer relations
• Cement business has a competitive cost positon and is well positioned to maintain share
• Firth Ready-mix has been successful at gaining share whilst holding sell price, and provided substantial value chain pull through
• Active reinvestment delivers improved efficiencies and the business positioned to capture growth and key projects
• Quarry assets well positioned to capitalise on strong construction market
• Firth has strong segmented value propositions supported by innovative products and solutions
38Fletcher Building Building Products Investor Day Presentation | © October 2016

Working with you
Fletcher BuildingBuilding Products investor Day 2016
Managing product convergence:Humes NZ & Iplex NZ
Logan AvesDavid Welsh

Humes NZOverview
Fletcher Building Building Products Investor Day Presentation | © October 201640
Summary Financials (NZ$m)
Humes Location Map NZMarket Share
50% 51% 53%59% 58%
0%
20%
40%
60%
80%
100%
2012 2013 2014 2015 2016
List of competitors:• Hynds• Frank PKS• Asmuss• Maskells
Humes Sales Centre
Humes Manufacturing Site
Whangarei
Mt MaunganuiTauranga
Rotorua
HastingsNew Plymouth
Stratford Palmerston North
MastertonPetone
Thorndon
Te RapaAlbanyHendersonPenroseTakaniniPapakura
RangioraChristchurchChristchurch WestChristchurchOasis Clearwater
Nelson
Greymouth
AlexandraDunedin
Invercargill
Timaru
Frankton
35
26
49
60
Humes F16 Revenue by product group
Concrete Pipes
Precast
Plastic
Merchandise

Iplex Pipelines NZOverview
Fletcher Building Building Products Investor Day Presentation | © October 201641
Summary Financials (NZ$m)
Iplex Location Map NZMarket ShareList of competitors:• Aliaxis• S&T
(Aquaduct)• Asmuss• Hynds (W&F)
Auckland sales office
Palmerston North manufacturing site
Christchurch manufacturing site
34% 35% 35% 35% 35%
0%
20%
40%
60%
80%
100%
2012 2013 2014 2015 2016
49
31
11
3
Iplex F16 Revenue by product group
PVC
PE
Fittings
Other

Combined market size of $450M
Fletcher Building Building Products Investor Day Presentation | © October 201642
RWI – Rural water infrastructure (market size highly volatile), ET – Electrical & TelecommunicationsPVC includes Glass Reinforced Plastic (GRP), Concrete includes precast, Other materials encapsulates copper, steel, aluminium and ductile ironOther segment of market includes oil & gas, waste water treatment plants and factories
Total Market
Estimated 2015 NZ Pipelines Market
Civil
Includes all non-pressure and pressure pipe, concrete is only in non-pressure
$446m
PVC $157M
PE $134M
Concrete $93M
Other $62M
Subdivision Infrastructure Roading Drainage Plumbing Rural RWI ET Other
$ 80m $ 50m $ 50m $ 50m $ 40m $ 68m $ 48m $ 30m $ 30m
0%
10%
20%
30%
40%
50%
60%
70%
80%
90%
100%
Shar
e (%
)
Total Market
Other$62m
Concrete$93m
PE$134m
PVC$157m

Box sizes are presented for illustrative purposes only and do not represent segment size
Key customer segments serviced through FB channels
Fletcher Building Building Products Investor Day Presentation | © October 201643
Plumbing Drainage inside boundary
Drainage outside boundary
Civil (Infrastructure, Subdivision, Roading)
Rural / RWI
Plumbers ContractorsDrainlayers
& Independents etc.
Man
ufac
ture
rsD
istr
ibut
ors
Cus
tom
er
Segm
ent
Iplex have some direct to customer sales into rural, ET and Exports
ET
Councils / NZTA / DevelopersHomeowners / DevelopersArchitects Utilities
Farmers / Community
SchemesOw
ner /
in
fluen
cer
RWI – Rural water infrastructure, ET – Electrical & Telecommunications.
Largely commodity products Technical / specification advisory & design influencing valued
Plastic (PVC & PE) pipe Concrete pipe & Precast
Nee
ds

Customer insight – customers and their needs
Fletcher Building Building Products Investor Day Presentation | © October 201644
70%
12%
8%
10%
Humes Customer Segments
Civil Drainlayers Rural Asset Owners
32%
22%37%
9%
Iplex NZ Customer Segments
Civil Plumbing Rural ET

Customer insight – customers and their needs
Fletcher Building Building Products Investor Day Presentation | © October 201645
knowing that they each have their Safety in design as growing concern and requiring attentionDesire the ground in the future.
Safety in design as growing concern and requiring attentionDesire by some to have no men in the ground in the future.
ExpertiseCostAvoidance of risk
Overseas product is not getting any positive pressNZ (tested with track record) is “safer” choice
Durability / resilience / ease of maintenance as key ‘ needs’ of Asset owners, but COST given as over-riding factor by contractors
What customers
value
Contractors Consultants Owners

Identification Establishment Scope design Detailed design Tender Build
Customer journey – the Humes/Iplex value propositions
Fletcher Building Building Products Investor Day Presentation | © October 201646
Right SolutionLow riskCost effectiveDurability
Project PlanningGovernanceFinanceRegulatory advice
Smart solutionFit for purposeZero riskWhole of lifeWithin budget
Consented designSpecificationRight MaterialsSupplier VAProject cost
Best CostReduced TimeQualityFail proof Ease
ReliabilityQualityOn timeOn budgetProject Management
Advisory supportSolution optionsValue propositions
Risk MitigationPartnersPrior experience
Project Technical support
ValueengineeringPipeline design
End to end costing, scheduling, value options
DistributionProject managementBuild supportQuality & DIFOTIS
Case studiesGlobal best practiceValue propositions
Project planningStandardsSpecification
Plastic Technical support
Pipeline designEngineered solution performance
Spec’d solutions and alternatives
FB Integratedsupply chainQuality & DIFOTIS
Project path
Requirement

Leverage in action – rural water infrastructure
Fletcher Building Building Products Investor Day Presentation | © October 201647
Central Plains II…Hunter Downs…
Mayfield Hinds…Waimakiriri…
Sheffield…Ruataniwha…Flaxbourne…
Hurunui…Amuri…
Waitaki…Manuherikia…
Irrigation Scheme Pipeline: 2016 - 2020
Pipeline Materials Value

Humes & Iplex NZ key messages
• Humes and Iplex have a complimentary customer offer with full market coverage – stronger than any single competitor
• Attractive channel to market model with strong internal and external channel partners
• Leverage expertise, together, to address customer requirements
• The Rural Water Infrastructure sector offers a large incremental opportunity well suited to our joint value propositions
Fletcher Building Building Products Investor Day Presentation | © October 201648

Working with you
Managing channels: Winstone Wallboards
Fletcher BuildingBuilding Products Investor Day 2016
David Thomas

Winstone WallboardsOverview
Fletcher Building Building Products Investor Day Presentation | © October 201650
Branch/site location map NZ
Akl Manufacturing• Felix St, PenroseAkl Distribution• The Gate, Onehunga• Felix St, Penrose• Timberley Rd, Mangere
WELLINGTON
CHRISTCHURCH
AUCKLAND
Wlgn Distribution• Petone
Chch Manufacturing• Opawa RdChch Distribution• Opawa Rd• Curries Rd
Products cover the core range of interior lining systems
29.1% 30.6%46.1%
52.3%57.3%
18.6%12.1%
53.9%
0%
20%
40%
60%
80%
100%
Net Revenue Gross Margin NZ Board SalesVolume
10mm GIB® Standard Performance Board
Non Board/Other

Winstone WallboardsMaintaining our position as New Zealand’s leading supplier of building materials
Fletcher Building Building Products Investor Day Presentation | © October 201651
Our focus is on executing the core Strategy
Service and Operational Excellence
With• Superior Logistics
• Product/Service Superiority
• Competitive Cost Position
• Competent People
SellingExclusively to
Building MaterialsMerchants
Supporting• Builders/Installers
• Designers
• Owners
• Industry Organisations

Winstone WallboardsSolid progress has been maintained on our critical drivers
Fletcher Building Building Products Investor Day Presentation | © October 201652
Drivers Metrics FY13 FY14 FY15 FY16 Main Strategies ExecutionSuccess
People,Culture and Safety
EmployeeEngagement 74% 79% 79% 83%
High Performance StandardsContinuous CommunicationLine of Sight to Customers
TRIs 1 2 7 7 Mission First, Safety AlwaysKey Risk Areas Addressed
Customer Leadership
Market Share > 90% > 90% > 90% > 90% Merchant Channel PositionTechnical and Logistics Service Excellence
Net Promoter Score 35% 47% 49% 49% Product Quality Management
Technical and Logistics Service Excellence
Operational Excellence
Uptime1 84.1% 84.3% 84.8% 86.1% Preventative MaintenanceProduct Change-Over Time
A-GradeRecoveries1 98.2% 98.2% 98.5% 98.5% Plant Upgrades
Record production at 30Mm² in F16
ServiceExcellence
DIFOTIS 95.7% 94.1% 95.5% 94.0% Distribution Centre CapacityDeliver-to-Site Ownership & Control
DTS (Akl/Chch) 53% 58% 61% 65%Deliver-to-Site Service EnhancementsCommercial Site Coordination ExpansionOrder Complexity Management2
Contact Centre Wait Time 8 secs 9 secs 7 secs 6 secs Contact Centre critical interface with
Merchants and Builders
1. Auckland plant.2. Order packing complexity has increased requiring more labour resources at the warehouse and site. Strategies being implemented to manage complexity include
SKU rationalisation, bulk order incentive simplification and “pick-to-zero” packing and unpacking which splits packs on site, rather than in warehouse, saving time and costs.

Winstone WallboardsContinued to lead our customers on 3 main fronts
Fletcher Building Building Products Investor Day Presentation | © October 201653
Customer Leadership Focus Areas
Helping Customers Become More
Productive
Helping Customers Make the Right
Choices
Helping Customers Provide Quality
Outcomes
While Enhancing Our Offers …
Merchants Residential Builders
EDI Order Tracking
Reduced Delivery Damage
Deliver to Site Expansion
Deliver to Site Extensions
EzyBrace II and FrameSaver®
Trade Talk® Seminars
Architects, Specifiers Commercial Builders/Installers
BRANZ Appraised BIM Objects
Digest® Training Series
Superline® and Acoustics Range
GIB® Site Coordinator and Trainer
Updated Fire Systems
Reduced Delivery Damage
1
2
3

Winstone WallboardsLooking forward, we remain focused on retaining share at the best sustainable price
Fletcher Building Building Products Investor Day Presentation | © October 201654
Strategies to Retain Share …
Service Excellence
Operational Excellence
The Best People
Strategic Initiatives
• Enhance digital access to product, technical, order and delivery information
• Enhance GIB® Service Logistics offer, simplify bulk ordering incentives for lower cost-to-serve and deploy “Pick to Zero” delivery to site
• Reconfigure distribution footprint to increase logistics capacity
Strategic Initiatives KPI Targets
All Segments NPS >50%
DIFOTIS >95%
Strategic Initiatives
• Stock build in F16/early F17 for seasonal peak in F17
• Optimise OEE performance
• Implement mitigation programme to reduce risks to business continuity
Up-Time 88%
“A” Grade Recovery 98.5%
Strategic Initiatives
• Complete Succession Planning and Implement
• Build Talent Management programme for capability development
• Build and implement Performance and Retention Programmes
OHI >80%
Employee Engagement > 80%
RecognisedEmployer of Choice

Winstone Wallboards… While also pursuing market and margin growth
Fletcher Building Building Products Investor Day Presentation | © October 201655
Strategies to Retain Share and Grow …
Understand Needs
and Lead Customers
Growth & Innovation
Strategic Initiatives
• Review Sales Team Structure for greater coverage on large projects, immigrant builders and other growing segments
• Protect the Specification – representation, project tracking
• Niche Segment “Strike Teams” to revamp value propositions on Education, Aged Care, Terraces, Apartments and Hospitals sectors
• Pricing and Channel Strategy and Structure review; Exploration of “price seeker” segment and options to maintain premiums
Strategic Initiatives KPI Targets
Multi-unit Project Share >
90%
PerformanceBoard Mix > 60%
Reduce CSQs* by 1%
Strategic Initiatives
• Price Increase – products and Winstone Wallboards labour hire rates
• New Systems development and launch for multi-unit housing including launch of Barrierline® for Inter-tenancy walls
• Explore the opportunity for Flooring and Sheathing Systems
• Major marketing campaigns for specialty distributors of non-board products - compounds, accessories, metals - targeting installers
• Expand exports/licensing of GIB X-Block® into North America and compounds into Australia
Increase Price 3%
Multi-unit Project Share > 90%
Increase Non-board, New
Product and Export GM
*Customer Specific Quote

Winstone WallboardsIn summary
• We have a highly valuable and well-earned market position
• This has been built over many years through a customer driven strategy underpinned by best practice execution
• It is difficult for new competitors to quickly emulate the strength of our service proposition at scale
• We are prepared and committed to sustaining this position well into the future and have multiple growth and innovation opportunities
Fletcher Building Building Products Investor Day Presentation | © October 201656

Working with you
Fletcher BuildingBuilding Products Investor Day 2016
57
Regaining momentum:Fletcher Insulation
Justin Hollis

Fletcher Insulation: Business overview
58 Fletcher Building Building Products Investor Day Presentation | © October 2016
Glasswool
Foil
Ee-Fit
Baron
• Revenue 10%• Contracting business that provides insulation
installation services• Top 5 in terms of sales nationally but competes in
regional markets of Victoria and Queensland• Operates independently from FI Core
• Revenue 13%• Largest capacity foil lamination plant in Homebush NSW• Makes Paper/Aluminium and poly weave based
laminates• Provides facing foil for glasswool blanket• Largest player in the foil market
• Revenue 71%• Operating plant in Dandenong VIC and restarted plant in
Rooty Hill NSW• 2ndlargest player in Australian glasswool market
• Revenue 6%• Industrial insulation value added distributor• Buys in, assembles and installs specialist insulation
FI Core
• Revenue 84%• Includes Bought in lines• Operates Sales and Distribution selling Glasswool,
Foil and complementary bought in lines
Bendigo
SheppartonAdelaide
Perth
Darwin
Townsville
Brisbane
Coffs Harbour
NewcastleOrange
Canberra
Melbourne
Hobart
Sydney
• Operates independently from FI Core
Sales & DistributionGlasswool plant
BaronFoil plant
Ee-Fit
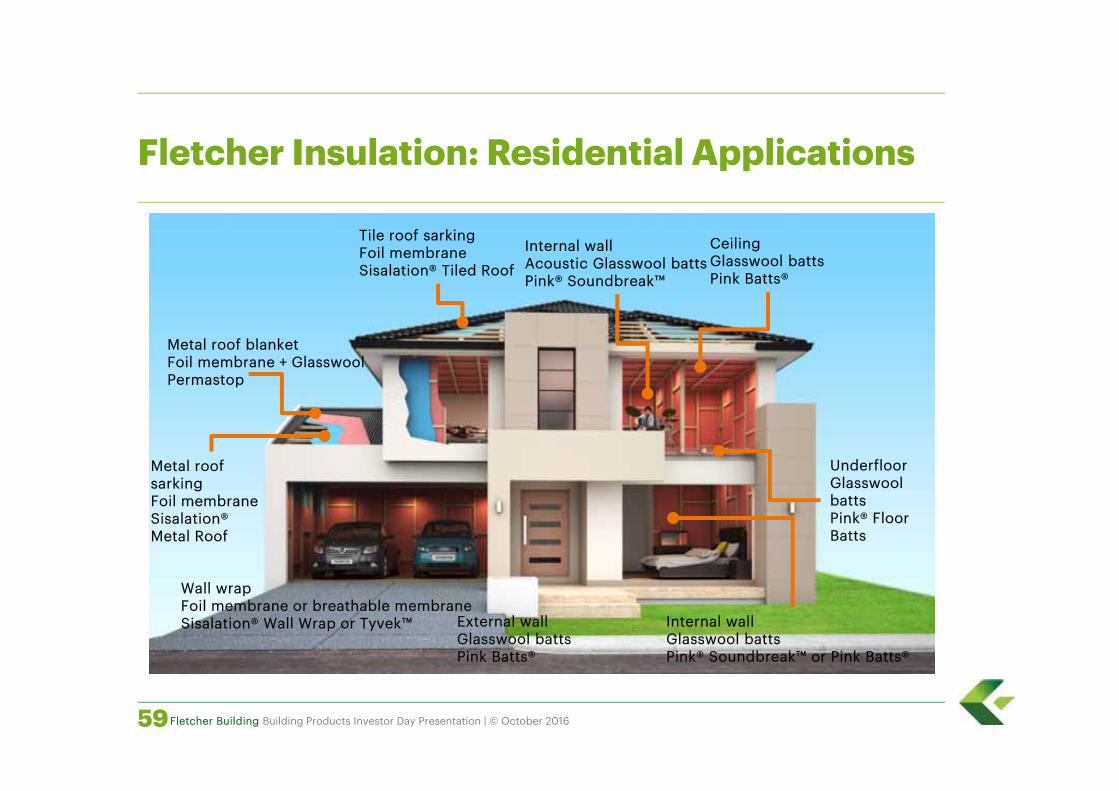
Fletcher Insulation: Residential Applications
59Fletcher Building Building Products Investor Day Presentation | © October 2016
Tile roof sarkingFoil membraneSisalation® Tiled Roof
Metal roof blanketFoil membrane + GlasswoolPermastop
Wall wrapFoil membrane or breathable membraneSisalation® Wall Wrap or Tyvek™ External wall
Glasswool battsPink Batts®
Internal wallGlasswool battsPink® Soundbreak™ or Pink Batts®
CeilingGlasswool battsPink Batts®
UnderfloorGlasswool battsPink® Floor Batts
Internal wallAcoustic Glasswool battsPink® Soundbreak™
Metal roof sarkingFoil membraneSisalation® Metal Roof

Fletcher Insulation: Commercial Applications
60Fletcher Building Building Products Investor Day Presentation | © October 2016
Metal roof blanketFoil membrane + GlasswoolPermastop®
FoamClosed cell foamSisalation® Foam Cell
UnderslabGlasswool Pink® Thermal Slab
Underslab SoffitGlasswool battsPink® Thermal Slab or PiRFORMTHERM™
CeilingGlasswool battsPink® batts
PartitionGlasswool battsPink® Partition
Steel MeshRoofsafe Safety Mesh
Ceiling tilesMineralwool tilesEurocostic™
Metal roof spacerRoof Razor™ or Roof Rack®

Fletcher Insulation: Market channel map
61 Fletcher Building Building Products Investor Day Presentation | © October 2016
Trad
e w
hole
sale
DIY – Do it Yourself Retrofit
Roofing Contractors
Lagging contractors
Sheet metal fabricators
Hardware retailers
Manufacturers
Importers
Detached new build
Alterations & Additions
New build
Alterations & Additions
DIFM – Do it for me
Large project home builders
Small independent builders
Large commercial builders
Supply & Fit
Direct
Plumbers
Lining contractors
Small commercial builders
Replacement
New build
Plasterboard
Plumbing supplies
Metal roofing w/sale
Metal roofing mfg
HVAC wholesalers
Con
sum
ers
Resi
dent
ial
Build
ers
Com
mer
cial
Bu
ilder
s
Multi-res new build
Resi
dent
ial
Metal Shed fabricators
New build – high rise
Com
mer
cial
Indu
stri
al
Commercial Interiors
Portable Buildings
Aggregator
OEM
Ship building
Competitors Market channels Installers End Segments Market
Indu
stria
l
Plasterboard buying

Fletcher Insulation: Market size
62 Fletcher Building Building Products Investor Day Presentation | © October 2016
Source: Fletcher Insulation1. Kingspan is based on glasswool equivalent element of their composite systems
Insulation Market by Channel
$m
Insulation Market by Product Group
$m
0%
20%
40%
60%
80%
100%
NSW/ACT VIC/TAS QLD WA SA/NT
134 135 103 50 46
Total: 468
0%
20%
40%
60%
80%
100%
NSW/ACT VIC/TAS QLD WA SA/NT
134 135 103 50 46
Total: 468
Supply & Fit
Retail
Roofing
Plaster-board
HVAC
Glasswool
Foil + L&C
Bought in lines
Other

Fletcher Insulation: Glasswool market size & share
63Fletcher Building Building Products Investor Day Presentation | © October 2016
Source: Fletcher Insulation
FY15 Market Breakdown (tonnes)
30
36
26
28
30
32
34
36
2011 2016
Market Share %
0%
20%
40%
60%
80%
100%
QLD NSW/ACT VIC/TAS SA/NT WA
27K 24K 17K 10K 7K
CSR Bradford
Fletcher Insulation
Knauf
Other

Fletcher Insulation: Momentum building
64 Fletcher Building Building Products Investor Day Presentation | © October 2016
Story so far Future
Lowest cost base
• Low capital cost expansion of plant through de-bottlenecking in Dandenong and recommission Rooty Hill
• Supply chain cost compression by lower interstate transport by 30%
• Simplified offer by compressing SKUs by 85%• Removed 22 surplus overhead roles
• Pursue productivity improvements in manufacturing with and without capital
• Compress Homebush lamination cost base• Continue to benchmark cost base against
local and international manufacturers
Sales
• Gained ~6% market share from importers directly and through channel partners
• Delivered first sustained price increase since GFC• Introduced Salesforce Effectiveness (SFE) to map
and then target align channel partners
• Continue target importers in a disciplined manner enabled by SFE
• Low price increases• Identify and support channel partners to win• Introduce CRM to migrate SFE
Service
• Introduced Sales & Operational Planning (S&OP)• Move to 3 Party Logistics (3PL) in Melbourne• New local transport provider in Victoria enables
access to extensive network while reducing costs 25%
• Pursue 3PL and low cost local transport on eastern seaboard
• Invest in process improvement to align customer service and supply chain promoting reliability and flexibility
Marketing
• Correct underinvestment in people by rebuilding team from 3 to 6 people
• Deliver marketing basics (catalogue, website, SKU rationalisation)
• Drive growth through channel, size, application and behavioural segmentation
• Develop deep insights into product and service offer by segment
• Develop value propositions that can be conveyed by customer facing roles with impact

Fletcher Insulation key messages
• Insulation is a key component in the residential and commercial segments which points to strong underlying demand
• Fletcher Insulation is the 2nd largest player in the market which is predominately on the eastern seaboard
• Fletcher Insulation has the strongest competitive momentum – we have gained 6% of market share since 2011 with a targeted sales focus taking share from importers
• Fletcher Insulation’s turnaround has been due to a dual focus on customer facing elements and through higher capacity, more flexible operations and a lower cost base which has more to deliver
• We are confident we can continue this momentum to consolidate and strengthen our market position and profitability
65

Working with you
Fletcher BuildingBuilding Products investor Day 2016
Competing on customer service: Iplex Australia
Nicole Sumich

Iplex AustraliaOffers a diversified product range to the market
67 Fletcher Building Building Products Investor Day Presentation | © October 2016
The breadth of our product range allows Iplex to take a market leading position in all market segments• 80% of the products sold are manufactured by Iplex, the remaining 20% are purchased in • Contribution by product is, as expected, strongly influenced by market manufacturing capacity
10%
22%
13%
1%
26%
3%3%
13%
9%
Revenue by product
11%
5%
32%
3%4%5%
1%
25%
14%
Contribution by product

Iplex AustraliaMarket segment and competitor overview
Fletcher Building Building Products Investor Day Presentation | © October 201668
Iplex and Vinidex offer a full solution to all market segments. Others offer a more restricted product range or focus on certain market segments only

Iplex AustraliaAustralian PE and PVC Manufacturing Overview
Fletcher Building Building Products Investor Day Presentation | © October 201669
PVC and PE Manufacturing FootprintMarket Share
1
2
3
4 5
Iplex – 5 PVC, 2 PE sites
Vinidex– 4 PVC, 7 PE sites
Pipemakers – 3 PVC, 1 PE site
Pipeking – 1 PVC site
9060
72
52
67
33
25
14
12
3
Capacity Market Share
kTPVC Pipe
Iplex Vinidex PipemakersPipeking Other
PE – 2 Damos, 2 Cromfords, 1 ACP, 1 Accu-Tech, 1 Enviropipe
70 66
6650
32
8
20
4
10
5
35
3
Capacity Market Share
kTPE Pipe
Iplex Vinidex DamosPipemak Cromfords other
There remains overcapacity in Australian pipe manufacturing, particularly in Polyethylene (PE)• Iplex has recently closed two PE sites• Other competitors have also now done the
same

Iplex AustraliaCompeting effectively again in a commoditised marketImproved performance at Iplex Australia to date has relied on a “back-to-basics” approach to managing the challenges of a business highly exposed to fluctuations in demand
Project Diamond
DIFOT improvementCustomer Leading Personal Objectives
• Cannot run a business without it
• Enforced clear accountabilities people playing in position
• If it is not in the forecast, it wont be available to sell……
• Forward visibility of demand allows for planned scaling of operations (up or down)
• Sets clear baseline to deliver against – one number forecasting, fact based decisions
• Eliminated functional silos• Market driven approach vs
production driven approach
Sales and Operations Planning
Operational Excellence
Winning with Customer Service
0%1%2%3%4%5%6%7%8%
0
200
400
600
800
1000
FY15 FY16 FY17 YTD
$/to
nne
Conv Cost Scrap %
Production costs 25%Scrap generation 18%Raw material costs
$17m benefit FY16 vs FY15$29m benefit FY17 vs FY15
70 Fletcher Building Building Products Investor Day Presentation | © October 2016

Iplex AustraliaiPledge – our customer service promise
71 Fletcher Building Building Products Investor Day Presentation | © October 2016
Iplex had lost significant Plumbing market share and Victoria had been impacted the most. Between FY12 and FY15 in Victoria alone:
• $9.5m of margin had been lost• Sales volume had reduced by 30%• NPS score for Plumbing in Victoria was -9• Employee engagement in Vic Sales and Customer Service in 2015 was low
iPledge was developed and piloted in Victoria in September 2015 with 3 main objectives
Become a best in class supplier on service, providing a “no hassles” customer experience
Develop a customer first culture, addressing internal process and cultural barriers to deliver against an agreed customer promise
Regain profitable market by competing on service – recover our market leading position

Iplex AustraliaiPledge – our customer service promise
72 Fletcher Building Building Products Investor Day Presentation | © October 2016
125 Core Items always available
2 hour site collectionsPremium courier
30 sec call answering 24 hour turnaround Credits acknowledged
& 30 day close out
0
100
200
300
400
500
600
700
800
900Se
p-15
Oct
-15
Nov
-15
Dec
-15
Jan-
16
Feb-
16
Mar
-16
Apr
-16
May
-16
Jun-
16
Jul-1
6
Aug
-16
# Open Credits
Credit >30d
Total openCredits
70%
75%
80%
85%
90%
95%
100%
Sep-
15
Oct
-15
Nov
-15
Dec
-15
Jan-
16
Feb-
16
Mar
-16
Apr
-16
May
-16
Jun-
16
Jul-1
6
Aug
-16
Plumbing Segment DIFOTPlumbing Sales – average daily tonne rate
127t33%

Iplex AustraliaDIFOT - service levels have significantly improved with 30% less inventory
Customer Delivery Performance (DIFOT) improvement
• Inventory has reduced by 30% from a high in September 2014 of over $96m
• Delivery performance initially dropped off considerably – no basic business processes in place
• 2 out of every 5 orders was either delivered late or with items missing
• With a robust S&OP, we have more than halved the misses, whilst continuing to reduce inventory
• With 30% less inventory
‒ Order delivery performance is now higher
‒ Monthly revenue is now greater
73 Fletcher Building Building Products Investor Day Presentation | © October 2016
60%
65%
70%
75%
80%
85%
90%
95%
100%
60
65
70
75
80
85
90
95
100
Jul-1
4
Sep-
14
Nov
-14
Jan-
15
Mar
-15
May
-15
Jul-1
5
Sep-
15
Nov
-15
Jan-
16
Mar
-16
May
-16
Jul-1
6
Sep-
16
Ord
er D
IFO
T
Inve
ntor
y ($
m)
Order DIFOT Inventory ($m)

74 Fletcher Building Building Products Investor Day Presentation | © October 2016
Innovation – a fresh approach
Continued market share recovery
Segment based Solutions
World Class Customer Service
Winning Major Projects
The Iplex recovery is now focused on embedding even stronger market and customer positions• The basics are entrenched – Iplex is now defined by
Better Every Day• We continue to find opportunities to improve
efficiency• Iplex is winning in the market and customers are
returning – we have momentum• Iplex is well positioned to win upcoming substantial
project volumes• Constant, everyday demand WITH a solid project
pipeline will maintain a more acceptable level of profitability for Iplex
CUSTOMER LEADING
Enhanced product range
Iplex AustraliaA solid foundation will underpin the sustainability of future earnings
Key Iplex Australia messages
• The business is stable and Iplex has re-established market share and profitability
• Our manufacturing plants and supply chain are low cost, agile and responsive to customer needs
• Employee engagement is increasing and we have customer momentum
• Brand recognition is strong – the market and our people want us to be successful
• A sustainable future relies on a Customer Leading approach • Iplex is now well positioned to leverage this to consolidate
and strengthen our market position and profitability
Fletcher Building Building Products Investor Day Presentation | © October 201675

Working with you
Fletcher Building Building Products Investor Day 2016
Driving top line margin: Commercial centres of excellence
Becky Lloyd

The Sales & Marketing centre of excellence was established to drive top-line growth
77
BetterSelling
BetterMarketing
Better Pricing and Commercial
Management
Fletcher Building Building Products Investor Day Presentation | © October 2016

Our focus in Marketing is to deliver what customers value
Fletcher Building Building Products Investor Day Presentation | © October 201678
Customer insight and
segmentation
Customer value propositions
Customer service
promises

A recent example of a service promise…
Fletcher Building Building Products Investor Day Presentation | © October 201679

Pricing – setting and getting
1. Setting price effectively
2. Getting the price you set
3. Enabling people and process
Fletcher Building Building Products Investor Day Presentation | © October 201680
0
10
20
30
40
Freq
uency
Price, $
Price Distribution of a Product (Illustrative)
1.0%1.5% 1.6%
0.8%0.6%1.2% 1.1%
0.7%1.4% 1.6%
1.1%0.6%
7-20
15
8-20
15
9-20
15
10-2
015
11-2
015
12-2
015
1-20
16
2-20
16
3-20
16
4-20
16
5-20
16
6-20
16
Price Index YoY (Illustrative)
Revenue Price index
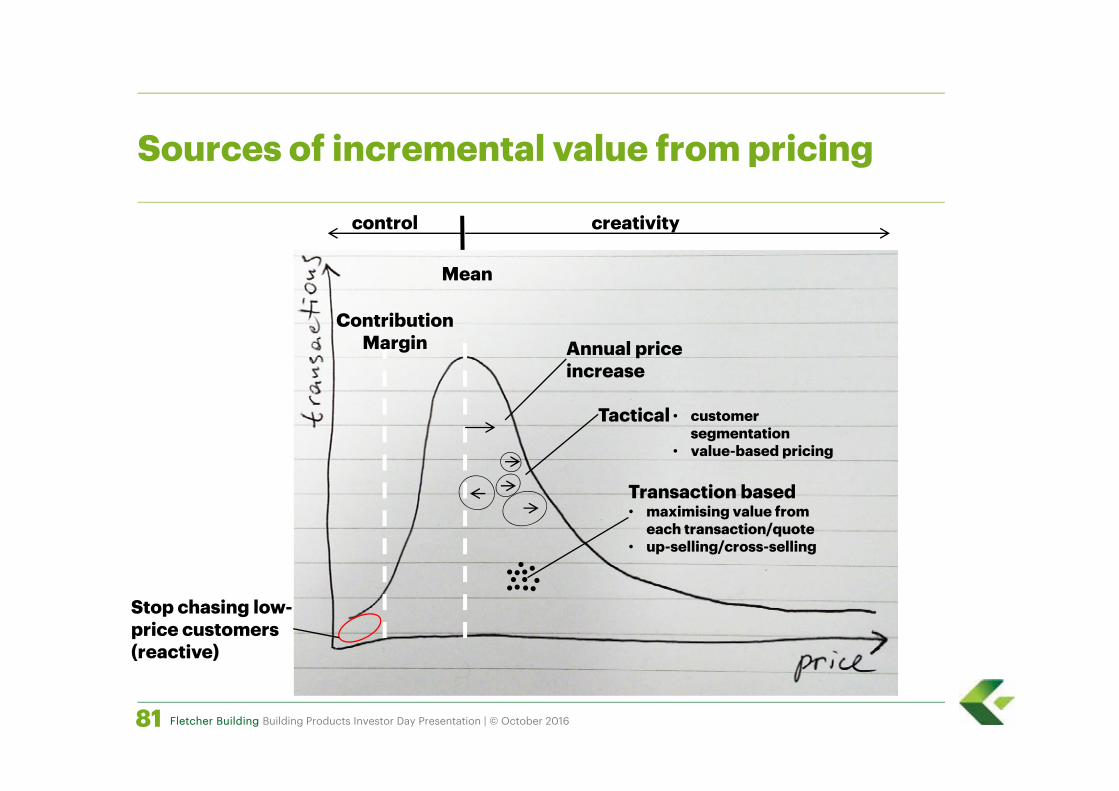
Sources of incremental value from pricing
Stop chasing low-price customers (reactive)
Contribution Margin
Mean
Annual price increase
Tactical
Transaction based• maximising value from
each transaction/quote• up-selling/cross-selling
• customer segmentation
• value-based pricing
control creativity
Fletcher Building Building Products Investor Day Presentation | © October 201681

Systematically rolling out better selling
Sales Strategy Where’s the growth?
Coverage and Structure Do we have the right roles in the right places?
Skills and Processes Do our people have the skills they need?
Motivation and Incentives Are we driving the behaviour we want?
Systems and Tools Do the tools enable our people?
Performance Management How well are we coaching for success?
Fletcher Building Building Products Investor Day Presentation | © October 201682

Our current sales excellence priorities…
• Sales assessment centres
• Sales learning pathways
• Sales incentive programme
• SF.com
• Performance cadence
Fletcher Building Building Products Investor Day Presentation | © October 201683

Ensuring we are delivering results through consistent commercial KPIs
Fletcher Building Building Products Investor Day Presentation | © October 201684

Laminex AU – a case study in commercial excellence
Laminex AU implemented a structured improvement programme, including:
• Segmentation for growth
• People
• Sales process and tools
• Pricing and cost to serve
Fletcher Building Building Products Investor Day Presentation | © October 201685
Sales
$M
Average Selling Price / m2
Month
Month
$/m2

Working with you
Innovation driven growth:International
Fletcher BuildingBuilding Products Investor Day 2016
86
Francisco Irazusta

The business has high quality, well positioned manufacturing assets in all regions
60%
80%
50%
100%
100%
90%80%
100%
100%
35%
90%
90%
90%
45%
25%
80%
70%
RTG
FORMICA
LAMINEX
Manufacture & sell
80%
90%
55%65%
80%
Source: Management Estimates 2016
Percentages highlight capacity utilizationPercentages highlight capacity utilization
Fletcher Building Building Products Investor Day Presentation | © October 201687

The business has high quality, well positioned manufacturing assets in all regions
Fletcher Building Building Products Investor Day Presentation | © October 201688Source: Management Estimates 2016
Percentages highlight capacity utilizationPercentages highlight capacity utilization

$71m$72m
FY15 FY16
Laminex Australia facing market challenges, predominantly in Western Australia, but focusing on alternative growth opportunities
Key Focus Areas:• Premium surface growth• Sales and marketing excellence• Consumer and customer activation• Operating efficiency and systems• People capability• Working capital optimisation
* EBIT: Operating earnings before interest, tax and significant items
Market Drivers:• Residential construction
– New homes – Renovation– Multi-residential
• Commercial construction – Education– Retail/hospitality– Healthcare
• Significant decline in WA construction market
EBIT *NZ$m
Fletcher Building Building Products Investor Day Presentation | © October 201689

Laminex New Zealand experiencing revenue growth and improving market positioning through service and new products
Fletcher Building Building Products Investor Day Presentation | © October 201690
Key Focus Areas:
• Relocation of Papakura paper treater to Hamilton.
• Manufacturing efficiency gains.
• Sales focus to gain market share.
• High quality product launches driving EBIT improvement through better mix.
* EBIT: Operating earnings before interest, tax and significant items
Market Drivers:• Strong market activity in Auckland, Tauranga and
Christchurch resulting in steady growth since October 2015.
• Major competitors merged in June 2015 resulting in changed market dynamics.
$10m**
$8m
FY15 FY16
Property sale $3m
EBIT *NZ$m,

Roof Tile Group, performing well in Asia and New Zealand, while the US is consolidating the business but Africa and Europe remain challenging
Key Focus Areas:• New management team built across the
business over last 18 months• Plant upgrades in US and EU complete• Team focus to drive ROFE to >20% over the
next 2-3 years* EBIT: Operating earnings before interest, tax and significant items
Market Drivers:• Americas new GM & Sales & Marketing
leads to drive revenue growth• Asia strong sales Japan; strong project
flow elsewhere• NZ strong demand and growing share.• Europe faces difficult markets but yoy
shipments up• Africa – Middle East previously large
contributor to total business. Significant drop last year
$14m $14m
FY15 FY16
EBIT *NZ$m,
Fletcher Building Building Products Investor Day Presentation | © October 201691

North America: Focus remains on driving revenue growth and continuing operational improvement
Key Focus Areas – New Product Intros:$49
$56
FY15 FY16
EBIT *NZ$m,
* EBIT: Operating earnings before interest, tax and significant items
Market Drivers:• Continued favourable construction markets –
strength in office, retail and hospitality, some weakness in regions impacted by commodity downturns
• Continued trend towards higher-value specialty products driving improved mix
• Initiatives underway to drive company-specific share gains
dECOLeatherRecycled Leather Veneer
Formica Infiniti™Luxury Performance Laminate
Fletcher Building Building Products Investor Day Presentation | © October 201692
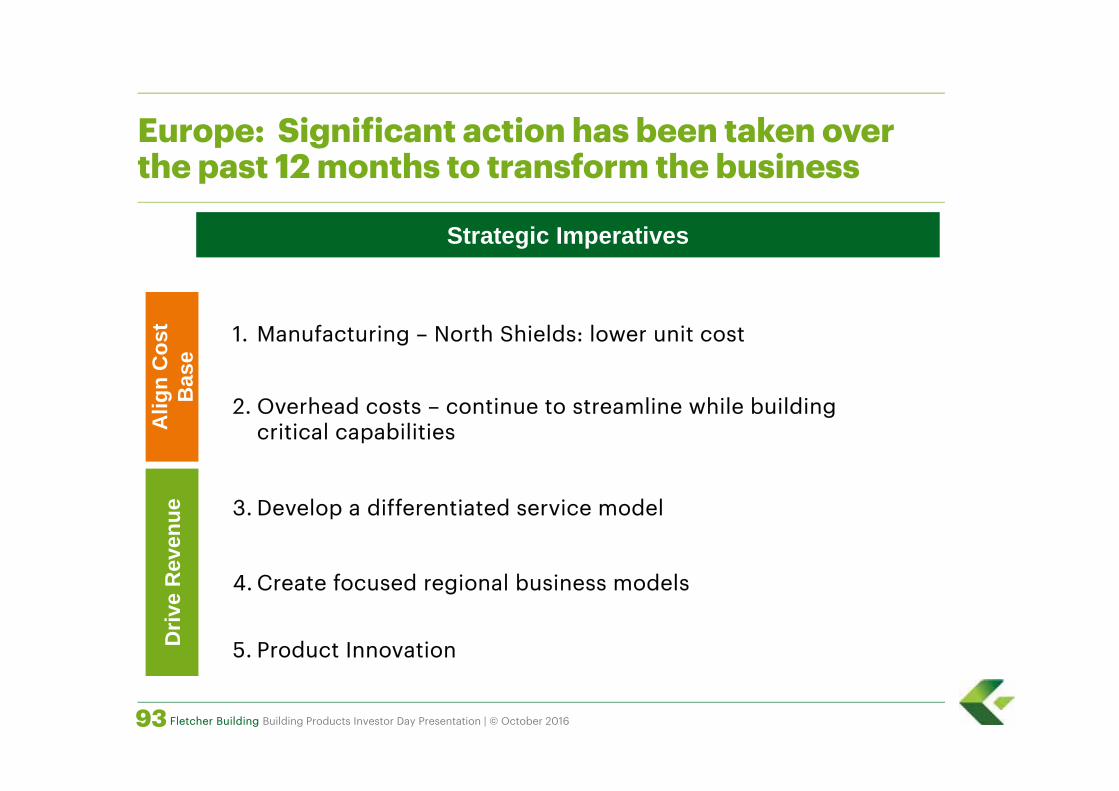
3. Develop a differentiated service model
4. Create focused regional business models
5. Product InnovationDriv
e R
even
ueA
lign
Cos
t B
ase
1. Manufacturing – North Shields: lower unit cost
2. Overhead costs – continue to streamline while building critical capabilities
Strategic Imperatives
Europe: Significant action has been taken over the past 12 months to transform the business
Fletcher Building Building Products Investor Day Presentation | © October 201693

North Shields showing sustained recovery, lower unit costs and improved productivity and employee metrics
Jul
Aug
Sep
Oct
Nov
Dec Jan
Feb
Mar Ap
rM
ay Jun
Jul
Aug
Sep
Finished Scrap
Jul
Aug
Sep
Oct
Nov
Dec Jan
Feb
Mar
Apr
May Jun
Jul
Aug
Sep
Manufacturing Variances
3.6%
Progress last 12 months• New experienced plant management team in place• Investment programme underway to drive down unit costs
9%
• Rate of employee absence: halved• Employee engagement: 30%
Fletcher Building Building Products Investor Day Presentation | © October 201694

Asia revenue growth continues across the region & Jiujiang loadings & operational performance continues to improve
Key Focus Areas:• Revenue growth particularly in China • Optimise manufacturing plants• Leverage new products to differentiate • Roll out new service model across Asia • Logistics and supply chain enhancements• Potential ERP system upgrade
* EBIT: Operating earnings before interest, tax and significant items
Market Drivers:• Infrastructure growth in China, esp. health
and education• China’s economic goal shifting from
manufacturing to service industry• Increasing living standards in consumer
goods & food$19m
$23m
FY15 FY16
EBIT *NZ$m
Fletcher Building Building Products Investor Day Presentation | © October 201695

China: focus on Juijang and revenue growth
Fletcher Building Building Products Investor Day Presentation | © October 201696
1. Improve productivity, efficiencies and loadings at Jiujiang
2. Lead time transformation to significantly improve service levels
3. Key segment focus to drive growth
4. Product innovationDriv
e R
even
ueA
lign
Cos
t B
ase
Strategic Imperatives

8.35.7
4.1
18.7
12
7
FY14 FY15 FY16Finished Door to Door
Jiujiang factory production output and productivity continues to increase
0.44
1.011.17
0.270.37
0.68
FY14 FY15 FY164 Foot 6 Foot
Annual Production(Million Sheets Produced)
33
5058
88
4236
8093
FY14 FY15 FY16 FY17
%Machine Utilisation
Scrap Rates
• Capacity loading continues to grow in Q1 FY17
• Efficiencies and production improving further in Q1 FY17
%
Fletcher Building Building Products Investor Day Presentation | © October 201697

69 71 77
84 83
-
20
40
60
80
100
FY12 FY13 FY14 FY15 FY16
Thailand
Singapore
Malaysia
ASEAN External Sales
NZD m *
Note: * Revenue stated at constant FX rate
CAGR
5%84
78 81 85
90
-
20
40
60
80
100
FY12 FY13 FY14 FY15 FY16
NE Asia External Sales
NZD m * CAGR
2%
ASEAN and NE Asia sales have shown consistent growth in recent years
Fletcher Building Building Products Investor Day Presentation | © October 201698

Conclusion
Laminex AUST: Growing revenue through market share gain and improving performance
RTG: Focus on growth while improving quality of earnings
Formica NA: Revenue growth focus
Formica EU: Transformation plan delivering positive EBIT position by year end
Formica ASIA: Transformation plan in China and JJ delivering double digit growth
Laminex NZ: Growing revenue, improving performance and gaining market share
Fletcher Building Building Products Investor Day Presentation | © October 201699

Working with you
Fletcher Building Building Products Investor Day 2016
How good can it get: Residential
Steve Evans

Lots Land Partnerships
Residential and Land DevelopmentHow are we tracking against 2015 update
101 Fletcher Building Building Products Investor Day Presentation | © October 2016
Volu
mes
Pipe
line
• 2016 Units sold exceeded forecast
• 2017 slightly lower due to extended timeframes on Christchurch apartments
• 2018 increased forecasts due to acceleration of existing pipe and additional partnerships work
0
400
800
1,200
2015 2016 2017 2018
Number of Units Sold
0
400
800
1,200
2016 2017 2018 2019
Number of Units Sold
December 2015 Now
Lots Land Partnerships
Total Pipeline 7,025
• Expected yield at Three Kings reduced from 1,413 to 1,200
• Increased yield through greater intensification
• 29,000 units under consideration
Total Pipeline 6,073

Residential and Land DevelopmentWhat has happened in the last 12 months
102 Fletcher Building Building Products Investor Day Presentation | © October 2016
What we haven’t done… What we’ve done…
A new divisional structure with a new branch to facilitate volume growth
We’ve seen land pricing return to more ‘reasonable’ levels over the last quarter as funding conditions tighten. This has enabled us to enter a number of transactions:Location Est. Units Status
South Auckland ~700 HoA
North West Auckland ~250 Preferred Partner
Swanson 123 Purchased
Moire Road 197 Purchased
Land acquisition – we’ve been disciplined and selective in our approach to land acquisition. Between September 2015 and August 2016 we completed no new lot, land or partnership transactions
Accelerated pipeline at the expense of quality
Over resourced the business

Residential and Land DevelopmentMoving Forward Metrics
103 Fletcher Building Building Products Investor Day Presentation | © October 2016
Revenue EBIT
Dwellings
FY14 FY15 FY16 FY17 FY18 FY19
$m
FY14 FY15 FY16 FY17 FY18 FY19
$m
FY14 FY15 FY16 FY17 FY18 FY19
Dw
ellin
gs
Funds Employed - $600m
No. of Units Sold p.a. – 1,500
Steady State Metrics

Residential and Land DevelopmentUnitary Plan Impact
104 Fletcher Building Building Products Investor Day Presentation | © October 2016
The Auckland Unitary Plan (AUP) is a combined plan made up of a:Regional Policy Statement; Regional Plan (including a Regional Coastal Plan); and a District Plan for the Auckland region.
The AUP will replace the existing Regional Policy Statement and the 12 other district and regional (legacy) plans. When it’s operative, the AUP will include provisions that help to decide: what can be built and where; how to create a higher quality and more compact Auckland; how to provide for rural activities; and how to maintain the marine environment.
What is it?
• It supports both extension of residential in the isthmus, and densification in areas of current urban Auckland.
• It supports our current developments, including our land parcels at Three Kings, Manukauand Mangere, but also allows us greater density of some of our other partnerships and lots developments
• It makes it easier for Fletcher Residential to bring homes to the market faster than was previously possible.
What this means for us?
• The Unitary Plan has now been notified, and appeals are being reviewed by the High Court. Some priority areas are likely to be resolved by Christmas
Timing and impact

Residential and Land DevelopmentGlobal Development Pipeline
105Fletcher Building Building Products Investor Day Presentation | © October 2016
Fletcher Building has over 300 owned properties globally. A number of these are not being utilised to their highest value use
We have undertaken a high-level review of the portfolio and identified a number of short term opportunities:
• James Fletcher Drive – FB owned site where we are subdividing and developing lots for separate sale
• Wiri North Quarry – FB owned former quarry. Currently being filled with spoil from the Waterview project. Identified as having commercial development potential
• Firth Mt Manganui – Ability to add value through subdivision of vacant land as a result of new masonry plant at Hunua
• Confidential Site, Australia – FB owned site currently used as a factory. Identified as having residential / retirement development potential
• Fitzroy Tradelink, Melbourne – FB owned site currently occupied by Tradelink. Identified as having residential development potential
• Formica UK – Reviewing sale of excess land at both North Shields and Aycliffe on the back of clear Formica strategy
But the work has only just been started, and we are confident there will be others……

Working with you
Fletcher BuildingBuilding Products Investor Day 2016
Wrap upQ&A session
Mark AdamsonGerry Bollman