Embed Size (px)
Citation preview

Fleet Utilization and Replacement Audit
September 2013
Patrice Randle, City Auditor
Craig Terrell, Assistant City Auditor
Lee Hagelstein, Internal Auditor

Fleet Utilization and Replacement Audit
Table of Contents
Page
Executive Summary ...................................................................................................................1
Audit Scope and Methodology ..................................................................................................2
Background ................................................................................................................................2
Detailed Audit Findings .............................................................................................................6
Additional Underutilized Vehicles ............................................................................... Exhibit I
Additional Underutilized Equipment ........................................................................... Exhibit II
Excerpt - Fleet Services Contract and Follow-Up Audit (Dec 2006) ......................... Exhibit III
Excerpt - Fleet Services Follow-Up Audit (March 2008) ..........................................Exhibit IV
Fleet Utilization and Replacement Audit
Office of the City Auditor Patrice Randle, CPA
City Auditor
Project # 13-07 September 20, 2013
Routine review of fleet
repair and maintenance
costs, and replacement
Target and non-target
costs are tracked within
the Fleet Focus system
Elimination of 23
underutilized assets could
result in cost savings of
over $100,000
Possibility of departments
sharing other under-
utilized vehicles and
equipment
Opportunities for
Improvement
Eliminate or reassign
underutilized assets
Evaluate useful life
parameters
Reconcile the annual
target cost report to Fleet
Focus
As part of the Fiscal Year 2013 Annual Audit Plan, the City
Auditor’s Office conducted an audit of the City of Arlington’s
Fleet Utilization and Replacement process. The audit was
conducted in accordance with generally accepted government
auditing standards, except for peer review. Those standards
require that we plan and perform the audit to obtain sufficient,
appropriate evidence to provide a reasonable basis for our findings
and conclusions based on our audit objectives. We believe that the
evidence obtained provides a reasonable basis for our findings and
conclusions based on our audit objectives. The objectives of the
audit were to determine whether:
maintenance and repair costs support the need to replace
vehicles and/or equipment; and,
the City’s fleet contains underutilized assets that could be
eliminated or reassigned.
During this audit, it was noted that the City’s Fleet Services
Division routinely reviews target and non-target costs to identify
work that has been performed under the fleet services contract.
Numerous fleet assets were identified as underutilized and
appropriate for elimination. With regard to beyond useful life, the
City Auditor’s Office noted that optimal useful life of asset classes
is analyzed based on industry standards rather than actual fleet
usage.
The City Auditor’s Office also noted that even though the fleet
services vendor submits an annual cost report documenting work
included in the annual contract price (e.g., preventative
maintenance), the vendor does not reconcile the annual report to
the Fleet Focus system. Fleet Focus entries are based on vendor’s
work orders. However, significant discrepancies were noted when
comparing the labor cost reported in the vendor’s annual report to
auditor calculations based on Fleet Focus data.
These findings and recommendations are discussed in the Detailed
Audit Findings section of this report.
Executive
Summary

Fleet Utilization and Replacement Audit September 20, 2013
2
Audit Scope and Methodology
The audit was conducted in accordance with generally accepted government auditing standards,
except for peer review. The following methodology was used in completing the audit.
Reviewed the fleet maintenance service contract
Reviewed target and non-target costs
Reviewed the Public Works and Transportation Operations Manual
Surveyed users regarding current fleet operations
Obtained a fleet inventory to perform analytical tests
Identified underutilized fleet assets and requested justification from departments
There were scope limitations with this audit process.
The City Auditor’s Office could not determine, with certainty, the total cost of non-target
repairs/maintenance being performed on specific assets. As stated in Finding #3, the hourly
labor rate could not be verified. Since excessive repair/maintenance cost (which includes labor)
is one way to evaluate an asset for possible elimination or replacement, we did not perform tests
to identify assets that should be replaced due to excessive maintenance.
The City Auditor’s Office was not able to determine if the useful life parameters of various
classes of fleet assets are optimal, which would have an effect on target costs, non-target costs,
and the optimal time for replacement. The asset useful life schedule within the fleet services
contract is based on industry standards rather than the City of Arlington’s actual fleet usage.
Background
The City of Arlington operates a fleet of vehicles and equipment which consisted of 1,288 units as of
January 7, 2013. The fleet is comprised of vehicles and equipment ranging in size from large dump
trucks and fire engines to four-wheel carts and trailers.
In August 2003, the City outsourced and entered into a contract with First Vehicle Services for fleet
maintenance services. The 2003 contract was initially a three-year agreement with two, one-year
extensions. In December 2008, the City entered into a new contract with All Star Fleet Services,
LLC, who later changed their name to G4S Integrated Fleet Services, LLC. The 2008 contract
resulted from a re-bid and is active until September 30, 2015.
The City of Arlington’s Fleet Services Division uses Fleet Focus software to track inventory,
maintenance/repair costs and other relevant information relating to the City’s fleet (i.e. purchase
date, make, model, department, mileage, etc.). The vendor is provided access to Fleet Focus in order
to input work orders and related cost information.

Fleet Utilization and Replacement Audit September 20, 2013
3
Pricing under the annual fleet maintenance contract is structured around vehicle equivalents (VEs).
The VE concept revolves around the actual size of the vehicle/equipment, its intended use and the
estimated cost of general repairs/maintenance over the useful life of the asset. For example, since
larger vehicles cost more to maintain than smaller vehicles, larger vehicles result in higher VEs. The
VEs ranged from 8.0 for large equipment to 1.0 for sedans. In reference to intended use, police
patrol sedans have a higher VE (2.5) than other sedans (1.0).
Fleet Costs
Included in the fleet services cost structure are target and non-target costs.
Target costs apply to preventative maintenance, inspections, routine mechanical repairs, tire
services, fuses and light bulbs. Target costs are included in the annual contract price.
Non-target costs apply to vehicle repairs that are unpredictable and cannot be estimated in
advance. Non-target costs exclude all preventative maintenance, but include items such as
beyond useful life repairs, accident/collision repairs, after-hour calls, up-fits (excluding police
patrol sedans), repairs due to damage, etc. Beyond useful life repairs are the most costly of non-
target expenses.
Beyond useful life parameters are established within the contract. Each type of vehicle/equipment is
assigned a useful life according to time and mileage. For example, a sedan has a useful life of
80,000 miles or 8 years, whereas a dump truck has a useful life of 120,000 miles or 12 years. Some
equipment has a useful life based on hours of usage. A backhoe/loader, for example, has a useful
life of 6,000 hours or 12 years. Once an asset reaches the end of its useful life, repairs and/or
maintenance costs are charged as non-target expenses.
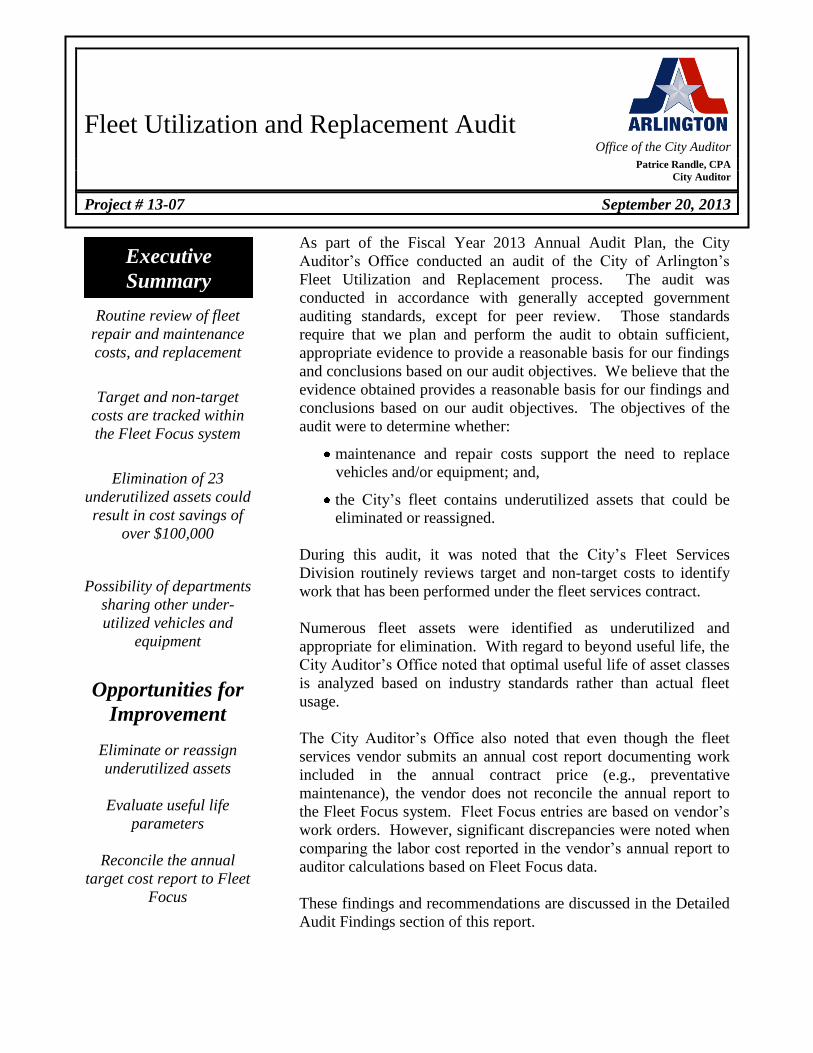
Prior to October 2012, contract pricing and maintenance costs were based on calendar year. The
following chart compares target and non-target costs and contract pricing for CY2004 through
CY2012.
Fleet Utilization and Replacement Audit September 20, 2013
4
$0.00
$250,000.00
$500,000.00
$750,000.00
$1,000,000.00
$1,250,000.00
$1,500,000.00
$1,750,000.00
$2,000,000.00
$2,250,000.00
$2,500,000.00
$2,750,000.00
2004 2005 2006 2007 2008 2009 2010 2011 2012
Target Costs
Non-Target Costs
Contract Price
Comparison of Target/Non-Target Costs and Contract PriceCY 2004 through CY 2012
Source: Fleet Focus and Lawson Financial System
The following chart shows the three largest maintenance costs over the past six years.
$0.00
$50,000.00
$100,000.00
$150,000.00
$200,000.00
$250,000.00
$300,000.00
$350,000.00
$400,000.00
$450,000.00
$500,000.00
2007 2008 2009 2010 2011 2012
Repairs Due to Damage
Beyond Life
Upfit
Significant Non-Target CostsCY 2007 - CY 2012
Source: Fleet Focus
Beyond Life: The most significant increase is related to beyond useful life costs. This increase
is due mainly to the age of the fleet. As of 01/07/13, there were 917 units of “rolling stock”. Of
those 917 units, there were 214 units beyond useful life according to age and 99 according to
mileage. Fifty-two of these units were beyond useful life in both age and mileage.

Fleet Utilization and Replacement Audit September 20, 2013
5
Up-fit: Up-fit charges are billed when specialty devices are added to vehicles/equipment after
purchase. While up-fit charges for police sedans are considered target services, up-fits for other
vehicles/equipment are considered non-target services. These charges fluctuate mainly based on
the type of equipment that is purchased and the modifications that are required.
Repairs Due to Damage: Repairs due to damage have increased slightly during the past four
years. This category includes physical damage to vehicles/equipment that is caused by
vandalism, abuse, misuse, work damage, unreported accidents or acts of God.
Funding for Fleet Replacement
Funding for fleet replacement is allocated through the City’s budgetary process. Other than the
budgeted allocation, there are times when additional funds are provided. For example, in FY2013,
$1,082,000 was allocated for fleet capital costs. Additional funding of $810,000 was provided from
the Gas Fund, specifically for additional Police vehicles. In FY2012, $900,000 was allocated for
fleet capital costs, while additional one-time funding of $436,254 was provided for vehicles.

Fleet Utilization and Replacement Audit September 20, 2013
6
Detailed Audit Findings
1. Underutilized assets have not been eliminated or reassigned.
It is good business practice to reassign or sell underutilized vehicles and equipment. If under-
utilized vehicles and equipment are not reassigned or sold, the City ends up paying
unnecessary fleet charges.
In January 2008, the City Council approved Resolution 08-024, authorizing a contract with
Spectrum Consultants, Inc. to perform a fleet services review and to develop an RFP to select a
fleet services provider. One item included within the contract was a review of underutilized
assets. Spectrum Consultants selected 4,000 miles/year for vehicles or 400 hours/year for
heavy equipment as the criteria for determining underutilization.
During this audit, the City Auditor’s Office obtained an inventory list of “rolling stock” as of
January 7, 2013. Of the 917 units listed, 108 units (69 vehicles and 39 pieces of heavy
equipment) were noted to be at or below the utilization criteria established by Spectrum
Consultants. Those 108 units were, therefore, selected for further research to determine if they
could be eliminated or reassigned.
Based on vehicle mileage, equipment hours, and departmental feedback, 23 of the 108 units
were determined to be underutilized and eligible for elimination or reassignment. It should be
noted that while five of the 23 underutilized assets will be removed from the fleet services
contract, those assets will be retained and maintained by Parks staff. The 23 units are included
within the following chart.

Fleet Utilization and Replacement Audit September 20, 2013
7
Target Non-Target Total
Unit Department Year Make Model Description VE * Cost * Cost (2012) Cost
Vehicles
2897 May or & Council 2008 FORD ESCAPE HYBRID FORD ESCAPE 1.4 3,168.41$ 160.43$ 3,328.84$
2632 Finance 2003 DODGE NEON SEDAN COMPACT 1.0 2,263.15 169.24 2,432.39
2433 Finance 2001 CHEV ASTRO VAN PASSENGER 8 1.2 2,715.78 606.49 3,322.27
2610 Community Serv ices 2002 FORD TAURUS SEDAN MID SIZE 1.0 2,263.15 671.95 2,935.10
2617 Planning 2002 FORD TAURUS SEDAN MID SIZE 1.0 2,263.15 199.29 2,462.44
2353 Parks 2001 FORD RANGER FLEETSIDE COMPACT 1.2 2,715.78 446.20 3,161.98
1577 Parks 1994 CHEV C2500 FLEETSIDE 3/4 TON 1.4 3,168.41 - 3,168.41
2631 Public Works 2003 DODGE NEON SEDAN COMPACT 1.0 2,263.15 87.88 2,351.03
2599 Fleet - Central Pool 2002 FORD TAURUS SEDAN MID SIZE 1.0 2,263.15 45.78 2,308.93
2607 Fleet - Central Pool 2002 FORD TAURUS SEDAN MID SIZE 1.0 2,263.15 - 2,263.15
2615 Fleet - Central Pool 2002 FORD TAURUS SEDAN MID SIZE 1.0 2,263.15 446.84 2,709.99
2400 Water 2000 FORD TAURUS SEDAN MID SIZE 1.0 2,263.15 698.83 2,961.98
Vehicle Subtotal 13.2 29,873.58$ 3,532.93$ 33,406.51$
Equipment
1924 Parks 1996 FORD 555E BACKHOE / LOADER 3.5 7,921.03 2,959.80 10,880.83
1616 Parks 1995 FORD F800 TRK DUMP 12 FT 6 YD 4.0 9,052.60$ 27.39$ 9,079.99$
2334 Parks 2001 NVSTR 4900 TRK HOOKLIFT 4.0 9,052.60 822.44 9,875.04
1922 Public Works 2007 KOMAT WB147 BACKHOE / LOADER 3.5 7,921.03 1,277.46 9,198.49
2337 Water 2000 KOMAT FB15MK-2 FORK LIFT - ELEC 0.0 - - -
2755 Water 2005 NVSTR 7100 SBA NF / VACTOR 0.0 - 2,145.48 2,145.48
1697 Water 1985 BOBCA 743 LOADER SKID STEER 2.0 4,526.30 3,146.47 7,672.77
2004 Water 1992 GMC TOP KICK TRK STAKE W/HOIST 3.5 7,921.03 751.20 8,672.23
2575 Water 1992 GMC TOP KICK TRK VALVE OPERATOR/WELD 3.5 7,921.03 - 7,921.03
2104 Water 1990 CASE 621 LOADER 2.5 YD 4.0 9,052.60 - 9,052.60
2328 Water 2001 NVSTR 4900 TRK DUMP W/SADLCOMPT 4.0 9,052.60 318.13 9,370.73
Equipment Subtotal 32.0 72,420.82$ 11,448.37$ 83,869.19$
TOTALS 45.2 102,294.40$ 14,981.30$ 117,275.70$
*
Target Costs (G4S Contract) 1,275.56$
General & Administrativ e (Ov erhead) 280.40
Capital (Replacements) 707.19
2,263.15$
Asset will be deleted from the Fleet Services Maintenance Contract, but will be retained by the Department . While
the fleet services contract will be reduced by target costs associated with the vehicle, the City will still incur maintenance and repair costs.
Annual Amount Charged to Departments, per VE
UNDERUTILIZED ASSETS
BASED ON MILEAGE OR HOURS AND DEPARTMENT FEEDBACK

Fleet Utilization and Replacement Audit September 20, 2013
8
The following chart illustrates approximate departmental cost savings that would be recognized as a
result of the asset eliminations.
$47,796.81
$36,166.24
$18,831.59
$5,754.66
$3,328.84
$2,935.10$2,462.44
Water Utilities
Parks
Public Works
Finance
Mayor & Council
Community Services
Planning
Cost Savings by Department
Source: Fleet Focus
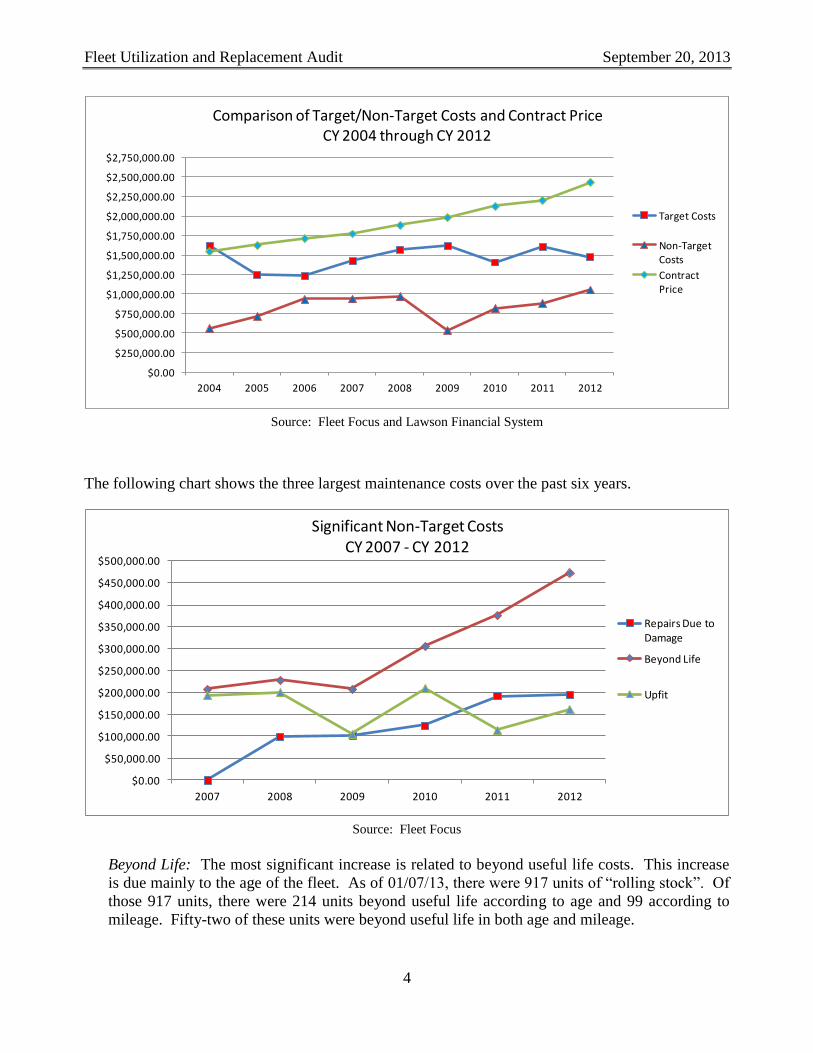
As previously noted, the City Auditor’s Office concluded that 18 of the 108 underutilized units
were eligible for elimination or reassignment. Departments determined that the remaining 90
units should be retained for reasons noted in the following chart.
# of Total Total
Reason Units VEs Cost
Re-Assignment 3 4.0 9,052.60$
Increased Usage 9 14.4 32,589.36
Emergency Response 15 19.4 43,905.11
Operational Necessity 63 143.1 323,856.77
Total 90 180.9 409,403.84$
JUSTIFICATION FOR VEHICLE/EQUIPMENT RETENTION
Source: Fleet Services Division and City Departments
As shown, the annual target cost to retain these assets would be approximately $409,000.
However, there is a possibility that sharing of vehicles and equipment between City
departments could lead to the future elimination or reassignment of assets. For informational

Fleet Utilization and Replacement Audit September 20, 2013
9
purposes, a detailed listing of these additional 90 units is included as Exhibit I and II of this
report.
The City Auditor’s Office noted that, since February 2010, the Fleet Services Division has
regularly performed an analysis of the City’s fleet. Although these analyses resulted in the
identification of underutilized assets, not all assets identified as underutilized were eliminated
or reassigned. Upon conclusion of our audit fieldwork, the Public Works and Transportation
Department finalized written policies and procedures. These revised procedures include
guidelines relating to the review and reassignment and/or elimination of underutilized assets.
Public Works’ revised procedures specify a minimum usage basis of 4,200 miles or 300 hours
of use annually for its fleet.
Recommendation:
The City Manager should require that the 23 units identified in this finding be eliminated
from the City’s fleet inventory or be reassigned to replace older units that are currently in
operation, but will be eliminated upon replacement.
Management’s Response:
Concur. The Fleet Services Division will begin its evaluation of vehicles to be
reassigned or stripped for auction.
Target Date: December 31, 2013
Responsibility: City of Arlington Fleet Manager
2. City vehicle replacement parameters may not be cost effective.
A good management practice of an on-going fleet replacement plan is to match available funds
with necessary fleet replacements.
The Public Works and Transportation Department has very little control over the amount of
funds available for capital replacement. For FY2012 and FY2013, the Fleet Services Division
was allocated $1,336,254 and $1,892,000, respectively, for asset replacement through the
City’s budgetary process. Based on the City’s contract parameters for determining “beyond
useful life”, approximately 35% of the City’s fleet (vehicles and equipment) was beyond useful
life as of January 2013.
In order to maximize the usefulness of the City’s fleet, it is important to determine the actual
useful life of specific asset classes. And, in order to decrease non-target costs, it is essential to
minimize, if not eliminate, beyond useful life assets. According to the Fleet Services Division,
useful life parameters within the current fleet maintenance contract are based on industry
standards provided by the vendor. For example, within the current maintenance contract, a
mid-size sedan has a standard useful life of eight (8) years or 80,000 miles. However, through
an evaluation of the City’s fleet of mid-size sedans, fleet management might determine that the

Fleet Utilization and Replacement Audit September 20, 2013
10
useful life is actually nine (9) years or 95,000 miles based on actual repair and maintenance
history for classes of vehicles.
As noted within the Audit Scope and Methodology section of this report, the City Auditor’s
Office was unable to verify the actual labor costs related to individual vehicle repairs. Non-
verification of actual labor costs, per vehicle, would prevent Fleet Services management from
calculating the optimal replacement for classes of vehicles.
The elimination of beyond useful life assets at the optimal replacement point (when the
decreasing depreciation intersects with the increasing operating costs) helps ensure that the
City is maximizing the return on its investment. Replacement of assets at the optimal point
will also result in reduced non-target cost, and will result in an increased residual value when
the assets are replaced at the proper time. New assets would be more fuel-efficient, will
comply with “green” initiatives, and should be more reliable.
Since the current contract is in effect until September 30, 2015, management may consider it
unnecessary to perform this analysis at this time.
Recommendation:
Prior to the renewal or re-bid of the fleet maintenance contract, the Director of Public
Works and Transportation should perform an analysis of the City’s fleet (based on actual
usage of the various groups of assets within the fleet) to develop optimal useful life
parameters.
Management’s Response:
Concur. Once Target Labor is being captured in the FMIS, optimum life expectancies
will then be considered when negotiating subsequent fleet services contracts.
Target Date: October 1, 2015 (end of current contract term) or October 1,
2017 if two one-year renewal options are approved
Responsibility: City of Arlington Fleet Manager
3. The annual fleet services report of target costs is not being reconciled to the City’s
reporting software (Fleet Focus).
In 2008, the City of Arlington, through Spectrum Consultants, Inc., sent out a Request for
Proposal (RFP) for maintenance services. Section 12.5.4 of the RFP states: “Within 90 days
of the conclusion of the contract year – there will be an annual cost reconciliation provided to
the city. The annual cost reconciliation will be defined by the contract administrator, but may
include the following. At the conclusion of the contract year, the contractor will provide an
annual summary of all target costs (broken down by salaries and benefits, repair parts, sublet
services, overhead and management fee, etc.) in its standard revenue and expense format. The
contractor will also provide the City with a unit-by-unit summary of maintenance and repair

Fleet Utilization and Replacement Audit September 20, 2013
11
activity for the prior year based entirely on information extracted directly from the fleet
management information system (currently Fleet Focus). Differences between the contractor’s
revenue and expenses statement and information extracted from the fleet management
information system (currently Fleet Focus) should be negligible. Any differences due to
reporting periods and/or accounting methodologies must be reconciled by the contractor and
fully explained to City Contract Administrator, financial and/or audit staff.”
Section 1.1.2.9.5.4 of the vendor’s technical response also states that the vendor will provide
the City with an annual reconciliation at the conclusion of each contract year, and that prior to
submission, the vendor’s Project Manager will coordinate closely with the City Contract
Administrator to establish the format and the information to be provided. The vendor’s
technical response clarifies that at a minimum, the reconciliation was to include an Annual
Summary of Target Costs (broken down to reflect components of direct and indirect costs) and
a Unit-by-Unit Summary of Maintenance and Repair Activity for the prior year.
The following schedules compare the G4S annual target cost report to information obtained
from Fleet Focus. It should be noted that CY2012 numbers only include data for the first nine
calendar months.
CY Fleet Focus G4S Report Difference
2009 $1,621,691 $2,436,899 $815,208
2010 $1,411,425 $2,367,164 $955,739
2011 $1,610,253 $2,445,908 $835,655
2012 $1,137,227 $1,883,225 $745,998
Comparison of Target Costs
CY Fleet Focus G4S Report Difference
2009 $530,037 $1,159,442 $629,405
2010 $477,364 $1,152,569 $675,205
2011 $485,435 $1,017,909 $532,474
2012 $350,750 $807,992 $457,242
Comparison of Labor Costs
Source: Fleet Focus and G4S Annual Report
As shown, Fleet Focus indicates that the majority of the differences are due to labor costs.
This could mainly be due to the hourly labor rate established within the initial contract, dated
December 30, 2008. The initial contract established an hourly labor rate of $38.80, which is
currently recorded on work orders. However, during this audit, the City Auditor’s Office
compared the total number of labor hours recorded in Fleet Focus to the total labor cost from
the G4S annual report, and arrived at a labor rate of approximately $81.00 per hour.
In addition, the following chart compares total labor cost, per the vendor, to the number of
hours entered into Fleet Focus via work orders. A material difference was noted. For
example, the vendor reported $807,992 in target payroll costs for FY2012. At an hourly labor
rate of $38.80, the City would expect to receive 20,824.5 target labor hours [$807,992/$38.80].
However, only 8,733 target labor hours were entered in Fleet Focus for FY2012. Based on the
charted information, data being entered into Fleet Focus is incorrect and/or incomplete, the

Fleet Utilization and Replacement Audit September 20, 2013
12
labor rate within the contract is too low, or the City is not receiving the number of target labor
hours that it is entitled to, based on the total target labor cost.
Vendor Expected Fleet Focus
CY Labor Cost Labor Hours * Labor Hours Difference
2009 $1,159,442 29,883 13,484 (16,399)
2010 $1,152,569 29,705 12,303 (17,402)
2011 $1,017,909 26,235 12,511 (13,724)
2012 $807,992 20,825 8,733 (12,092)
* Based on labor costs at $38.80/hourly contract rate
Comparison of Labor Cost to Labor Hours
Source: Fleet Focus and G4S Annual Report
Within their “Best and Final Offer”, the fleet services vendor proposed that in the interest of
teaming and further proving their commitment to partner with the City of Arlington, target cost
under-runs would be shared with the City on a 55-45 basis. Based on the vendor’s analysis of
their actual cost for target work performed, 55% of savings on the target costs would be
returned to the City.
During the preliminary stages of this audit, the City Auditor’s Office requested the vendor’s
2009 - 2012 annual reports of the target budget. Reconciliation reports were provided which
met the minimum requirements of Section 1.1.2.9.5.4 of the vendor’s technical response.
However, a reconciliation of the contractor’s revenue and expense statement (annual report of
target costs) and Fleet Focus was not conducted as required within the RFP.
The Fleet Services Division has not required the vendor to prepare a reconciliation between the
annual target cost report and Fleet Focus. Without the annual reconciliation of target costs,
City staff cannot determine if the City is receiving services equal to the value of the contract
pricing and cannot determine if refunds should have resulted from target cost under-runs.
Prior audit reports released by the City Auditor’s Office on December 15, 2006 and March 14,
2008 make reference to this reconciliation weakness. These prior audit findings are included
as Exhibit III and Exhibit IV of this report.
Recommendation:
The Director of Public Works and Transportation should require that the vendor submit a
reconciliation of the contractor’s annual report of target costs to Fleet Focus, and should
require an explanation of any variances.

Fleet Utilization and Replacement Audit September 20, 2013
13
Management’s Response:
Concur. The City will require the Fleet Maintenance Contractor to immediately begin
capturing all Target Labor information within the limitations of Fleet Focus. If
additional reporting components are required in order to comply with this Audit, Fleet
will make every effort to procure the component with available funding.
The City of Arlington’s Fleet Manager will also require that the vendor reconcile and
report the difference between their revenue and expense statement and Fleet Focus.
Target Date: December 31, 2014
Responsibility: City of Arlington Fleet Manager, G4S Contract Manager and the
Information Technology Department

Fleet Utilization and Replacement Audit September 20, 2013
Exhibit I
Fleet Utilization and Replacement Audit September 20, 2013
Unit # Department/Division Year Make Model Description VE1370 Fire - Emergency Management 2009 CHEV C3500 1 TON CREW CAB 1.5
1369 Fire - Emergency Management 2009 CHEV C3500 1 TON CREW CAB 1.5
2985 NS - Code Compliance 2010 FORD F150 1/2 TON EXT CAB 1.4
3025 PW - Storm Water Management 2011 FORD F150 1/2 TON EXT CAB 1.4
2767 PW - Fleet Central Motor Pool 2005 FORD F150 1/2 TON EXT CAB 1.4
2432 Police - Community Services 2001 CHEV ASTRO ASTRO VAN CARGO 1.2
2633 Fire - Medical Operations 2003 DODGE NEON COMPACT 1.0
2929 PW - Construction Management2011 FORD RANGER COMPACT EXT CAB PKUP 1.2
2931 PW - Construction Management2011 FORD RANGER COMPACT EXT CAB PKUP 1.2
2930 PW - Construction Management2011 FORD RANGER COMPACT EXT CAB PKUP 1.2
2668 Water - Engineering 2004 FORD EXPLORER EXPLORER 4 X 4 1.6
2669 Water - Laboratory 2004 FORD EXPLORER EXPLORER 4 X 4 1.6
2437 IT - Technology Services Maintenance2001 FORD F250 FLEETSIDE 3/4 TON CNG 1.4
3029 Parks - Asset Management 2011 CHEV C2500 FLEETSIDE 3/4 TON 1.4
2764 Fire - T raining 2005 FORD F150 FLEETSIDE 1/2 T 1.2
2917 NS - Code Compliance 2010 FORD F150 FLEETSIDE 1/2 T 1.2
2920 NS - Code Compliance 2010 FORD F150 FLEETSIDE 1/2 T 1.2
2709 NS - Code Compliance 2007 CHEV C1500 FLEETSIDE 1/2 T 1.2
2083 NS - Code Compliance 2008 CHEV C1500 FLEETSIDE 1/2 T 1.2
2994 PW - Fleet Shop Motor Pool 2010 FORD F150 FLEETSIDE 1/2 T 1.4
3032 PW - Traffic Engineering 2011 FORD F150 FLEETSIDE 1/2 T 1.4
2675 PW - Facility Services Custodial 2004 CHEV C1500 FLEETSIDE 1/2 T 1.2
2921 PW - Facility Repair & Renovation2010 FORD F150 FLEETSIDE 1/2 T 1.2
2997 PW - Facility Repair & Renovation2011 FORD F150 FLEETSIDE 1/2 T 1.4
2730 Water - T reatment Operations 2005 FORD F150 FLEETSIDE 1/2 T 1.2
2466 Water - T reatment Maintenance2001 FORD F150 FLEETSIDE 1/2 T 1.2
2787 C D & P - Inspections 2005 TOYOTA PRIUS HYBRID SEDAN 1.0
2786 C D & P - Environmental Health 2005 TOYOTA PRIUS HYBRID SEDAN 1.0
2785 C D & P - Environmental Health 2005 TOYOTA PRIUS HYBRID SEDAN 1.0
2784 IT - Network Support 2005 TOYOTA PRIUS HYBRID SEDAN 1.0
2789 Police - Community Services 2005 TOYOTA PRIUS HYBRID SEDAN 1.0
3045 PW - Fleet Central Motor Pool 2011 FORD FUSION HYBRID SEDAN 1.0
3046 PW - Fleet Central Motor Pool 2011 FORD FUSION HYBRID SEDAN 1.0
2896 PW - UMTA Operations - Handitran2008 FORD ESCAPE HYBRID SEDAN 1.4
2390 Fire - Prevention 2000 FORD TAURUS SEDAN MID SIZE 1.0
3024 Fire - Prevention 2011 FORD FUSION SEDAN MID SIZE 1.0
2392 Police - Business Services 2000 FORD TAURUS SEDAN MID SIZE 1.0
2601 Police - Business Services 2002 FORD TAURUS SEDAN MID SIZE 1.0
2393 Police - Business Services 2000 FORD TAURUS SEDAN MID SIZE 1.0
2604 Police - East Division 2002 FORD TAURUS SEDAN MID SIZE 1.0
2596 Police - Personnel 2002 FORD TAURUS SEDAN MID SIZE 1.0
2597 Police - South Division 2002 FORD TAURUS SEDAN MID SIZE 1.0
2591 Police - South Division 2002 FORD TAURUS SEDAN MID SIZE 1.0
3052 Police - Investigations 2011 FORD FUSION SEDAN MID SIZE C 1.0
3053 Police - North Division 2011 FORD FUSION SEDAN MID SIZE C 1.0
3051 Police - Technical Services 2011 FORD FUSION SEDAN MID SIZE C 1.0
1703 Police - Operations Support 2010 FREIT M2106 TRK BOX VAN 25500 GVW 4.0
1702 Water - South Field Operations 2010 FORD F550 TRK CREWCAB W/MAINT BODY 3.0
1701 Water - North Field Operations 2010 FORD F550 TRK CREWCAB W/MAINT BODY 3.0
1324 Fire - Resource Management 2000 FORD F450 TRK STAKE W/LIFT GATE 1.8
1795 Water - Engineering 1996 CHEV TAHOE TRK TAHOE SUV 4 X 4 1.6
2963 Parks - Asset Management 2011 CHEV C2500 UTILITY 3/4 T 1.4
1984 Water - T reatment Maintenance2007 FORD F250 UTILITY 3/4 T 1.4
1985 Water - T reatment Maintenance2007 FORD F250 UTILITY 3/4 T 1.4
1929 Fire - Medical Operations 1997 CHEV G1500 VAN CARGO 1.3
2082 Police - South Division 1998 FORD E-250 VAN CARGO 3/4 TON 1.3
3037 Parks - Eunice Recreation Center2011 FORD E350 VAN PASSENGER 12 1.3
2781 Parks - Dottie Lynn Recreation Center2006 FORD E-350 VAN PASSENGER 12 1.3
TICK
Department chooses to maintain due to Operational Necessity
Department chooses to maintain due to necessary Emergency Response
Additional Underutilized Vehicles
EXPLANATION

Fleet Utilization and Replacement Audit September 20, 2013
Exhibit II

Fleet Utilization and Replacement Audit September 20, 2013
Unit # Department or Division Year Make Model Description VE
1691 PW - Street Maint (GF) 2006 ASI AZ500 ASPHALT ZIPPER 2.8
1923 PW - Street Maint (Tax) 2007 KOMAT WB147 BACKHOE / LOADER 4WD 3.5
2473 Water - S Field Ops 2001 JCB 214E BACKHOE / LOADER 3.5
2742 Water - S Field Ops 2005 KOMAT WB140-2N BACKHOE / LOADER 3.5
2743 Water - S Field Ops 2005 KOMAT WB140-2N BACKHOE / LOADER 3.5
2744 Water - S Field Ops 2005 KOMAT WB140-2N BACKHOE / LOADER 3.5
2745 Water - S Field Ops 2005 KOMAT WB140-2N BACKHOE / LOADER 3.5
2472 Water - I/I Field Ops 2001 JCB 214E BACKHOE / LOADER 3.5
2468 Water - N Field Ops 2001 JCB 214E BACKHOE / LOADER 3.5
2469 Water - N Field Ops 2001 JCB 214E BACKHOE / LOADER 3.5
2470 Water - N Field Ops 2001 JCB 214E BACKHOE / LOADER 3.5
2471 Water - N Field Ops 2001 JCB 214E BACKHOE / LOADER 3.5
2510 PW - Storm Water Mgmt. 2008 MENZI A91 EXCAVATOR WALKING 4.0
2336 PW - Traffic Signals 2000 KOMAT FG25SHT-12 FORK LIFT 5000 LB PROPANE 1.5
2101 PW - Fleet Line Shop 1970 CLARK IT40 FORK LIFT GAS 4K 1.5
2194 PW - Storm Water Mgmt. 1999 DEERE 444H LOADER 2.5 YD 4 IN 1 4.0
3124 Water - N Field Ops 2012 CTRPL 924K LOADER 3.1 YD 4.0
2973 PW - Storm Water Mgmt. 2011 BOBCAT S70 LOADER SKID STEER 2.0
2195 PW - Street Maint (Tax) 1999 DEERE 260 LOADER SKID STEER 2.0
1921 PW - Storm Water Mgmt. 2007 KOMAT SK820 LOADER SKID STEER 2.0
2640 Water - S Field Ops 2002 DEERE 270 LOADER SKID STEER 2.0
2365 PW - Street Maint (Tax) 2007 HAMM HD12 ROLLER DOUBLE DRUM 3.0
2367 PW - Street Maint (Tax) 2007 HAMM HD12 ROLLER DOUBLE DRUM 3.0
2368 PW - Street Maint (Tax) 2007 HAMM HD12 ROLLER DOUBLE DRUM 3.0
2366 PW - Street Maint (GF) 2007 HAMM HD12 ROLLER DOUBLE DRUM 3.0
2649 PW - Storm Water Mgmt. 2004 STRLG SC8000 SWEEPER ELGIN EAGLE 6.0
2369 Water - S Field Ops 2009 NVSTR 7400 SBA TANDEM DUMP 4.5
2952 PW - Street Lights 2011 BOBCAT MT52 B TRACKED MINI LOADER 2.0
1561 Water - Treatment Maint. 2008 CHALLENGERMT445B TRACTOR/LOADER 4.0
2188 PW - Traffic Signals 1999 CASE 460 TRENCH-BACKHOE 3.0
2335 PW - Street Maintenance (Tax) 2001 NVSTR 4900 TRK HOOKLIFT 4.0
2004 Water - Meter Maint. 1992 GMC TOP KICK TRK WELDING W/HOIST 3.5
NOTE: Departments indicated that each piece of equipment listed should be retained due to operational necessity.
Additional Underutilized Equipment

Fleet Utilization and Replacement Audit September 20, 2013
Exhibit III

Detailed Audit Findings
1. Annual contract cost reconciliation not submitted by contractor, nor requested for
review by City management.
The City’s bid document requires that at the conclusion of each contract, the contractor submit
an annual summary of target costs in its standard revenue and expense format. Differences
between the contractor’s revenue and expense statement and information extracted from
FleetFocus are to be reconciled by the contractor so the City can judge the reasonableness of the
contractor’s actual expenditures in relation to the target costs bid. If the contractor’s actual
expenditures vary by more than five (5) percent from the target bid, the bid document states that
the City reserves the right to direct the contractor to increase spending and service levels and/or
rebate funds to the City. Our audit results indicated that no such reconciliation was requested by,
nor submitted to, the City. Rather than requiring documented reconciliations, management relied
on physical observations and dialogue with the vendor.
The following chart compares total target costs extracted from FleetFocus to FVS’ total target
costs bid.
Target Costs
$0
$200,000
$400,000
$600,000
$800,000
$1,000,000
$1,200,000
$1,400,000
$1,600,000
$1,800,000
2004 2005 2006
Fiscal Year
FleetFocus
FVS Bid
In 2004, target costs extracted from FleetFocus exceeded FVS’ target costs bid by
approximately $77,000.
In 2005 and 2006, FVS’ target costs bid exceeded the FleetFocus target costs by
approximately $375,000 and $477,000, respectively.
Internal Audit requested and received a copy of FVS’ 2005 revenue and expense statement.
Although management had not deemed the revenue and expense statement necessary, the
statement is required in order to determine whether contract expenditures are reasonable.

Total target costs in the 2005 revenue and expense statement ($1,627,445) agreed with FVS’
target bid amount. However, none of the statement components (labor, parts, subcontracts),
agreed with FleetFocus. Based on the number of target labor hours recorded in FleetFocus in FY
2005, the City paid FVS in excess of $70 per each recorded target labor hour, as shown in the
table below:
Total Fee 1,627,446$
Payroll 852,027$
Parts 463,264
Sub-contract Costs 109,243
Overhead 107,674
Total Expenses 1,532,208
Contribution to Margin 95,238$
Payroll 852,027$
Overhead:
Uniform 11,993$
Solid Waste 5,754
Tools & Equipment 36,555
Travel Expense 10,179
Safety Expense 1,797
Recruit/Hire Expense 1,563
Maintenance, Training, Seminar 3,066
Start Up 34,734
Employee Welfare 1,810
Professional Services 223
Total Overhead 107,674
Payroll and Overhead 959,701$
Labor Hours Recorded in FleetFocus 12,207
Labor Rate per Hour Recorded in FleetFocus 78.62$
Components Included in the FleetFocus Labor Rate
(Excludes Profit)
Analysis of First Vehicle Services Costs
FY 2005
Source: First Vehicle Services FY 2005 Revenue and Expense Statement and FleetFocus data

FVS’ bid response also states that “Non-Target work performed during normal work hours by
our core staff will NOT be billed to the City, until such work extends beyond our normal shop
hours.” Since, City staff was not aware of what comprised FVS’ core staff, the City cannot
determine whether work billed as non-target was performed with excess target capacity. FVS
indicated that other than the City not being billed for non-target work requiring only a small
amount of labor, the City was billed non-target for all non-target services performed.
The following is an example of available cost savings when core staff/target capacity is known.
Target Capacity: 2 FTEs working 8 hours (a total of 16 hours) @ $45.00 per hour
Scenario 1
(Current Practice)
Five target work orders billed at eight labor hours during normal shop
hours
One non-target work order billed at eight labor hours and performed
during normal shop hours.
City’s Cost
fixed target cost - $720.00
$45.00 x 8 hours = 360.00
Total: $1,080.00
Scenario 2
(Known Target Capacity)
Five target work orders billed at eight labor hours during normal shop
hours
One non-target work order billed at eight labor hours and performed
during normal shop hours.
Since the eight non-target hours are within the contractor’s 16-hour
target capacity, they are already accounted for in the City’s fixed
target cost.
The City is in a position to require that the contractor not bill an
additional cost for non-target work performed with excess target
capacity.
The City saves $360.00.
City’s Cost
fixed target cost - $720.00
0.00
Total: $720.00
FleetFocus records indicate that the City’s non-target costs (those that are more unpredictable in
nature and cannot reasonably be estimated in advance) have been on the rise since the fleet
services contract was initiated. In FY 2006, the City budgeted $735,000 for non-target services.
However, approximately $935,000 was expended. Target costs (those preventive in nature)
declined between the first and second year of the contract, but remained more constant in 2006,
as shown in the following chart.

Target vs. Non-Target
$400,000
$600,000
$800,000
$1,000,000
$1,200,000
$1,400,000
$1,600,000
$1,800,000
2004 2005 2006
Year
Am
ou
nt
Non-Target
Target
Source: FleetFocus
FleetFocus records indicate that 2006 non-target charges were categorized as follows:
2006 Non-Target Costs
$0
$50,000
$100,000
$150,000
$200,000
$250,000
$300,000
$350,000
$400,000
1 2 3 4 5 6 7
Accidents (1)
Capital Improvement (2)
Non-Target (3)
Abuse, Neglect,
Carelessness (4)
Extended Life (5)
Physical Damage (6)
New Vehicle Prep &
Decommissioning (7)
Source: Fleet Focus
NOTE: FVS began using more descriptive reason codes in 2006. Prior to descriptive reason codes, non-target
work was classified in a general “non-target” category, as indicated in the chart above.
With non-target costs on the rise and very difficult to estimate, it would be a good business
decision to strengthen controls over the overall management of non-target services. Although
Fleet Services indicated that user departments are briefed on a routine basis, the City’s
management of non-target costs could be improved if maintenance activity reports are provided
to departments on a routine basis, specifically repairs that are related to abuse/neglect, accidents
and physical damage.

Department Heads are more likely to be aware of their department’s share of non-target costs if
they are provided such information. The routine user reports could provide information related
to the amount and types of maintenance costs specifically incurred by their department (abuse,
accidents, etc.), and could place departments in a position to more promptly address problem
areas that could perhaps lower non-target maintenance costs. The departmental user reports may
also help identify erroneous billings to the City.
Recommendation:
The Environmental Services Director should require that, while operating under the existing
contract, FVS prepare and submit an annual reconciliation of target charges that will be reviewed
by the Fleet Contract Administrator for reasonableness.
Management’s Response:
Concur with recommendation. The Environmental Services Director will require that, while
operating under the existing contract, FVS prepare and submit an annual reconciliation of target
charges that will be reviewed by the Fleet Contract Administrator. The annual target charges are
identified as a fixed amount each year by contract. The reconciliation will be compared to the
amount established by the contract for variances.
Target Date: October 2007
Responsibility: Fleet Services Contract Administrator
Recommendation:
The Environmental Services Director should require that the Fleet Contract Administrator
implement analytical procedures to determine if non-target work performed by FVS during
normal shop hours could be re-classified as target work.
Management’s Response:
Concur with recommendation. Analytical procedures to determine if non-target work performed
by FVS during normal shop hours could be reclassified as target work will be developed.
Target Date: March 1, 2007
Responsibility: Fleet Services Contract Administrator
Recommendation:
The Environmental Services Director, in conjunction with the Financial Services Director,
should consider revising future fleet maintenance bid documents to require that bidders report
total labor hours used in the estimated target bid costs. The City should then analyze the labor
information to ensure that the City is not billed additionally for non-target work performed with
excess target capacity.

Management’s Response:
Concur with recommendation. The Environmental Services Director, in conjunction with the
Financial Services Director, will consider revising future fleet maintenance bid documents to
require that bidders report total labor hours used in the estimated target bid costs. The bids
submitted for the current contract were not required to include labor hour estimates, and there is
no requirement in the existing contract with FVS for a specific or minimum number of labor
hours. The contract has the option for one remaining extension for a period of one year, which
will be for FY 2008. When the development of the bid document for future services is
developed, this recommendation will be included.
Target Date: Upon bid on fleet maintenance contract (Spring 2008 anticipated)
Responsibility: Environmental Services Director and Purchasing Supervisor

Fleet Utilization and Replacement Audit September 20, 2013
Exhibit IV