Embed Size (px)
DESCRIPTION
FLEET OPERATIONS STUDY OF FLEET SERVICES DIVISION CITY OF SEATTLE
Citation preview
REPORT ON
FLEET OPERATIONS STUDY
OF
FLEET SERVICES DIVISION
CITY OF SEATTLE
WASHINGTON
JUNE 2008
9 Southward Court Tel: (973) 966-9262Chatham, NJ 07928 Fax: (973) 822-1467 Web Site: www.chathamconsulting.com
June 16, 2008 Mr. Ken Bailey, Project Manager Fleet Services Division Fleets and Facilities Department 700 5th Avenue, Suite 5200 PO Box 94689 Seattle, WA 98124-4689 RE: Fleet Operations Study, Final Report Dear Mr. Bailey: Chatham Consulting, Inc. is pleased to submit this Final Report on the Fleet Operations Study that we conducted for the City of Seattle’s Fleet Services Division. Among our findings, conclusions and recommendations are:
• Fleet customers are generally satisfied with the work performed by Fleet Services, but desire more transparency, especially with regard to costs.
• That the City has codified a dedicated fleet fund is a best practice since it provides
the foundation for recovery of costs directly associated with fleet operating ex-penses and capital expenditures.
• Seattle’s maintenance and repair expenditures per maintenance and repair unit are
comparable to those of the other cities benchmarked.
• In general, we found that regulation compliance in all shops met the intent and spirit of OSHA and WAC regulations for the types of workplaces operated by the City.
• Fleet Services should adopt a vehicle replacement program similar in concept to
the VERP program described in this report.
• Fleet Services should revisit its vehicle specification process to increase the stan-dardization of the fleet. Insufficient standardization adversely affects mechanic productivity, parts warehousing and vehicle acquisition costs.
9 Southward Court E-mail: [email protected] Tel: (973) 966-9262 Chatham, NJ 07928 Web Site: www.chathamconsulting.com Fax: (973) 822-1467
2
• The Fleet Services maintenance and repair staff is shorthanded by about four to five mechanics.
o More attention is needed in completing preventive maintenance in-spections on time.
o The City of Seattle should increase the amount of time allowed for formalized technical training for mechanics and other technicians.
• Fleet Services should establish a mechanic incentive and training program, whe-
reby future compensation is tied in with certification.
• We did find some facility capacity deficits at the Fire Shop, SeaPark and South Service Center facilities. Capacity can be added without constructing new facili-ties by shifting some of the workload from one facility to another, adding a work shift to the Fire Shop, reallocating space, and making some modest physical im-provements.
• Warehousing operations need to be improved through such tactics as: o Analyzing turnover and purpose of warehouse stock to set ordering
and stocking levels, o Parts kitting, and o Planning PM and other definable work in advance and giving the
schedule to Warehousing to prepare parts.
• Fleet Services should improve customer relations and outreach by: o Providing better performance reports and improved customer bills, o Establishing service level agreements, o Establishing an advisory committee of fleet coordinators to discuss on
a regular basis the tactical issues as opposed to the strategic issues that the Fleets Advisory Board discusses, and
o Other outreach methods described in the report.
• Major improvements are needed in fleet fund structure, rate computation, capital recovery analysis and transparency. For example,
o Rates should be designed to recover full costs; i.e., direct, indirect and overhead.
o Capital and operating costs and revenues should be accounted for in separate “funds”.
o The capital “funds” should be divided among individual major de-partment and consolidated smaller departments.
• Fleet Services should select and monitor more measures of performance in order
to improve efficiency.
• Mechanic technical training should be increased to industry standards of 40-80 hour per year in order to keep up with changing vehicle technology and diagnostic tools.
3
We thank you for the opportunity to conduct this study, and the excellent cooperation provided by the City of Seattle, in particular the Fleet Services Division. Should you have any questions on the results of this study, please give me a call. Very truly yours, Sal Bibona President
Chatham Consulting, Inc. i City of Seattle - Fleet Operations Study
EXECUTIVE SUMMARY
INTRODUCTION
The City of Seattle, Washington engaged Chatham Consulting, Inc. to conduct a comprehensive
review of the Fleet Services Division (Fleet Services) of the Fleets and Facilities Department
(FFD). The purpose was to obtain expert assistance to: evaluate current practices, equipment and
facilities; identify and propose appropriate best practices; and, develop an implementation plan
for the resulting recommendations.
Our approach consisted of: personal interviews; physical inspections and work observations;
compilation and analysis of extensive qualitative and quantitative data; MRU vehicle equivalen-
cy analysis; benchmarking survey and analysis; surveys of Fleet Services customers, mechanics,
and other employees; application of study team experience; and the documenting of the findings,
conclusions and recommendations in this report.
OVERALL ASSESSMENT
The City of Seattle has a large and diversified fleet operation involving 4,365 vehicles, equip-
ment and trailer units. Fleet management in Seattle is complicated and sometimes conflicted,
since fleet specification, replacement, and maintenance rests with multiple organizations in the
City.
Nevertheless, we found fully burdened labor rates to be competitive with local vendors and
maintenance and repair expenses comparable to other municipalities which we benchmarked.
Also, Seattle compares favorably to most maintenance and repair service indicators except
downtime and the proportion of work that is scheduled, which we believe are being adversely
affected by a shortage of maintenance and repair personnel and the advanced age of some of the
specialty fleet units. We estimate this shortage to be about four to five (4 to 5) mechanics.
Chatham Consulting, Inc. ii City of Seattle - Fleet Operations Study
Customers seem to be satisfied with the technical competence of the Fleet Services mechanic
workforce. However, they are less satisfied with Fleet Services management and its processes
related to billing, providing spare vehicles, and budgeting.
Despite their concerns about pay, Seattle mechanics were still, as a whole, more satisfied with
their working environment and the supervisors they work for than the mechanics we surveyed
recently from other cities.
RESULTS
Overview of Fleet Operations
The City of Seattle has a large and diversified fleet operation of 4,365 vehicles, equipment and
trailer units, (including 41 vehicles it services from outside agencies). Annual costs are $54.1
million.
Fleet Services is responsible for maintaining all motorized vehicles and equipment used by City
departments. It also manages, specifies, finances and replaces the vehicles of all departments
except the City’s utilities, which manage, finance and replace many of their own vehicles under
Memoranda of Understanding (MOU). As a result, fleet management in Seattle is complicated
and sometimes conflicted, because fleet specification, replacement, and maintenance rest with
multiple organizations.
Fleet Services has a staff of 136 employees and operates five primary maintenance facilities.
FSD also manages a parts warehouse and provides motor pool and refueling services.
Fleet Services operates as an internal service fund and bills customer departments to recover its
expenses. The principal funding mechanism for Fleet Services is its vehicle leasing program,
whereby those customers leasing vehicles from Fleet Services are charged a monthly rate calcu-
lated to recover vehicle depreciation, replacement inflation, routine maintenance, and overhead.
Chatham Consulting, Inc. iii City of Seattle - Fleet Operations Study
Utilities are not charged for replacement of the vehicles they own, but may be charged for certain
overheads depending on the MOU with the utility.
Customer Survey
The customer satisfaction survey we conducted produced responses from 21 employees from 13
departments, including all major fleet users. The customers seemed to be satisfied with the tech-
nical competence of the Fleet Services mechanic workforce. However, they are less satisfied
with Fleet Services management and its processes related to billing, providing spare vehicles,
and budgeting. Also, customers give low marks on the user friendliness of the fleet information
system. While most customers rated chargeback rates as “reasonable,” they tended to not readily
understand the system or how rates were developed. Nor did they feel that the rates were devoid
of cross subsidization. The most frequently cited area of dissatisfaction or needing improvement
was communications by an overwhelming amount. In particular, much of this was focused on
customer relations and communications between Fleet Services management and the depart-
ments.
Supervisor and Crew Chief Survey
Thirteen shop operations supervisors and crew chiefs responded to our survey and represented
each of the Fleet Services’ shops. Some of the findings are:
• The supervisors were nearly unanimous in their opinion that the proper amount of stan-dardization does not exist for the City fleet.
• Supervisors rated the Warehouse between poor and average on how well the Warehouse adds parts to inventory for new in-service equipment or controls of inventory to reduce stockouts of parts.
• While nearly all indicated that they had a good understanding of their customers’ expec-tations, nearly all also indicated that were barriers to effective communications with cus-tomers.
• While most supervisors indicated that the fleet information system provided them with the proper information to manage their operation and work load, they cited improvement was needed in the consistency, accuracy, and timeliness of the data.
• While all of the respondents stated that they use “Performance Measures” to monitor and manage the performance of their shop operation, most of these measures are qualitative in nature and may vary by supervisor.
Chatham Consulting, Inc. iv City of Seattle - Fleet Operations Study
• Sixty percent (60%) of the respondents thought there were areas where work standards could be used to plan and evaluate shop performance.
• Most supervisors responded that they could plan as far as needed for preventive mainten-ance services and capitalization work, but only day-to-day for repair work.
• Eighty two percent (82%) reported that they periodically compared the costs of their op-erations to those available from an outside commercial supplier
• The respondents were split sixty percent (60%) “Yes” and forty percent (40%) “No” on whether employees received the proper amount of training. They felt that more training is needed on using the laptop and scan tools to diagnose repair needs.
• Only one half of the respondents believed that mechanic certification would be beneficial to their organization. This tepid reaction seems due to the belief that certification also needs to be coupled with pay increases for certifications.
• Nearly eighty percent of the supervisors believed that they needed more mechanics for their respective shops. Collectively, this need totaled between 8 and 11 mechanics.
Mechanic Survey
We received an excellent response rate to our survey of Fleet Services mechanics. Seventy-three
mechanics submitted completed questionnaires containing over 150 comments and suggestions
for improvement.
Despite their concerns about pay, Seattle mechanics were still, as a whole, more satisfied with
their working environment and the supervisors they work for than the mechanics we surveyed
recently from other cities. Nevertheless, Seattle mechanics had lower satisfaction levels with
their compensation and benefits than mechanics of other government fleets we have surveyed.
The mechanics gave their highest scores to working for a supervisor that they respected, work
area safety, job security, treating employees with respect as individuals. These ratings are higher
than those of other public service fleets we have surveyed. On the other hand, pay, parts availa-
bility, opportunity for advancement, and having enough qualified people in their area to do the
work received the lowest scores.
When asked to describe what changes they would make to improve overall fleet operations, the
mechanics cited: Facilities & Equipment, Parts Operation, and Pay & Benefits most frequently.
Chatham Consulting, Inc. v City of Seattle - Fleet Operations Study
These areas accounted for over one-half of the responses made. Some mechanics were receptive
to incentive pay and certifications.
Warehouser Survey
At the request of Fleet Services, we extended our employee surveys to include the parts Ware-
house. We received six responses, which included all but one Warehouse location.
The warehousers seem to be more positive about their job opportunities than the mechanics did.
The greatest differences were the solving of technical problems, physical work conditions, and
cooperation between employees that the warehousers rated lower than the mechanics did. Con-
versely, the warehousers seemed to have less concerns than the mechanics did about pay. The
most frequently cited area to improve overall fleet operations dealt with management issues.
This was followed by: Communications, Staffing, and Standardization.
Maintenance Shops: Workload and Productivity
MRU analysis measures mechanic demand through maintenance and repair units (MRUs).
These units normalize simple and complex vehicles into a standard measure of workload. From
the data used to calibrate the MRU analysis, we found that Seattle averages fewer or about the
same number of mechanic hours compared to industry averages for about one-half of its vehicle
classes. On the other hand, Seattle appears to average significantly more hours per year for spe-
cialty units like aerial devices and some construction units, which in Seattle tend to be consider-
ably older than the industry average.
Fleet Services targets 1,500 billable hours per mechanic per year, which equate to a 72% utiliza-
tion rate. While Fleet Services mechanics and service personnel average a 74% billable rate, this
rate includes mechanic break times which tends to increase the apparent utilization rate. If the
Fleet Services target of 1,500 hours per year is used, the estimated staff needed would be 70,
which equals the existing staffing level, excluding Metal/Machine, Paint & Body and Capitaliza-
tion shops. In contrast, we customarily assume 65 percent mechanic utilization or 1,352 hours
per year. At this rate, the number of maintenance and repair staff needed would be 78 or about 8
Chatham Consulting, Inc. vi City of Seattle - Fleet Operations Study
more than the existing shop floor staff, excluding Metal/Machine, Paint & Body and Capitaliza-
tion shops.
Benchmarking Results
We benchmarked Seattle to five other municipal fleets in the West. These were comparable in
population size to the City of Seattle, and included: Albuquerque, El Paso, Fort Worth, Long
Beach, and Sacramento. We analyzed comparative information on fleet statistics, management
and operations and other data. In addition, we used MRU analysis to make comparisons among
the fleets of different size and composition. From our survey, we found:
• The respondents had:
o Fleets ranging in size from 3,000 to 4,400 units,
o Fleet departments ranging in size from 41 to 136 employees,
o Performed from 60 percent to 96 percent of work in-house.
• Seattle’s overall fleet department size is about seven (7) percent smaller than the other respondents, when taking into account the size and composition of its fleet in MRU ve-hicle equivalents.
• Seattle’s total maintenance and repair expenses per MRU were close to or below the me-dian values.
• Seattle is unique with its Metal/Machine and Aerial Rebuilding Shops - none of the other cities reported having such operations.
• Given the size of its operation and the diversity of services it performs, the composition of the Fleet Services organization is not unusual.
• Seattle seems to have more in common with the two other west coast cities of Long Beach and Sacramento in performing nearly all capital work in-house.
• Seattle was among the fleets that have a fleet replacement funding mechanism in place – not all cities surveyed have one.
• Nevertheless, Seattle was the only fleet that does not separately account for fleet re-placement and fleet operating funds.
• Seattle’s markups for parts, tires, and fuel are within industry averages.
• Seattle’s markup of vendor repair is higher than average, but is not the highest.
• Seattle’s technical training hours per year were among the lowest.
• All but Seattle have some incentives for mechanics to obtain certification.
• Seattle and Albuquerque were the only two fleets that reported not having service level agreements in place with customers.
Chatham Consulting, Inc. vii City of Seattle - Fleet Operations Study
Performance Analysis
Seattle’s maintenance and repair expenditures per MRU vehicle equivalent are comparable to
other cities benchmarked. Fleet Services also compares favorably to most maintenance and re-
pair service indicators except downtime and the proportion of work that is scheduled. This indi-
cates to us that that more attention is needed in completing preventive maintenance inspections
on time and having sufficient staff to do so.
Fleet age is another factor that influences this outcome since breakdown repairs tend to increase
with the age of the vehicle. This is particularly noticeable for aerial trucks, some cranes and con-
struction equipment, where the Seattle vehicles are generally older and taking more time to
maintain and repair than industry averages.
CONCLUSIONS AND RECOMMENDATIONS
Rate Setting and Replacement Funding
Conclusions
The City has followed best practices by implementing a dedicated fleet fund to track costs direct-
ly associated with fleet operating expenses and capital expenditures. However, major improve-
ments are needed in fund structure, rate computation, capital recovery analysis and transparency.
Exacerbating the situation are the following factors:
• Fleet Services is a large and complex organization that provides a multitude of services for a very large city fleet.
• Its customers have diverse needs, expectations and relationships with the Division.
• The existing methodologies for computing chargebacks are quite complex and not clearly understood by the customer base.
• Replacement funds are comingled with operating funds making it more difficult to easily determine how much money is actually available to meet future replacement needs.
• Existing rates are under recovering current fleet maintenance expenses, and may be under recovering projected capital requirements.
• A lack of transparency, although unintended, in rate development and funding creates:
o Doubt among customers on whether there are sufficient funds to replace their ve-hicles when due; and,
Chatham Consulting, Inc. viii City of Seattle - Fleet Operations Study
o Suspicion that their payments may be cross subsidizing other fleet operations.
• Furthermore, this lack unnecessarily increases the challenge for Fleet Services (or any fleet department for that matter) to justify the size of its fund balance and allay concerns of the fund being “raided” to serve other City, albeit, worthy needs.
These challenges can be mitigated by adopting the rate setting and fund management strategies
described below.
Recommendations
• Fleet Services should adopt activity based concepts in estimating future charge back rates.
• Rates should be designed to recover full costs; i.e., direct, indirect and overhead.
• Maintenance and repair rates should not be used to lower cash reserves in the Fleet sub fund account.
• The org cost accounts should be used to establish separate “funds” for capital and operat-ing costs.
• The capital “funds” should be divided among individual major department and consoli-dated smaller departments.
• An annual status report should be provided to the fleet customers on the amount of reve-nues collected, expenditures made, and reserves on hand in their respective accounts.
• Fleet Services should adopt a vehicle replacement program similar in concept to the VERP program described in this report.
• Also, the planning horizon to compute replacement rates should be extended to ten years from the five years presently used, except for fire tucks which should use a fifteen year forecast period.
Staffing
Conclusions
Compared to other large city fleet operations, the overall size of the Fleet Services fleet organiza-
tion is slightly smaller per MRU vehicle equivalent. However, the amount of personnel and fa-
cility resources that Fleet Services has in specialty shop operations like Paint & Body, Met-
al/Machine and Capitalization are significantly greater than other fleets surveyed for this study.
Furthermore, none of the other city fleets surveyed performs aerial device rebuilding in-house
like Fleet Services does. Detailed MRU analysis revealed that Fleet Services is shorthanded by
four to five (4 to 5) mechanics for maintenance and repair work.
Chatham Consulting, Inc. ix City of Seattle - Fleet Operations Study
Recommendations
• Fleet Services needs to reconsider the 1,500 hours per year it uses as a target to estimate mechanic requirements. This rate may be unrealistic. Instead, a more realistic target would be 1,350 hours (65 percent) or possibly 1,450 hours (70 percent productivity).
• Fleet Services should increase its maintenance and repair staff by four to five (4 to 5) me-chanics.
• Also, Fleet Services should apply the results of the MRU and origin/destination analysis of this study to insure that staffing remains balanced to workload by shop.
Work Priority and Scheduling
Conclusions
Work scheduling practices need to be improved. Challenging factors include: many facilities per-
forming work on vehicles based at other shops; and, significant amounts of capitalization work
are done at facilities other than the Capitalization shop. Templates have been proved in this re-
port to assist Fleet Services in improving work scheduling.
Recommendations
• Fleet Services should improve its work scheduling practices, using the templates included in this report as a guide.
• Closer attention should be paid to the amount of a facility’s work that is generated from vehicles assigned to other Fleet Services shops in the system.
Performance Measurement
Conclusions
While Fleet Services collects some fleet performance data, these data need to be to tracked and
plotted periodically so that any changes in performance levels can be spotted more easily. We
suggest additional performance measures to track. Furthermore, we note from the supervisor sur-
vey that improvement was needed in the consistency, accuracy, and timeliness of the data being
used in existing performance measurement efforts.
Chatham Consulting, Inc. x City of Seattle - Fleet Operations Study
Recommendations
• Fleet Services should increase the number of performance indicators its measures, espe-cially the numbers of preventive maintenance no shows and the amount of turn-around time by vehicle class, shop and department.
• Fleet Services should also consider developing a quarterly profit and loss statement by shop.
• Performance reports should be prepared for each shop and the division as a whole to faci-litate trending through time.
Vehicle Specification
Conclusions
Based on our field observations and results from our surveys of customers, shop supervisors and
mechanics, we conclude that vehicle specifications should be reviewed and standardization of
the fleet should be increased.
Recommendations
• Fleet Services should revisit its vehicle specification process to increase the standardiza-tion of the fleet. Insufficient standardization adversely affects mechanic productivity, parts warehousing and vehicle acquisition costs.
• Similarly, vehicle specifications should be written to provide a more cost efficient unit.
Specialty Unit Life Cycle Analysis
Conclusions
Seattle averages significantly more hours to maintain and repair specialty equipment like aerial
devices and digger derrick trucks, when compared to industry averages. However, the ages of
these units are significantly greater than average as well.
Recommendations
• Fleet Services needs to update the life cycle cost analysis of specialty equipment like bucket trucks, digger derricks and cranes.
• The results should be shared with City Light so that they can reevaluate their vehicle re-placement and funding practices. Aged units adversely affect not only Fleet Services’ mechanic productivity, but also City’s Light’s cost for maintenance, repair and down-time.
Chatham Consulting, Inc. xi City of Seattle - Fleet Operations Study
Cost of Service Analysis
Conclusions
We conducted a detailed analysis of the major labor, materials, facilities and support costs for
Fleet Services business processes. We also provided templates for evaluating when to use over-
time, rely on outside vendors and/or expand capacity.
From our analyses we found most, if not all, of the aerial rebuild activity is not cost effective
when taking into account the total costs to perform this work, including that of vehicle down-
time. While we recognize that the Metal/Machine Shop services not only vehicles but facility
machinery, it is only fair to question the cost effectiveness of this shop activity. Similarly, ve-
hicle upfitting costs should be compared to obtaining vehicles already upfitted by automotive
dealers. In particular, the cost of outfitting patrol cars and time needed to place them in service
should be compared to what can be obtained by competitive bids.
Recommendations
• Fleet Services should issue request-for-quotations for the following services:
o Aerial device rebuilding,
o Vehicle capitalization/upfitting work,
o Metal/Machine work, and
o Tire service.
• The quotations should include not only pricing but process times as well.
• Furthermore, alternative procurement strategies should be pursued such as acquiring ve-hicles on a turnkey basis, whereby the vendor supplies the vehicle already upfitted.
Outsourcing versus Overtime
Conclusions
Paying overtime and outsourcing certain tasks can be used as an effective management tool to
meet peak or specialty work needs in the short run. Meeting longer term needs requires addition-
al economic analysis.
Chatham Consulting, Inc. xii City of Seattle - Fleet Operations Study
Recommendations
• We suggest that Fleet Services adapt the templates in this report to assist in making deci-sions regarding the use of overtime and outsourcing to meet peak or specialty needs.
• Long term considerations, such as constructing a new maintenance facility to provide ad-ditional capacity or take on additional work, should be evaluated using internal rate of re-turn analysis (or equivalent), as described in this report.
Facilities Assessment
Conclusions
In general, we found that regulation compliance in all shops met the intent and spirit of OSHA
and WAC regulations for the types of workplaces operated by the City. Shop cleanliness and
housekeeping in general are commendable. We did find some capacity deficits at the Fire Shop,
SeaPark and South Service Center facilities. Capacity can be added without constructing new
facilities by shifting some of the workload from one facility to another, adding a work shift to the
Fire Shop, reallocating space and making some modest physical improvements.
Recommendations
• There appears to be some capacity deficits at the Fire Shop, SeaPark and South Service Center facilities.
• Capacity can be added without constructing new facilities by:
o Shifting some of the workload from one facility to another,
o Adding a work shift to the Fire Shop, and
o Reallocating existing space,
• Also, capacity and efficiency can be improved by adding some additional resources, such as:
o A heavy-duty lift for the Cedar Falls shop,
o Several computers for the Charles Street Truck Shop,
o Up-to-date scanning tools for vehicle and equipment diagnosis,
o Up-to-date subscriptions for on-line service manuals,
o Improved lighting at the Fire Garage,
o Sun screen shades for the west side of the Charles Street Shop, and
o Security fencing at the Haller Lake shop.
Chatham Consulting, Inc. xiii City of Seattle - Fleet Operations Study
• To accommodate future changes in fleet size and their impact on facility requirements, Fleet Services should develop a strategic facility plan.
Warehousing Operations
Conclusions
Some Fleet Services warehouses (Haller Lake, Fire Shop and South Service Center) lack space
to increase the number of parts in stock if there is a significant increase in size or mix of the
fleet. While each of these locations was generally clean, we observed at several locations evi-
dence of clutter and parts in the aisle ways. Also, we found:
• Most of the warehouses lack any area for expansion, but material flow is consistent with industry practice, except at Haller Lake were receiving and issuing are from the same counter location.
• The City inventory carrying cost falls within the range found at other maintenance and repair warehouses.
• More than 16 percent of parts had an inaccurate count, which is outside typical levels.
• The inventory variance rate of 10 percent is also higher than typical levels.
• The Warehousing function lacks defined performance measures.
• The help function in the FleetAnywhere system cannot be activated by Warehouse per-sonnel when they are using the program.
• Fleet Services lacks any planning on the parts needed for stock for preventive or predic-tive maintenance.
• Warehousers have good understanding of warehousing philosophies, but some lack actual parts knowledge.
• Fuel control is a very time consuming part of the warehousing duties, and takes away from their core duties.
• The large tire and wheel inventory in the Tire and adjacent Fire shop could be larger than necessary. It could be more cost effective to rely on inventories of local tire suppliers.
Recommendations
• Develop and use the ABC analysis technique of stock items to segregate low moving (emergency) parts so a true inventory turnover rate can be identified.
• Begin kitting parts for preventive maintenance and other scheduled work where it is feas-ible.
• Review existing inventory to ensure that the correct parts and quantities are being stocked, to increase the turns per year and reduce the total inventory on hand.
Chatham Consulting, Inc. xiv City of Seattle - Fleet Operations Study
• Identify parts that are needed for predictive maintenance and establish a timeline for add-ing these to stock.
• Start planning PM and other definable work in advance and give the schedule to Ware-housing for part kitting.
• Collect additional data for performance measures such as inventory accuracy rate, inven-tory variance rate and inventory stockout rate.
• Identify parts for stock at the time of new vehicle delivery. This should include items immediately needed, and items for predictive maintenance in the future.
• Make the help screens for Fleet Anywhere available while in the system.
• Have Warehousers take the ASE Parts Specialist series to improve their knowledge of parts to compliment their knowledge of warehousing procedures.
• The duties and reporting structure for the fuels control personnel should be clarified.
• A study should be done to determine the number and sizes of tires and wheels to be stored by the City. It may be possible to cost-effectively reduce tire inventory in the Tire Shop to a level that would provide tires for immediate use and rely on inventory main-tained at tire suppliers.
Employee Relations and Development
Conclusions
Despite their concerns about pay, Seattle mechanics were still, as a whole, were more satisfied
with their working environment and the supervisors they work for than the mechanics we sur-
veyed recently from other cities. Nevertheless, Seattle mechanics had lower satisfaction levels
with their compensation and benefits than mechanics of other government fleets surveyed. The
mechanics and their supervisors seemed receptive to certification provided it was tied into incen-
tives compensation.
Recommendations
• Establish a mechanic incentive and training program, whereby future compensation is tied in with certification. We recommend the sequence of testing and progression devel-oped by the Institute for Automotive Service Excellence (ASE). Other recognized indus-try standards can also be required in addition to ASE certification.
• Individual functions within the Fleet Services Division may elect certain series of certifi-cations relevant to their particular needs, but should at a minimum require basic entry level competence or certification completion.
• We recommend that the City of Seattle dedicate about two weeks of formalized techni-cian training per year, in line with industry standards.
Chatham Consulting, Inc. xv City of Seattle - Fleet Operations Study
• Finally, management leadership is the key to the success of any incentive or performance improvement program. Accordingly, the committee that is searching for a replacement to the recently retired Fleet Services Director should look for candidates possessing leader-ship qualities such as:
o A clear vision for Fleet Services,
o Being unequivocally committed to that vision,
o Ability to communicate that vision effectively to all employees,
o Commitment to and total rapport with people that serve in the division, and
o Basic management skills.
Customer Relations and Outreach
Conclusions
Customer relations and communications need to be improved. While most customers seem to be
satisfied with the technical competence of the Fleet Services mechanic workforce, they are less
so regarding Fleet Services management and its processes related to: billing, rate systems, fund
balances, spare vehicles, and budgeting. Furthermore, customers cited communications most fre-
quently as the area needing improvement, not only between them and Fleet Services manage-
ment, but also within the administrative levels of Fleet Services itself. This was corroborated
when nearly all of the shop supervisors and crew chiefs we surveyed indicated that that were bar-
riers to effective communications with customers.
Recommendations
Fleet Services should also improve customer relations and outreach by:
• Periodically reporting to them certain performance data involving:
o Number of preventative maintenance (PM) appointments scheduled and com-pleted.
o Number of PM no shows.
o Number and percent of work orders completed on time.
o Vehicle turn-around time report showing number of repairs completed within 24 hours, 24 to 48 hours and more than 48 hours.
o Vehicle downtime report showing percentage of time vehicles and equipment are available to the user.
o Number of road calls per month.
Chatham Consulting, Inc. xvi City of Seattle - Fleet Operations Study
• Summarizing charges per cost center each month, distinguishing between Fleet Adminis-trative fees, maintenance and repair, vehicle replacements, fuel charges, accidents, and capitalization charges.
• Distributing newsletters.
• Holding annual open house events.
• Sponsoring Customer Appreciation Days.
• Sponsoring contests and recognition programs for vehicle operators that best take care of their equipment.
• Increasing vehicle operator training through qualified vendor representatives.
• Conducting periodic customer satisfaction surveys.
• Establishing service level agreements with major customers, using the guidelines de-scribed in this report.
• Establishing an advisory committee of fleet coordinators to discuss on a regular basis the tactical issues as opposed to the strategic issues that the Fleets Advisory Board discusses.
Chatham Consulting, Inc. xvii City of Seattle - Fleet Operations Study
CONTENTS
LETTER OF TRANSMITTAL………………………………………………………………. 1 EXECUTIVE SUMMARY Introduction………….………………………………………………………………... i Overall Assessment…………………………………………………………………… i Results....………………..………….…………………………………………………. ii Conclusions and Recommendations………….………………………………………. vii CONTENTS…………………………………………………………………………………... xvii I. INTRODUCTION Background……………….………………………………………………………….. 1 Objectives…………………………………………………………………………….. 2 Approach……………………………………………………………………………… 2 Organization of Report……………………………………………………………...... 3 II. FLEET OPERATIONS OVERVIEW The Fleet. …………………………………………………………………………….. 6 Fleet Responsibilities and Organization………………………...……………………. 7 Funding Fleet Services………………………………………………………………... 13 Information Technology....…….……………………………………………………... 17 III. CUSTOMER SURVEY Background………………………….………………………………………………. 18 Ratings of Fleet Services Division and Shops………………………………………... 19 Comparisons To Outside Vendors……………………………………………………. 21 Comments On Ratings and Comparisons…………………………………………….. 21 Vehicle Suitability and Condition Rating…………………………………………….. 22 Fleet Information System Rating……………………………………………………... 22 Chargeback System Rating…………………………………………………………… 23 Any Significant Changes Noted……………………………………………………… 24 Suggestions for Improvement……………………………………………………........ 25 IV. SUPERVISORS AND CREW CHIEFS SURVEY Background………………………….………………………………………………. 26 Warehouse Ratings…………………………………………………………………… 26 Customer Relations……………………………………………………………............ 27 Performance Measurement…………………………………………………………… 28 Mechanic Training and Development………………………………………………… 30 Organizational Issues…………………………………………………………………. 31 Standardization…………………………………………………………….................. 33 Additional Comments……………………………………………………………….... 34
Chatham Consulting, Inc. xviii City of Seattle - Fleet Operations Study
V. MECHANIC SURVEY Background………………………….………………………………………………. 35 Ratings………………………………………………………………………………... 35 Suggestions For Improvement………………………………………………………... 37 Other Comments and Opinions……………………………………………………….. 39 VI. WAREHOUSER SURVEY Background………………………….………………………………………………... 41 Ratings………………………………………………………………………………... 41 Suggestions For Improvement and Other Comments………………………………... 42 VII. MRU AND WORKLOAD ANALYSIS MRU Concepts……………………………………………………………………….. 43 Work Order Analysis and Comparisons……………………………………………… 46 MRU Results For Seattle……………………………………………………………... 47 Resource Requirements………………………………………………………………. 49 VIII. BENCHMARKING SURVEY RESULTS Approach……………………………………………………………………………… 55 Fleet Operations……………………………………………………………………..... 56 Maintenance and Repair Expenses…………………………………………………… 61 Asset Management…………………………………………………………………… 62 Financial Management……………………………………………………………….. 63 Parts Management…………………………………………………………………….. 69 Employee Development………………………………………………………………. 70 Performance Measures and Targets………………………………………………….. 71 Customer Communications and Outreach……………………………………………. 72 Improvement Areas…………………………………………………………………… 74 IX. FACILITIES ASSESSMENT Introduction…………………………………………………………………………… 75 Findings………………………………………………………………………………. 75 Recommendations…………………………………………………………………….. 77 Prioritization and Cost Considerations ………………………………………………. 81 Long Term Considerations and Planning…………………………………………….. 81 Detailed Inspection Results By Facility………………………………………………. 82 X. WAREHOUSING OPERATIONS Approach…..……….…………………………………………………………...…….. 102 Existing Operations………………………………………………….……………….. 103 Warehousing and Materials Management Considerations…………………………… 103 Warehouse Layout Efficiency………………………………………………………... 104 Inventory Carrying Costs…………………………………………….………………. 106 On Hand Stocking Levels……….……………………………………………………. 108 Performance Measures and Benchmarking…………………………………………... 111 Policies and Procedures………………………………………..................................... 115
Chatham Consulting, Inc. xix City of Seattle - Fleet Operations Study
Findings………………………………………............................................................. 116 Recommendations……………………………………….............................................. 117 XI. RATE SETTING AND REPLACEMENT FUNDING Background…………………………………................................................................ 119 Fleet Services Sub Fund …………………………………............................................ 120 Establishing Replacement Rates ……...………..………………….............................. 124 Establishing Operating Rates……………...………………………………….............. 127 Template For Rate Development…………………………………............................... 132 Illustrative Rate Computations………………………………….................................. 136 VII. COSTS OF SERVICE ANALYSES Estimated Service Costs………………………………................................................. 139 Aerial Rebuild Activity……………………………….................................................. 141 Tanker Service…………………………....................................................................... 143 Other Activities………………………………............................................................. 143 Outsourcing Versus Overtime Template………………………………....................... 144 Investment Analysis………………………………....................................................... 146 Real World Considerations………………………………............................................ 150 Insourcing Considerations………………………………............................................. 152 XIII. PERFORMANCE MEASURMENT AND REPORTING General Concepts………………………………........................................................... 155 Measuring Fleet Performance………………………………........................................ 157 Performance Definitions and Targets………………………………............................ 161 Assessment of Current Performance and Productivity…..………............................... 163 Periodic Performance Reporting……………………………….................................... 164 XIV. WORK PRIORITY AND SCHEDULNG SYSTEM Establishing Priorities…………………….................................................................... 167 Workload Forecasting………………………................................................................ 168 Workload Units……...……………………………....................................................... 171 XV. EMPLOYEE EDUCATION AND INCENTIVES Mechanic and Supervisor Input………………………………..................................... 172 Seattle Multi-Step System……………………………….............................................. 173 Recent Trends………………………………................................................................ 173 Employee Education Considerations………………………………............................. 176 Incentive Training Program………………………………........................................... 177 Other Considerations………………………………..................................................... 179 XVI. CUSTOMER RELATIONS AND OUTREACH Input From Surveys………………………………........................................................ 180 Fleet Services Policy Manual………………………………......................................... 181 Service Level Agreements………………………………............................................. 183 Customer Performance Metrics………………………………..................................... 185
Chatham Consulting, Inc. xx City of Seattle - Fleet Operations Study
Customer Awareness Program………………………………....................................... 186 Other Outreach Programs……………………………….............................................. 187 XVII. FINDINGS, CONCLUSIONS AND RECOMMENDATIONS Overall Assessment........................................................................................................ 188 Findings………………….............................................................................................. 189 Conclusions and Recommendations………………….................................................. 190 EXHIBITS
1 Organization Chart: Fleet Services Division 2 Table Of Organization: Fleet Services Division 3 Tabulations Of Customer Survey Results 4 Summary of Supervisor and Crew Chief Survey Responses 5 Summary Of Mechanic Survey Responses 6 Summary Of Warehouser Survey Responses 7 Average Hours Per Vehicle Class For 2006 8 Comparison Of Average Hours Per Vehicle Class For 2006 9 Comparison Of Average Ages 10 Comparison Of Annual M&R Hours Versus Age 11 Distribution Of Labor Hours By Shop And Reason 12 Origin Destination Matrix Of Labor Hours: Assigned Location Versus Service Loca-
tion
13 Employee Utilization By Classification For 2006 14 Employee Utilization By Shop And Classification For 2006 15 Estimated MRUs By Assigned Facility Location 16 Capacity Analysis By Facility Location 17 High Level MRU Computations 18 Fleet Department Size By City 19 Maintenance & Repair Cost Ratios 20 Parts Management Data By City 21 Performance Measures Reported Used By City And Fleet Function 22 Areas Most Important To Improve 23 Best Practices Implemented 24 Sample Inventory Carrying Cost Computation At 20% Of Personnel Costs For Ma-
terial Handling
25 Sample Inventory Performance Computations 26 Illustrative Procedure: Parts Kitting, Issuing And Return To Stock 27 Statement Of Revenues, Expenses And Cash Flows 28 Graphs Of Revenues, Net Income And Cash Flows By Department 29 Graphs Of Coefficients Of Variation By Department And Total Fleet 30 Illustrative VERP Input And Output Form 31 Illustrative VERP Graph Of Cash Flows 32 Chargeable Hours And Rates Estimated By FSD For 2004 33 Revenues And Expenditures: Fleet Services Fund A50320: 2006 Year To Date 34 Summary Of Revenues And Expenditures: Fleet Services Fund A50320: 2006 Year
To Date
Chatham Consulting, Inc. xxi City of Seattle - Fleet Operations Study
35 Illustrative Allocations Of Overhead Costs 36 Cost Of Service Allocations 37 Fringe Benefit Rate: 2006 38 Allocation Of A2221 Vehicle Maintenance Expenses Into Activities: 2006 39 Cost Driver Shares 40 Costs Of Aerial Unit Overhauls 41 Estimated Tanker Refueling Costs 42 Data Sheet (Illustrative) 43 Repair Analysis Worksheet (Illustrative) 44 Scheduled Versus Unscheduled Labor Hours For 2006 45 Percent Of Seattle Fleet Work Orders That Are Breakdowns Versus Vehicle Age 46 Monthly Planner 47 Daily Planner 48 ASE Certification Training Programs 49 Illustrative Mechanic Development Program 50 Illustrative Policy & Procedures: Employee Responsibilities For City-Owned Ve-
hicles
Appendix: Sample Service Level Agreements
Fleet Operations Study
Chatham Consulting, Inc. 1
I. INTRODUCTION
BACKGROUND
The City of Seattle, Washington engaged Chatham Consulting, Inc. to conduct a comprehensive
review of the Fleet Services Division (Fleets Services) of the Fleets and Facilities Department.
The purpose was to obtain expert assistance to: evaluate current practices, equipment and
facilities; identify and propose appropriate best practices; and develop an implementation plan
for the resulting recommendations.
Currently, the City has a fleet operation consisting over 4,365 vehicle and mobile equipment
units (including 41 vehicles it services from outside agencies). The fleet is used by various City
departments, its two utilities (Seattle City Light and Seattle Public Utilities), as well as a few
outside government agencies. The Fleet Services Division provides centralized fleet
management, specification, acquisition, fueling and maintenance services for this $54.1 million
per year operation. Fleet Services uses the Maximus FleetFocus/FA software to manage its fleet
maintenance and parts management functions.
Fleet Services has a staff of 136 employees and operates five primary maintenance facilities. It
also manages a warehouse inventory of repair parts and supplies and provides a motor pool
service for the City. The City has partnerships with several bargaining unit organizations
representing Fleet employees.
A 2005 fleet consulting study of some aspects of Fleet Services operations found that service
quality but not service costs were competitive at that time. While challenging the accuracy of
some of the study’s findings, Fleet Services nevertheless reduced the size of its organization in
an attempt to reduce costs. Meanwhile, the City also recognized that performance improvement
is a continuous process and that to move forward it would be helpful to obtain professional
consulting assistance.
Fleet Operations Study
Chatham Consulting, Inc. 2
OBJECTIVES
The City commissioned this study to not only optimize current fleet operations and customer
service responsibilities, but also provide it with the tools, templates and real world strategies so
that the City could sustain these improvements into the future. Accordingly, the City established
the following scope areas, which formed the objectives of this study.
A. Optimize resource allocation, including the management of routine, peak, and specialty work.
B. Maximize employee productivity, including programs for continued employee education,
incentives and performance.
C. Enhance organizational performance metrics, including key performance indicators, methodologies, data, reporting, and possible peer organizations.
D. Optimize warehouse operations, including policies and procedures, on-hand stock
needed, and methodologies for measuring warehouse performance.
E. Evaluate rate-setting methodology and recommend adjustments to rate setting and replacement planning based upon applicable regulations, City financial policies, and industry and accounting best practices.
F. Propose an approach to negotiating individualized service level agreements with Fleets
customers, including core services, specialized services evaluation, changing conditions.
G. Provide a framework for evaluating the costs and benefits of providing additional or expanded services to existing or new customers.
H. Enhance customer relations and outreach, including customer-driven data, reporting,
surveys, and motivation methods.
I. Conduct a facility space needs assessment, addressing their adequacy and barriers to efficient operations.
APPROACH
Our work plan consisted of:
• Conducting over 36 interviews with:
o Management and supervisory personnel in all aspects of Fleet Services’ operation,
o Major customers including Police, Fire, Transportation, both utilities, Parks, and
Fleet Operations Study
Chatham Consulting, Inc. 3
o Other key stake holders including the Fleet Advisory Board, Finance, the Fleets and Facilities Department’s Accounting and Information Systems groups.
• Compiling and analyzing extensive statistical, cost and operational data including work orders, parts transactions and much other detailed data.
• Compiling and reviewing existing fleet policies, procedures, and documents.
• Observing work practices and conducting detailed inspections of all vehicle maintenance, parts and tire supply facilities.
• Conducting a satisfaction survey of Fleet Services customers.
• Conducting employee attitudinal surveys of Fleet Services supervisors, crew chiefs, mechanics, and Warehouse personnel.
• Conducting a benchmarking survey of the fleet operations of other comparable municipalities in the region to develop performance data and information on relevant issues and best practices.
• Analyzing a database of completed work orders from Cascor, Inc. an automated warranty recovery service used by the City and many other utility and government fleets throughout the nation, to support our Maintenance and Repair Unit (MRU) and benchmarking analyses.
• Applying the study team’s subject matter expertise and their collective knowledge of best fleet and general management practices to develop the study’s findings, conclusions and recommendations.
• Documenting the study’s results in this written report.
ORGANIZATION OF REPORT This report is divided into the following chapters: Executive Summary - Summarizes this study's major findings, conclusions and recommendations.
I. Introduction - Outlines the background, objectives and approach of the study and the organization of this report.
II. Fleet Operations Overview - Provides background information on the City fleet operations including their size, composition, administration, facilities, funding and other areas.
III. Customer Survey - Summarizes the results of the customer satisfaction survey of major fleet users, including service quality ratings, comments and suggestions for improvement.
Fleet Operations Study
Chatham Consulting, Inc. 4
IV. Supervisors and Crew Chief Survey - Summarizes the results of our survey of Fleet Services supervisory staff, including their ratings of fleet service delivery, suggestions for improving warehouse operations, customer relations, performance measurement, mechanic training, organization and other areas.
V. Mechanic Survey - Summarizes the results of our attitudinal survey of Fleet Services mechanics, including job and working environment ratings, and their suggestions for improvement.
VI. Warehouser Survey – Summarizes the results of our attitudinal survey of Fleet Services Warehouse personnel, job and working environment ratings and their suggestions for improvement.
VII. MRU and Workload Analysis – Provides a comprehensive explanation and analysis of the MRU (Maintenance and Repair Unit) vehicle equivalency approach and its specific application to Seattle. Also, analyzes workloads in detail, compare Seattle’s performance to industry average, estimates staffing needs and facility capacities for maintenance and repair of the fleet.
VIII. Benchmarking Survey – Provides comparative statistical information on and insights into various fleet management, organizational, financial, performance and customer related issues of other comparable sized municipal fleet operations compared to Seattle. Also, describes improvement areas of concern and recent best practices implemented.
IX. Facilities Assessment – Describes the detailed results of our facility inspections, including their adequacy, layout and equipment lives. Also, identifies barriers to efficiency, mitigation strategies, possible costs, and long term planning considerations.
X. Warehouse Operations – Reviews warehousing facilities, operations, stocking levels, performance, policies and procedures and develops recommendations for improved control and efficiency.
XI. Rate Setting and Replacement Funding – Provides a detailed assessment of the current chargeback approach, recommends updated rate models to recover operating and capital costs and provides best practice information and improved models for fund management.
VII. Cost of Service Analyses – Presents cost of service analyses for key business processes for comparing to outside vendor quotes. Also develops templates and strategies for evaluating options of overtime, outsourcing, insourcing, and expanding capacity.
Fleet Operations Study
Chatham Consulting, Inc. 5
VIII. Performance Measurement and Reporting – Reviews current performance levels; identifies and explains differences from standards; and proposes strategies and specific recommendations to improve shop maintenance operations and work practices.
XIV. Work Priority and Scheduling System – Provides guidance and templates in planning and scheduling work.
XV. Employee Education and Incentives – Presents training and incentive and programs tied in with certification to support staff in achieving performance goals.
XVI. Customer Relations and Outreach - Provides strategies for improving customer communication, motivation and reporting. Also, provides guidance and supporting information in conducting customer surveys and developing service level agreements. XVII. Conclusions and Recommendations - Provides our overall assessment of the Fleet Services Division and develops specific recommendations for areas in need of improvement.
Fleet Operations Study
Chatham Consulting, Inc. 6
II. FLEET OPERATIONS OVERVIEW
THE FLEET
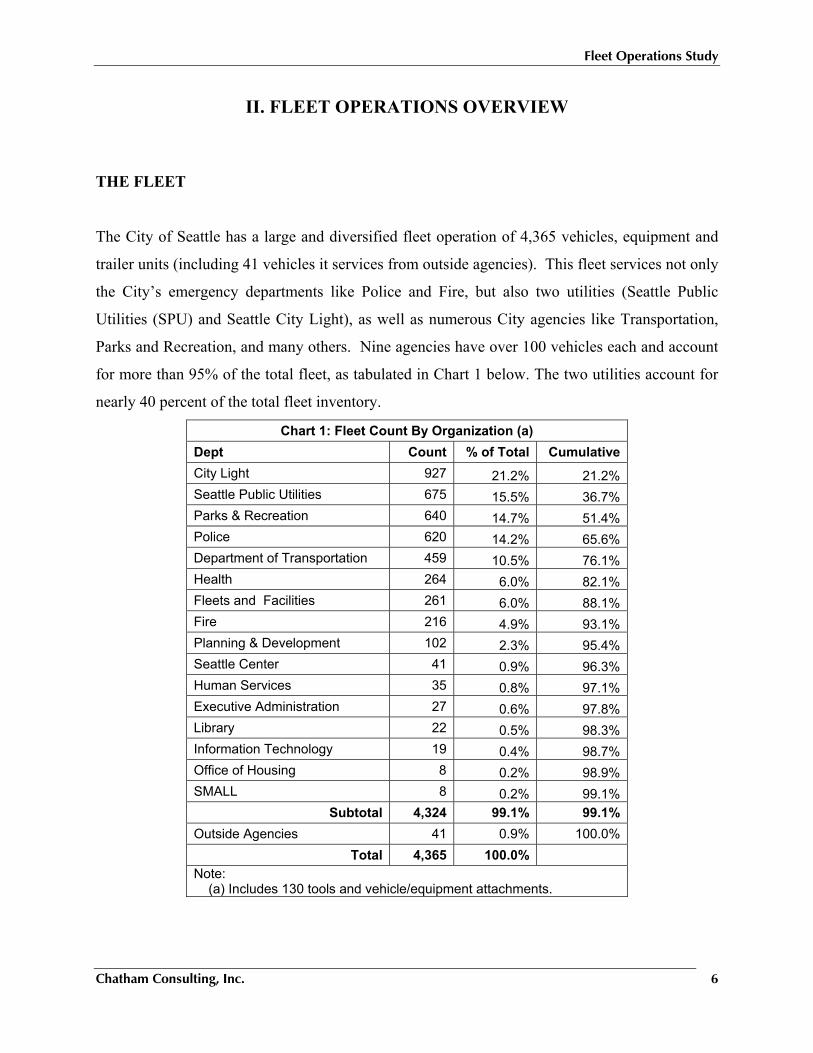
The City of Seattle has a large and diversified fleet operation of 4,365 vehicles, equipment and
trailer units (including 41 vehicles it services from outside agencies). This fleet services not only
the City’s emergency departments like Police and Fire, but also two utilities (Seattle Public
Utilities (SPU) and Seattle City Light), as well as numerous City agencies like Transportation,
Parks and Recreation, and many others. Nine agencies have over 100 vehicles each and account
for more than 95% of the total fleet, as tabulated in Chart 1 below. The two utilities account for
nearly 40 percent of the total fleet inventory.
Chart 1: Fleet Count By Organization (a) Dept Count % of Total Cumulative City Light 927 21.2% 21.2% Seattle Public Utilities 675 15.5% 36.7% Parks & Recreation 640 14.7% 51.4% Police 620 14.2% 65.6% Department of Transportation 459 10.5% 76.1% Health 264 6.0% 82.1% Fleets and Facilities 261 6.0% 88.1% Fire 216 4.9% 93.1% Planning & Development 102 2.3% 95.4% Seattle Center 41 0.9% 96.3% Human Services 35 0.8% 97.1% Executive Administration 27 0.6% 97.8% Library 22 0.5% 98.3% Information Technology 19 0.4% 98.7% Office of Housing 8 0.2% 98.9% SMALL 8 0.2% 99.1%
Subtotal 4,324 99.1% 99.1% Outside Agencies 41 0.9% 100.0%
Total 4,365 100.0% Note: (a) Includes 130 tools and vehicle/equipment attachments.
Fleet Operations Study
Chatham Consulting, Inc. 7
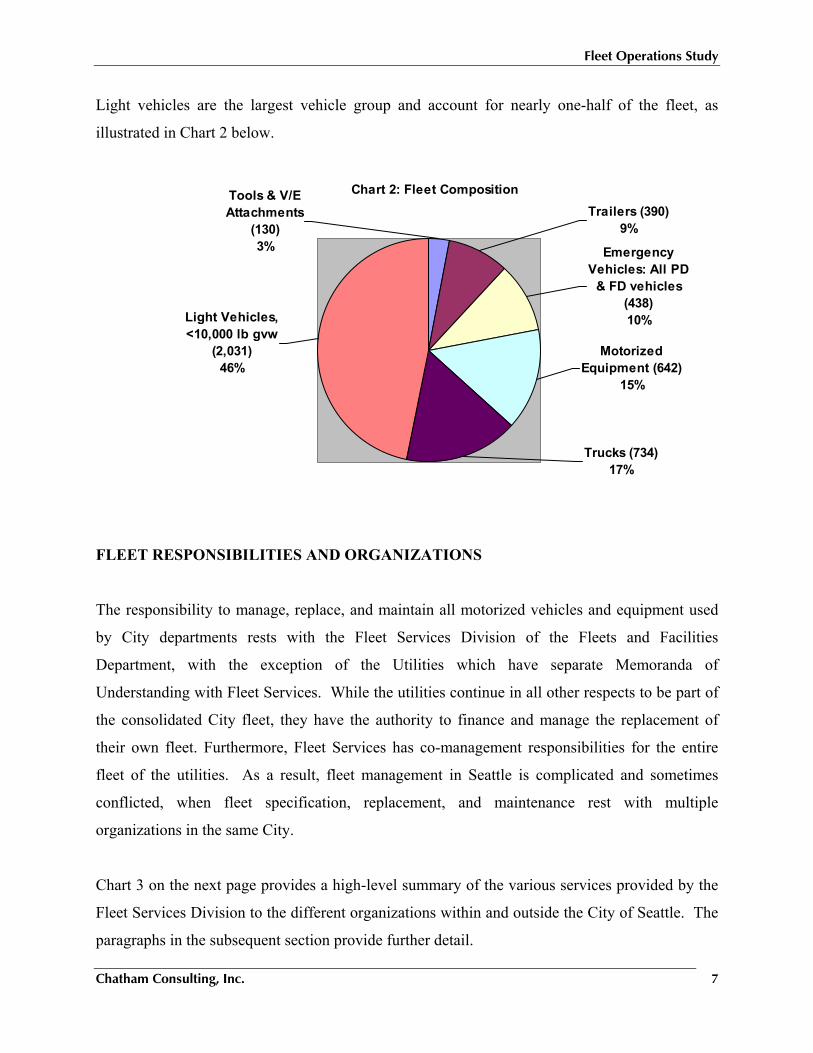
Light vehicles are the largest vehicle group and account for nearly one-half of the fleet, as
illustrated in Chart 2 below.
FLEET RESPONSIBILITIES AND ORGANIZATIONS
The responsibility to manage, replace, and maintain all motorized vehicles and equipment used
by City departments rests with the Fleet Services Division of the Fleets and Facilities
Department, with the exception of the Utilities which have separate Memoranda of
Understanding with Fleet Services. While the utilities continue in all other respects to be part of
the consolidated City fleet, they have the authority to finance and manage the replacement of
their own fleet. Furthermore, Fleet Services has co-management responsibilities for the entire
fleet of the utilities. As a result, fleet management in Seattle is complicated and sometimes
conflicted, when fleet specification, replacement, and maintenance rest with multiple
organizations in the same City.
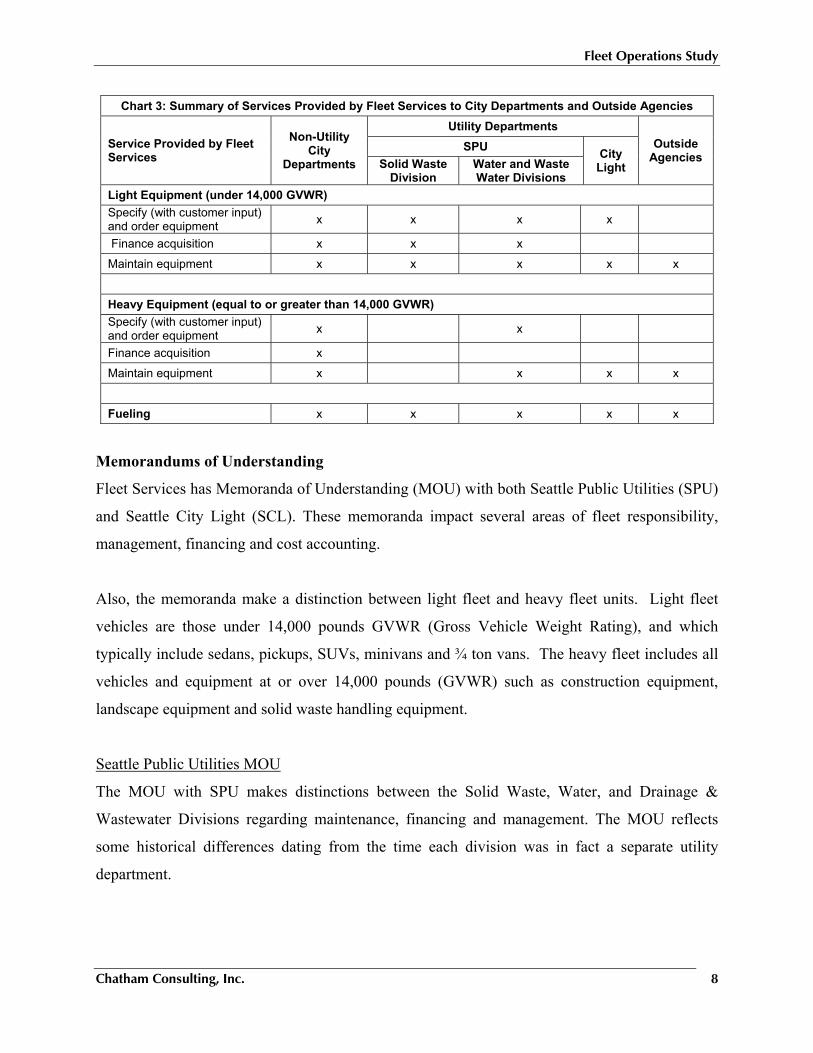
Chart 3 on the next page provides a high-level summary of the various services provided by the
Fleet Services Division to the different organizations within and outside the City of Seattle. The
paragraphs in the subsequent section provide further detail.
Chart 2: Fleet Composition
Light Vehicles, <10,000 lb gvw
(2,031)46%
Motorized Equipment (642)
15%
Tools & V/E Attachments
(130)3% Emergency
Vehicles: All PD & FD vehicles
(438)10%
Trailers (390)9%
Trucks (734)17%
Fleet Operations Study
Chatham Consulting, Inc. 8
Chart 3: Summary of Services Provided by Fleet Services to City Departments and Outside Agencies
Service Provided by Fleet Services
Non-Utility City
Departments
Utility Departments Outside
Agencies SPU City
Light Solid WasteDivision
Water and Waste Water Divisions
Light Equipment (under 14,000 GVWR) Specify (with customer input) and order equipment x x x x
Finance acquisition x x x
Maintain equipment x x x x x
Heavy Equipment (equal to or greater than 14,000 GVWR) Specify (with customer input) and order equipment x x
Finance acquisition x
Maintain equipment x x x x
Fueling x x x x x
Memorandums of Understanding
Fleet Services has Memoranda of Understanding (MOU) with both Seattle Public Utilities (SPU)
and Seattle City Light (SCL). These memoranda impact several areas of fleet responsibility,
management, financing and cost accounting.
Also, the memoranda make a distinction between light fleet and heavy fleet units. Light fleet
vehicles are those under 14,000 pounds GVWR (Gross Vehicle Weight Rating), and which
typically include sedans, pickups, SUVs, minivans and ¾ ton vans. The heavy fleet includes all
vehicles and equipment at or over 14,000 pounds (GVWR) such as construction equipment,
landscape equipment and solid waste handling equipment.
Seattle Public Utilities MOU
The MOU with SPU makes distinctions between the Solid Waste, Water, and Drainage &
Wastewater Divisions regarding maintenance, financing and management. The MOU reflects
some historical differences dating from the time each division was in fact a separate utility
department.
Fleet Operations Study
Chatham Consulting, Inc. 9
The Solid Waste Division has sole responsibility for the acquisition, financing and maintenance
its heavy vehicles and equipment. Meanwhile, the Water and the Drainage & Wastewater
divisions rely on Fleet Services to maintain their heavy vehicle fleets. Nevertheless, the light
vehicles for all SPU divisions are maintained by Fleet Services and are managed exactly like any
other City department.
Fleet Services also provides fleet administration services to the heavy equipment fleet of the
Water and Drainage & Wastewater divisions. It is responsible for ordering but no longer the
financing of replacement and new additions for these heavy units. Fleet Services, upon receipt
and verification to specifications, passes the invoices for such units on to SPU to directly pay the
vendor.
All SPU heavy vehicles purchased before 1999 remain on the books of the Fleets and Facilities
Department until they become fully depreciated. Then, SPU becomes only responsible for
maintenance expenses and overhead charges associated with those vehicles. All heavy vehicles
purchased after December 31, 1998 are paid for, owned, financed and depreciated by SPU.
However, Fleet Services continues to write the specifications for the SPU heavy duty fleet.
For those SPU heavy vehicles purchased before 1999 but which remain on the books of the
Fleets and Facilities Department because they have not been fully depreciated, SPU continues to
pay depreciation but no inflation component. (Maintenance expenses and overhead charges
continue to be paid.) When SPU took over financing of its heavy fleet, it was agreed that SPU
would continue to pay depreciation in lieu of purchase so that Fleet Services would be made
whole on its original investment in the equipment. However, there is no rationale to collect
inflation when Fleet Services no longer has a financial obligation for the replacement unit.
Seattle City Light MOU
The MOU with City Light is similar to one with SPU except for the financing of the light duty
vehicles. All City Light vehicles purchased after December 31, 1998 are paid for, owned,
financed and depreciated by City Light.
Fleet Operations Study
Chatham Consulting, Inc. 10
All light vehicles purchased before 1999 remain on the books of the Fleets and Facilities
Department until they become fully depreciated. Then, City Light becomes only responsible for
maintenance expenses and overhead charges associated with those vehicles.
For those City Light vehicles purchased before 1999 but which remain on the books of the Fleets
and Facilities Department because they have not been fully depreciated, City Light continues to
pay depreciation but no inflation component. There is no rationale to collect inflation when Fleet
Services no longer has a financial obligation for the replacement unit.
All light vehicles purchased after 1999 are procured by Fleet Services on behalf of City Light.
Fleet Services passes the vehicle invoices on to City Light to directly pay the vendor.
Timely Replacement of Vehicles
Both MOUs also stipulate that the Fleets and Facilities Department and the respective utilities
shall work together to replace vehicles in a timely manner. This effort includes:
• Guidelines for determining when SPU or City Light vehicles need replacement,
• Vehicle replacement schedules based on those guidelines,
• Exceptions to the replacement schedule where specific vehicles are determined to have an extended lifecycle based on mutually agreeable criteria, and
• Recognition that not following prescribed vehicle replacement schedules may increase maintenance costs, and therefore the rates that Fleet Services charges for vehicle maintenance.
As a practical matter, this last item became moot when Fleet Services switched to direct billing
of maintenance expense for the SPU and City Light fleets.
Fleets and Facilities Department
The Fleets and Facilities Department was created on January 1, 2001, as part of a reorganization
of City government. The Fleets and Facilities Department has four major operating functions:
Fleet Services, Real Estate Services, Capital Programs, and Facilities Operations. Fleet Services
purchases, maintains, and repairs the City’s vehicles and specialized equipment units, including
Fleet Operations Study
Chatham Consulting, Inc. 11
cars, light trucks, fire apparatus, and heavy equipment. Fleet Services also provides fuel for the
fleet.
Fleet Services Division
Fleet Services is organized as shown in Exhibit 1, and has an employee complement of 136 as
tabulated in Exhibit 2. It is divided into three major areas that parallel the broad array of services
that it provides:
• Shop Operations
• Fleet Administration
• Warehousing
Shop Operations provides not only vehicle maintenance and repair services, but also
capitalization work, aerial device rebuilding and refueling services. In addition, Fleet Services
operates several specialty shops including Paint & Body, Metal & Machine, and Capitalization.
Shop Operations has five primary locations.
• Charles Street Complex – 805 South Charles Street, 814 8th Avenue South, and 815 South Dearborn Street
• South Service Center Facilities – 4th Avenue South at Spokane Street
• Haller Lake Facilities – 128th Street North at Stone Avenue North
• SeaPark garage – 609 6th Avenue at James Street
• Watershed Facilities – Approximately 30 miles east and southeast of Seattle
Fleet Administration provides vehicle specification, procurement, and registration and other
administrative services. These services include: managing the vehicle and motor pool programs;
budgeting and accounting; overseeing the fleet information system; coordinating fleet
environmental issues; and, conducting technical studies.
Warehousing manages the spare parts inventory and procures services from outside vendors.
Warehousing also manages the fueling program. Warehousing operates parts rooms at the Fire
Garage and Main Vehicle Garage at Charles Street, South Service Center and Haller Lake.
Fleet Operations Study
Chatham Consulting, Inc. 12
Charles Street Complex
This complex is a multi-building, multi-use compound just south of the central business district,
used by multiple City departments. Fleet Services operates three vehicle maintenance buildings
here plus a fuel facility. The buildings include the:
• Fire Garage that services fire apparatus, emergency medical vans and small equipment.
• Tire Shop that includes a drive-through vehicle wash bay, vehicle service bays and a large storage area for tires.
• The Main Vehicle Garage that houses the primary maintenance operations of the car shop and truck shops and the capitalization program. Also housed in this facility are the specialty shop operations: Paint & Body, Capitalization (Cap), and Metal/Machine. There is a large parts warehouse located within this facility.
This complex is also the base for one of two diesel tanker trucks providing on-site fuel service
for the fleet.
SeaPark Garage
This facility is in the downtown civic center complex and uses space in a City owned parking
garage. The garage houses the City’s motor pool operations and provides parking for other City
vehicles, City employees and the public. Fleet Services has a small vehicle maintenance
operation that consists of two service bays, a wash area, warehouse, oil storage room, locker
room and restroom.
South Service Center
This facility is within a complex owned and operated by Seattle City Light. The main customer
is City Light and much of the equipment serviced is aerial-lift trucks. All aerial work platform
vehicles have inspections and overhauls conducted at this shop by the specially trained team of
mechanics. Fleet Services’ portion of the facility includes a service area, parts warehouse,
storage, wash/steam room, lathe/workstation and fueling station.
Fleet Operations Study
Chatham Consulting, Inc. 13
Haller Lake
The Haller Lake Complex is located approximately 9 miles north of the central business district.
The compound is shared with Seattle Department of Transportation and Seattle Public Utilities.
The complex includes a fuel station and is the base for the second diesel tanker truck, which
services vehicles in the north end of the City. Haller Lake provides primarily vehicle
maintenance services as well as crane inspection services.
Watershed Facilities
The City has small one to two bay vehicle maintenance shops at the SPU Watershed operations
of: Cedar Falls, Lake Youngs, Duvall and Tolt River. These operations are located from 20 to
more than 30 miles away from Seattle, and services vehicles domiciled in the Watershed areas.
There are two to three traveling mechanics that periodically circuit these facilities.
FUNDING FLEET SERVICES
The Fleet Services Division, as previously noted, provides a wide variety of services to many
clients. As an internal service fund, Fleet Services must bill customer departments to recover its
expenses. The principal funding mechanism for Fleet Services is its vehicle leasing program,
whereby those customers leasing vehicles from Fleet Services are charged a monthly rate
calculated to recover vehicle depreciation, replacement inflation, routine maintenance, and
overhead. (See the Chapter XI: Rate Setting and Replacement Funding for more detailed
information on the funding process.) Fleet Services also charges for other services like motor
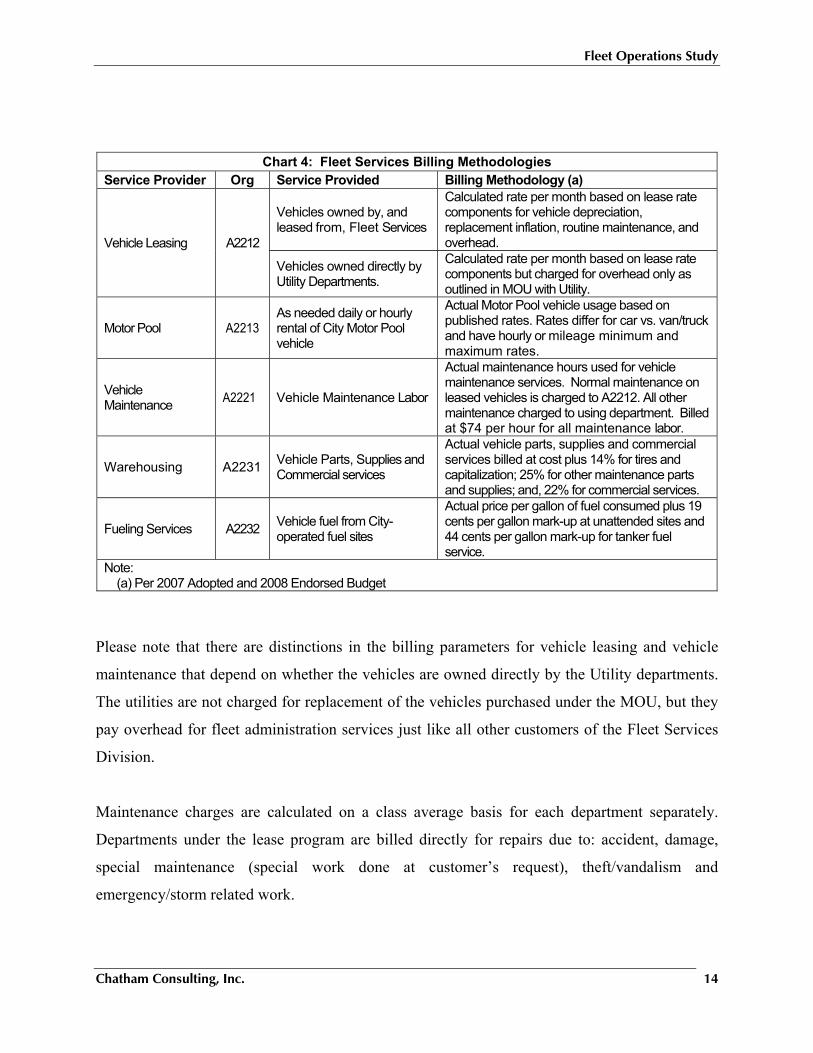
pool and fuel supply services, as highlighted Chart 4 on the next page.
Fleet Operations Study
Chatham Consulting, Inc. 14
Please note that there are distinctions in the billing parameters for vehicle leasing and vehicle
maintenance that depend on whether the vehicles are owned directly by the Utility departments.
The utilities are not charged for replacement of the vehicles purchased under the MOU, but they
pay overhead for fleet administration services just like all other customers of the Fleet Services
Division.
Maintenance charges are calculated on a class average basis for each department separately.
Departments under the lease program are billed directly for repairs due to: accident, damage,
special maintenance (special work done at customer’s request), theft/vandalism and
emergency/storm related work.
Chart 4: Fleet Services Billing Methodologies Service Provider Org Service Provided Billing Methodology (a)
Vehicle Leasing A2212
Vehicles owned by, and leased from, Fleet Services
Calculated rate per month based on lease rate components for vehicle depreciation, replacement inflation, routine maintenance, and overhead.
Vehicles owned directly by Utility Departments.
Calculated rate per month based on lease rate components but charged for overhead only as outlined in MOU with Utility.
Motor Pool A2213 As needed daily or hourly rental of City Motor Pool vehicle
Actual Motor Pool vehicle usage based on published rates. Rates differ for car vs. van/truck and have hourly or mileage minimum and maximum rates.
Vehicle Maintenance A2221 Vehicle Maintenance Labor
Actual maintenance hours used for vehicle maintenance services. Normal maintenance on leased vehicles is charged to A2212. All other maintenance charged to using department. Billed at $74 per hour for all maintenance labor.
Warehousing A2231 Vehicle Parts, Supplies and Commercial services
Actual vehicle parts, supplies and commercial services billed at cost plus 14% for tires and capitalization; 25% for other maintenance parts and supplies; and, 22% for commercial services.
Fueling Services A2232 Vehicle fuel from City-operated fuel sites
Actual price per gallon of fuel consumed plus 19 cents per gallon mark-up at unattended sites and 44 cents per gallon mark-up for tanker fuel service.
Note: (a) Per 2007 Adopted and 2008 Endorsed Budget
Fleet Operations Study
Chatham Consulting, Inc. 15
Appropriations and Revenue Requirements
For 2006 the Official Budget for the Fleets and Facilities Department was $110.3 million, of
which $39.1 million were appropriated for the Fleet Services Division. The $39.1 million is
intended to provide enough budget authority to cover all Fleets and Facilities expenditures,
except intra-department expenditures among various Fleets and Facilities Department divisions
(such as payment of facility rent).
As an internal services organization, the Fleet Services Division tracks not only its consumption
of its appropriated budget authority, but also its annual revenues and expenses. The revenues
required to make Fleet Services whole (or breakeven) by the end of the year to pay its expenses
are known as “revenue requirements.” Revenue requirements are sometimes also referred to as
the “operating” or “management budget”. They are the most meaningful from a managerial and
financial performance (profit and loss) standpoint.
Revenue requirements differ from the appropriated budget in three significant ways. First,
Revenue Requirements reflect all intra-fund costs; whereas, appropriations are reflect only
payments made to parties outside of the Fleets and Facilities Department. As a result, the
revenue requirements for the Fleet Services Division are greater than those of the appropriations
budget.
Second, appropriations are geared to the Fleet Services Division’s anticipated expenditures for
inventory items. In contrast, the corresponding expense item in the revenue requirement reflects
the cost of goods sold (also known as resale).
Third, appropriations reflect the Department’s anticipated expenditures for capital items. In
contrast, the corresponding expense item in the Revenue Requirement reflects the depreciation of
current assets. (Capital items are defined as items costing more than $5,000 and that have an
anticipated useful life of three years or longer.)
Fleet Operations Study
Chatham Consulting, Inc. 16
Financial Control Systems
Management uses a financial control system known as “Summit” to monitor and control
expenditures and encumbrances for this purpose. (Summit is the City’s implementation of the
PeopleSoft financial accounting system.)
To track annual revenues and expenses, the Fleets and Facilities Department uses a financial
reporting system known as the Operating Statement and Expense and Revenue System or
OSERS. OSERS generates balance sheets, income statements, and cash flow statements for the
various subfunds that make up the Department. The Fleets and Facilities Department accounts
for its assets and liabilities in an internal services fund, known as the Fleets and Facilities Fund,
which has separate subfunds for Fleet Services, Facilities Services, and Administrative Services.
The subfund (#50320) for Fleet Services is a unified fleets fund that does not distinguish
between capital activities (e.g., purchasing and up fitting vehicles) and operating activities (e.g.,
maintenance and fueling). As of December 2006, this subfund had current assets of $18.8
million, of which $13.1 million were in cash.
Budget Control and ORGs
Both the Summit and OSERS financial reporting systems track expenditures at the “org” level.
The orgs are low level entities within each Department and which have been established for cost
accounting purposes. The Fleet Services Division uses seven orgs to control expenses for its
three major programs:
• Program: Vehicle Leasing
o Org A2201 Division Administration
o Org A2211 Leasing Administration
o Org A2212 Vehicle Leasing
o Org A2213 Motor Pool
• Program: Vehicle Maintenance
o Org A2221 Vehicle Maintenance
o Org A2231 Warehousing
• Program: Vehicle Fueling
Fleet Operations Study
Chatham Consulting, Inc. 17
o Org A2232 Fueling
INFORMATION TECHNOLOGY
The Fleet Services Division uses the Maximus’ Fleet-Focus FA (version 5.8.4) system to manage
its work orders, asset listings, fueling services, and other fleet data. Fleet Services is also rolling
out a web based version that will be enhancing system functionality and customer access.
Customers will be able to use their web browsers to: view equipment unit detail and location,
make service requests, enter meter readings, and, view work orders status.
There is a separate database that keeps billing detail reports that are distributed electronically to
allow customers to see the details of what they are paying for. Customers have the option of
printing a report formatted as a Microsoft Word™ document, or exporting the data to a
spreadsheet for analysis. Fleet Services Division is in the process of updating the report utility.
This utility will move to the web and eliminate connectivity problems that some customers have
had. While current reports only have one month of data available at a time, the updated version
will allow customers to select a range of dates to create year to date reports.
Fleet Operations Study
Chatham Consulting, Inc. 18
III. CUSTOMER SURVEY
BACKGROUND
To provide additional insight into how well customer needs are being met by Fleet Services and
where its services may need to be improved, we conducted a confidential survey of fleet
customers. We received 21 employee responses from the following 13 departments, comprised
all of the major fleet users and some with only a few vehicles.
• Arts and Cultural Affairs • City Light • Executive Administration Consumer Affairs/Weights and Measures Unit • Fire Department • Law Department • Municipal Courts Marshals • Parks & Recreation • PS Clean Air • Public Health • Seattle Department Of Transportation • Seattle Police Department • Seattle Public Library • Seattle Public Utilities
The survey was divided into:
• Questions requesting customers to rate the following areas: o Fleet Services Division and Shops o Comparisons to Outside Vendors o Vehicle Condition and Suitability o Fleet Information System o Chargeback System
• Open-ended questions for customers to comments on:
o Areas of Dissatisfaction o Any Significant Changes Noted (during past 18 months) o Suggestions for Improvement
As will be described in more detail in the following paragraphs, customers seem to be satisfied
with the technical competence of the Fleet Services Division mechanic workforce. However,
Fleet Operations Study
Chatham Consulting, Inc. 19
they are less satisfied with Fleet Services management and its processes related to billing,
providing spare vehicles, and budgeting.
Customers rated Fleet Services repair service better than that of vendors regarding repeat repairs
and repair quality. Cost effectiveness and repair timeliness were rated similar to those of
vendors, but less so regarding timeliness. Vehicle condition and suitability were rated as “fair.”
The fleet information received a mixed rating. Customers seemed to be satisfied with technical
support, but gave the system low marks regarding its user friendliness.
While most customers rated chargeback rates as “reasonable,” they tended to not readily
understand the system or how rates were developed. Nor did they feel that the rates were devoid
of cross subsidization.
The majority of customers indicated that there had been no significant change (positive or
negative) in services during the past 18 months. Of those that did, positive changes outnumbered
negative ones by a ratio of nearly two to one.
Based on the comments provided, the most frequently cited area of dissatisfaction or needing
improvement was communications by an overwhelming amount. In particular, much of this was
focused on customer relations and communications between Fleet Services management and the
departments.
RATINGS OF FLEET SERVICES DIVISION AND SHOPS
Customers were asked to rate Fleet Services and its shops regarding 16 different attributes. The
ratings ranged from “very satisfied to very dissatisfied” and “don’t know or non-applicable.”
We in turn assigned a numeric score to each response and then computed the average score
obtained for each attribute. (The scoring assigned a 4 for very satisfied, 3 for satisfied, 2 for
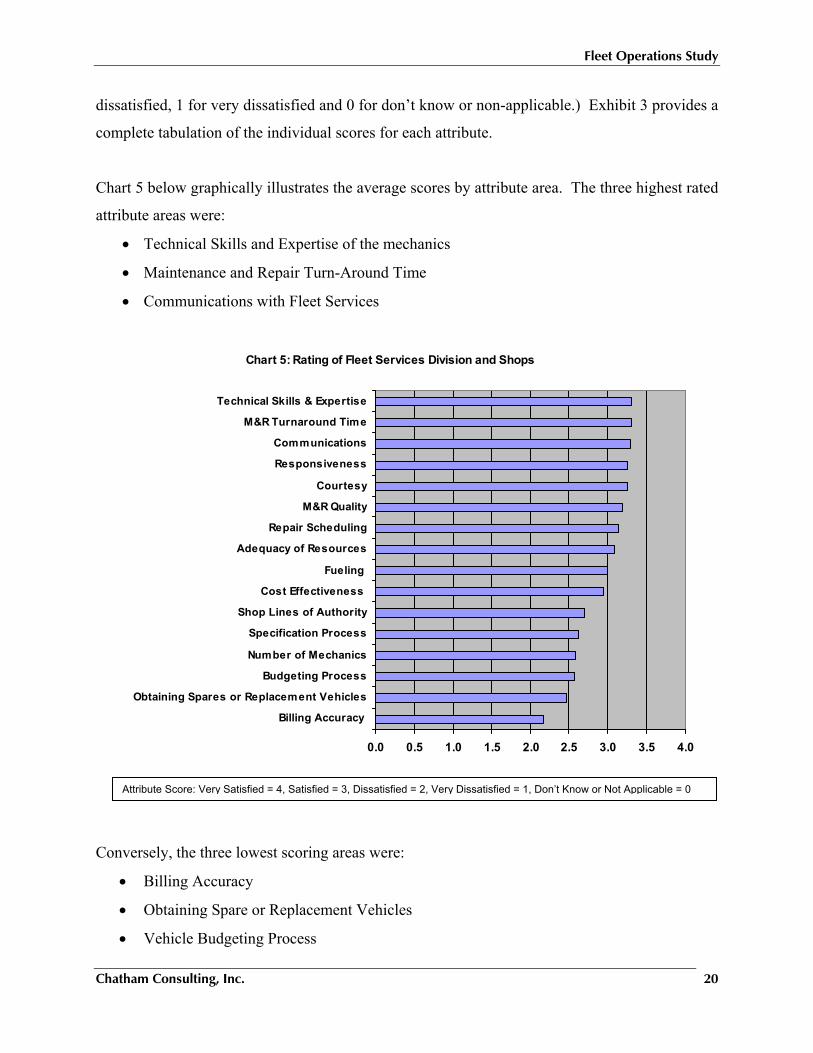
Fleet Operations Study
Chatham Consulting, Inc. 20
dissatisfied, 1 for very dissatisfied and 0 for don’t know or non-applicable.) Exhibit 3 provides a
complete tabulation of the individual scores for each attribute.
Chart 5 below graphically illustrates the average scores by attribute area. The three highest rated
attribute areas were:
• Technical Skills and Expertise of the mechanics
• Maintenance and Repair Turn-Around Time
• Communications with Fleet Services
Conversely, the three lowest scoring areas were:
• Billing Accuracy
• Obtaining Spare or Replacement Vehicles
• Vehicle Budgeting Process
Attribute Score: Very Satisfied = 4, Satisfied = 3, Dissatisfied = 2, Very Dissatisfied = 1, Don’t Know or Not Applicable = 0
Chart 5: Rating of Fleet Services Division and Shops
0.0 0.5 1.0 1.5 2.0 2.5 3.0 3.5 4.0
Billing Accuracy
Obtaining Spares or Replacement Vehicles
Budgeting Process
Number of Mechanics
Specification Process
Shop Lines of Authority
Cost Effectiveness
Fueling
Adequacy of Resources
Repair Scheduling
M&R Quality
Courtesy
Responsiveness
Communications
M&R Turnaround Time
Technical Skills & Expertise
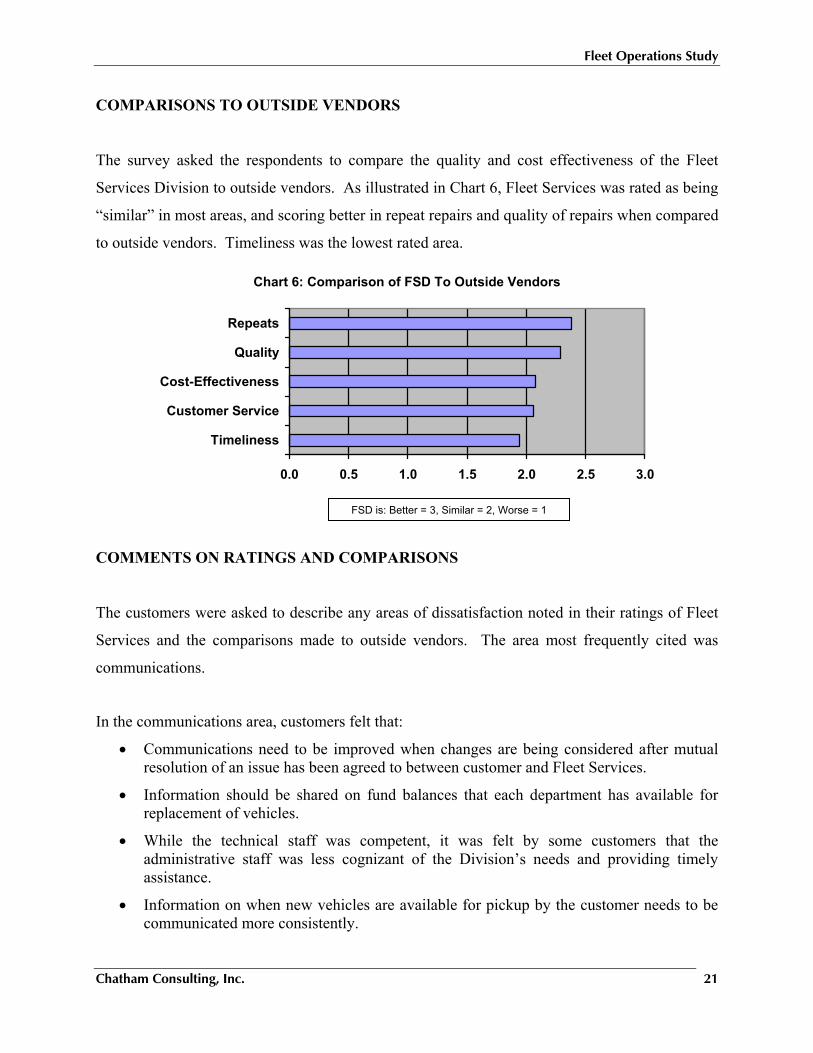
Fleet Operations Study
Chatham Consulting, Inc. 21
COMPARISONS TO OUTSIDE VENDORS
The survey asked the respondents to compare the quality and cost effectiveness of the Fleet
Services Division to outside vendors. As illustrated in Chart 6, Fleet Services was rated as being
“similar” in most areas, and scoring better in repeat repairs and quality of repairs when compared
to outside vendors. Timeliness was the lowest rated area.
Chart 6: Comparison of FSD To Outside Vendors
0.0 0.5 1.0 1.5 2.0 2.5 3.0
Timeliness
Customer Service
Cost-Effectiveness
Quality
Repeats
COMMENTS ON RATINGS AND COMPARISONS
The customers were asked to describe any areas of dissatisfaction noted in their ratings of Fleet
Services and the comparisons made to outside vendors. The area most frequently cited was
communications.
In the communications area, customers felt that:
• Communications need to be improved when changes are being considered after mutual resolution of an issue has been agreed to between customer and Fleet Services.
• Information should be shared on fund balances that each department has available for replacement of vehicles.
• While the technical staff was competent, it was felt by some customers that the administrative staff was less cognizant of the Division’s needs and providing timely assistance.
• Information on when new vehicles are available for pickup by the customer needs to be communicated more consistently.
FSD is: Better = 3, Similar = 2, Worse = 1
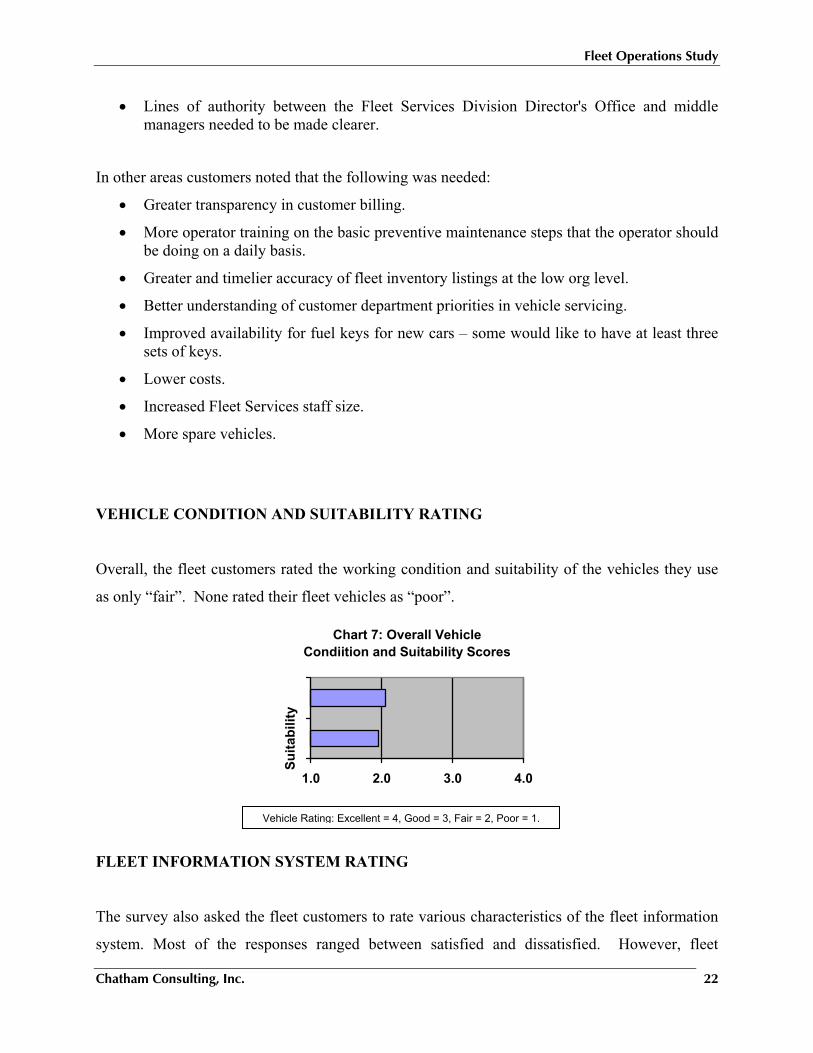
Fleet Operations Study
Chatham Consulting, Inc. 22
• Lines of authority between the Fleet Services Division Director's Office and middle managers needed to be made clearer.
In other areas customers noted that the following was needed:
• Greater transparency in customer billing.
• More operator training on the basic preventive maintenance steps that the operator should be doing on a daily basis.
• Greater and timelier accuracy of fleet inventory listings at the low org level.
• Better understanding of customer department priorities in vehicle servicing.
• Improved availability for fuel keys for new cars – some would like to have at least three sets of keys.
• Lower costs.
• Increased Fleet Services staff size.
• More spare vehicles.
VEHICLE CONDITION AND SUITABILITY RATING
Overall, the fleet customers rated the working condition and suitability of the vehicles they use
as only “fair”. None rated their fleet vehicles as “poor”.
Chart 7: Overall Vehicle Condiition and Suitability Scores
1.0 2.0 3.0 4.0
Suita
bilit
y
FLEET INFORMATION SYSTEM RATING
The survey also asked the fleet customers to rate various characteristics of the fleet information
system. Most of the responses ranged between satisfied and dissatisfied. However, fleet
Vehicle Rating: Excellent = 4, Good = 3, Fair = 2, Poor = 1.
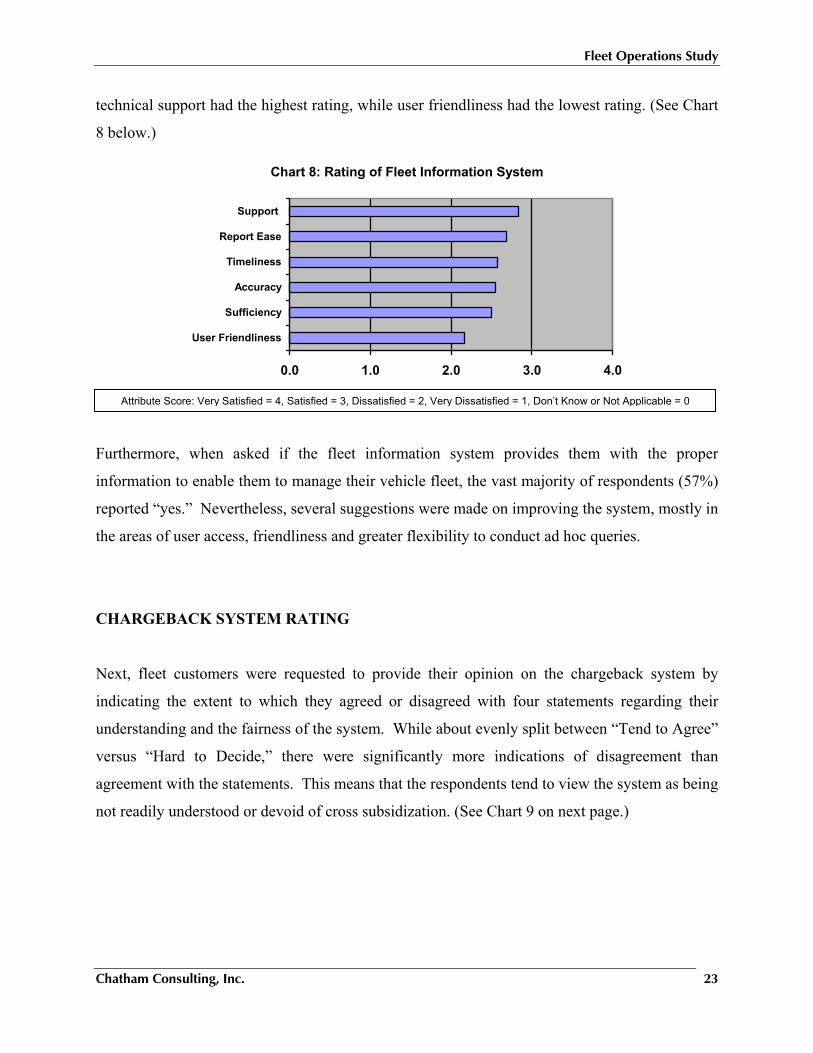
Fleet Operations Study
Chatham Consulting, Inc. 23
technical support had the highest rating, while user friendliness had the lowest rating. (See Chart
8 below.)
Chart 8: Rating of Fleet Information System
0.0 1.0 2.0 3.0 4.0
User Friendliness
Sufficiency
Accuracy
Timeliness
Report Ease
Support
Furthermore, when asked if the fleet information system provides them with the proper
information to enable them to manage their vehicle fleet, the vast majority of respondents (57%)
reported “yes.” Nevertheless, several suggestions were made on improving the system, mostly in
the areas of user access, friendliness and greater flexibility to conduct ad hoc queries.
CHARGEBACK SYSTEM RATING
Next, fleet customers were requested to provide their opinion on the chargeback system by
indicating the extent to which they agreed or disagreed with four statements regarding their
understanding and the fairness of the system. While about evenly split between “Tend to Agree”
versus “Hard to Decide,” there were significantly more indications of disagreement than
agreement with the statements. This means that the respondents tend to view the system as being
not readily understood or devoid of cross subsidization. (See Chart 9 on next page.)
Attribute Score: Very Satisfied = 4, Satisfied = 3, Dissatisfied = 2, Very Dissatisfied = 1, Don’t Know or Not Applicable = 0
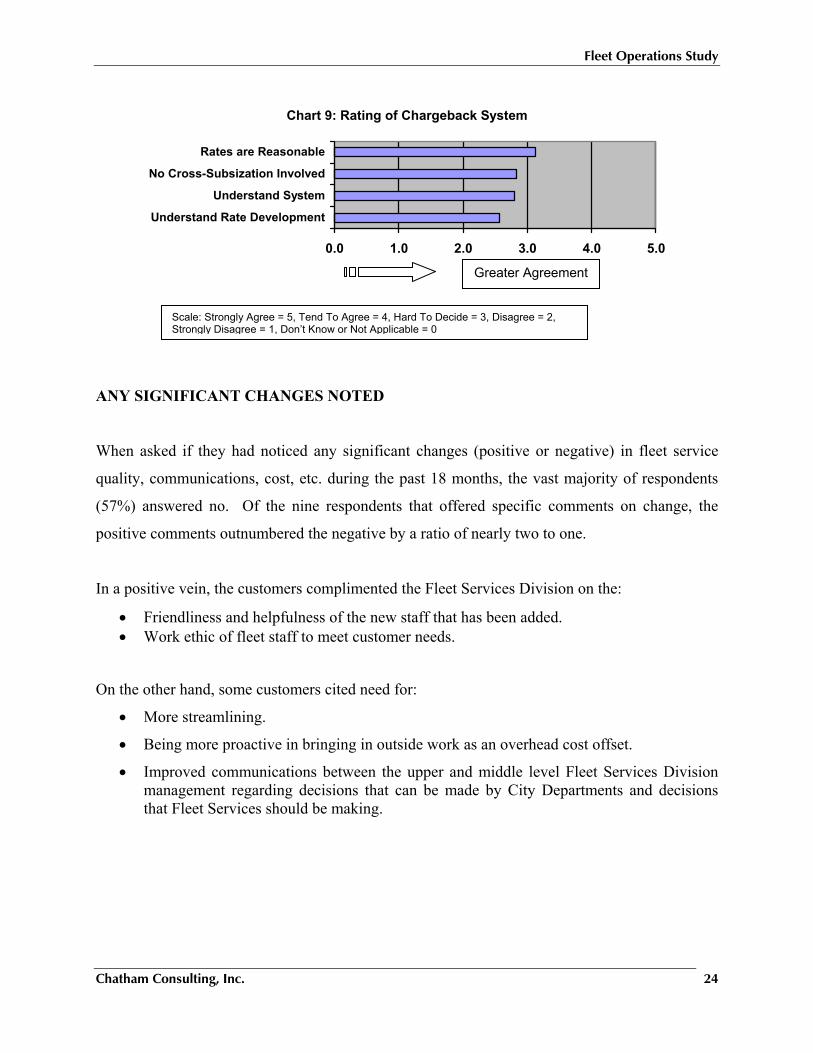
Fleet Operations Study
Chatham Consulting, Inc. 24
Chart 9: Rating of Chargeback System
0.0 1.0 2.0 3.0 4.0 5.0
Understand Rate Development
Understand System
No Cross-Subsization Involved
Rates are Reasonable
ANY SIGNIFICANT CHANGES NOTED
When asked if they had noticed any significant changes (positive or negative) in fleet service
quality, communications, cost, etc. during the past 18 months, the vast majority of respondents
(57%) answered no. Of the nine respondents that offered specific comments on change, the
positive comments outnumbered the negative by a ratio of nearly two to one.
In a positive vein, the customers complimented the Fleet Services Division on the:
• Friendliness and helpfulness of the new staff that has been added. • Work ethic of fleet staff to meet customer needs.
On the other hand, some customers cited need for:
• More streamlining.
• Being more proactive in bringing in outside work as an overhead cost offset.
• Improved communications between the upper and middle level Fleet Services Division management regarding decisions that can be made by City Departments and decisions that Fleet Services should be making.
Scale: Strongly Agree = 5, Tend To Agree = 4, Hard To Decide = 3, Disagree = 2, Strongly Disagree = 1, Don’t Know or Not Applicable = 0
Greater Agreement
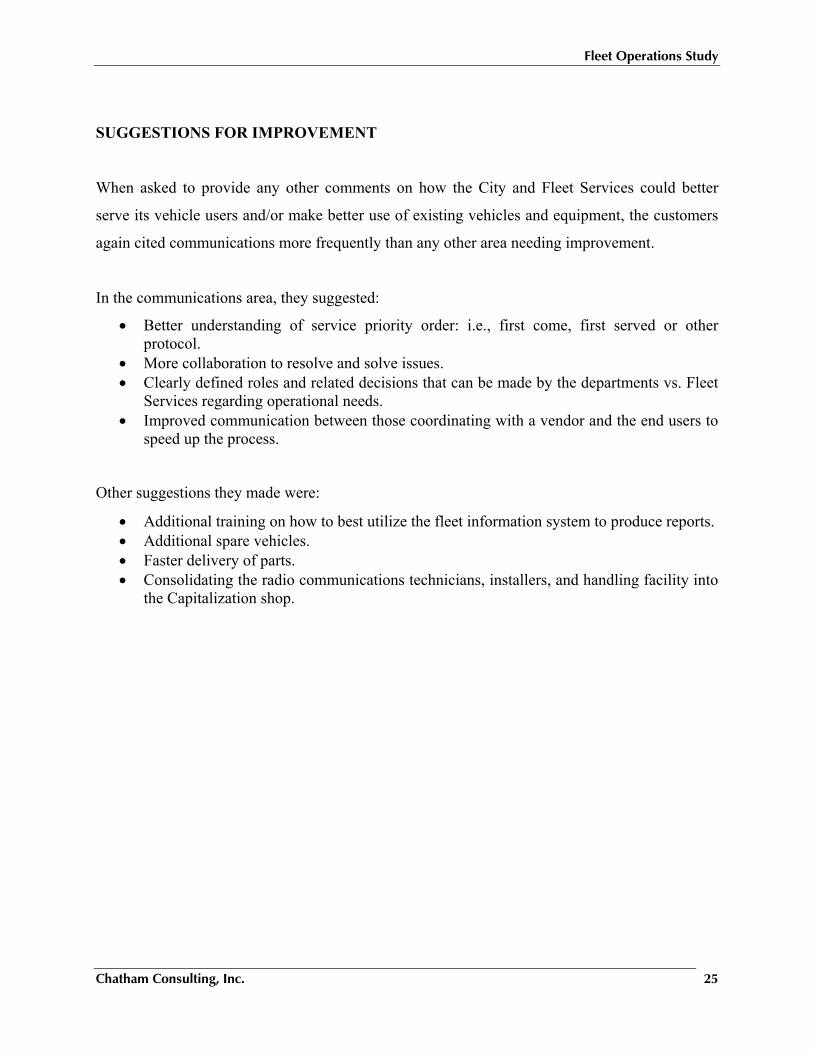
Fleet Operations Study
Chatham Consulting, Inc. 25
SUGGESTIONS FOR IMPROVEMENT
When asked to provide any other comments on how the City and Fleet Services could better
serve its vehicle users and/or make better use of existing vehicles and equipment, the customers
again cited communications more frequently than any other area needing improvement.
In the communications area, they suggested:
• Better understanding of service priority order: i.e., first come, first served or other protocol.
• More collaboration to resolve and solve issues. • Clearly defined roles and related decisions that can be made by the departments vs. Fleet
Services regarding operational needs. • Improved communication between those coordinating with a vendor and the end users to
speed up the process.
Other suggestions they made were:
• Additional training on how to best utilize the fleet information system to produce reports. • Additional spare vehicles. • Faster delivery of parts. • Consolidating the radio communications technicians, installers, and handling facility into
the Capitalization shop.
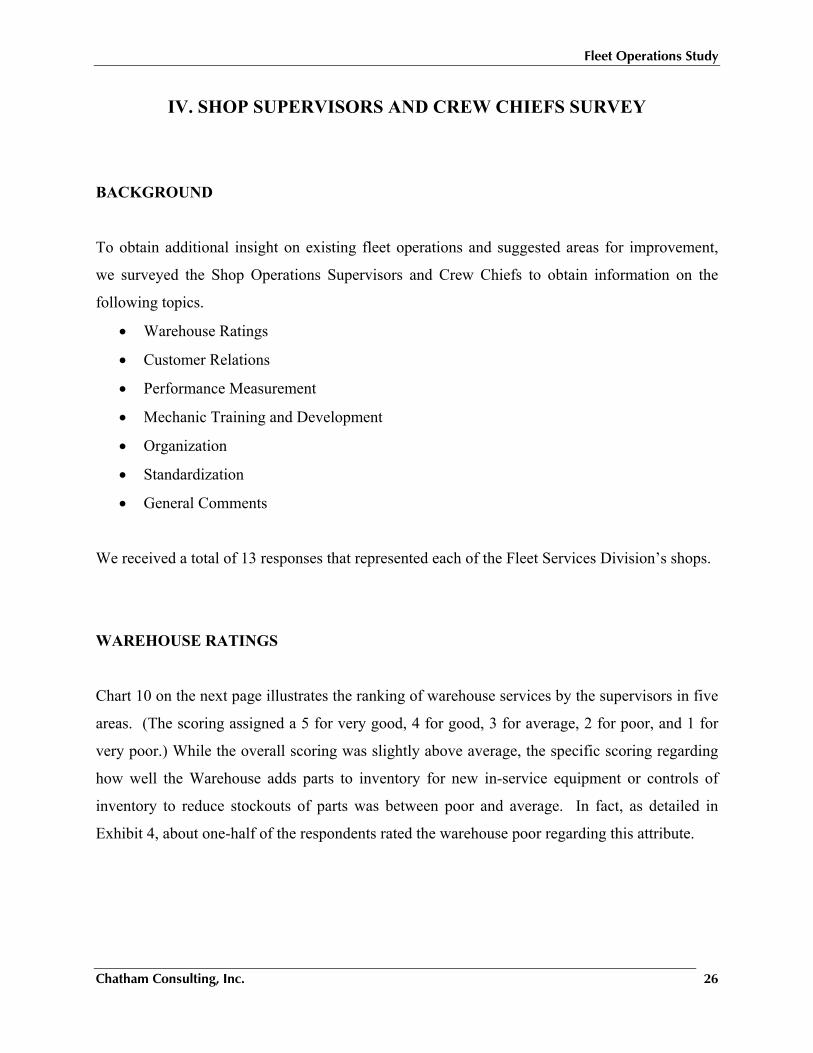
Fleet Operations Study
Chatham Consulting, Inc. 26
IV. SHOP SUPERVISORS AND CREW CHIEFS SURVEY
BACKGROUND
To obtain additional insight on existing fleet operations and suggested areas for improvement,
we surveyed the Shop Operations Supervisors and Crew Chiefs to obtain information on the
following topics.
• Warehouse Ratings
• Customer Relations
• Performance Measurement
• Mechanic Training and Development
• Organization
• Standardization
• General Comments
We received a total of 13 responses that represented each of the Fleet Services Division’s shops.
WAREHOUSE RATINGS
Chart 10 on the next page illustrates the ranking of warehouse services by the supervisors in five
areas. (The scoring assigned a 5 for very good, 4 for good, 3 for average, 2 for poor, and 1 for
very poor.) While the overall scoring was slightly above average, the specific scoring regarding
how well the Warehouse adds parts to inventory for new in-service equipment or controls of
inventory to reduce stockouts of parts was between poor and average. In fact, as detailed in
Exhibit 4, about one-half of the respondents rated the warehouse poor regarding this attribute.
Fleet Operations Study
Chatham Consulting, Inc. 27
CUSTOMER RELATIONS
Ninety-one percent (91%) of the respondents indicated that they had a good understanding of
their customers’ expectations. However, ninety-one percent (91%) also indicated that were
barriers to effective communications with customers. The supervisors were asked to list those
barriers and what remedies they would suggest to correct them.
Chart 11: Communications Barriers and Remedies Barrier Suggested Remedy On some occasions the customers will send complaint to management instead of going to the supervisors of the shop.
Management encouraging the customers to talk with supervisor.
Communications between day and night shift workers.
Getting current customer contact/user information into our Fleet Focus system, so that email becomes more usable.
Customers believing that their equipment is a number one priority and that the shop has unlimited manpower to drop whatever they are doing to address theirs.
Educating customers that it's impossible to have immediate turnaround time on everything all the time.
Customers not familiar with or not knowing what procedures they should follow when requesting additional accessories.
Improve the consistency of the accessory approval process to avoid the customer misperception that they can have anything they want because they have been allowed so in the past.
Continued on next page
Attribute Score: Very Good = 5, Good = 4, Average = 3, Poor = 2, Very Poor = 1
Chart 10: Rating The Warehouse
0.0 1.0 2.0 3.0 4.0 5.0
Respond to the needs of the maintenancedepartment?
Control inventory to reduce stockouts of parts?
Control inventory to remove out of serviceequipment parts from inventory?
Add parts to inventory for new in serviceequipment?
Respond to the needs of the maintenancedepartment?
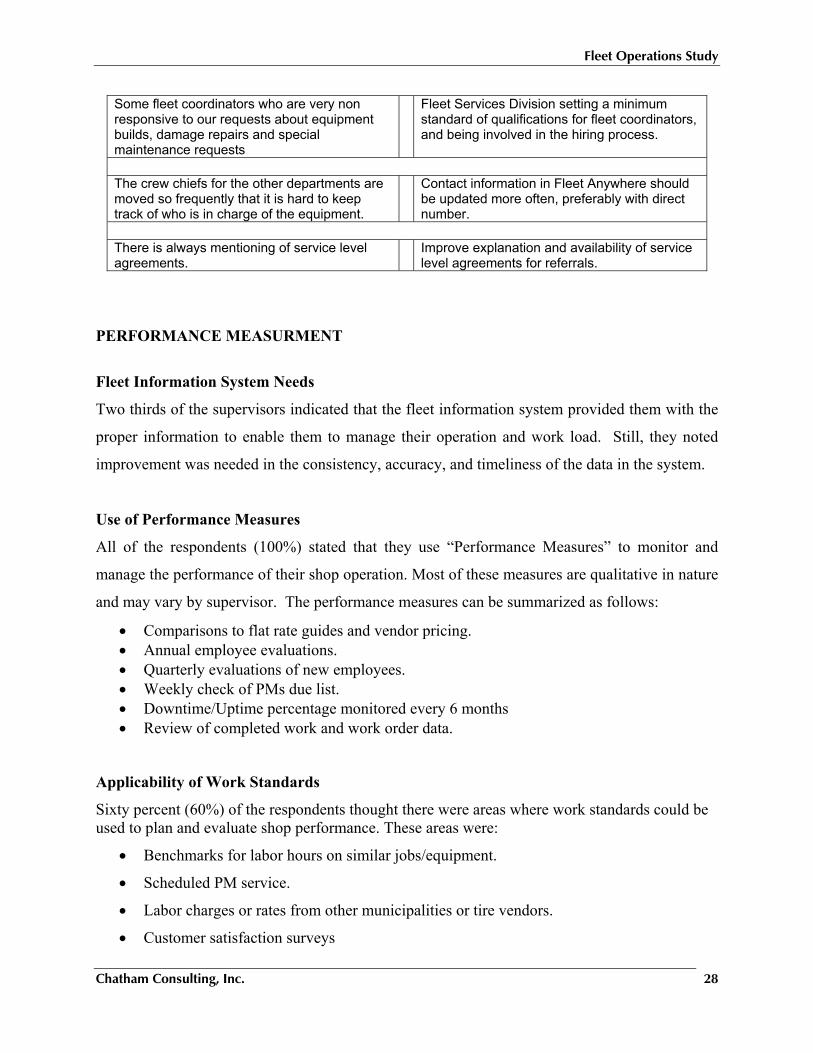
Fleet Operations Study
Chatham Consulting, Inc. 28
Some fleet coordinators who are very non responsive to our requests about equipment builds, damage repairs and special maintenance requests
Fleet Services Division setting a minimum standard of qualifications for fleet coordinators, and being involved in the hiring process.
The crew chiefs for the other departments are moved so frequently that it is hard to keep track of who is in charge of the equipment.
Contact information in Fleet Anywhere should be updated more often, preferably with direct number.
There is always mentioning of service level agreements.
Improve explanation and availability of service level agreements for referrals.
PERFORMANCE MEASURMENT
Fleet Information System Needs
Two thirds of the supervisors indicated that the fleet information system provided them with the
proper information to enable them to manage their operation and work load. Still, they noted
improvement was needed in the consistency, accuracy, and timeliness of the data in the system.
Use of Performance Measures
All of the respondents (100%) stated that they use “Performance Measures” to monitor and
manage the performance of their shop operation. Most of these measures are qualitative in nature
and may vary by supervisor. The performance measures can be summarized as follows:
• Comparisons to flat rate guides and vendor pricing. • Annual employee evaluations. • Quarterly evaluations of new employees. • Weekly check of PMs due list. • Downtime/Uptime percentage monitored every 6 months • Review of completed work and work order data.
Applicability of Work Standards
Sixty percent (60%) of the respondents thought there were areas where work standards could be used to plan and evaluate shop performance. These areas were:
• Benchmarks for labor hours on similar jobs/equipment.
• Scheduled PM service.
• Labor charges or rates from other municipalities or tire vendors.
• Customer satisfaction surveys
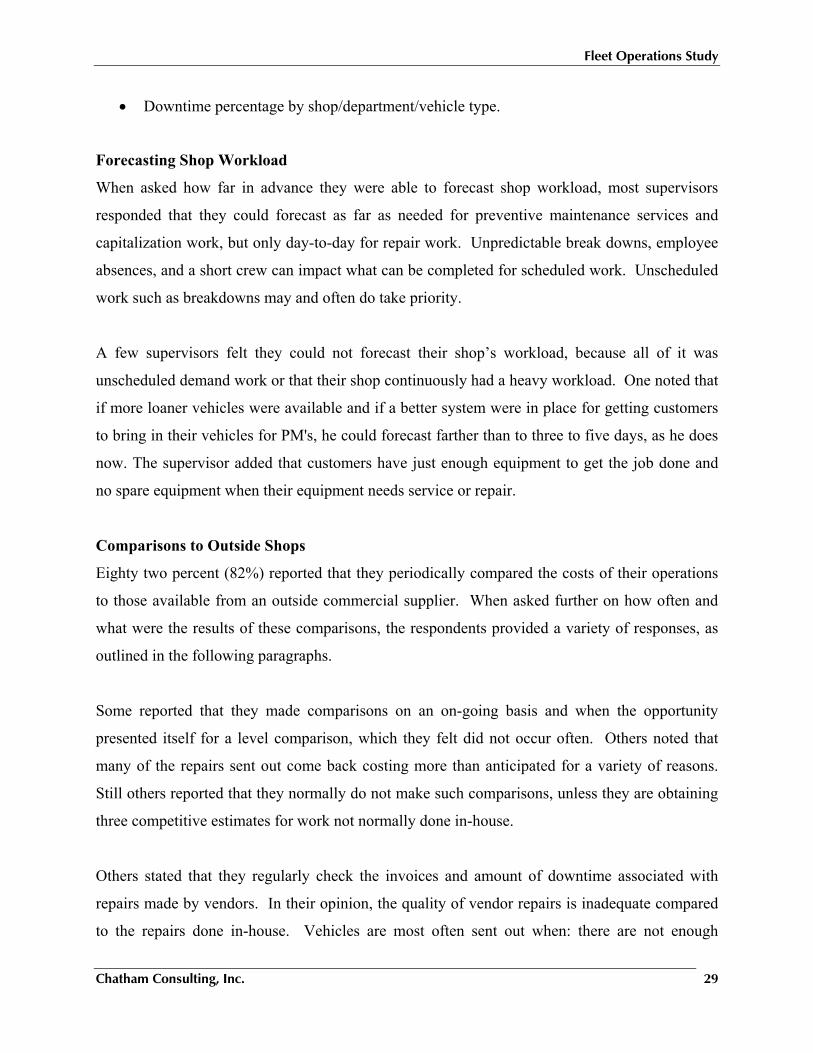
Fleet Operations Study
Chatham Consulting, Inc. 29
• Downtime percentage by shop/department/vehicle type.
Forecasting Shop Workload
When asked how far in advance they were able to forecast shop workload, most supervisors
responded that they could forecast as far as needed for preventive maintenance services and
capitalization work, but only day-to-day for repair work. Unpredictable break downs, employee
absences, and a short crew can impact what can be completed for scheduled work. Unscheduled
work such as breakdowns may and often do take priority.
A few supervisors felt they could not forecast their shop’s workload, because all of it was
unscheduled demand work or that their shop continuously had a heavy workload. One noted that
if more loaner vehicles were available and if a better system were in place for getting customers
to bring in their vehicles for PM's, he could forecast farther than to three to five days, as he does
now. The supervisor added that customers have just enough equipment to get the job done and
no spare equipment when their equipment needs service or repair.
Comparisons to Outside Shops
Eighty two percent (82%) reported that they periodically compared the costs of their operations
to those available from an outside commercial supplier. When asked further on how often and
what were the results of these comparisons, the respondents provided a variety of responses, as
outlined in the following paragraphs.
Some reported that they made comparisons on an on-going basis and when the opportunity
presented itself for a level comparison, which they felt did not occur often. Others noted that
many of the repairs sent out come back costing more than anticipated for a variety of reasons.
Still others reported that they normally do not make such comparisons, unless they are obtaining
three competitive estimates for work not normally done in-house.
Others stated that they regularly check the invoices and amount of downtime associated with
repairs made by vendors. In their opinion, the quality of vendor repairs is inadequate compared
to the repairs done in-house. Vehicles are most often sent out when: there are not enough
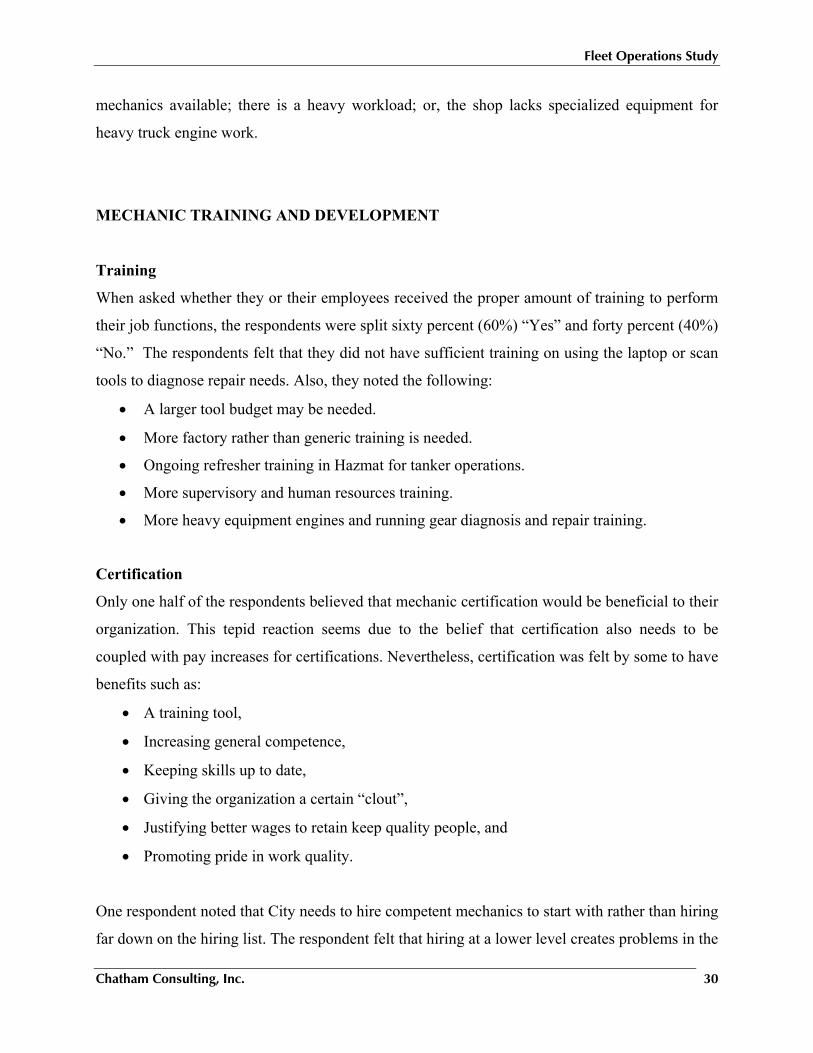
Fleet Operations Study
Chatham Consulting, Inc. 30
mechanics available; there is a heavy workload; or, the shop lacks specialized equipment for
heavy truck engine work.
MECHANIC TRAINING AND DEVELOPMENT
Training
When asked whether they or their employees received the proper amount of training to perform
their job functions, the respondents were split sixty percent (60%) “Yes” and forty percent (40%)
“No.” The respondents felt that they did not have sufficient training on using the laptop or scan
tools to diagnose repair needs. Also, they noted the following:
• A larger tool budget may be needed.
• More factory rather than generic training is needed.
• Ongoing refresher training in Hazmat for tanker operations.
• More supervisory and human resources training.
• More heavy equipment engines and running gear diagnosis and repair training.
Certification
Only one half of the respondents believed that mechanic certification would be beneficial to their
organization. This tepid reaction seems due to the belief that certification also needs to be
coupled with pay increases for certifications. Nevertheless, certification was felt by some to have
benefits such as:
• A training tool,
• Increasing general competence,
• Keeping skills up to date,
• Giving the organization a certain “clout”,
• Justifying better wages to retain keep quality people, and
• Promoting pride in work quality.
One respondent noted that City needs to hire competent mechanics to start with rather than hiring
far down on the hiring list. The respondent felt that hiring at a lower level creates problems in the
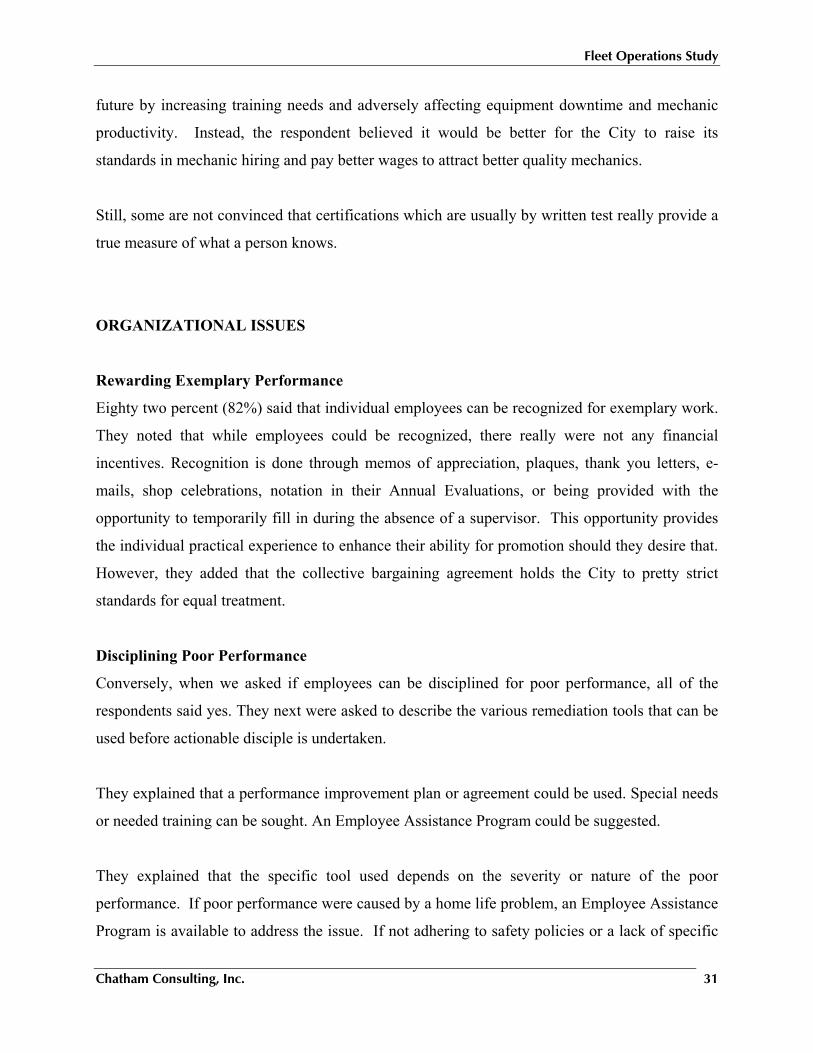
Fleet Operations Study
Chatham Consulting, Inc. 31
future by increasing training needs and adversely affecting equipment downtime and mechanic
productivity. Instead, the respondent believed it would be better for the City to raise its
standards in mechanic hiring and pay better wages to attract better quality mechanics.
Still, some are not convinced that certifications which are usually by written test really provide a
true measure of what a person knows.
ORGANIZATIONAL ISSUES
Rewarding Exemplary Performance
Eighty two percent (82%) said that individual employees can be recognized for exemplary work.
They noted that while employees could be recognized, there really were not any financial
incentives. Recognition is done through memos of appreciation, plaques, thank you letters, e-
mails, shop celebrations, notation in their Annual Evaluations, or being provided with the
opportunity to temporarily fill in during the absence of a supervisor. This opportunity provides
the individual practical experience to enhance their ability for promotion should they desire that.
However, they added that the collective bargaining agreement holds the City to pretty strict
standards for equal treatment.
Disciplining Poor Performance
Conversely, when we asked if employees can be disciplined for poor performance, all of the
respondents said yes. They next were asked to describe the various remediation tools that can be
used before actionable disciple is undertaken.
They explained that a performance improvement plan or agreement could be used. Special needs
or needed training can be sought. An Employee Assistance Program could be suggested.
They explained that the specific tool used depends on the severity or nature of the poor
performance. If poor performance were caused by a home life problem, an Employee Assistance
Program is available to address the issue. If not adhering to safety policies or a lack of specific

Fleet Operations Study
Chatham Consulting, Inc. 32
job knowledge are the issues, a Performance Improvement Plan that will include appropriate
counseling and training can be used. If there is no improvement over an allotted time frame,
Progressive Discipline would be implemented. Normally, before any “real" action takes place
the employee will receive a verbal warning and/or a corrective action plan to help them with the
job inefficiencies. The Progressive Discipline program is a multi-step process involving:
communicating clear expectations, verbal warnings, written reprimand, suspension and demotion
or discharge.
Fitting Within Fleet Services Division Organization
Eighty percent (80%) viewed their particular shop as a good fit in the overall Fleet Services
organization. Some differences were noted regarding the South Service Center and the Fire
Shop. The supervisors claimed that the job duties, core competencies, body of work, and skill
sets required for technicians are significantly different from those at the other shops. Even so
they point out that all fleet mechanics are paid and classified the same.
Proper Number of Mechanics
Only eighteen percent (18%) of the supervisors believed that they had a sufficient number of
mechanics for their shops. Only the Fire Shop and South Service Center did not report any
shortages. Generally, each of the other shops reported needing from one to two mechanics each.
As listed in Chart 12 below, the total shortage estimated by the supervisors is between 8 and 11
mechanics. Chart 12: Supervisor Estimates Of
Mechanic Shortages Shop ShortageCapitalization Shop 1 Car Shop 1 to 2 Haller Lake 1 Metal/Machine 2 Paint & Body: 1 to 2 Tire Shop 1 Truck shop 2
Total 8 to 11
Fleet Operations Study
Chatham Consulting, Inc. 33
Concerns were expressed in the:
• Hiring process taking months or longer to put a mechanic on the floor,
• Steady flow of breakdown work,
• Days or weeks of delays in starting jobs due shortage of personnel,
• Customer complaints regarding turnaround time
• Increases in fleet size, without increases in staff.
STANDARDIZATION
The respondents were nearly unanimous, at ninety percent (90%), in their opinion that the proper
amount of standardization does not exist for the City fleet. The supervisors cited the following
benefits of standardization affecting their departments.
• Less training needed for the mechanic,
• Improved parts availability from the warehouse,
• Less diagnostic tools and software needed,
• Increased proficiency in repairs, and
• Less vehicle downtime.
Currently, they feel that the City offers too many choices to its customers. All this costs the City
money in parts inventory, training, tools or down times. They would like departments (fleet
coordinators, supervisors and operators) to agree on standardization of pickups, trailers of the
same classes and heavy equipment in order to make outfitting the fleet more cost efficient. They
spend a lot of time and resources customizing equipment for operators.
As a cited example, the City seldom purchases the same make of fire apparatus twice. As a
result, the City has fire apparatus from 11 different manufacturers. This means many more parts
need to be stocked in the warehouse, additional training provided, and that it becomes far more
difficult to master all of the unique aspects of particular manufacturer offerings. Hugely
significant savings could be realized by the City if it were to standardize on just one or two
apparatus manufacturers.
Fleet Operations Study
Chatham Consulting, Inc. 34
ADDITIONAL COMMENTS
Finally, when asked to provide any additional comments or opinions, most of the respondents
expressed pride in their workers and the quality of services that they deliver. They also cited
their great familiarity with the City’s fleet and customer needs. Still, they noted that while the
Warehouse has made some improvements during the last year, additional improvement was
needed.
Fleet Operations Study
Chatham Consulting, Inc. 35
V. MECHANIC SURVEY
BACKGROUND
We conducted a confidential attitudinal survey of the mechanic workforce at each Fleet Services
shop to obtain their input on how to improve the services provided by the Fleet Services
Division. The survey questionnaire requested the mechanics to rate their present job, working
conditions, working environment and their immediate supervisor. The questionnaire also
provided the mechanics an opportunity to list their suggestions for improving operations, and
describe any other comments or opinions they might have. We received an excellent response
rate with 73 mechanics submitting completed questionnaires that contained over 150 comments
and suggestions for improvement.
RATINGS
Exhibit 5 provides a numerical and graphical comparison of the ratings given by Seattle
mechanics, as well as lists the average rating given by other public fleets for the same areas.
Despite their concerns about pay, Seattle mechanics still, as a whole, were more satisfied with
their working environment and the supervisors they work for than the mechanics we surveyed
recently from other cities. Nevertheless, Seattle mechanics had lower satisfaction levels with
their compensation and benefits than mechanics of other government fleets surveyed.
Feelings About Current Job
The mechanics rated their jobs slightly less than average for having their ideas adopted and or
the authority to make decisions about how to do their job. Their scores are slightly higher than
those of other public service fleets which we had surveyed regarding these attributes.
Comparing scores by shop location, we found that the employees of Metal and Fire Shops had
the highest rating, while those of the Truck and Paint & Body shops had the lowest, as illustrated
in Chart 13 on the next page.
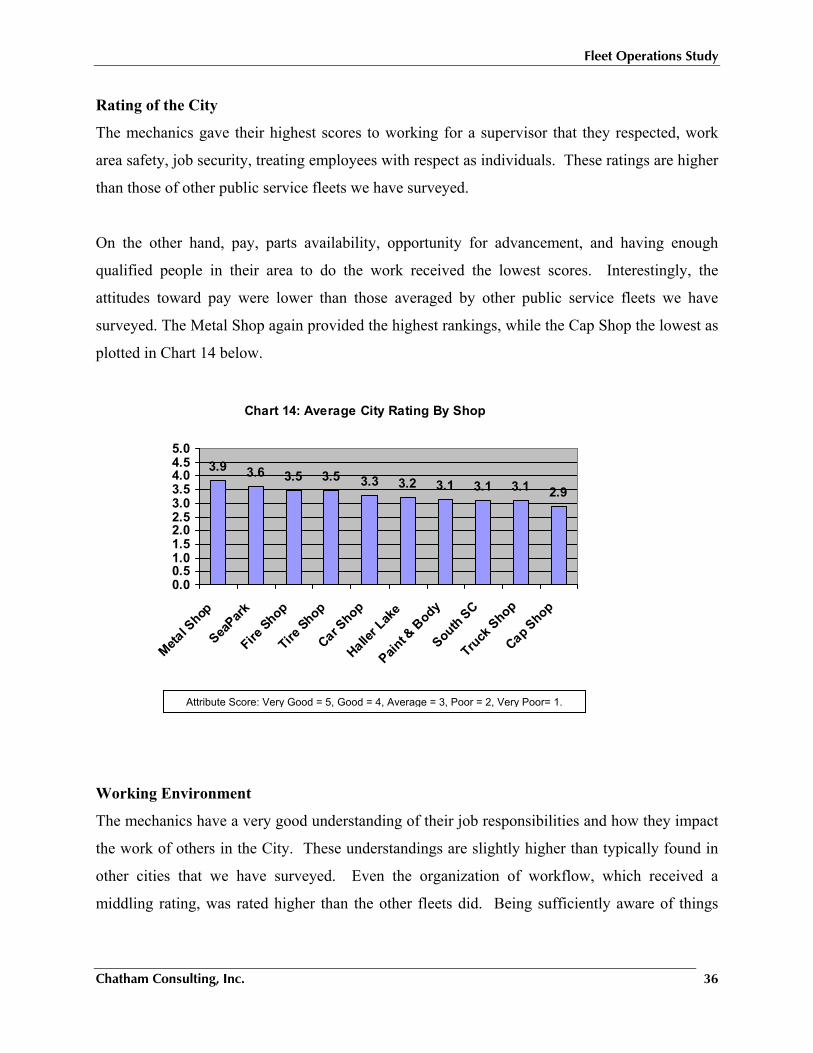
Fleet Operations Study
Chatham Consulting, Inc. 36
Rating of the City
The mechanics gave their highest scores to working for a supervisor that they respected, work
area safety, job security, treating employees with respect as individuals. These ratings are higher
than those of other public service fleets we have surveyed.
On the other hand, pay, parts availability, opportunity for advancement, and having enough
qualified people in their area to do the work received the lowest scores. Interestingly, the
attitudes toward pay were lower than those averaged by other public service fleets we have
surveyed. The Metal Shop again provided the highest rankings, while the Cap Shop the lowest as
plotted in Chart 14 below.
Working Environment
The mechanics have a very good understanding of their job responsibilities and how they impact
the work of others in the City. These understandings are slightly higher than typically found in
other cities that we have surveyed. Even the organization of workflow, which received a
middling rating, was rated higher than the other fleets did. Being sufficiently aware of things
Chart 14: Average City Rating By Shop
3.9 3.6 3.5 3.5 3.3 3.2 3.1 3.1 3.1 2.9
0.00.51.01.52.02.53.03.54.04.55.0
Metal S
hop
SeaPark
Fire Shop
Tire Shop
Car Shop
Haller L
ake
Paint &
Body
South SC
Truck
Shop
Cap Shop
Attribute Score: Very Good = 5, Good = 4, Average = 3, Poor = 2, Very Poor= 1.
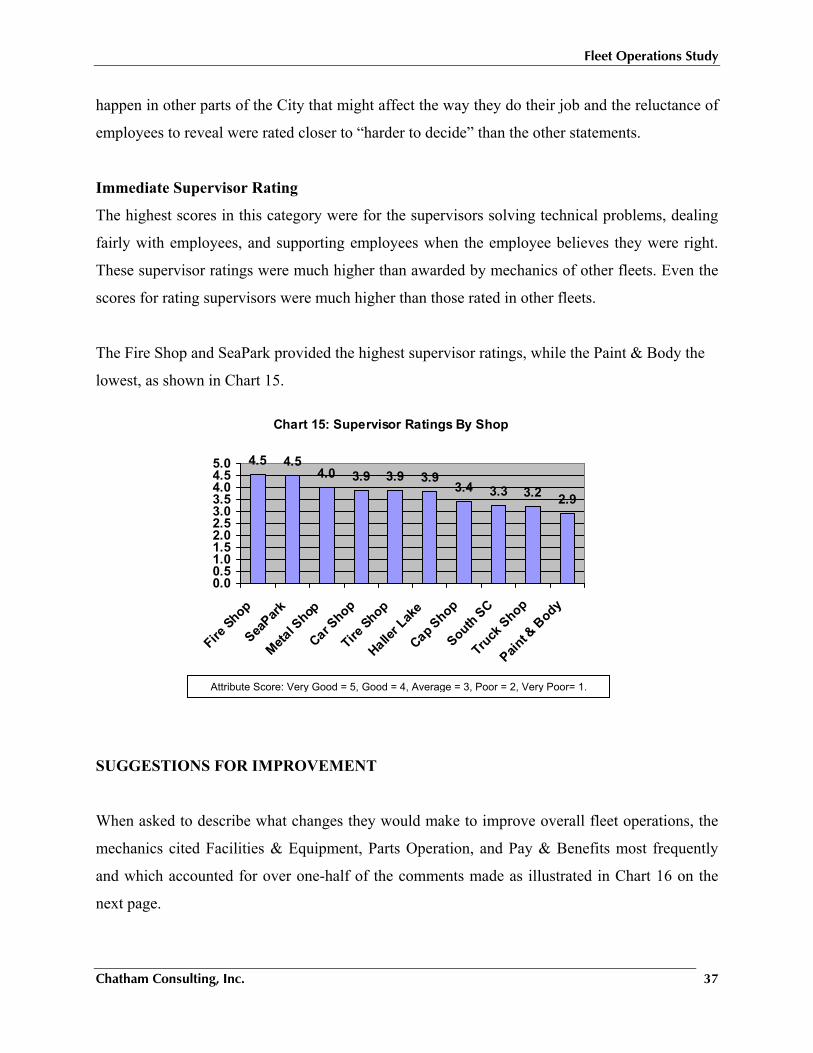
Fleet Operations Study
Chatham Consulting, Inc. 37
happen in other parts of the City that might affect the way they do their job and the reluctance of
employees to reveal were rated closer to “harder to decide” than the other statements.
Immediate Supervisor Rating
The highest scores in this category were for the supervisors solving technical problems, dealing
fairly with employees, and supporting employees when the employee believes they were right.
These supervisor ratings were much higher than awarded by mechanics of other fleets. Even the
scores for rating supervisors were much higher than those rated in other fleets.
The Fire Shop and SeaPark provided the highest supervisor ratings, while the Paint & Body the
lowest, as shown in Chart 15.
SUGGESTIONS FOR IMPROVEMENT
When asked to describe what changes they would make to improve overall fleet operations, the
mechanics cited Facilities & Equipment, Parts Operation, and Pay & Benefits most frequently
and which accounted for over one-half of the comments made as illustrated in Chart 16 on the
next page.
Attribute Score: Very Good = 5, Good = 4, Average = 3, Poor = 2, Very Poor= 1.
Chart 15: Supervisor Ratings By Shop
4.5 4.54.0 3.9 3.9 3.9
3.4 3.3 3.2 2.9
0.00.51.01.52.02.53.03.54.04.55.0
Fire Shop
SeaPark
Metal S
hop
Car Shop
Tire Shop
Haller L
ake
Cap Shop
South SC
Truck
Shop
Paint &
Body
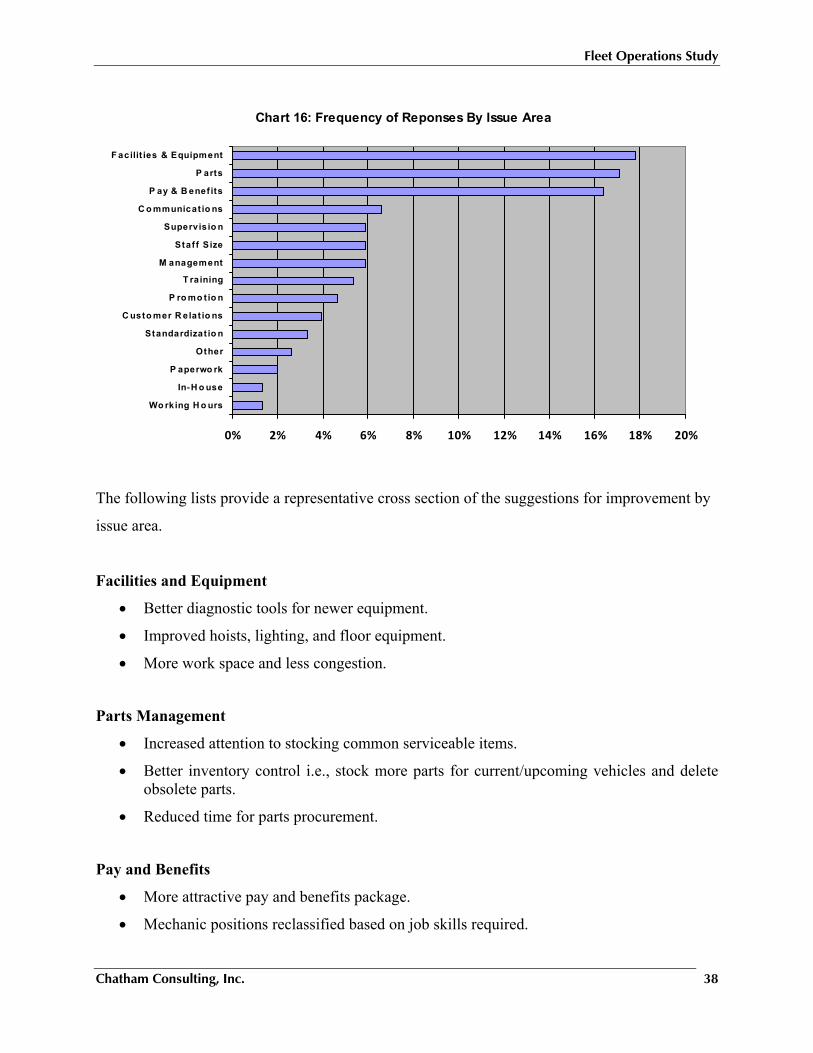
Fleet Operations Study
Chatham Consulting, Inc. 38
The following lists provide a representative cross section of the suggestions for improvement by
issue area.
Facilities and Equipment
• Better diagnostic tools for newer equipment.
• Improved hoists, lighting, and floor equipment.
• More work space and less congestion.
Parts Management
• Increased attention to stocking common serviceable items.
• Better inventory control i.e., stock more parts for current/upcoming vehicles and delete obsolete parts.
• Reduced time for parts procurement.
Pay and Benefits
• More attractive pay and benefits package.
• Mechanic positions reclassified based on job skills required.
Chart 16: Frequency of Reponses By Issue Area
0% 2% 4% 6% 8% 10% 12% 14% 16% 18% 20%
Wo rking H o urs
In-H o use
P aperwo rk
Other
Standardizat io n
C usto mer R elat io ns
P ro mo tio n
T raining
M anagement
Staf f Size
Supervisio n
C o mmunicat io ns
P ay & B enef its
P arts
F acilit ies & Equipment
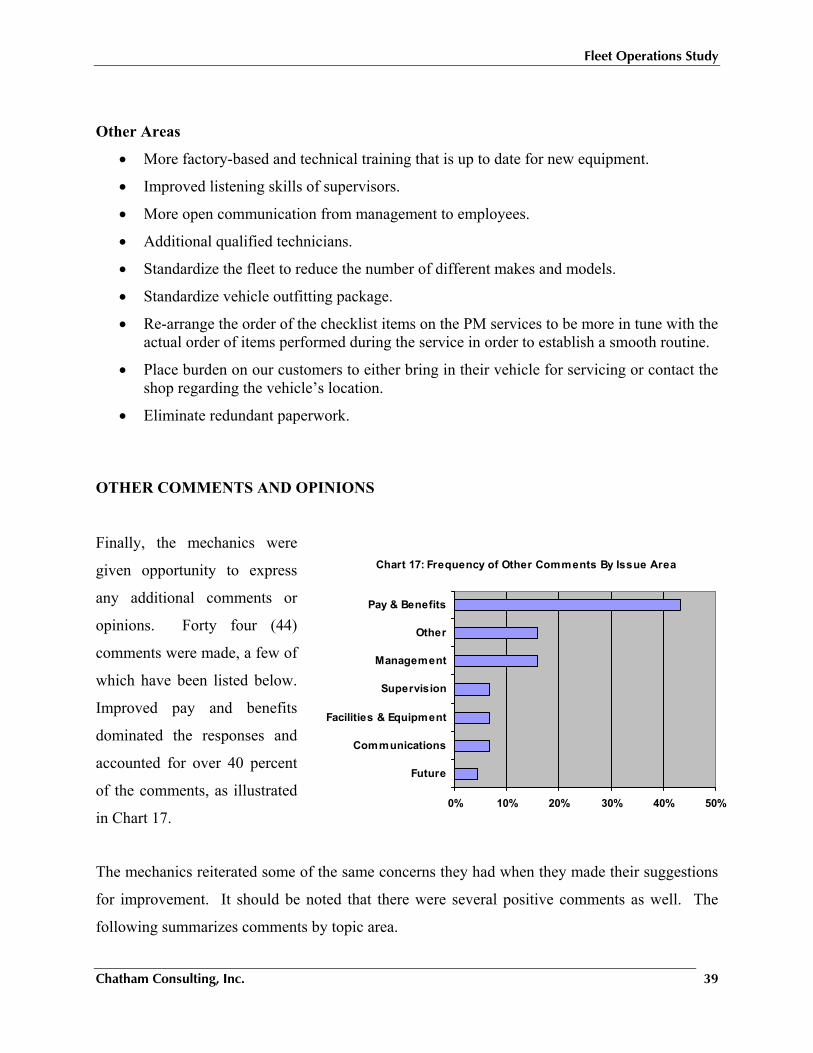
Fleet Operations Study
Chatham Consulting, Inc. 39
Other Areas
• More factory-based and technical training that is up to date for new equipment.
• Improved listening skills of supervisors.
• More open communication from management to employees.
• Additional qualified technicians.
• Standardize the fleet to reduce the number of different makes and models.
• Standardize vehicle outfitting package.
• Re-arrange the order of the checklist items on the PM services to be more in tune with the actual order of items performed during the service in order to establish a smooth routine.
• Place burden on our customers to either bring in their vehicle for servicing or contact the shop regarding the vehicle’s location.
• Eliminate redundant paperwork.
OTHER COMMENTS AND OPINIONS
Finally, the mechanics were
given opportunity to express
any additional comments or
opinions. Forty four (44)
comments were made, a few of
which have been listed below.
Improved pay and benefits
dominated the responses and
accounted for over 40 percent
of the comments, as illustrated
in Chart 17.
The mechanics reiterated some of the same concerns they had when they made their suggestions
for improvement. It should be noted that there were several positive comments as well. The
following summarizes comments by topic area.
Chart 17: Frequency of Other Comments By Issue Area
0% 10% 20% 30% 40% 50%
Future
Communications
Facilities & Equipment
Supervision
Management
Other
Pay & Benefits
Fleet Operations Study
Chatham Consulting, Inc. 40
Pay & Benefits
• Increased pay and benefits. • Increased tool allowance. • Introduction of incentive pay, wages, and compensation for certifications
Other Areas
• Up-to-date subscriptions to manufacturers’ on-line service manuals.
• Less duplication in work effort.
• Improved people management skills of management.
• Increased shop staff.
• Empowerment of front line supervision.
• Improved communication between management and front line supervision.
Fleet Operations Study
Chatham Consulting, Inc. 41
VI. WAREHOUSER SURVEY
BACKGROUND
At the request of the Fleet Services Department, we extended our employee surveys to include
those employees in the Warehouse section. The survey we used included the same set of
questions contained in the mechanic survey and requested the warehousers to rate job, working
conditions, working environment and their immediate supervisor. Consequently, we were able
to compare and contrast the responses from both groups of employees. The questionnaire also
provided the warehousers an opportunity to list their suggestions for improving operations, and
describe any other comments or opinions they might have. We received six responses, which
included all but one Warehouse location.
RATINGS
Exhibit 6 provides a numerical and graphical comparison of the ratings given by the
warehousers, as well as lists the corresponding ratings given by the mechanics for the same
questions. The warehousers seem to be more positive about their job opportunities than the
mechanics are. The greatest differences were the solving of technical problems, physical work
conditions, and cooperation between employees that the warehousers rated lower than the
mechanics did. Conversely, the warehousers seemed to have less concerns than the mechanics
did about pay.
Also, the warehousers indicated that they had a better understanding of their job responsibilities
and how it affects the work of others in the City than the mechanics did. Yet, warehousers were
more reluctant to reveal problems or errors to management than their counterpoints in the
mechanic workforce.
Fleet Operations Study
Chatham Consulting, Inc. 42
Warehousers gave slight lower rankings to their supervisors than the mechanics did. This was
more noticeable in the areas of problem solving and fairness.
SUGGESTIONS FOR IMPROVEMENT AND OTHER COMMENTS
The Warehousers were then given the opportunity to make suggestions for improvement and
provide other additional comments or opinions. Most dealt with management, staffing, and
standardization, as represented by the following list.
Management
• Greater sensitivity by management of the impact of their decisions on day-to-day operations.
Staff Size
• Reduce paperwork or add data entry help.
Standardization
• Greater fleet standardization is needed.
Fleet Operations Study
Chatham Consulting, Inc. 43
VII. MRU AND WORKLOAD ANALYSIS
This Chapter explains the application of the Maintenance and Repair Unit (MRU) analysis to the
City’s fleet operations for benchmarking and resource analysis purposes. It begins with a
general discussion of what MRU analysis is and how it is applied. This is followed by an
analysis of how to take into account the City’s unique circumstances. It then derives appropriate
MRU factors for the City’s fleet are and reviews how these factors compare to industry averages.
The Chapter concludes by applying MRU analysis to estimate workload, staffing and facility
capacities. As will be explained in the subsequent paragraphs, the MRU analysis indicated that
Fleet Services is understaffed by four to five (4 to 5) mechanics for its maintenance and repair
work. (Staffing for capital work such as upfitting, modifying, and aerial device rebuilding is
treated separately.)
MRU CONCEPTS
Maintenance and Repair Unit (MRU) is a vehicle equivalency technique that is used to estimate
staffing and other resource requirements in a fleet operation as well as to perform benchmarking
comparisons. This technique weights the number of vehicles and equipment units in a fleet
operation in proportion to their relative maintenance and repair requirements. By this we mean
the amount of mechanic time needed for normal maintenance and repair activity of a fleet, but
generally excluding such work as:
• Capital improvements including: modifications or customizations or aerial device rebuilding,
• Vehicle upfitting or make-ready work, and
• Accident repairs.
These types of work need to be separately accounted for in making comparisons or estimating
resource requirements.
Fleet Operations Study
Chatham Consulting, Inc. 44
To apply MRU analysis the fleet inventory is first categorized into various vehicle and
equipment classes. Then, the number of vehicles in each class is multiplied by the respective
maintenance and repair weighting factor to produce the number of MRUs by class of vehicle.
These class MRUs are summed to provide the total MRU size for the fleet. Next, the proportion
of work that is performed in house is taken into account to yield the number of in-house MRUs.
This last adjustment is particularly important when benchmarking fleet staff size among from
different cities.
Weighting Factors
The weighting factors used in MRU analysis can be derived in several ways. One way is to
survey fleet managers to obtain their best estimates of the annual amounts of mechanic hours
needed to maintain a particular class of vehicle. The median values of their responses are
calculated for each vehicle class. Then, the passenger car is set as the base unit by dividing its
mechanic hour requirement into the mechanic hour requirements for each of the other vehicle
and equipment classes. This division yields the respective weighting factors by vehicle and
equipment class including the passenger car which has a factor of unity (1.0).
Another approach is to study the maintenance histories of specific vehicle classes. Sometimes
these studies will take into account other factors such as vehicle utilization or age. Much depends
of the availability of data and the degree of precision desired.
Sometimes for convenience, we have used 20 hours per year as the base MRU unit. This
facilitates making comparisons among different years of benchmarking data where the number of
hours to maintain a passenger car changes (generally downward) from year to year. It also avoids
having to divide by an odd number of passenger car maintenance hours. If 20 hours per MRU
were used as the base unit, then it is possible for the MRU factor for a passenger car to be less
than or greater than 1.0. For example, a passenger car averaging 18 hours per year would have a
MRU factor of 0.9. Alternately, if the passenger car requires 24 hours per year, it would have a
factor of 1.2. This is why it is important to know what the base unit hours are when trying to
compare benchmarking results from one year to the next or from one fleet to the next.
Fleet Operations Study
Chatham Consulting, Inc. 45
Workload Estimating
In essence, MRUs are a proxy for workload and thus serve as the common denominator in
comparing resource requirements among fleets of different size and composition. These
comparisons can be made on either a macro or micro basis.
A macro comparison examines such indicators as the cost of maintenance and repair expenses
per MRU or fleet organization size per in-house MRU. This type was used in analyzing the
results of the benchmarking survey of comparable cities described in Chapter VIII.
A micro comparison first converts the MRU size into annual mechanic hours by multiplying the
number of in-house MRUs for the fleet times the average number of mechanic hours per MRU;
i.e. the number of hours required to maintain a passenger car. Then, these mechanic hours are
divided by the direct hours available per mechanic or other “wrench turning” personnel to yield
the amount of “wrench turning” staff needed by location or the entire fleet operation as well.
This was used in the analyses of this chapter.
Classifying Vehicles and Equipment
Similarly, data availability and the level of precision desired affect the approach to use in
classifying the fleet. Sometimes a high level approach will be used in order to obtain the
maximum degree of participation from fleet operations that are potentially interested in
participating in a benchmarking survey. In other situations, where data availability, time and
financial resources are less of a consideration, a more detailed list of vehicle and equipment
classes can be used. Both approaches were used in this study and will be explained in a
subsequent paragraph.
Cautionary Word
A word of caution needs to be introduced before examining the results of any MRU analysis.
While MRU analysis is a proven technique than enables managers to make resource comparisons
of fleets of different size and composition, it should not be alone used to evaluate a particular's
fleet operation. Instead, consideration should also be given to the operating environment, level
of service requirements, geography and other factors. Furthermore, it must be remembered that
Fleet Operations Study
Chatham Consulting, Inc. 46
MRU analysis is not a work standard analysis where very detailed increments of work are
studied. Rather MRU is a high level management tool that is used in conjunction with and not as
a substitute for good judgment.
WORKORDER ANALYSIS AND COMPARISONS MRU Classes and Factors Used In This Study For this study we used both high level and detailed vehicle classification systems in comparing
to Seattle to other fleet operations. The high level system was used to make comparisons of the
municipal fleets surveyed made, while the detailed system was used to make comparisons based
on work order analysis.
High Level Classifications
We used a high level classification system in collecting benchmarking data on other comparable
municipal fleets. The MRU computations involving these classes and factors are provided in
Chapter VII. We used 30 vehicle classes in this system and developed their MRU factors largely
from data contained in the “Fleet Maintenance Staffing Guide”, published in 2002 by the
National Association of Fleet Administrators. We supplemented these NAFA factors, which
were derived principally from municipal fleet operations, with additional factors for utility
vehicles like aerial trucks and digger derricks. These additional factors were derived from our
“2004 Utility Fleet Management and Benchmarking Survey.” These factors were based on one
MRU equaling 13 hours per year.
Detailed Classifications
We used a detailed classification system in analyzing workloads and resource requirements for
Seattle’s fleet operation and making comparisons with work order data we obtained from
CASCOR for public services fleets in the United States. This classification system is based on
vehicle type and weight and consists of over 50 classes. The factors were derived from
analyzing 535,000 work orders from 19 public service fleets across the country. One MRU for
these factors equates to 14.6 hours of work per year. We also supplemented the CASCOR data
Fleet Operations Study
Chatham Consulting, Inc. 47
with NAFA data in those instances where only a limited number of data points of vehicle were
available for a particular class.
Future MRU Planning
To assist Fleet Services in maintaining and developing an MRU classification system for the
future, we have developed an electronic file of the City’s fleet inventory that identifies both the
high and detailed classification for each vehicle and equipment unit. This was submitted under
separate cover and also includes the corresponding vehicles classes that the City used and two
suggested simplifications of that system for MRU analysis.
We found it necessary to simplify the existing class system since it contained 284 classes, which
are too numerous for adopting as MRU classes. The first simplification eliminated age
descriptors that were attached to nearly all of the classes and reduced their number to 174. The
second simplification eliminated size distinctions among similar vehicle classes and reduced the
number of classes to 124. For example, small, medium and full-size 4x4 utility vehicles were
consolidated into a single 4x4 utility vehicle class.
The Fleet Services Division may want to pursue other simplifications by analyzing work order
data to consolidate vehicle classes into fewer and fewer classes. The tradeoff is between
simplicity and ease of use versus greater precision. As noted before, it must be remembered that
MRU analysis is a high level management tool and not a detailed work standard system, and the
MRU classes we used to analyze the City and which are contained in the attached file have
worked very well.
MRU RESULTS FOR SEATTLE
Maintenance and Repair Hours By Vehicle Class
We analyzed Seattle work order data to compute the average number of hours per vehicle by
class as detailed in Exhibit 7. The first page of Exhibit 7 categorizes the total hours expended
during the year by vehicle class and reason for repair, while the second page divides these hours
Fleet Operations Study
Chatham Consulting, Inc. 48
by the numbers of vehicles serviced by class. Please note that there are only nominal numbers of
vehicle and equipment units assigned to the following shops and include such units as:
• Metal/machine shop: vehicle hoists and fuel station items;
• Capitalization shop: motorcycles; and,
• Tire shop: a few trucks.
The work order data were provided directly to us from the Fleet Services Division. When we
originally analyzed the work order data that Fleet Services submitted directly to CASCOR, we
found some records and repair reason information was missing. Therefore, we requested from
Fleet Services a complete set of work orders for 2006 for us to analyze.
Before we made any comparisons to other fleets, we separated out the amount of time that Fleet
Services mechanics spend in capital activities such as rebuilding, scheduled overhauls and
capitalization work. We did so since MRUs represent the amount of time or workload that is
needed for normal maintenance and repair activity and not capital work as previously noted.
As detailed indicated in Exhibit 7, the capital work accounts for 10 percent of the total hours
charged, while this percentage varies significantly by vehicle class. For most vehicle classes,
capital work is not a significant share the vehicle workload; but for about one-quarter of the
classes, capital work accounts for well over 10 percent of work load. For some classes, like
cranes and some aerial devices, scheduled overhauls accounted for over one-half of their
workload.
Industry Averages
Exhibit 8 compares by vehicle class what Seattle averages for maintenance and repair work to
those average by the public service industry. As indicated in the far right column, Seattle
averages fewer or about the same number of mechanic hours than the industry does in about one-
half of the vehicle classes. On the other hand, for specialty units like aerial devices and some
construction units, Seattle appears to average significantly more hours per year, even after
capitalization and overhaul times have been excluded. This can be attributable to the higher than
average age of such units.
Fleet Operations Study
Chatham Consulting, Inc. 49
The industry averages were also used to develop MRU factors by vehicle class. These were
found to range from 0.3 for a welder to 11.4 for a fire truck and were obtained by dividing
passenger car hours into total hours for each vehicle class. We then used these factors to forecast
maintenance and repair workload by location to estimate fleet staffing requirements.
Maintenance Versus Age Comparisons
We next compared the average vehicle class age of the Seattle fleet to the industry since age can
affect maintenance hours and costs for a vehicle. As tabulated in Exhibit 9, Seattle has a younger
fleet than the industry average in about one-half of the vehicle classes. However, for aerial
trucks, some cranes and construction equipment, the Seattle fleet is considerably older than the
industry. As a consequence, maintenance and repair hours can be expected to be higher than
average.
This effect can be seen in the graphs of Exhibit 10 which plot annual maintenance and repair
hours versus age for aerial trucks of Seattle and industry. What is most striking is that many of
Seattle’s aerial trucks are at the high end of the age range where the difference in mechanic hours
are most pronounced. At the extreme end, most of the other fleets begin to taper off their use of
older units and thus require less maintenance than otherwise. Interestingly, in the mid range of
the age spectrum, there seems to be less difference between Seattle and the other fleets regarding
maintenance and repair hours.
RESOURCE REQUIREMENTS
The MRU process can be used to estimate staffing and facility resources needed to maintain and
repair the fleet. This is usually a straight forward process of either: comparing staffing ratios per
in-house MRU; or, converting MRUs into mechanic hours and then dividing by number of direct
hours averaged by mechanics per year. This can be done for the entire fleet or on a specific
facility basis. Then, once the numbers of mechanics have been estimated, the number of work
bays needed can be estimated by applying mechanic to work-bays ratios.
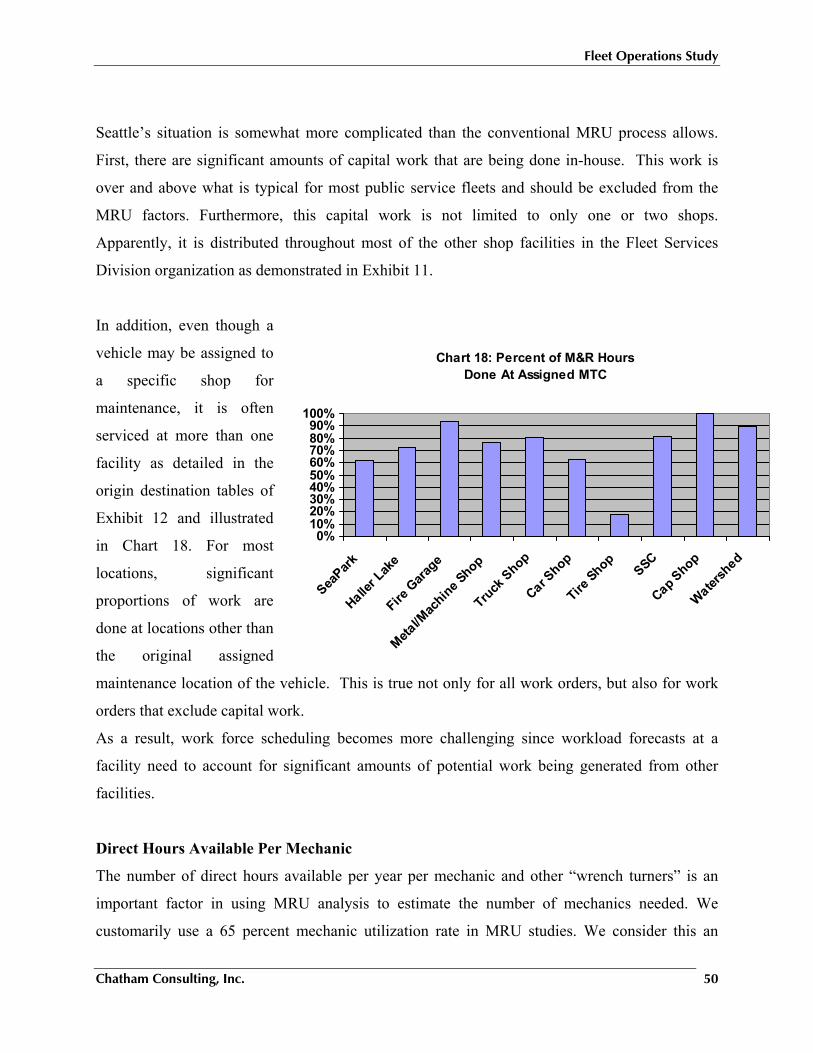
Fleet Operations Study
Chatham Consulting, Inc. 50
Seattle’s situation is somewhat more complicated than the conventional MRU process allows.
First, there are significant amounts of capital work that are being done in-house. This work is
over and above what is typical for most public service fleets and should be excluded from the
MRU factors. Furthermore, this capital work is not limited to only one or two shops.
Apparently, it is distributed throughout most of the other shop facilities in the Fleet Services
Division organization as demonstrated in Exhibit 11.
In addition, even though a
vehicle may be assigned to
a specific shop for
maintenance, it is often
serviced at more than one
facility as detailed in the
origin destination tables of
Exhibit 12 and illustrated
in Chart 18. For most
locations, significant
proportions of work are
done at locations other than
the original assigned
maintenance location of the vehicle. This is true not only for all work orders, but also for work
orders that exclude capital work.
As a result, work force scheduling becomes more challenging since workload forecasts at a
facility need to account for significant amounts of potential work being generated from other
facilities.
Direct Hours Available Per Mechanic
The number of direct hours available per year per mechanic and other “wrench turners” is an
important factor in using MRU analysis to estimate the number of mechanics needed. We
customarily use a 65 percent mechanic utilization rate in MRU studies. We consider this an
Chart 18: Percent of M&R HoursDone At Assigned MTC
0%10%20%30%40%50%60%70%80%90%
100%
SeaPark
Haller L
ake
Fire G
arage
Metal/M
achine S
hop
Truck
Shop
Car Shop
Tire Shop
SSC
Cap Shop
Watersh
ed
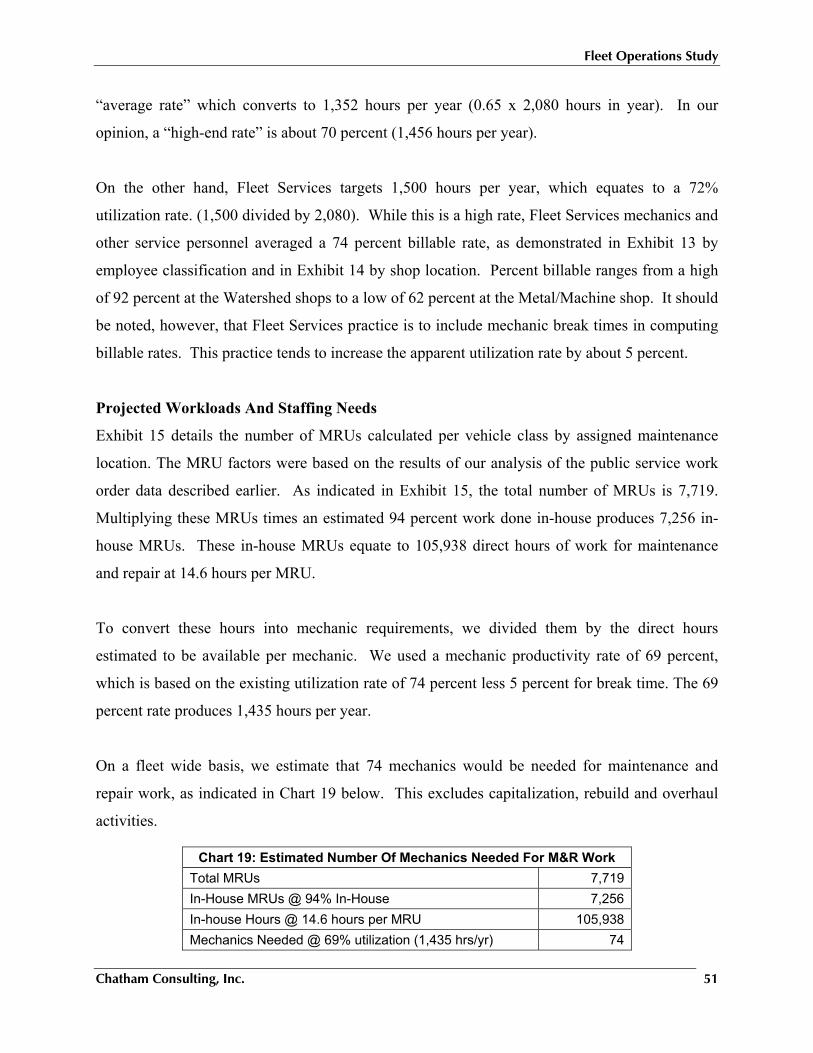
Fleet Operations Study
Chatham Consulting, Inc. 51
“average rate” which converts to 1,352 hours per year (0.65 x 2,080 hours in year). In our
opinion, a “high-end rate” is about 70 percent (1,456 hours per year).
On the other hand, Fleet Services targets 1,500 hours per year, which equates to a 72%
utilization rate. (1,500 divided by 2,080). While this is a high rate, Fleet Services mechanics and
other service personnel averaged a 74 percent billable rate, as demonstrated in Exhibit 13 by
employee classification and in Exhibit 14 by shop location. Percent billable ranges from a high
of 92 percent at the Watershed shops to a low of 62 percent at the Metal/Machine shop. It should
be noted, however, that Fleet Services practice is to include mechanic break times in computing
billable rates. This practice tends to increase the apparent utilization rate by about 5 percent.
Projected Workloads And Staffing Needs
Exhibit 15 details the number of MRUs calculated per vehicle class by assigned maintenance
location. The MRU factors were based on the results of our analysis of the public service work
order data described earlier. As indicated in Exhibit 15, the total number of MRUs is 7,719.
Multiplying these MRUs times an estimated 94 percent work done in-house produces 7,256 in-
house MRUs. These in-house MRUs equate to 105,938 direct hours of work for maintenance
and repair at 14.6 hours per MRU.
To convert these hours into mechanic requirements, we divided them by the direct hours
estimated to be available per mechanic. We used a mechanic productivity rate of 69 percent,
which is based on the existing utilization rate of 74 percent less 5 percent for break time. The 69
percent rate produces 1,435 hours per year.
On a fleet wide basis, we estimate that 74 mechanics would be needed for maintenance and
repair work, as indicated in Chart 19 below. This excludes capitalization, rebuild and overhaul
activities.
Chart 19: Estimated Number Of Mechanics Needed For M&R Work Total MRUs 7,719 In-House MRUs @ 94% In-House 7,256 In-house Hours @ 14.6 hours per MRU 105,938 Mechanics Needed @ 69% utilization (1,435 hrs/yr) 74
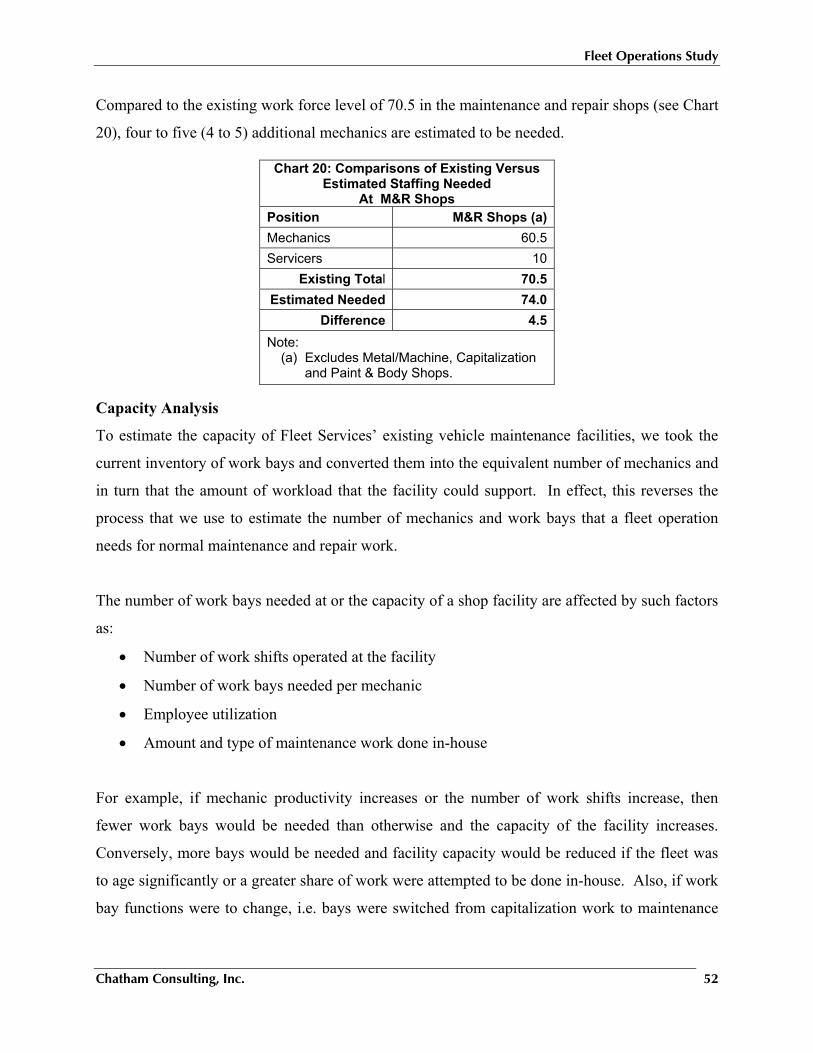
Fleet Operations Study
Chatham Consulting, Inc. 52
Compared to the existing work force level of 70.5 in the maintenance and repair shops (see Chart
20), four to five (4 to 5) additional mechanics are estimated to be needed.
Capacity Analysis
To estimate the capacity of Fleet Services’ existing vehicle maintenance facilities, we took the
current inventory of work bays and converted them into the equivalent number of mechanics and
in turn that the amount of workload that the facility could support. In effect, this reverses the
process that we use to estimate the number of mechanics and work bays that a fleet operation
needs for normal maintenance and repair work.
The number of work bays needed at or the capacity of a shop facility are affected by such factors
as:
• Number of work shifts operated at the facility
• Number of work bays needed per mechanic
• Employee utilization
• Amount and type of maintenance work done in-house
For example, if mechanic productivity increases or the number of work shifts increase, then
fewer work bays would be needed than otherwise and the capacity of the facility increases.
Conversely, more bays would be needed and facility capacity would be reduced if the fleet was
to age significantly or a greater share of work were attempted to be done in-house. Also, if work
bay functions were to change, i.e. bays were switched from capitalization work to maintenance
Chart 20: Comparisons of Existing Versus Estimated Staffing Needed
At M&R Shops Position M&R Shops (a)Mechanics 60.5Servicers 10
Existing Total 70.5Estimated Needed 74.0
Difference 4.5Note:
(a) Excludes Metal/Machine, Capitalization and Paint & Body Shops.
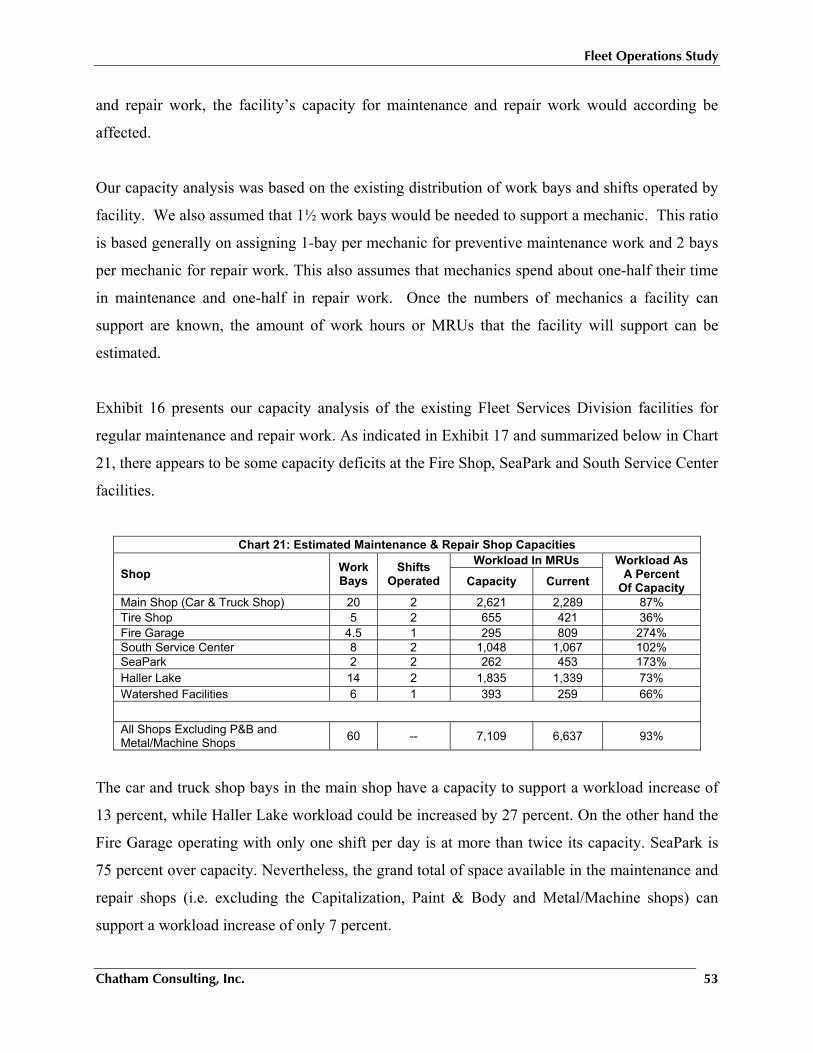
Fleet Operations Study
Chatham Consulting, Inc. 53
and repair work, the facility’s capacity for maintenance and repair work would according be
affected.
Our capacity analysis was based on the existing distribution of work bays and shifts operated by
facility. We also assumed that 1½ work bays would be needed to support a mechanic. This ratio
is based generally on assigning 1-bay per mechanic for preventive maintenance work and 2 bays
per mechanic for repair work. This also assumes that mechanics spend about one-half their time
in maintenance and one-half in repair work. Once the numbers of mechanics a facility can
support are known, the amount of work hours or MRUs that the facility will support can be
estimated.
Exhibit 16 presents our capacity analysis of the existing Fleet Services Division facilities for
regular maintenance and repair work. As indicated in Exhibit 17 and summarized below in Chart
21, there appears to be some capacity deficits at the Fire Shop, SeaPark and South Service Center
facilities.
Chart 21: Estimated Maintenance & Repair Shop Capacities
Shop Work Bays
Shifts Operated
Workload In MRUs Workload As A Percent
Of Capacity Capacity Current
Main Shop (Car & Truck Shop) 20 2 2,621 2,289 87% Tire Shop 5 2 655 421 36% Fire Garage 4.5 1 295 809 274% South Service Center 8 2 1,048 1,067 102% SeaPark 2 2 262 453 173% Haller Lake 14 2 1,835 1,339 73% Watershed Facilities 6 1 393 259 66%
All Shops Excluding P&B and Metal/Machine Shops 60 -- 7,109 6,637 93%
The car and truck shop bays in the main shop have a capacity to support a workload increase of
13 percent, while Haller Lake workload could be increased by 27 percent. On the other hand the
Fire Garage operating with only one shift per day is at more than twice its capacity. SeaPark is
75 percent over capacity. Nevertheless, the grand total of space available in the maintenance and
repair shops (i.e. excluding the Capitalization, Paint & Body and Metal/Machine shops) can
support a workload increase of only 7 percent.
Fleet Operations Study
Chatham Consulting, Inc. 54
Capacity can be added without constructing new facilities by shifting some of the workload from
one facility to another, adding a work shift to the Fire Shop or freeing up some space in the Fire
Shop as described in Chapter IX, Facilities Assessment.
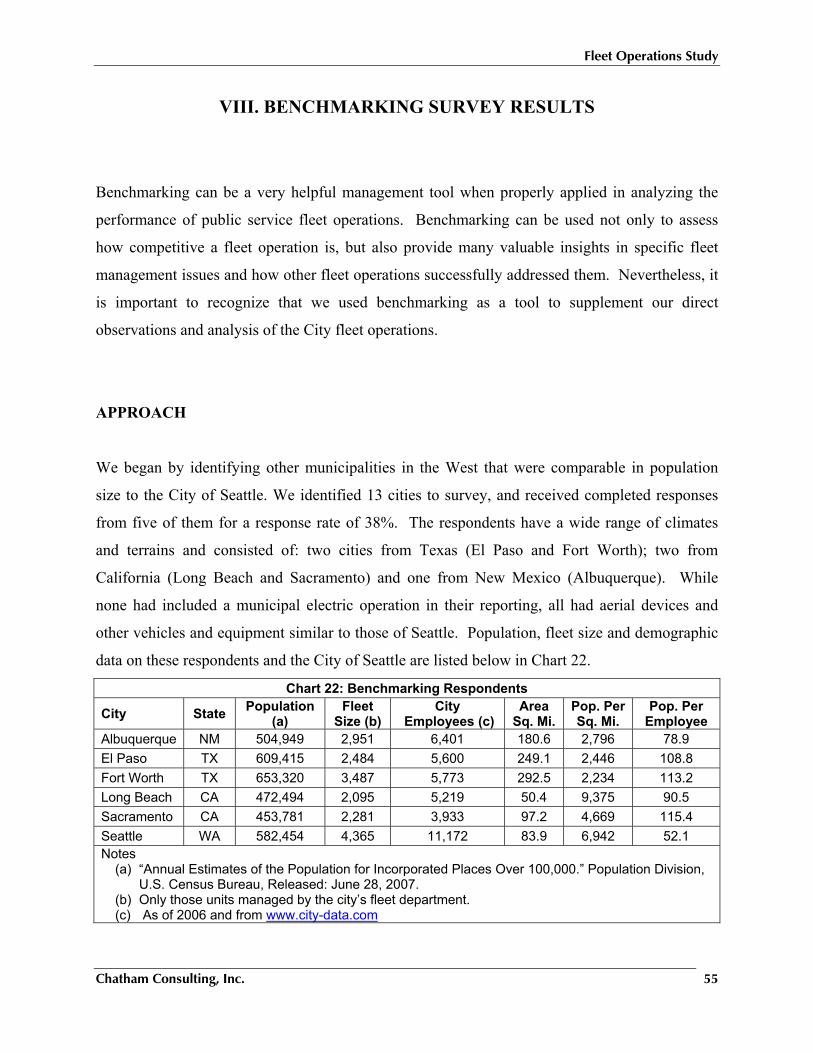
Fleet Operations Study
Chatham Consulting, Inc. 55
VIII. BENCHMARKING SURVEY RESULTS
Benchmarking can be a very helpful management tool when properly applied in analyzing the
performance of public service fleet operations. Benchmarking can be used not only to assess
how competitive a fleet operation is, but also provide many valuable insights in specific fleet
management issues and how other fleet operations successfully addressed them. Nevertheless, it
is important to recognize that we used benchmarking as a tool to supplement our direct
observations and analysis of the City fleet operations.
APPROACH
We began by identifying other municipalities in the West that were comparable in population
size to the City of Seattle. We identified 13 cities to survey, and received completed responses
from five of them for a response rate of 38%. The respondents have a wide range of climates
and terrains and consisted of: two cities from Texas (El Paso and Fort Worth); two from
California (Long Beach and Sacramento) and one from New Mexico (Albuquerque). While
none had included a municipal electric operation in their reporting, all had aerial devices and
other vehicles and equipment similar to those of Seattle. Population, fleet size and demographic
data on these respondents and the City of Seattle are listed below in Chart 22.
Chart 22: Benchmarking Respondents
City State Population (a)
Fleet Size (b)
City Employees (c)
Area Sq. Mi.
Pop. Per Sq. Mi.
Pop. Per Employee
Albuquerque NM 504,949 2,951 6,401 180.6 2,796 78.9 El Paso TX 609,415 2,484 5,600 249.1 2,446 108.8 Fort Worth TX 653,320 3,487 5,773 292.5 2,234 113.2 Long Beach CA 472,494 2,095 5,219 50.4 9,375 90.5 Sacramento CA 453,781 2,281 3,933 97.2 4,669 115.4 Seattle WA 582,454 4,365 11,172 83.9 6,942 52.1 Notes
(a) “Annual Estimates of the Population for Incorporated Places Over 100,000.” Population Division, U.S. Census Bureau, Released: June 28, 2007.
(b) Only those units managed by the city’s fleet department. (c) As of 2006 and from www.city-data.com
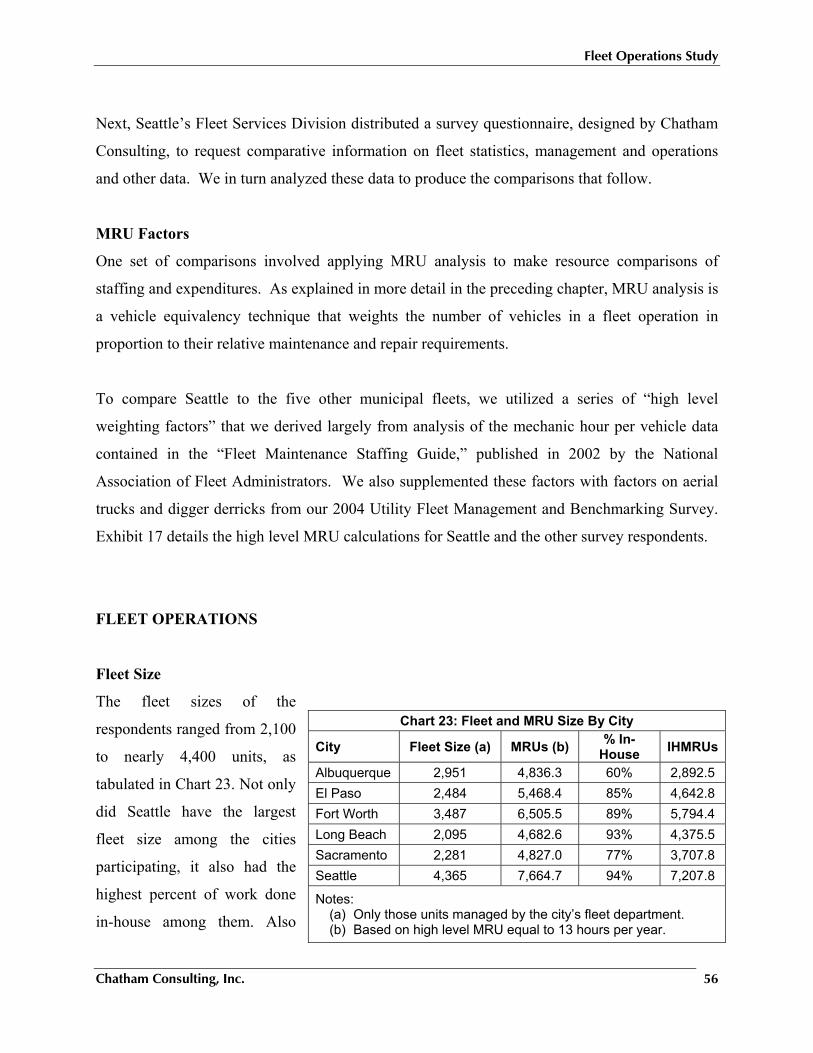
Fleet Operations Study
Chatham Consulting, Inc. 56
Next, Seattle’s Fleet Services Division distributed a survey questionnaire, designed by Chatham
Consulting, to request comparative information on fleet statistics, management and operations
and other data. We in turn analyzed these data to produce the comparisons that follow.
MRU Factors
One set of comparisons involved applying MRU analysis to make resource comparisons of
staffing and expenditures. As explained in more detail in the preceding chapter, MRU analysis is
a vehicle equivalency technique that weights the number of vehicles in a fleet operation in
proportion to their relative maintenance and repair requirements.
To compare Seattle to the five other municipal fleets, we utilized a series of “high level
weighting factors” that we derived largely from analysis of the mechanic hour per vehicle data
contained in the “Fleet Maintenance Staffing Guide,” published in 2002 by the National
Association of Fleet Administrators. We also supplemented these factors with factors on aerial
trucks and digger derricks from our 2004 Utility Fleet Management and Benchmarking Survey.
Exhibit 17 details the high level MRU calculations for Seattle and the other survey respondents.
FLEET OPERATIONS
Fleet Size
The fleet sizes of the
respondents ranged from 2,100
to nearly 4,400 units, as
tabulated in Chart 23. Not only
did Seattle have the largest
fleet size among the cities
participating, it also had the
highest percent of work done
in-house among them. Also
Chart 23: Fleet and MRU Size By City
City Fleet Size (a) MRUs (b) % In-House IHMRUs
Albuquerque 2,951 4,836.3 60% 2,892.5 El Paso 2,484 5,468.4 85% 4,642.8 Fort Worth 3,487 6,505.5 89% 5,794.4 Long Beach 2,095 4,682.6 93% 4,375.5 Sacramento 2,281 4,827.0 77% 3,707.8 Seattle 4,365 7,664.7 94% 7,207.8
Notes: (a) Only those units managed by the city’s fleet department. (b) Based on high level MRU equal to 13 hours per year.
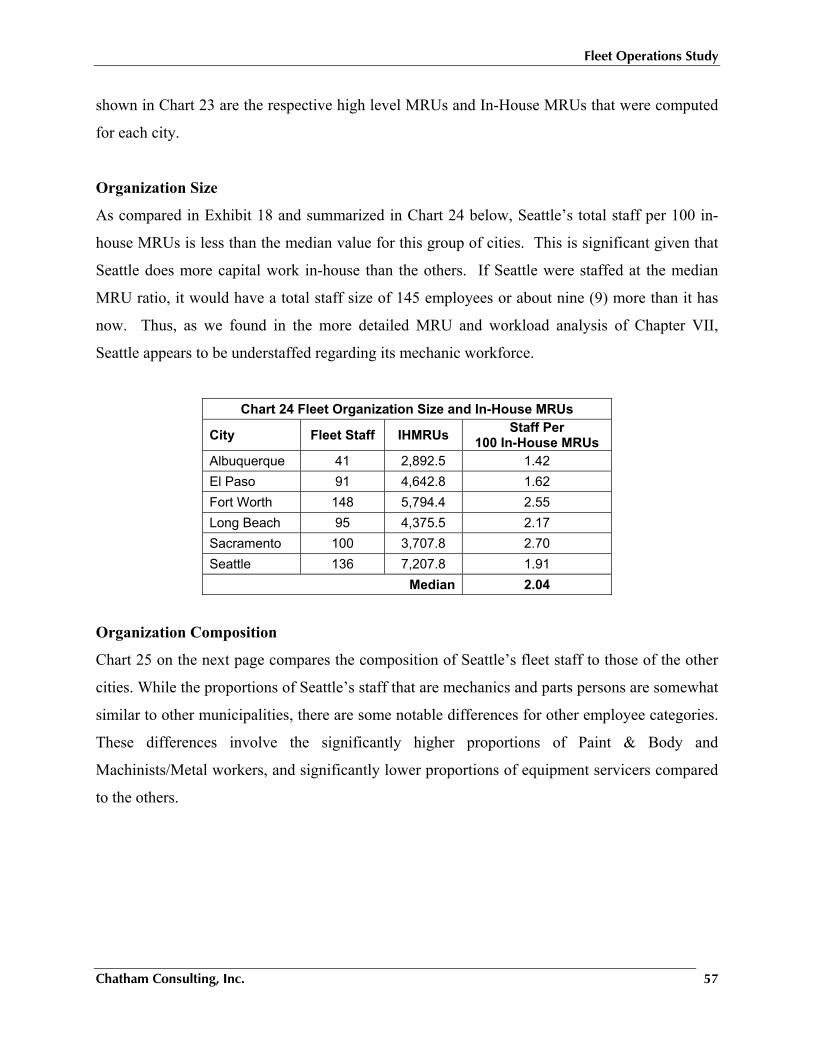
Fleet Operations Study
Chatham Consulting, Inc. 57
shown in Chart 23 are the respective high level MRUs and In-House MRUs that were computed
for each city.
Organization Size
As compared in Exhibit 18 and summarized in Chart 24 below, Seattle’s total staff per 100 in-
house MRUs is less than the median value for this group of cities. This is significant given that
Seattle does more capital work in-house than the others. If Seattle were staffed at the median
MRU ratio, it would have a total staff size of 145 employees or about nine (9) more than it has
now. Thus, as we found in the more detailed MRU and workload analysis of Chapter VII,
Seattle appears to be understaffed regarding its mechanic workforce.
Chart 24 Fleet Organization Size and In-House MRUs
City Fleet Staff IHMRUs Staff Per 100 In-House MRUs
Albuquerque 41 2,892.5 1.42 El Paso 91 4,642.8 1.62 Fort Worth 148 5,794.4 2.55 Long Beach 95 4,375.5 2.17 Sacramento 100 3,707.8 2.70 Seattle 136 7,207.8 1.91
Median 2.04
Organization Composition
Chart 25 on the next page compares the composition of Seattle’s fleet staff to those of the other
cities. While the proportions of Seattle’s staff that are mechanics and parts persons are somewhat
similar to other municipalities, there are some notable differences for other employee categories.
These differences involve the significantly higher proportions of Paint & Body and
Machinists/Metal workers, and significantly lower proportions of equipment servicers compared
to the others.
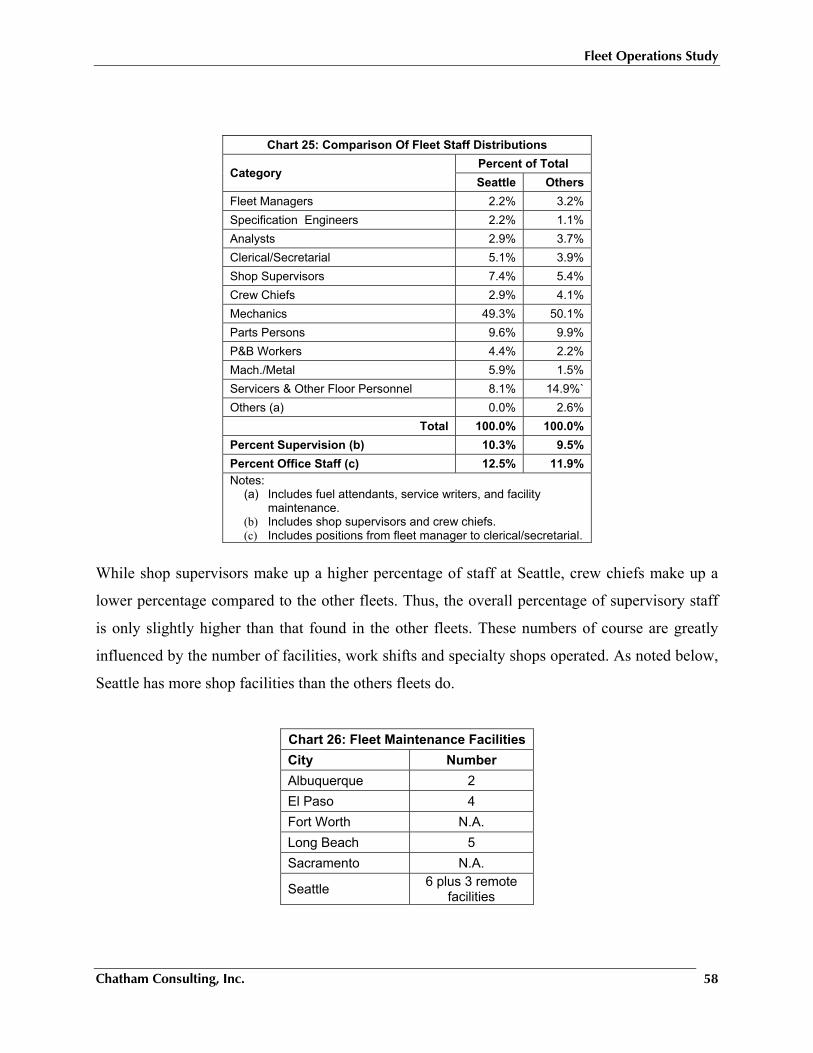
Fleet Operations Study
Chatham Consulting, Inc. 58
While shop supervisors make up a higher percentage of staff at Seattle, crew chiefs make up a
lower percentage compared to the other fleets. Thus, the overall percentage of supervisory staff
is only slightly higher than that found in the other fleets. These numbers of course are greatly
influenced by the number of facilities, work shifts and specialty shops operated. As noted below,
Seattle has more shop facilities than the others fleets do.
Chart 26: Fleet Maintenance FacilitiesCity Number Albuquerque 2 El Paso 4 Fort Worth N.A. Long Beach 5 Sacramento N.A.
Seattle 6 plus 3 remote facilities
Chart 25: Comparison Of Fleet Staff Distributions
Category Percent of Total Seattle Others
Fleet Managers 2.2% 3.2% Specification Engineers 2.2% 1.1% Analysts 2.9% 3.7% Clerical/Secretarial 5.1% 3.9% Shop Supervisors 7.4% 5.4% Crew Chiefs 2.9% 4.1% Mechanics 49.3% 50.1% Parts Persons 9.6% 9.9% P&B Workers 4.4% 2.2% Mach./Metal 5.9% 1.5% Servicers & Other Floor Personnel 8.1% 14.9%` Others (a) 0.0% 2.6%
Total 100.0% 100.0% Percent Supervision (b) 10.3% 9.5% Percent Office Staff (c) 12.5% 11.9% Notes:
(a) Includes fuel attendants, service writers, and facility maintenance.
(b) Includes shop supervisors and crew chiefs. (c) Includes positions from fleet manager to clerical/secretarial.
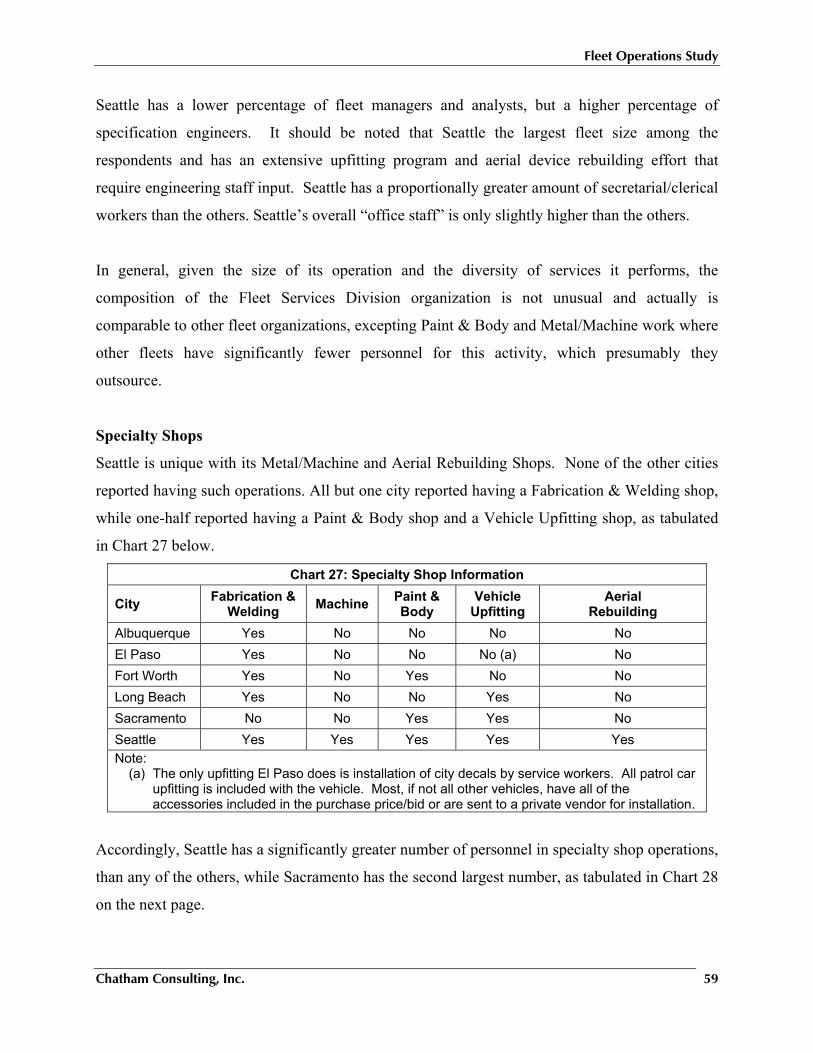
Fleet Operations Study
Chatham Consulting, Inc. 59
Seattle has a lower percentage of fleet managers and analysts, but a higher percentage of
specification engineers. It should be noted that Seattle the largest fleet size among the
respondents and has an extensive upfitting program and aerial device rebuilding effort that
require engineering staff input. Seattle has a proportionally greater amount of secretarial/clerical
workers than the others. Seattle’s overall “office staff” is only slightly higher than the others.
In general, given the size of its operation and the diversity of services it performs, the
composition of the Fleet Services Division organization is not unusual and actually is
comparable to other fleet organizations, excepting Paint & Body and Metal/Machine work where
other fleets have significantly fewer personnel for this activity, which presumably they
outsource.
Specialty Shops
Seattle is unique with its Metal/Machine and Aerial Rebuilding Shops. None of the other cities
reported having such operations. All but one city reported having a Fabrication & Welding shop,
while one-half reported having a Paint & Body shop and a Vehicle Upfitting shop, as tabulated
in Chart 27 below.
Chart 27: Specialty Shop Information
City Fabrication & Welding Machine Paint &
Body Vehicle
Upfitting Aerial
Rebuilding Albuquerque Yes No No No No El Paso Yes No No No (a) No Fort Worth Yes No Yes No No Long Beach Yes No No Yes No Sacramento No No Yes Yes No Seattle Yes Yes Yes Yes Yes Note:
(a) The only upfitting El Paso does is installation of city decals by service workers. All patrol car upfitting is included with the vehicle. Most, if not all other vehicles, have all of the accessories included in the purchase price/bid or are sent to a private vendor for installation.
Accordingly, Seattle has a significantly greater number of personnel in specialty shop operations,
than any of the others, while Sacramento has the second largest number, as tabulated in Chart 28
on the next page.
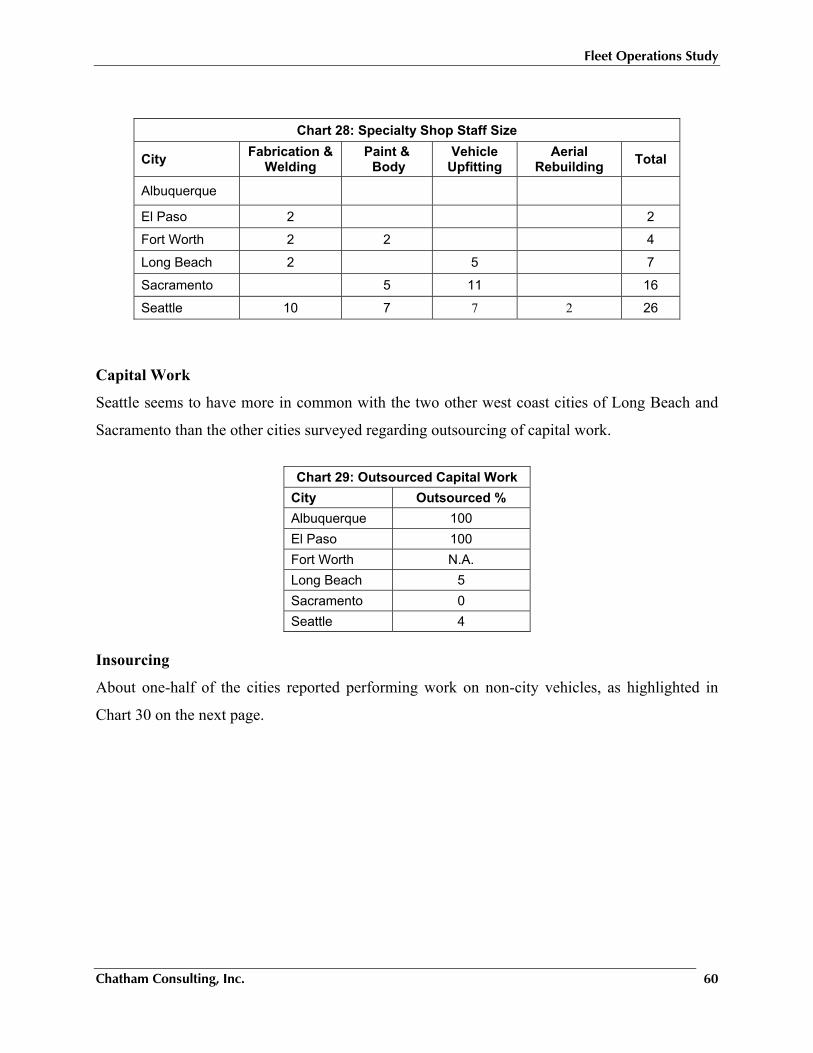
Fleet Operations Study
Chatham Consulting, Inc. 60
Chart 28: Specialty Shop Staff Size
City Fabrication & Welding
Paint & Body
Vehicle Upfitting
Aerial Rebuilding Total
Albuquerque
El Paso 2 2
Fort Worth 2 2 4
Long Beach 2 5 7
Sacramento 5 11 16
Seattle 10 7 7 2 26
Capital Work
Seattle seems to have more in common with the two other west coast cities of Long Beach and
Sacramento than the other cities surveyed regarding outsourcing of capital work.
Chart 29: Outsourced Capital Work
City Outsourced % Albuquerque 100 El Paso 100 Fort Worth N.A. Long Beach 5 Sacramento 0 Seattle 4
Insourcing
About one-half of the cities reported performing work on non-city vehicles, as highlighted in
Chart 30 on the next page.
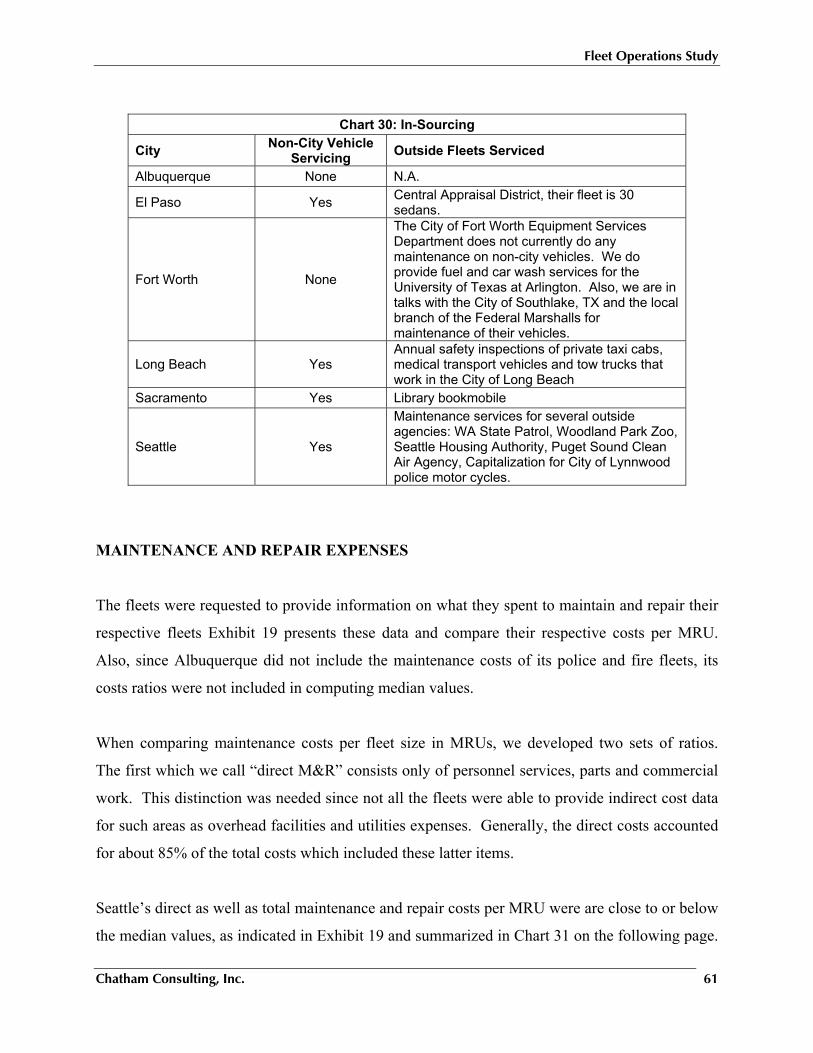
Fleet Operations Study
Chatham Consulting, Inc. 61
Chart 30: In-Sourcing
City Non-City Vehicle Servicing Outside Fleets Serviced
Albuquerque None N.A.
El Paso Yes Central Appraisal District, their fleet is 30 sedans.
Fort Worth None
The City of Fort Worth Equipment Services Department does not currently do any maintenance on non-city vehicles. We do provide fuel and car wash services for the University of Texas at Arlington. Also, we are in talks with the City of Southlake, TX and the local branch of the Federal Marshalls for maintenance of their vehicles.
Long Beach Yes Annual safety inspections of private taxi cabs, medical transport vehicles and tow trucks that work in the City of Long Beach
Sacramento Yes Library bookmobile
Seattle Yes
Maintenance services for several outside agencies: WA State Patrol, Woodland Park Zoo, Seattle Housing Authority, Puget Sound Clean Air Agency, Capitalization for City of Lynnwood police motor cycles.
MAINTENANCE AND REPAIR EXPENSES
The fleets were requested to provide information on what they spent to maintain and repair their
respective fleets Exhibit 19 presents these data and compare their respective costs per MRU.
Also, since Albuquerque did not include the maintenance costs of its police and fire fleets, its
costs ratios were not included in computing median values.
When comparing maintenance costs per fleet size in MRUs, we developed two sets of ratios.
The first which we call “direct M&R” consists only of personnel services, parts and commercial
work. This distinction was needed since not all the fleets were able to provide indirect cost data
for such areas as overhead facilities and utilities expenses. Generally, the direct costs accounted
for about 85% of the total costs which included these latter items.
Seattle’s direct as well as total maintenance and repair costs per MRU were are close to or below
the median values, as indicated in Exhibit 19 and summarized in Chart 31 on the following page.
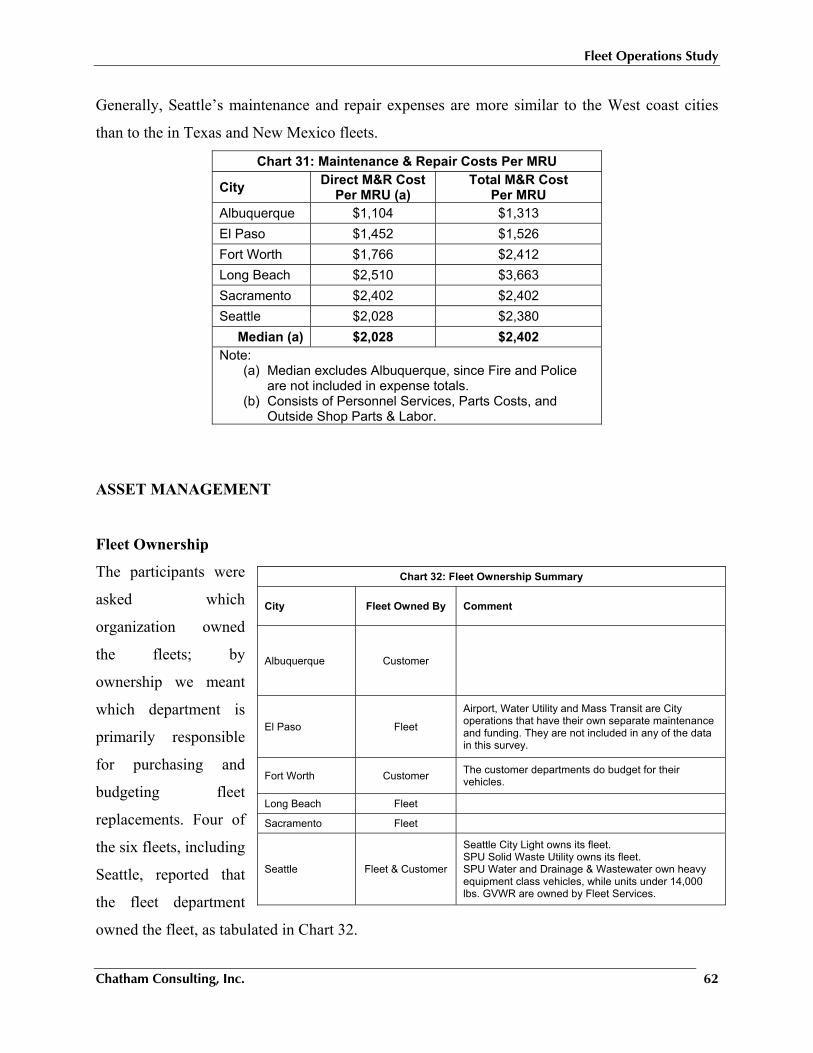
Fleet Operations Study
Chatham Consulting, Inc. 62
Generally, Seattle’s maintenance and repair expenses are more similar to the West coast cities
than to the in Texas and New Mexico fleets.
Chart 31: Maintenance & Repair Costs Per MRU
City Direct M&R Cost Per MRU (a)
Total M&R Cost Per MRU
Albuquerque $1,104 $1,313 El Paso $1,452 $1,526 Fort Worth $1,766 $2,412 Long Beach $2,510 $3,663 Sacramento $2,402 $2,402 Seattle $2,028 $2,380
Median (a) $2,028 $2,402 Note:
(a) Median excludes Albuquerque, since Fire and Police are not included in expense totals.
(b) Consists of Personnel Services, Parts Costs, and Outside Shop Parts & Labor.
ASSET MANAGEMENT
Fleet Ownership
The participants were
asked which
organization owned
the fleets; by
ownership we meant
which department is
primarily responsible
for purchasing and
budgeting fleet
replacements. Four of
the six fleets, including
Seattle, reported that
the fleet department
owned the fleet, as tabulated in Chart 32.
Chart 32: Fleet Ownership Summary
City Fleet Owned By Comment
Albuquerque Customer
El Paso Fleet
Airport, Water Utility and Mass Transit are City operations that have their own separate maintenance and funding. They are not included in any of the data in this survey.
Fort Worth Customer The customer departments do budget for their vehicles.
Long Beach Fleet
Sacramento Fleet
Seattle Fleet & Customer
Seattle City Light owns its fleet. SPU Solid Waste Utility owns its fleet. SPU Water and Drainage & Wastewater own heavy equipment class vehicles, while units under 14,000 lbs. GVWR are owned by Fleet Services.
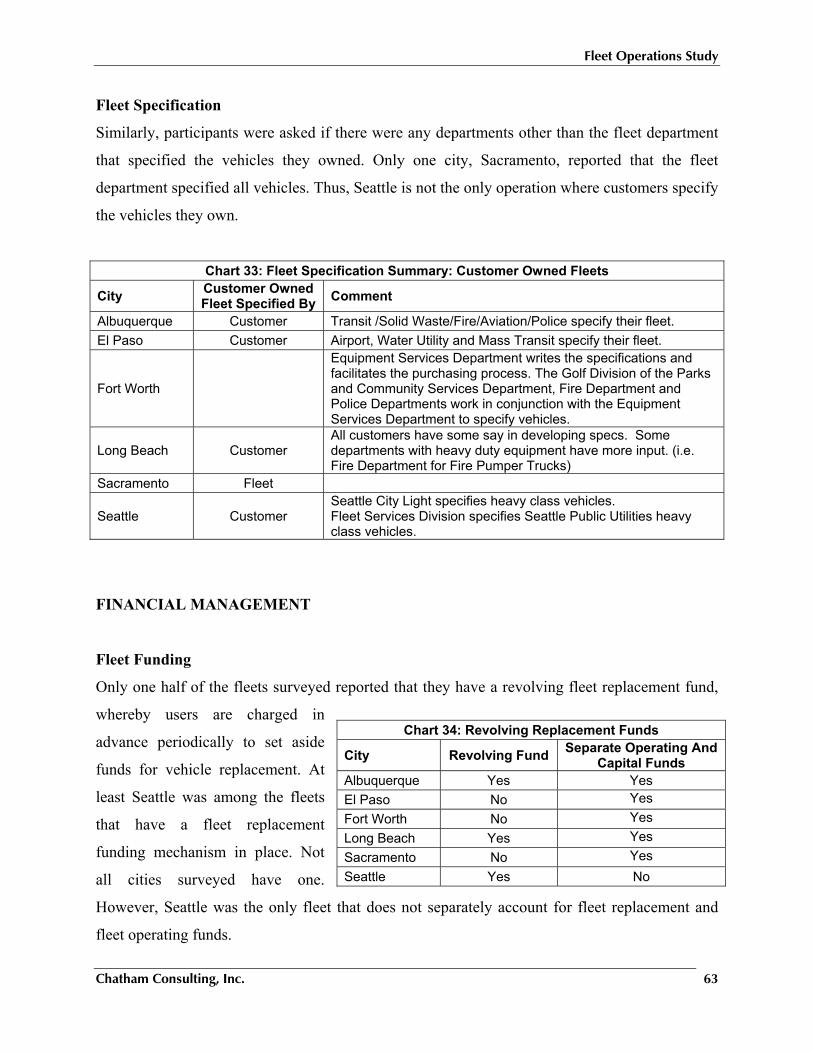
Fleet Operations Study
Chatham Consulting, Inc. 63
Fleet Specification
Similarly, participants were asked if there were any departments other than the fleet department
that specified the vehicles they owned. Only one city, Sacramento, reported that the fleet
department specified all vehicles. Thus, Seattle is not the only operation where customers specify
the vehicles they own.
Chart 33: Fleet Specification Summary: Customer Owned Fleets
City Customer Owned Fleet Specified By Comment
Albuquerque Customer Transit /Solid Waste/Fire/Aviation/Police specify their fleet. El Paso Customer Airport, Water Utility and Mass Transit specify their fleet.
Fort Worth
Equipment Services Department writes the specifications and facilitates the purchasing process. The Golf Division of the Parks and Community Services Department, Fire Department and Police Departments work in conjunction with the Equipment Services Department to specify vehicles.
Long Beach Customer All customers have some say in developing specs. Some departments with heavy duty equipment have more input. (i.e. Fire Department for Fire Pumper Trucks)
Sacramento Fleet
Seattle Customer Seattle City Light specifies heavy class vehicles. Fleet Services Division specifies Seattle Public Utilities heavy class vehicles.
FINANCIAL MANAGEMENT
Fleet Funding
Only one half of the fleets surveyed reported that they have a revolving fleet replacement fund,
whereby users are charged in
advance periodically to set aside
funds for vehicle replacement. At
least Seattle was among the fleets
that have a fleet replacement
funding mechanism in place. Not
all cities surveyed have one.
However, Seattle was the only fleet that does not separately account for fleet replacement and
fleet operating funds.
Chart 34: Revolving Replacement Funds
City Revolving Fund Separate Operating And Capital Funds
Albuquerque Yes Yes El Paso No Yes Fort Worth No Yes Long Beach Yes Yes Sacramento No Yes Seattle Yes No
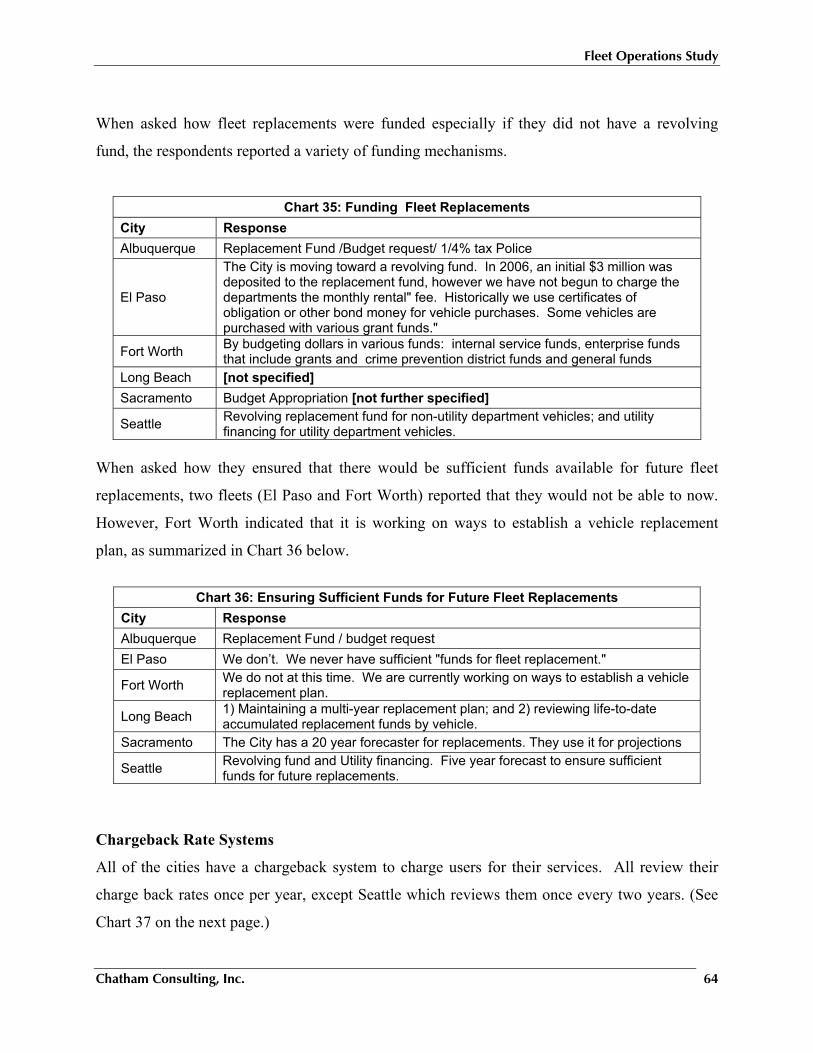
Fleet Operations Study
Chatham Consulting, Inc. 64
When asked how fleet replacements were funded especially if they did not have a revolving
fund, the respondents reported a variety of funding mechanisms.
Chart 35: Funding Fleet Replacements City Response Albuquerque Replacement Fund /Budget request/ 1/4% tax Police
El Paso
The City is moving toward a revolving fund. In 2006, an initial $3 million was deposited to the replacement fund, however we have not begun to charge the departments the monthly rental" fee. Historically we use certificates of obligation or other bond money for vehicle purchases. Some vehicles are purchased with various grant funds."
Fort Worth By budgeting dollars in various funds: internal service funds, enterprise funds that include grants and crime prevention district funds and general funds
Long Beach [not specified] Sacramento Budget Appropriation [not further specified]
Seattle Revolving replacement fund for non-utility department vehicles; and utility financing for utility department vehicles.
When asked how they ensured that there would be sufficient funds available for future fleet
replacements, two fleets (El Paso and Fort Worth) reported that they would not be able to now.
However, Fort Worth indicated that it is working on ways to establish a vehicle replacement
plan, as summarized in Chart 36 below.
Chart 36: Ensuring Sufficient Funds for Future Fleet Replacements
City Response Albuquerque Replacement Fund / budget request El Paso We don’t. We never have sufficient "funds for fleet replacement."
Fort Worth We do not at this time. We are currently working on ways to establish a vehicle replacement plan.
Long Beach 1) Maintaining a multi-year replacement plan; and 2) reviewing life-to-date accumulated replacement funds by vehicle.
Sacramento The City has a 20 year forecaster for replacements. They use it for projections
Seattle Revolving fund and Utility financing. Five year forecast to ensure sufficient funds for future replacements.
Chargeback Rate Systems
All of the cities have a chargeback system to charge users for their services. All review their
charge back rates once per year, except Seattle which reviews them once every two years. (See
Chart 37 on the next page.)
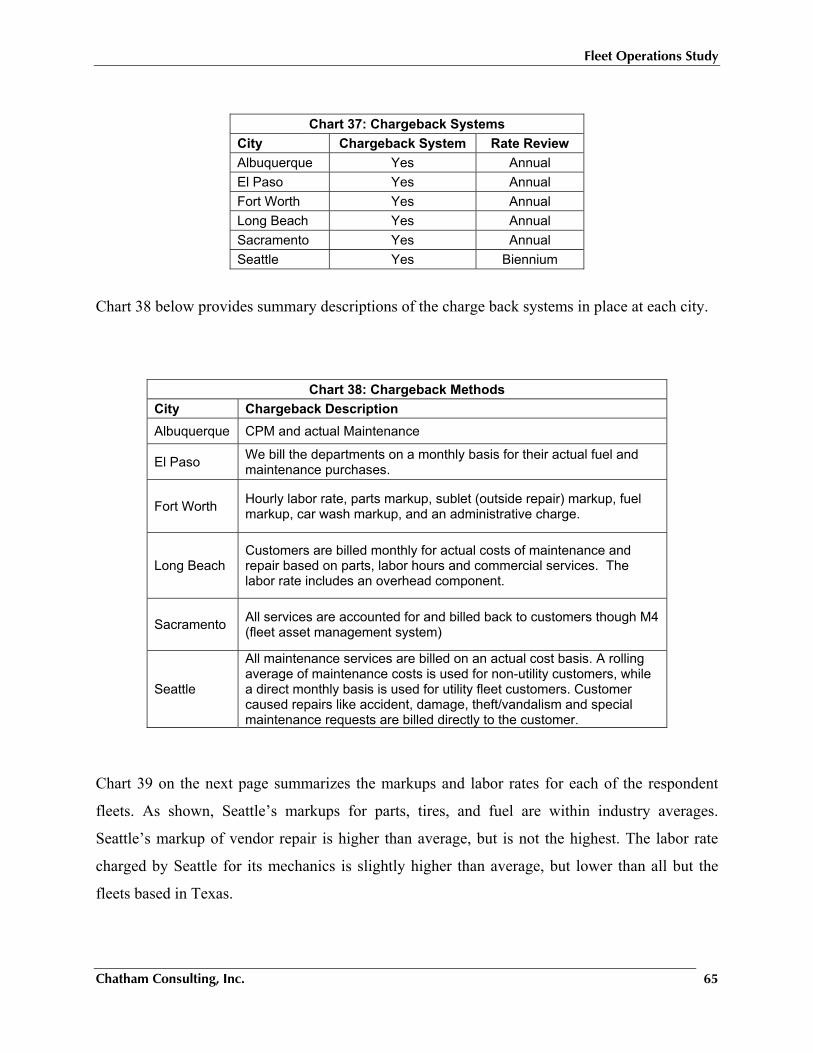
Fleet Operations Study
Chatham Consulting, Inc. 65
Chart 37: Chargeback Systems
City Chargeback System Rate Review Albuquerque Yes Annual El Paso Yes AnnualFort Worth Yes AnnualLong Beach Yes AnnualSacramento Yes AnnualSeattle Yes Biennium
Chart 38 below provides summary descriptions of the charge back systems in place at each city.
Chart 38: Chargeback Methods City Chargeback Description Albuquerque CPM and actual Maintenance
El Paso We bill the departments on a monthly basis for their actual fuel and maintenance purchases.
Fort Worth Hourly labor rate, parts markup, sublet (outside repair) markup, fuel markup, car wash markup, and an administrative charge.
Long Beach Customers are billed monthly for actual costs of maintenance and repair based on parts, labor hours and commercial services. The labor rate includes an overhead component.
Sacramento All services are accounted for and billed back to customers though M4 (fleet asset management system)
Seattle
All maintenance services are billed on an actual cost basis. A rolling average of maintenance costs is used for non-utility customers, while a direct monthly basis is used for utility fleet customers. Customer caused repairs like accident, damage, theft/vandalism and special maintenance requests are billed directly to the customer.
Chart 39 on the next page summarizes the markups and labor rates for each of the respondent
fleets. As shown, Seattle’s markups for parts, tires, and fuel are within industry averages.
Seattle’s markup of vendor repair is higher than average, but is not the highest. The labor rate
charged by Seattle for its mechanics is slightly higher than average, but lower than all but the
fleets based in Texas.
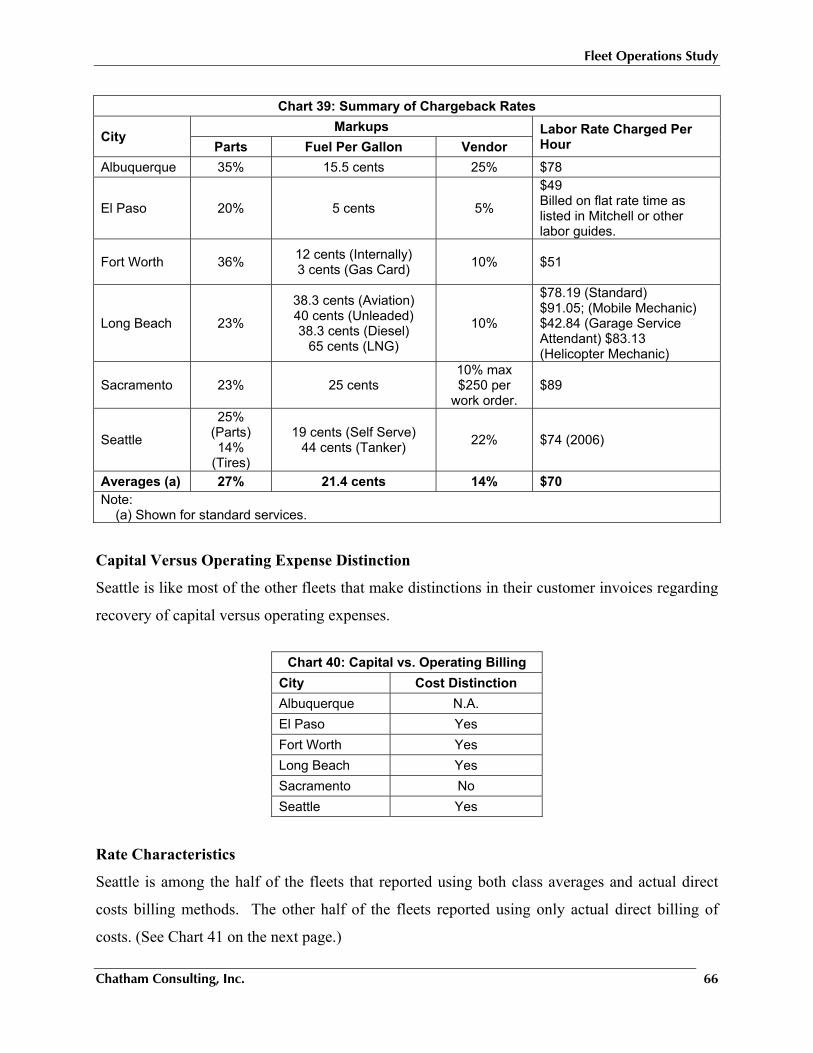
Fleet Operations Study
Chatham Consulting, Inc. 66
Chart 39: Summary of Chargeback Rates
City Markups Labor Rate Charged Per
Hour Parts Fuel Per Gallon Vendor Albuquerque 35% 15.5 cents 25% $78
El Paso 20% 5 cents 5%
$49 Billed on flat rate time as listed in Mitchell or other labor guides.
Fort Worth 36% 12 cents (Internally) 3 cents (Gas Card) 10% $51
Long Beach 23%
38.3 cents (Aviation) 40 cents (Unleaded) 38.3 cents (Diesel)
65 cents (LNG)
10%
$78.19 (Standard) $91.05; (Mobile Mechanic) $42.84 (Garage Service Attendant) $83.13 (Helicopter Mechanic)
Sacramento 23% 25 cents 10% max $250 per
work order. $89
Seattle
25% (Parts) 14%
(Tires)
19 cents (Self Serve) 44 cents (Tanker) 22% $74 (2006)
Averages (a) 27% 21.4 cents 14% $70 Note: (a) Shown for standard services.
Capital Versus Operating Expense Distinction
Seattle is like most of the other fleets that make distinctions in their customer invoices regarding
recovery of capital versus operating expenses.
Chart 40: Capital vs. Operating Billing
City Cost Distinction Albuquerque N.A. El Paso Yes Fort Worth Yes Long Beach Yes Sacramento No Seattle Yes
Rate Characteristics
Seattle is among the half of the fleets that reported using both class averages and actual direct
costs billing methods. The other half of the fleets reported using only actual direct billing of
costs. (See Chart 41 on the next page.)
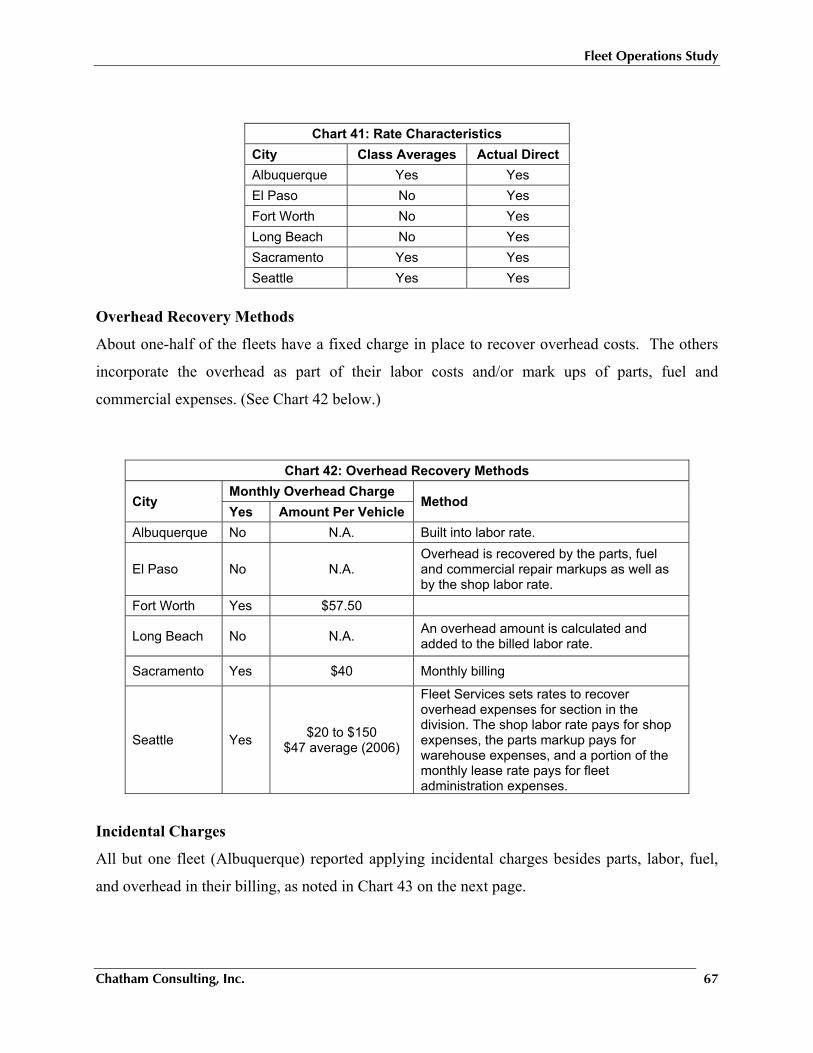
Fleet Operations Study
Chatham Consulting, Inc. 67
Chart 41: Rate Characteristics City Class Averages Actual Direct Albuquerque Yes Yes El Paso No Yes Fort Worth No Yes Long Beach No Yes Sacramento Yes Yes Seattle Yes Yes
Overhead Recovery Methods
About one-half of the fleets have a fixed charge in place to recover overhead costs. The others
incorporate the overhead as part of their labor costs and/or mark ups of parts, fuel and
commercial expenses. (See Chart 42 below.)
Chart 42: Overhead Recovery Methods
City Monthly Overhead Charge
Method Yes Amount Per Vehicle
Albuquerque No N.A. Built into labor rate.
El Paso No N.A. Overhead is recovered by the parts, fuel and commercial repair markups as well as by the shop labor rate.
Fort Worth Yes $57.50
Long Beach No N.A. An overhead amount is calculated and added to the billed labor rate.
Sacramento Yes $40 Monthly billing
Seattle Yes $20 to $150 $47 average (2006)
Fleet Services sets rates to recover overhead expenses for section in the division. The shop labor rate pays for shop expenses, the parts markup pays for warehouse expenses, and a portion of the monthly lease rate pays for fleet administration expenses.
Incidental Charges
All but one fleet (Albuquerque) reported applying incidental charges besides parts, labor, fuel,
and overhead in their billing, as noted in Chart 43 on the next page.
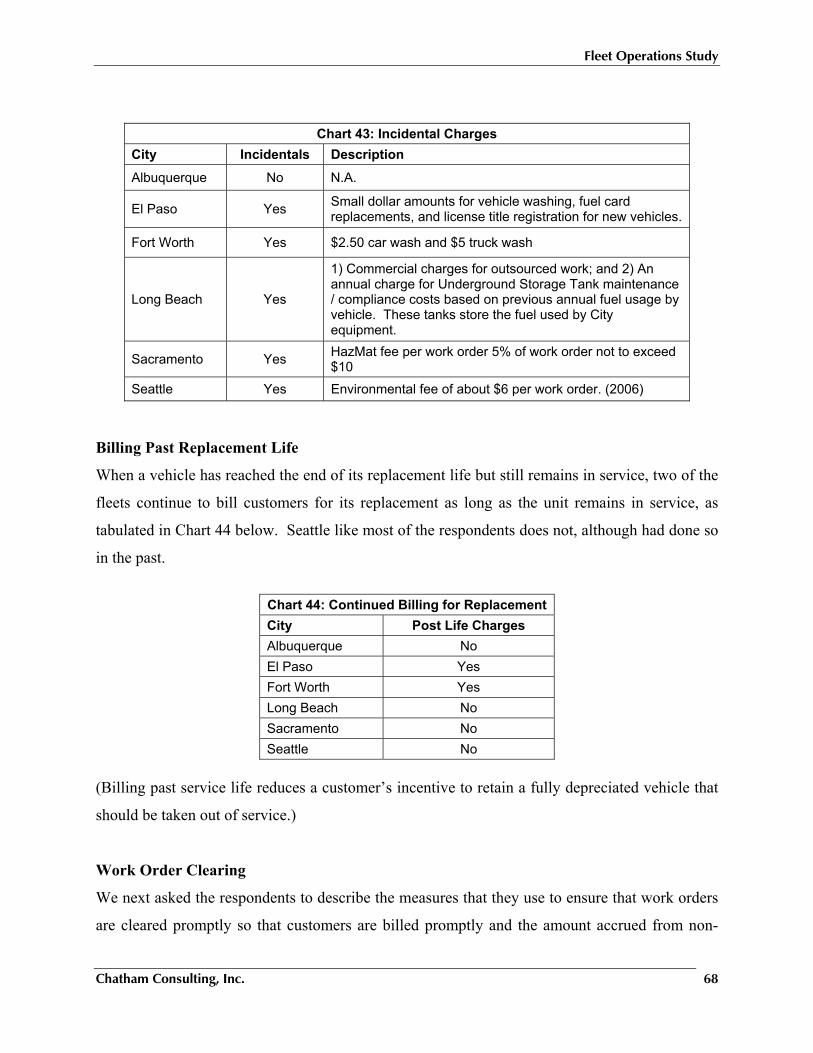
Fleet Operations Study
Chatham Consulting, Inc. 68
Chart 43: Incidental Charges City Incidentals Description Albuquerque No N.A.
El Paso Yes Small dollar amounts for vehicle washing, fuel card replacements, and license title registration for new vehicles.
Fort Worth Yes $2.50 car wash and $5 truck wash
Long Beach Yes
1) Commercial charges for outsourced work; and 2) An annual charge for Underground Storage Tank maintenance / compliance costs based on previous annual fuel usage by vehicle. These tanks store the fuel used by City equipment.
Sacramento Yes HazMat fee per work order 5% of work order not to exceed $10
Seattle Yes Environmental fee of about $6 per work order. (2006)
Billing Past Replacement Life
When a vehicle has reached the end of its replacement life but still remains in service, two of the
fleets continue to bill customers for its replacement as long as the unit remains in service, as
tabulated in Chart 44 below. Seattle like most of the respondents does not, although had done so
in the past.
Chart 44: Continued Billing for ReplacementCity Post Life Charges Albuquerque No El Paso Yes Fort Worth Yes Long Beach No Sacramento No Seattle No
(Billing past service life reduces a customer’s incentive to retain a fully depreciated vehicle that
should be taken out of service.)
Work Order Clearing
We next asked the respondents to describe the measures that they use to ensure that work orders
are cleared promptly so that customers are billed promptly and the amount accrued from non-
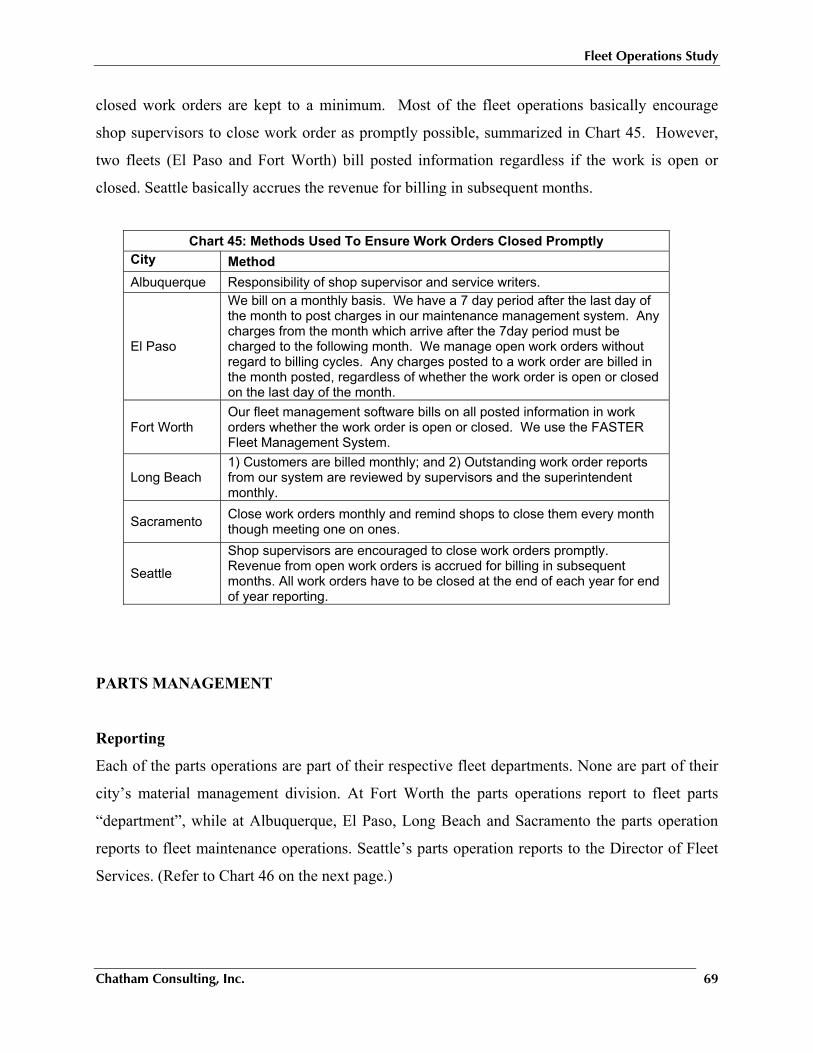
Fleet Operations Study
Chatham Consulting, Inc. 69
closed work orders are kept to a minimum. Most of the fleet operations basically encourage
shop supervisors to close work order as promptly possible, summarized in Chart 45. However,
two fleets (El Paso and Fort Worth) bill posted information regardless if the work is open or
closed. Seattle basically accrues the revenue for billing in subsequent months.
PARTS MANAGEMENT
Reporting
Each of the parts operations are part of their respective fleet departments. None are part of their
city’s material management division. At Fort Worth the parts operations report to fleet parts
“department”, while at Albuquerque, El Paso, Long Beach and Sacramento the parts operation
reports to fleet maintenance operations. Seattle’s parts operation reports to the Director of Fleet
Services. (Refer to Chart 46 on the next page.)
Chart 45: Methods Used To Ensure Work Orders Closed Promptly City Method Albuquerque Responsibility of shop supervisor and service writers.
El Paso
We bill on a monthly basis. We have a 7 day period after the last day of the month to post charges in our maintenance management system. Any charges from the month which arrive after the 7day period must be charged to the following month. We manage open work orders without regard to billing cycles. Any charges posted to a work order are billed in the month posted, regardless of whether the work order is open or closed on the last day of the month.
Fort Worth Our fleet management software bills on all posted information in work orders whether the work order is open or closed. We use the FASTER Fleet Management System.
Long Beach 1) Customers are billed monthly; and 2) Outstanding work order reports from our system are reviewed by supervisors and the superintendent monthly.
Sacramento Close work orders monthly and remind shops to close them every month though meeting one on ones.
Seattle
Shop supervisors are encouraged to close work orders promptly. Revenue from open work orders is accrued for billing in subsequent months. All work orders have to be closed at the end of each year for end of year reporting.
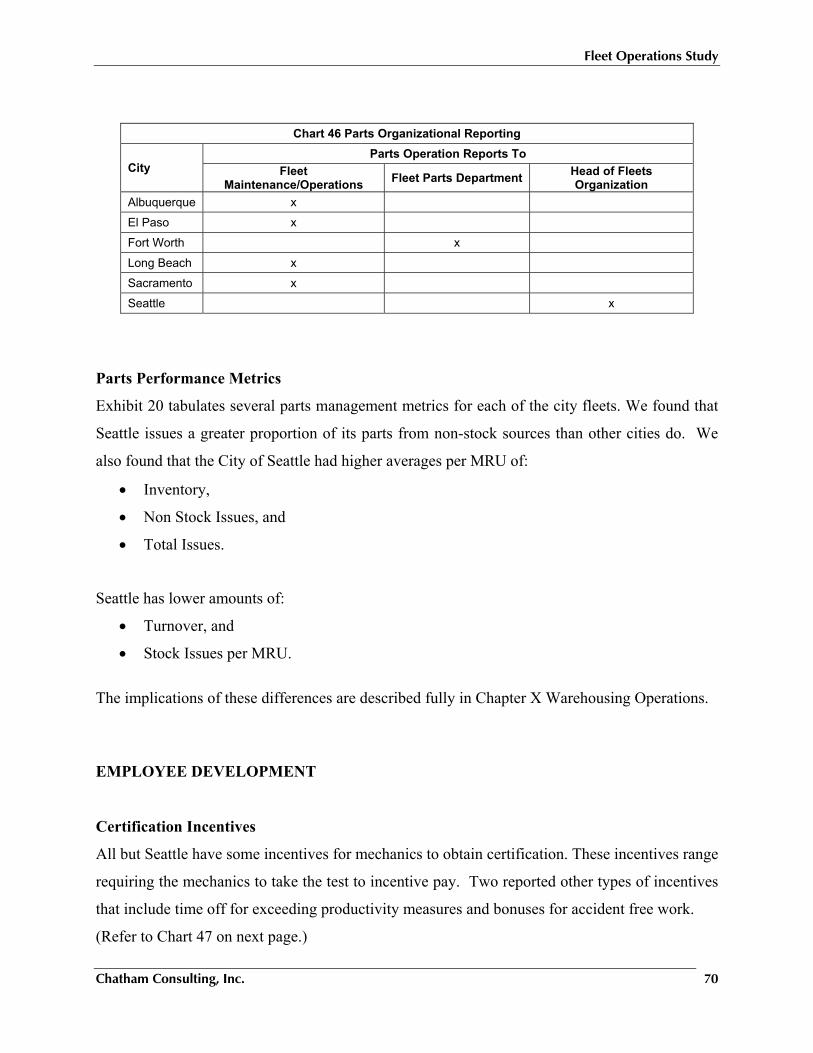
Fleet Operations Study
Chatham Consulting, Inc. 70
Chart 46 Parts Organizational Reporting
City Parts Operation Reports To
Fleet Maintenance/Operations Fleet Parts Department Head of Fleets
Organization Albuquerque x
El Paso x
Fort Worth x
Long Beach x
Sacramento x
Seattle x
Parts Performance Metrics
Exhibit 20 tabulates several parts management metrics for each of the city fleets. We found that
Seattle issues a greater proportion of its parts from non-stock sources than other cities do. We
also found that the City of Seattle had higher averages per MRU of:
• Inventory,
• Non Stock Issues, and
• Total Issues.
Seattle has lower amounts of:
• Turnover, and
• Stock Issues per MRU.
The implications of these differences are described fully in Chapter X Warehousing Operations.
EMPLOYEE DEVELOPMENT
Certification Incentives
All but Seattle have some incentives for mechanics to obtain certification. These incentives range
requiring the mechanics to take the test to incentive pay. Two reported other types of incentives
that include time off for exceeding productivity measures and bonuses for accident free work.
(Refer to Chart 47 on next page.)
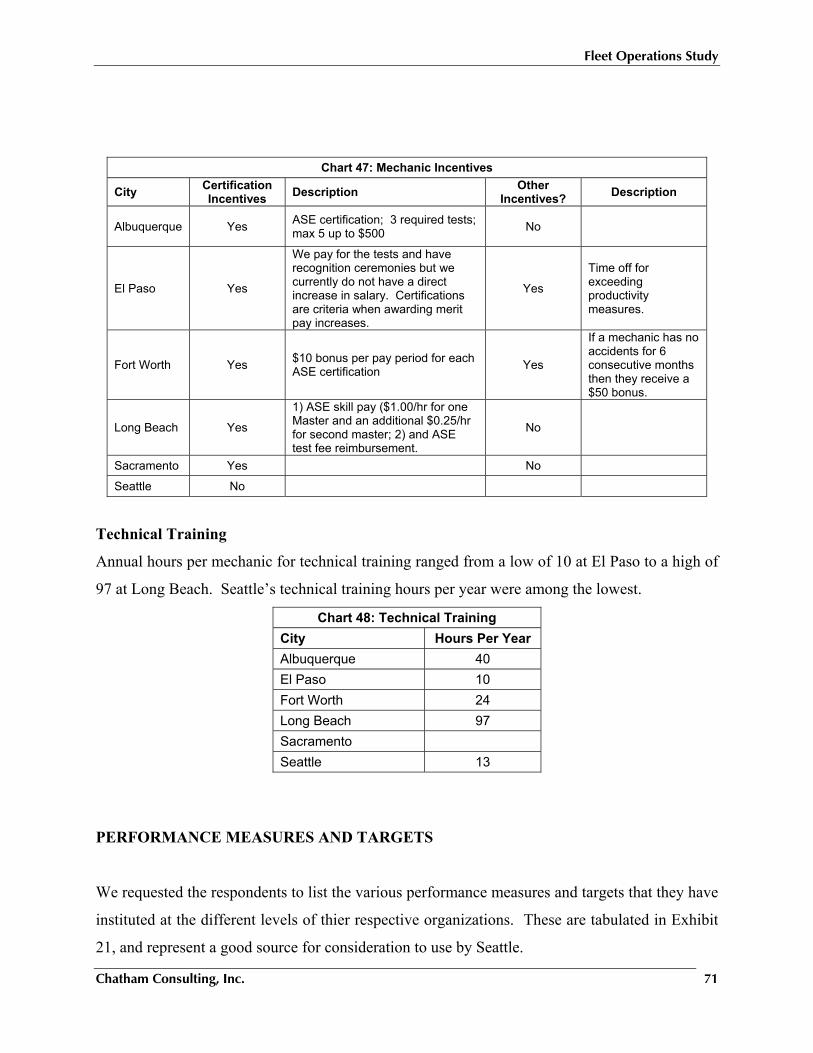
Fleet Operations Study
Chatham Consulting, Inc. 71
Technical Training
Annual hours per mechanic for technical training ranged from a low of 10 at El Paso to a high of
97 at Long Beach. Seattle’s technical training hours per year were among the lowest.
Chart 48: Technical Training City Hours Per Year Albuquerque 40 El Paso 10 Fort Worth 24 Long Beach 97 Sacramento Seattle 13
PERFORMANCE MEASURES AND TARGETS
We requested the respondents to list the various performance measures and targets that they have
instituted at the different levels of thier respective organizations. These are tabulated in Exhibit
21, and represent a good source for consideration to use by Seattle.
Chart 47: Mechanic Incentives
City Certification Incentives Description Other
Incentives? Description
Albuquerque Yes ASE certification; 3 required tests; max 5 up to $500 No
El Paso Yes
We pay for the tests and have recognition ceremonies but we currently do not have a direct increase in salary. Certifications are criteria when awarding merit pay increases.
Yes
Time off for exceeding productivity measures.
Fort Worth Yes $10 bonus per pay period for each ASE certification Yes
If a mechanic has no accidents for 6 consecutive months then they receive a $50 bonus.
Long Beach Yes
1) ASE skill pay ($1.00/hr for one Master and an additional $0.25/hr for second master; 2) and ASE test fee reimbursement.
No
Sacramento Yes No
Seattle No
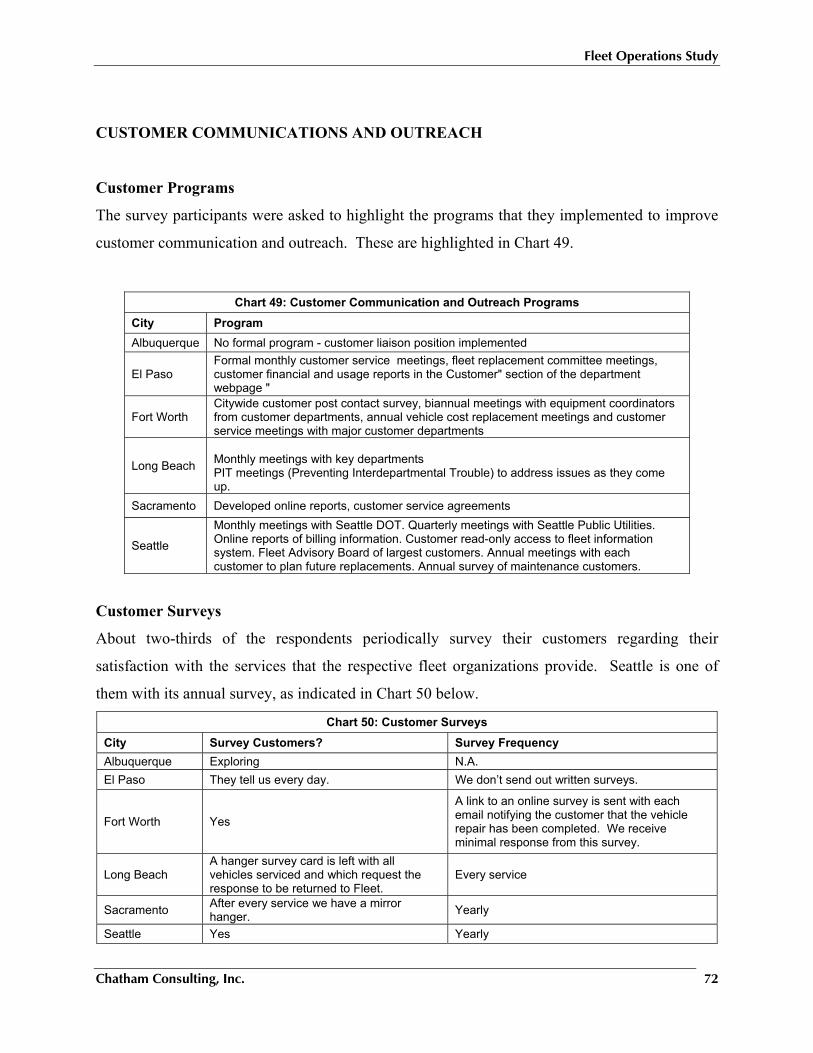
Fleet Operations Study
Chatham Consulting, Inc. 72
CUSTOMER COMMUNICATIONS AND OUTREACH
Customer Programs
The survey participants were asked to highlight the programs that they implemented to improve
customer communication and outreach. These are highlighted in Chart 49.
Customer Surveys
About two-thirds of the respondents periodically survey their customers regarding their
satisfaction with the services that the respective fleet organizations provide. Seattle is one of
them with its annual survey, as indicated in Chart 50 below.
Chart 50: Customer Surveys City Survey Customers? Survey Frequency Albuquerque Exploring N.A. El Paso They tell us every day. We don’t send out written surveys.
Fort Worth Yes
A link to an online survey is sent with each email notifying the customer that the vehicle repair has been completed. We receive minimal response from this survey.
Long Beach A hanger survey card is left with all vehicles serviced and which request the response to be returned to Fleet.
Every service
Sacramento After every service we have a mirror hanger. Yearly
Seattle Yes Yearly
Chart 49: Customer Communication and Outreach Programs City Program Albuquerque No formal program - customer liaison position implemented
El Paso Formal monthly customer service meetings, fleet replacement committee meetings, customer financial and usage reports in the Customer" section of the department webpage "
Fort Worth Citywide customer post contact survey, biannual meetings with equipment coordinators from customer departments, annual vehicle cost replacement meetings and customer service meetings with major customer departments
Long Beach
Monthly meetings with key departments PIT meetings (Preventing Interdepartmental Trouble) to address issues as they come up.
Sacramento Developed online reports, customer service agreements
Seattle
Monthly meetings with Seattle DOT. Quarterly meetings with Seattle Public Utilities. Online reports of billing information. Customer read-only access to fleet information system. Fleet Advisory Board of largest customers. Annual meetings with each customer to plan future replacements. Annual survey of maintenance customers.
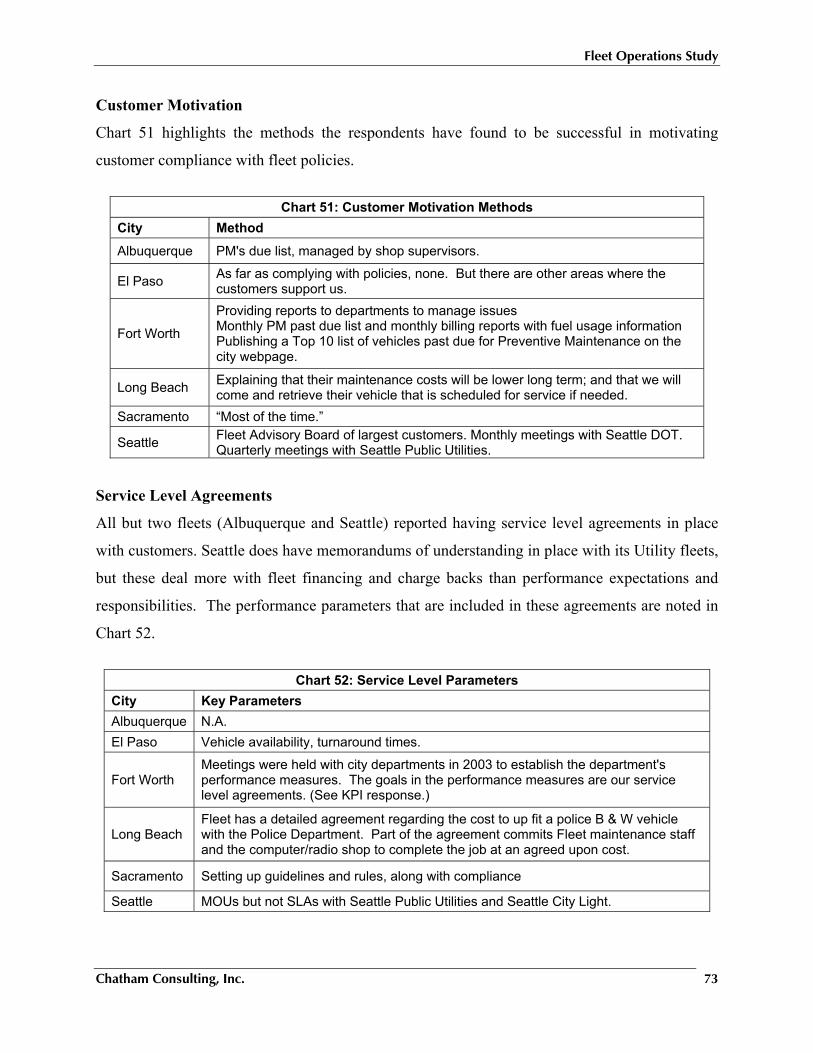
Fleet Operations Study
Chatham Consulting, Inc. 73
Customer Motivation
Chart 51 highlights the methods the respondents have found to be successful in motivating
customer compliance with fleet policies.
Chart 51: Customer Motivation Methods
City Method Albuquerque PM's due list, managed by shop supervisors.
El Paso As far as complying with policies, none. But there are other areas where the customers support us.
Fort Worth
Providing reports to departments to manage issues Monthly PM past due list and monthly billing reports with fuel usage information Publishing a Top 10 list of vehicles past due for Preventive Maintenance on the city webpage.
Long Beach Explaining that their maintenance costs will be lower long term; and that we will come and retrieve their vehicle that is scheduled for service if needed.
Sacramento “Most of the time.”
Seattle Fleet Advisory Board of largest customers. Monthly meetings with Seattle DOT. Quarterly meetings with Seattle Public Utilities.
Service Level Agreements
All but two fleets (Albuquerque and Seattle) reported having service level agreements in place
with customers. Seattle does have memorandums of understanding in place with its Utility fleets,
but these deal more with fleet financing and charge backs than performance expectations and
responsibilities. The performance parameters that are included in these agreements are noted in
Chart 52.
Chart 52: Service Level Parameters
City Key Parameters Albuquerque N.A. El Paso Vehicle availability, turnaround times.
Fort Worth Meetings were held with city departments in 2003 to establish the department's performance measures. The goals in the performance measures are our service level agreements. (See KPI response.)
Long Beach Fleet has a detailed agreement regarding the cost to up fit a police B & W vehicle with the Police Department. Part of the agreement commits Fleet maintenance staff and the computer/radio shop to complete the job at an agreed upon cost.
Sacramento Setting up guidelines and rules, along with compliance
Seattle MOUs but not SLAs with Seattle Public Utilities and Seattle City Light.
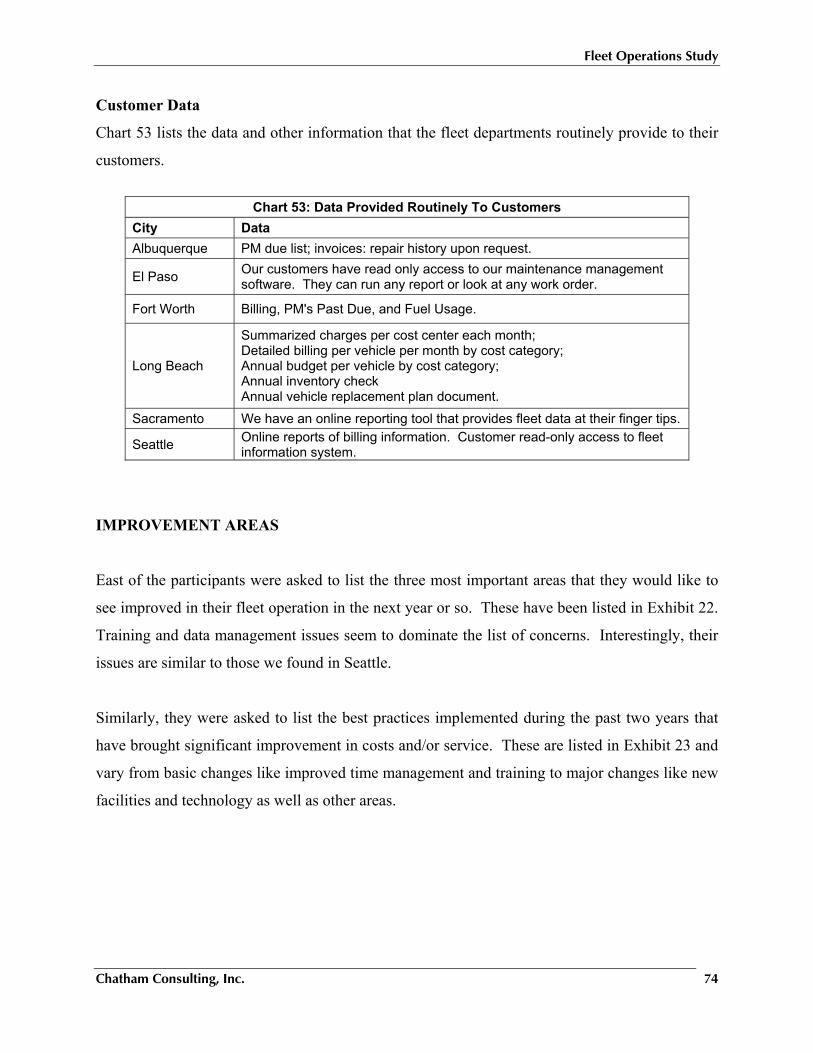
Fleet Operations Study
Chatham Consulting, Inc. 74
Customer Data
Chart 53 lists the data and other information that the fleet departments routinely provide to their
customers.
Chart 53: Data Provided Routinely To Customers
City Data Albuquerque PM due list; invoices: repair history upon request.
El Paso Our customers have read only access to our maintenance management software. They can run any report or look at any work order.
Fort Worth Billing, PM's Past Due, and Fuel Usage.
Long Beach
Summarized charges per cost center each month; Detailed billing per vehicle per month by cost category; Annual budget per vehicle by cost category; Annual inventory check Annual vehicle replacement plan document.
Sacramento We have an online reporting tool that provides fleet data at their finger tips.
Seattle Online reports of billing information. Customer read-only access to fleet information system.
IMPROVEMENT AREAS
East of the participants were asked to list the three most important areas that they would like to
see improved in their fleet operation in the next year or so. These have been listed in Exhibit 22.
Training and data management issues seem to dominate the list of concerns. Interestingly, their
issues are similar to those we found in Seattle.
Similarly, they were asked to list the best practices implemented during the past two years that
have brought significant improvement in costs and/or service. These are listed in Exhibit 23 and
vary from basic changes like improved time management and training to major changes like new
facilities and technology as well as other areas.
Fleet Operations Study
Chatham Consulting, Inc. 75
IX. FACILITIES ASSESSMENT INTRODUCTION
We conducted detailed inspections of the vehicle maintenance facilities used by the City of
Seattle to assess their adequacy, layout, and equipment needs. We then identified barriers to
efficient operations, developed recommendations and priorities for their mitigation, note possible
costs and outline steps for long term facility planning. This chapter initially describes our overall
Findings and Recommendations, and then discusses in detail the results of our assessments on a
specific facility basis. Supporting photographs accompany the discussion. A capacity analysis
of the existing facilities was presented in the Chapter VII - MRU and Workload Analysis.
FINDINGS
Regulation Compliance
In general, we found that regulation compliance in all shops met the intent and spirit of OSHA
and WAC regulations for the types of workplaces operated by the City. Nevertheless, we did
find a few instances where oil barrels had no containment.
Housekeeping
Shop cleanliness and housekeeping in general are commendable. Exceptions to this are the Fire
Shop, some areas of the Charles Street heavy vehicle service bays and the Watershed shops.
Workflow Efficiency Enhancements
Technician productivity at Charles Street, Haller Lake, and South Service Center shops can be
enhanced by re-location of existing resources, and provision of additional resources.
Fleet Operations Study
Chatham Consulting, Inc. 76
Resources at Cedar Falls will need to be enhanced to accommodate the shifts in workload. It was
reported that vehicle repair activity in Watershed Area is increasing at the Cedar Falls shop and
declining at the Tolt River shop.
Mechanics need greater and easier access to computers. While there are several shop computers
already accessible to technicians, consideration should be given to adding more computers in the
shops to allow technicians to directly input work order information which would reduce the
workload of office administrative personnel. These computers should also be configured to
allow access to on-line repair and maintenance manuals by technicians so most of the printed
copies of manuals now in the shops could be removed.
It appears there is much more activity in the auto body shop than in the welding area, and the
City should consider expanding the body shop preparation area into one bay presently devoted to
welding.
Security Enhancement
Building security at Haller Lake shop should be improved. Presently, City employees from other
departments have access to the shop on nights and weekends because of location of the
emergency fire exits near their offices.
Machine Tool Consolidation
We note that machine tools are taking up valuable space at the Haller Lake and Fire Shop
facilities. Since the City already operates a complete machine shop at Charles Street,
consideration should be given to moving machine tools out of Haller Lake and Fire shops to
provide more space to support the vehicle repair operations at those locations.
Shop Equipment
At the time of our shop inspections, it was determined there was no shop equipment in
immediate need of repair. However, our review of available inventory data on shop hoist
equipment that the average vehicle lift age was 13 years, which is about two-thirds of the 20-year
typical service life expected for this type of equipment. As tabulated in Chart 54 on the next
page, there are eight lifts that exceed the 20 year guideline. Of course, actual life will depend on
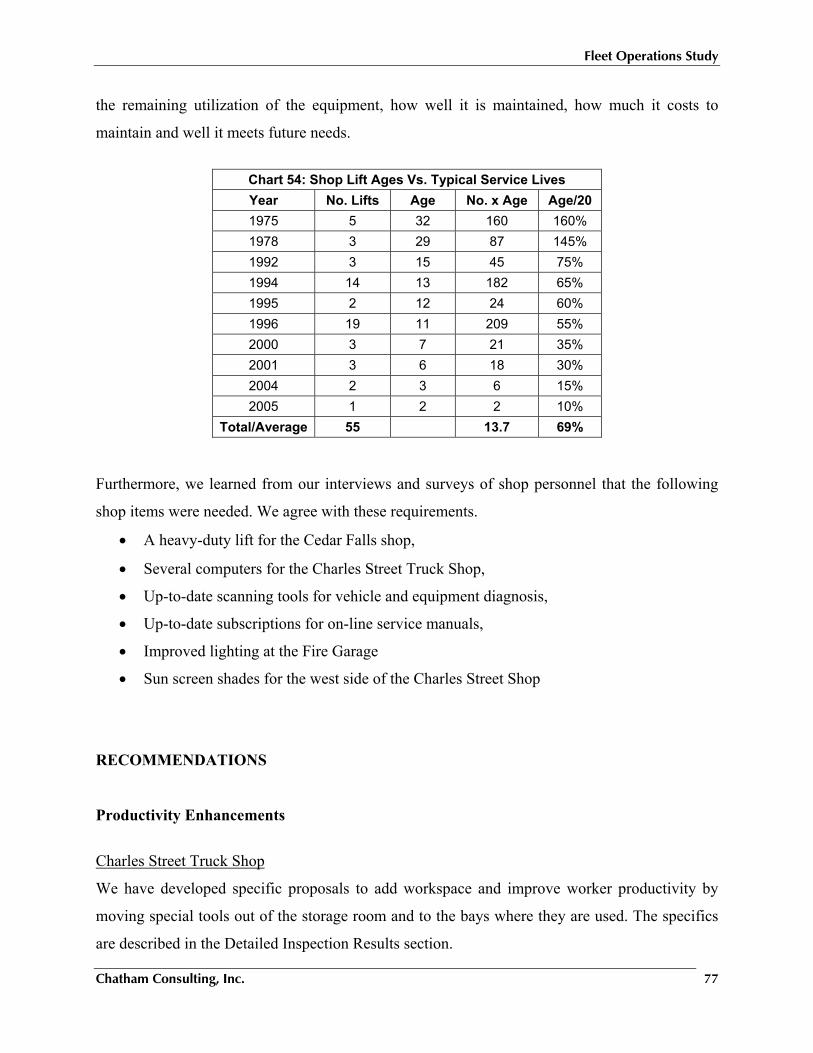
Fleet Operations Study
Chatham Consulting, Inc. 77
the remaining utilization of the equipment, how well it is maintained, how much it costs to
maintain and well it meets future needs.
Chart 54: Shop Lift Ages Vs. Typical Service Lives Year No. Lifts Age No. x Age Age/20 1975 5 32 160 160% 1978 3 29 87 145% 1992 3 15 45 75% 1994 14 13 182 65% 1995 2 12 24 60% 1996 19 11 209 55% 2000 3 7 21 35% 2001 3 6 18 30% 2004 2 3 6 15% 2005 1 2 2 10%
Total/Average 55 13.7 69% Furthermore, we learned from our interviews and surveys of shop personnel that the following
shop items were needed. We agree with these requirements.
• A heavy-duty lift for the Cedar Falls shop,
• Several computers for the Charles Street Truck Shop,
• Up-to-date scanning tools for vehicle and equipment diagnosis,
• Up-to-date subscriptions for on-line service manuals,
• Improved lighting at the Fire Garage
• Sun screen shades for the west side of the Charles Street Shop
RECOMMENDATIONS
Productivity Enhancements
Charles Street Truck Shop
We have developed specific proposals to add workspace and improve worker productivity by
moving special tools out of the storage room and to the bays where they are used. The specifics
are described in the Detailed Inspection Results section.
Fleet Operations Study
Chatham Consulting, Inc. 78
Charles Street Auto Body Shop
One of the welding bays should be converted into additional space for the auto body shop. It
appears there is much more activity in the auto body shop than in the welding area.
Fire Shop
More useable shop space can be obtained by cleaning and organizing the space to the South and
West of the shop office. Part of this space is presently being used for storage. The far South
area is much cluttered, and the material littering the benches and floor prevent productive use of
this space.
South Service Center Shop
Suggestions are included in the detailed inspection section of this chapter to improve vehicle
traffic flow at this facility by storing oil drums and other items more efficiently.
Haller Lake Shop
There is a problem here with not being able to secure the shop during evenings and weekends.
We describe a proposal in the Detailed Results section to provide necessary security. Also, there
are also suggestions on how to make workflow more efficient and effective by re-arranging and
adding resources. Bench space can be freed up by re-locating five air hose reels.
Cedar Falls Shop
Because of changes in vehicle populations, there will be heavier vehicle work done at Cedar
Falls Shop. For this reason, it would facilitate the work there by equipping this shop with heavy
duty roll-around vehicle well jacks. There is only a light duty lift there now.
Special Tools
Recommendations are made for several of the City shops to move special tools from remote
storage rooms out onto the shop floor to be more readily available to technicians. The Tire Shop
has a roll-around cart that contains many of the required special tools. Consideration should be
given to adding this type of cart to the other locations where tools need to be more accessible.
Fleet Operations Study
Chatham Consulting, Inc. 79
This could include all special tools or just high-use special tools. If carts are not appropriate,
tools should be located in stationary racks in the work areas.
Shop Computers
Several shops have computers in the work areas that are accessible by technicians. It is
recommended more computers be added to the shops. These computers would be used by
technicians to directly input work order data and to access service and maintenance information.
There is specific information on availability of online service and maintenance information in the
Charles Street Truck Shop section below.
Regulation Compliance
In general, regulation compliance in all shops was excellent. All areas for the most part meet the
intent and spirit of OSHA and WAC regulations for the types of workplaces operated by the
City. All shops are equipped with fire extinguishers, fire blankets, flammable liquid cabinets,
face shields, first aid kits and eye wash equipment that meet existing regulations. All fire
extinguishers inspected had current annual inspection tags attached. All bottles of eyewash had
future expiration dates. There was one fire extinguisher at both South Service Center Shop and
Cedar Falls Shop that was on the floor instead of hanging from a bracket on the wall. All others
were on brackets.
Grinders in shops are securely attached either to benches or to the floor and are equipped with
guards. There is a face shield positioned at each grinder location.
It is common practice to have 55 gallon drums in the shops on roll-around dollies. In most cases,
the dollies consist of just an open steel frame on which the drum rests. There is no provision for
oil containment. These should be replaced with dollies that include containment. There are two
drum dollies of this type with containment in the air compressor room at Haller Lake Shop.
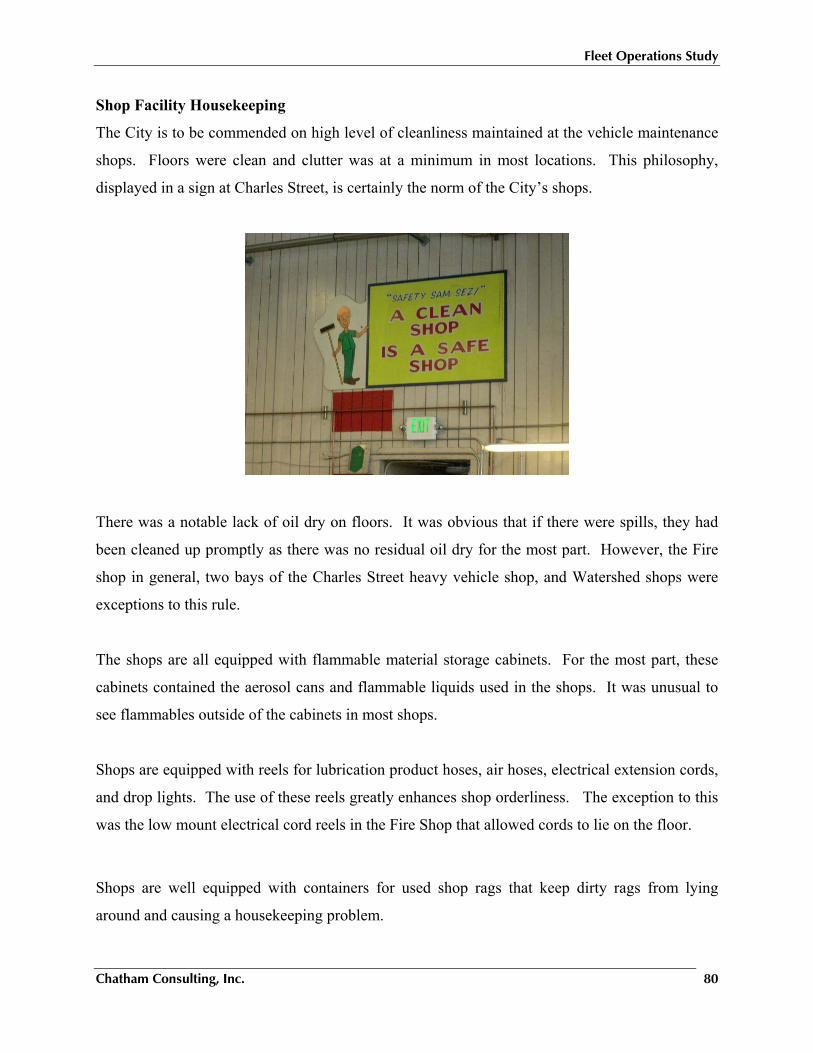
Fleet Operations Study
Chatham Consulting, Inc. 80
Shop Facility Housekeeping
The City is to be commended on high level of cleanliness maintained at the vehicle maintenance
shops. Floors were clean and clutter was at a minimum in most locations. This philosophy,
displayed in a sign at Charles Street, is certainly the norm of the City’s shops.
There was a notable lack of oil dry on floors. It was obvious that if there were spills, they had
been cleaned up promptly as there was no residual oil dry for the most part. However, the Fire
shop in general, two bays of the Charles Street heavy vehicle shop, and Watershed shops were
exceptions to this rule.
The shops are all equipped with flammable material storage cabinets. For the most part, these
cabinets contained the aerosol cans and flammable liquids used in the shops. It was unusual to
see flammables outside of the cabinets in most shops.
Shops are equipped with reels for lubrication product hoses, air hoses, electrical extension cords,
and drop lights. The use of these reels greatly enhances shop orderliness. The exception to this
was the low mount electrical cord reels in the Fire Shop that allowed cords to lie on the floor.
Shops are well equipped with containers for used shop rags that keep dirty rags from lying
around and causing a housekeeping problem.
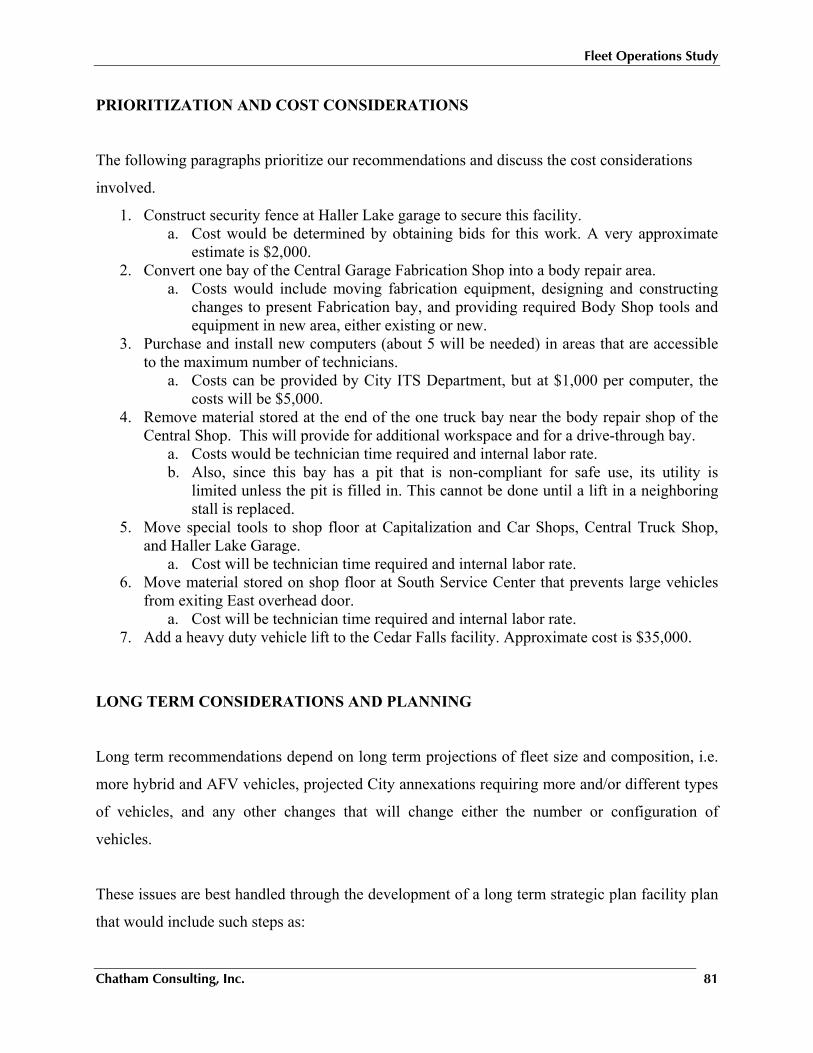
Fleet Operations Study
Chatham Consulting, Inc. 81
PRIORITIZATION AND COST CONSIDERATIONS
The following paragraphs prioritize our recommendations and discuss the cost considerations
involved.
1. Construct security fence at Haller Lake garage to secure this facility. a. Cost would be determined by obtaining bids for this work. A very approximate
estimate is $2,000. 2. Convert one bay of the Central Garage Fabrication Shop into a body repair area.
a. Costs would include moving fabrication equipment, designing and constructing changes to present Fabrication bay, and providing required Body Shop tools and equipment in new area, either existing or new.
3. Purchase and install new computers (about 5 will be needed) in areas that are accessible to the maximum number of technicians.
a. Costs can be provided by City ITS Department, but at $1,000 per computer, the costs will be $5,000.
4. Remove material stored at the end of the one truck bay near the body repair shop of the Central Shop. This will provide for additional workspace and for a drive-through bay.
a. Costs would be technician time required and internal labor rate. b. Also, since this bay has a pit that is non-compliant for safe use, its utility is
limited unless the pit is filled in. This cannot be done until a lift in a neighboring stall is replaced.
5. Move special tools to shop floor at Capitalization and Car Shops, Central Truck Shop, and Haller Lake Garage.
a. Cost will be technician time required and internal labor rate. 6. Move material stored on shop floor at South Service Center that prevents large vehicles
from exiting East overhead door. a. Cost will be technician time required and internal labor rate.
7. Add a heavy duty vehicle lift to the Cedar Falls facility. Approximate cost is $35,000.
LONG TERM CONSIDERATIONS AND PLANNING
Long term recommendations depend on long term projections of fleet size and composition, i.e.
more hybrid and AFV vehicles, projected City annexations requiring more and/or different types
of vehicles, and any other changes that will change either the number or configuration of
vehicles.
These issues are best handled through the development of a long term strategic plan facility plan
that would include such steps as:
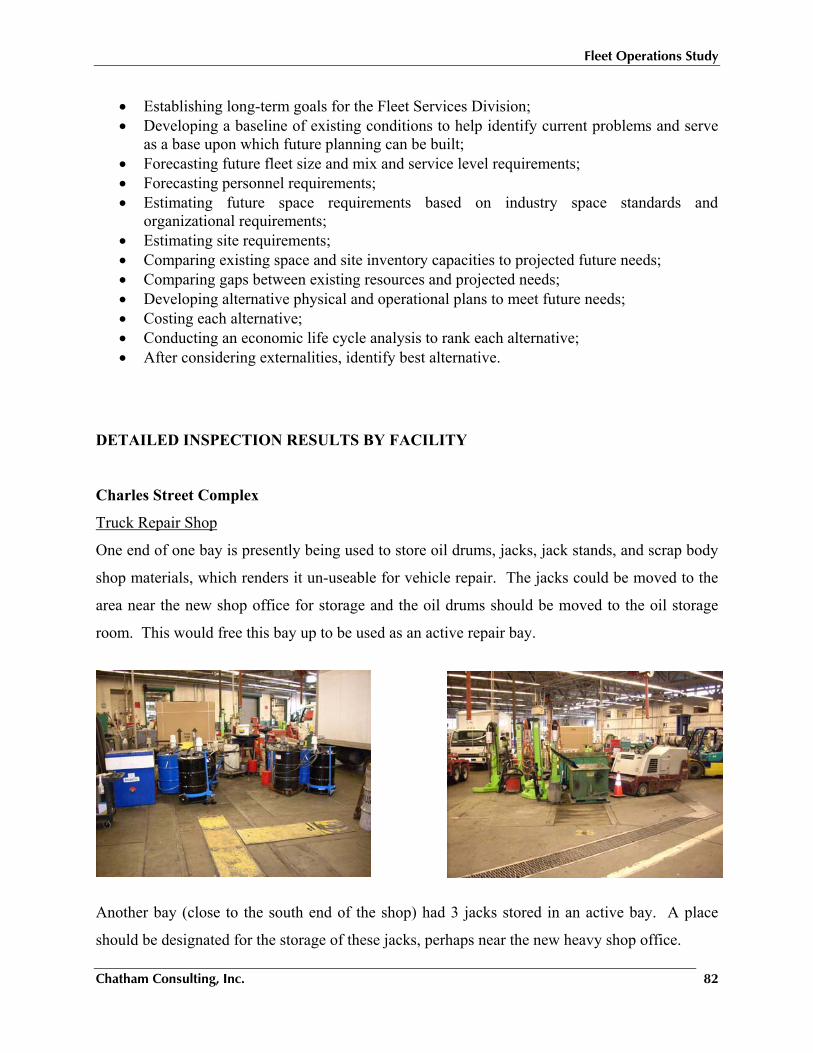
Fleet Operations Study
Chatham Consulting, Inc. 82
• Establishing long-term goals for the Fleet Services Division; • Developing a baseline of existing conditions to help identify current problems and serve
as a base upon which future planning can be built; • Forecasting future fleet size and mix and service level requirements; • Forecasting personnel requirements; • Estimating future space requirements based on industry space standards and
organizational requirements; • Estimating site requirements; • Comparing existing space and site inventory capacities to projected future needs; • Comparing gaps between existing resources and projected needs; • Developing alternative physical and operational plans to meet future needs; • Costing each alternative; • Conducting an economic life cycle analysis to rank each alternative; • After considering externalities, identify best alternative.
DETAILED INSPECTION RESULTS BY FACILITY
Charles Street Complex
Truck Repair Shop
One end of one bay is presently being used to store oil drums, jacks, jack stands, and scrap body
shop materials, which renders it un-useable for vehicle repair. The jacks could be moved to the
area near the new shop office for storage and the oil drums should be moved to the oil storage
room. This would free this bay up to be used as an active repair bay.
Another bay (close to the south end of the shop) had 3 jacks stored in an active bay. A place
should be designated for the storage of these jacks, perhaps near the new heavy shop office.
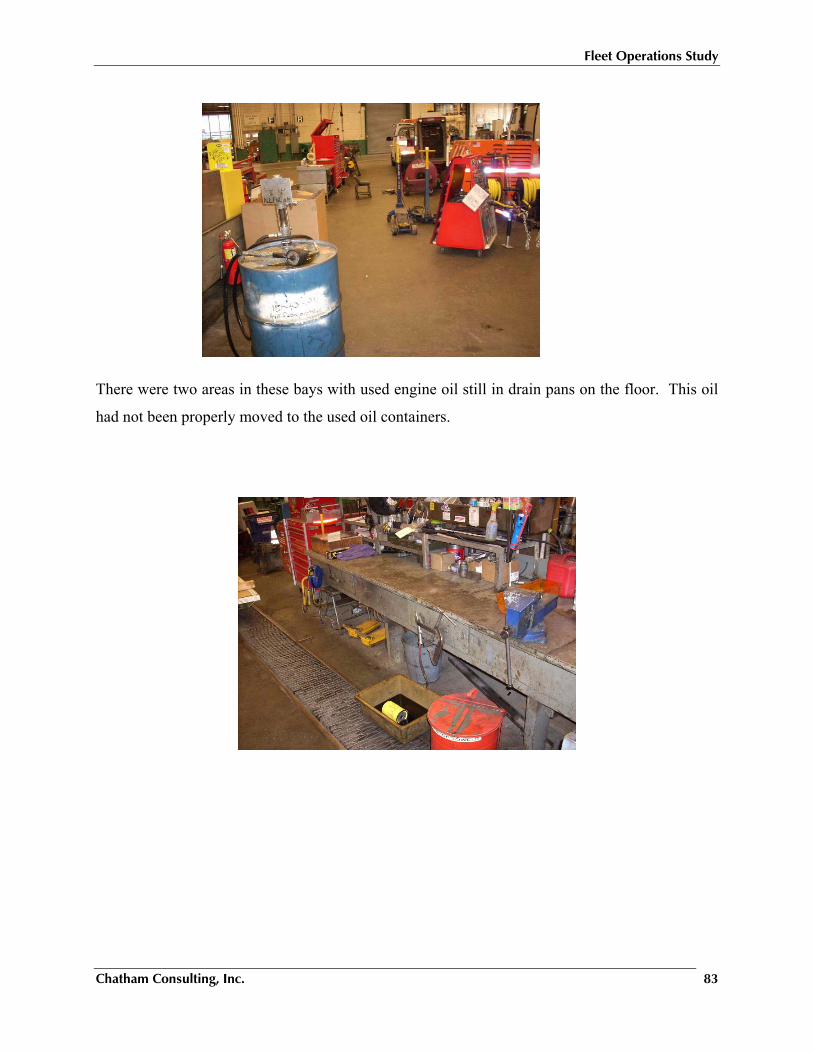
Fleet Operations Study
Chatham Consulting, Inc. 83
There were two areas in these bays with used engine oil still in drain pans on the floor. This oil
had not been properly moved to the used oil containers.
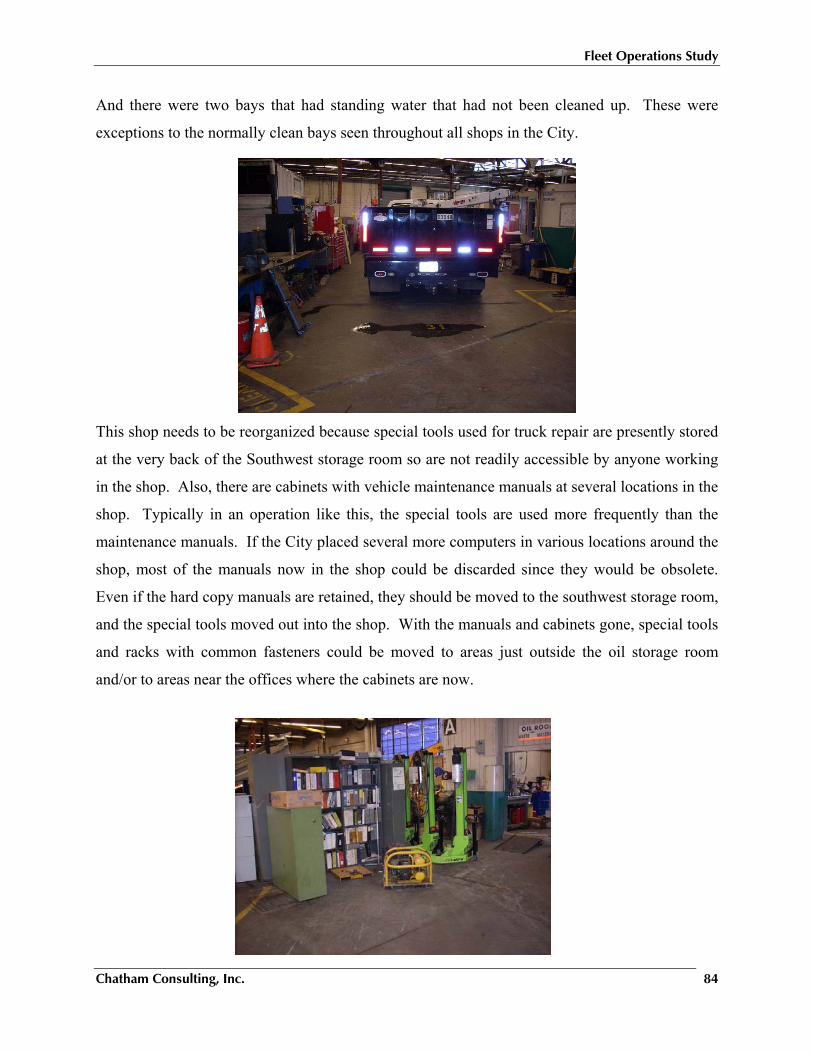
Fleet Operations Study
Chatham Consulting, Inc. 84
And there were two bays that had standing water that had not been cleaned up. These were
exceptions to the normally clean bays seen throughout all shops in the City.
This shop needs to be reorganized because special tools used for truck repair are presently stored
at the very back of the Southwest storage room so are not readily accessible by anyone working
in the shop. Also, there are cabinets with vehicle maintenance manuals at several locations in the
shop. Typically in an operation like this, the special tools are used more frequently than the
maintenance manuals. If the City placed several more computers in various locations around the
shop, most of the manuals now in the shop could be discarded since they would be obsolete.
Even if the hard copy manuals are retained, they should be moved to the southwest storage room,
and the special tools moved out into the shop. With the manuals and cabinets gone, special tools
and racks with common fasteners could be moved to areas just outside the oil storage room
and/or to areas near the offices where the cabinets are now.
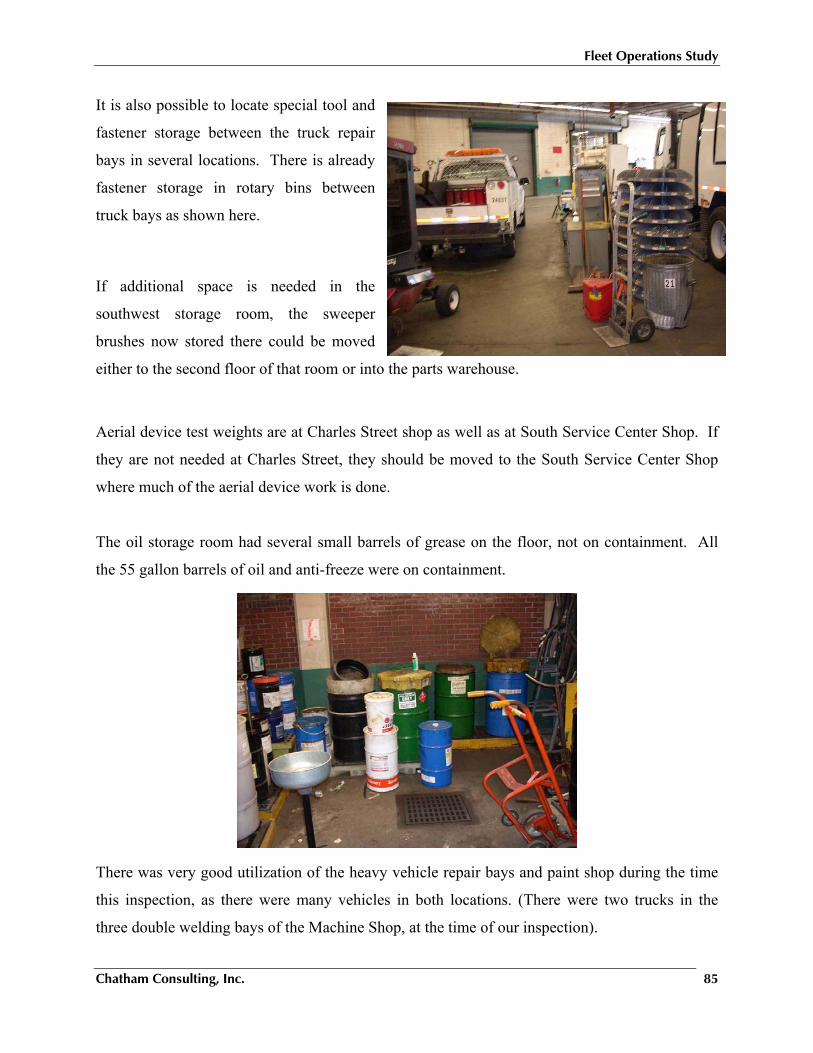
Fleet Operations Study
Chatham Consulting, Inc. 85
It is also possible to locate special tool and
fastener storage between the truck repair
bays in several locations. There is already
fastener storage in rotary bins between
truck bays as shown here.
If additional space is needed in the
southwest storage room, the sweeper
brushes now stored there could be moved
either to the second floor of that room or into the parts warehouse.
Aerial device test weights are at Charles Street shop as well as at South Service Center Shop. If
they are not needed at Charles Street, they should be moved to the South Service Center Shop
where much of the aerial device work is done.
The oil storage room had several small barrels of grease on the floor, not on containment. All
the 55 gallon barrels of oil and anti-freeze were on containment.
There was very good utilization of the heavy vehicle repair bays and paint shop during the time
this inspection, as there were many vehicles in both locations. (There were two trucks in the
three double welding bays of the Machine Shop, at the time of our inspection).

Fleet Operations Study
Chatham Consulting, Inc. 86
Capitalization and Car Repair Shops
There are cabinets with shelves to the
West of the Car Shop office that
contain vehicle shop service manuals.
These cabinets should be moved into
the southwest storage room to free up
this floor space that should be used for
special tool and fastener storage.
The special tools and fasteners presently stored in the storage room at the southwest corner of the
shop building can be moved to this area to make them more accessible to the technicians on the
floor.
The southwest storage room has roll-around gasoline and diesel fuel tanks stored there. These
should be moved to the oil storage room for safety. Vehicle jacks stored here that should be
moved out into the shop where they will be more accessible to the technicians. The southwest
storage room also includes a bench for make-up of wire harnesses for the Police car light
installations.
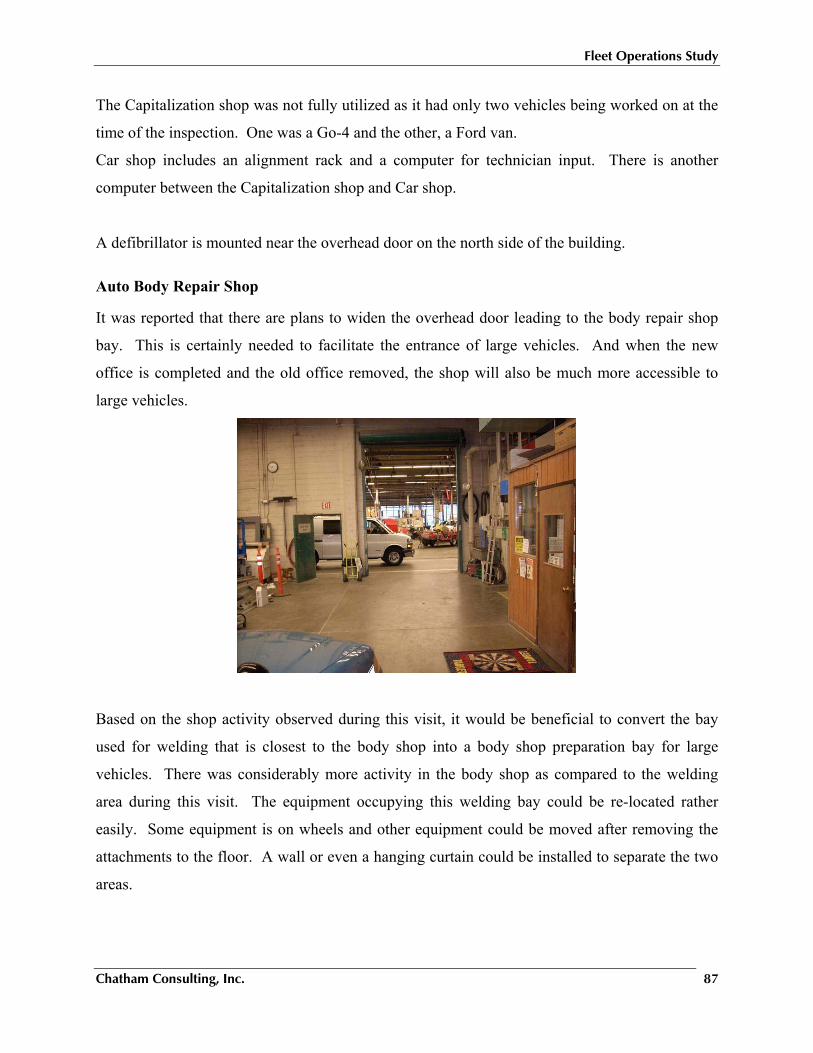
Fleet Operations Study
Chatham Consulting, Inc. 87
The Capitalization shop was not fully utilized as it had only two vehicles being worked on at the
time of the inspection. One was a Go-4 and the other, a Ford van.
Car shop includes an alignment rack and a computer for technician input. There is another
computer between the Capitalization shop and Car shop.
A defibrillator is mounted near the overhead door on the north side of the building.
Auto Body Repair Shop
It was reported that there are plans to widen the overhead door leading to the body repair shop
bay. This is certainly needed to facilitate the entrance of large vehicles. And when the new
office is completed and the old office removed, the shop will also be much more accessible to
large vehicles.
Based on the shop activity observed during this visit, it would be beneficial to convert the bay
used for welding that is closest to the body shop into a body shop preparation bay for large
vehicles. There was considerably more activity in the body shop as compared to the welding
area during this visit. The equipment occupying this welding bay could be re-located rather
easily. Some equipment is on wheels and other equipment could be moved after removing the
attachments to the floor. A wall or even a hanging curtain could be installed to separate the two
areas.
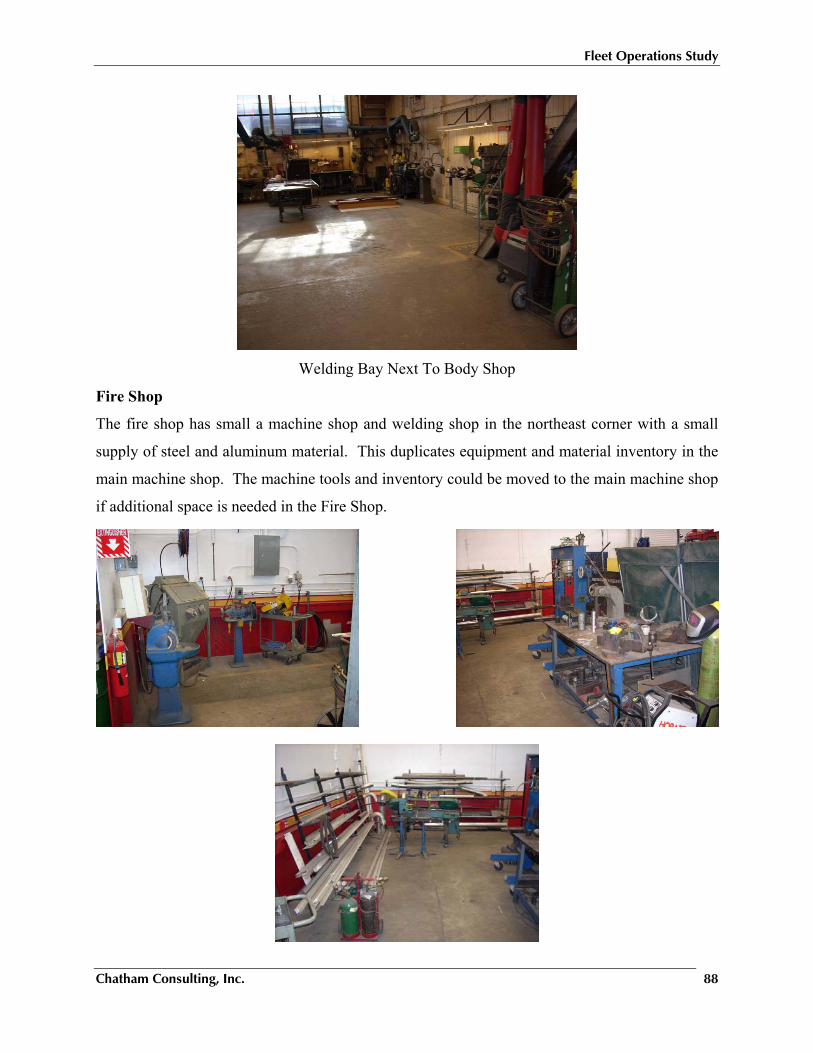
Fleet Operations Study
Chatham Consulting, Inc. 88
Welding Bay Next To Body Shop
Fire Shop
The fire shop has small a machine shop and welding shop in the northeast corner with a small
supply of steel and aluminum material. This duplicates equipment and material inventory in the
main machine shop. The machine tools and inventory could be moved to the main machine shop
if additional space is needed in the Fire Shop.
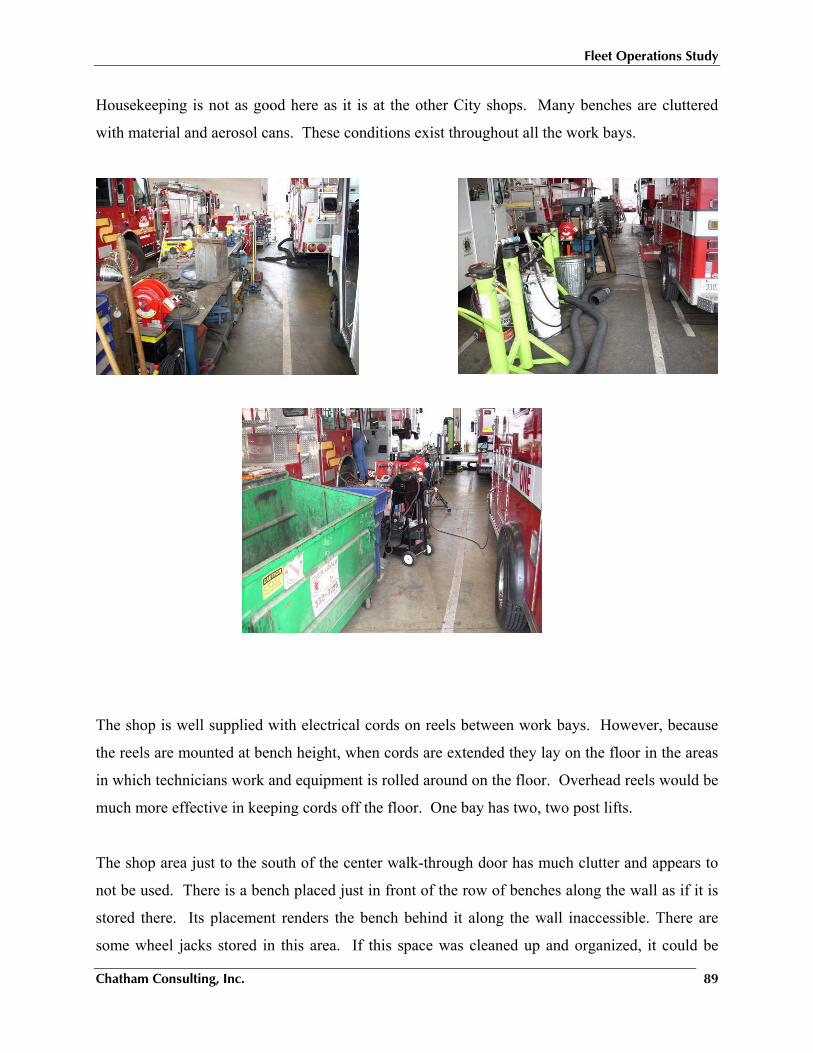
Fleet Operations Study
Chatham Consulting, Inc. 89
Housekeeping is not as good here as it is at the other City shops. Many benches are cluttered
with material and aerosol cans. These conditions exist throughout all the work bays.
The shop is well supplied with electrical cords on reels between work bays. However, because
the reels are mounted at bench height, when cords are extended they lay on the floor in the areas
in which technicians work and equipment is rolled around on the floor. Overhead reels would be
much more effective in keeping cords off the floor. One bay has two, two post lifts.
The shop area just to the south of the center walk-through door has much clutter and appears to
not be used. There is a bench placed just in front of the row of benches along the wall as if it is
stored there. Its placement renders the bench behind it along the wall inaccessible. There are
some wheel jacks stored in this area. If this space was cleaned up and organized, it could be
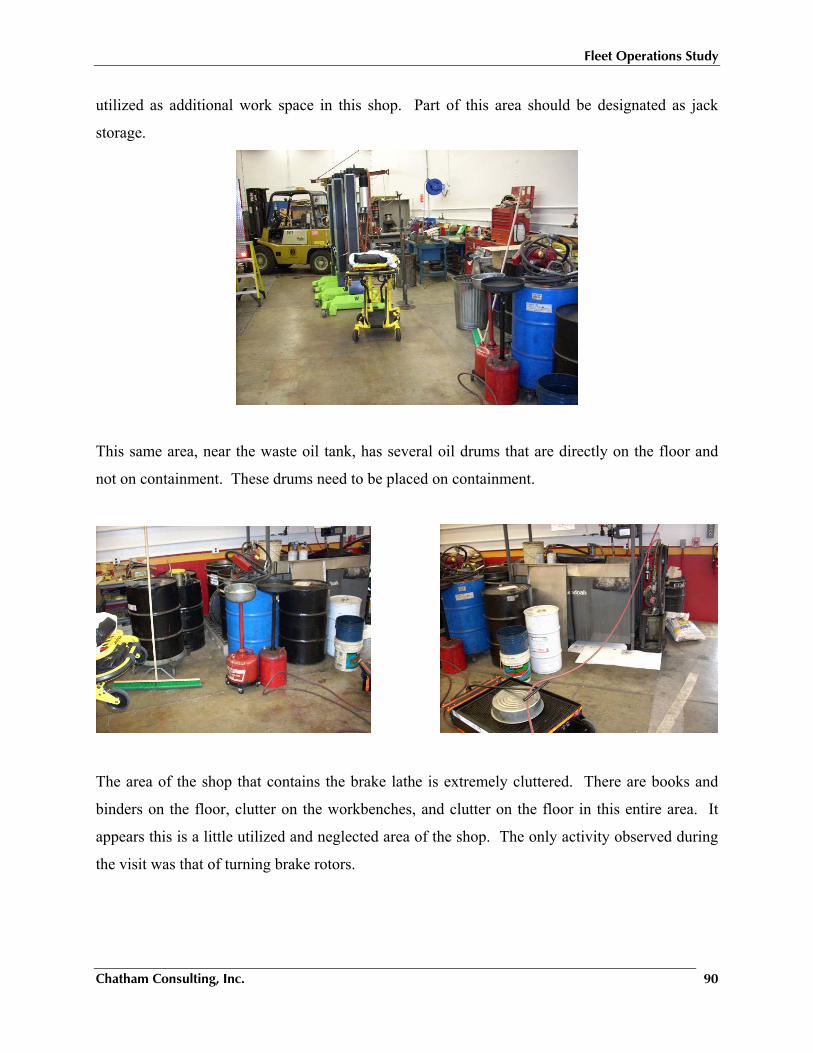
Fleet Operations Study
Chatham Consulting, Inc. 90
utilized as additional work space in this shop. Part of this area should be designated as jack
storage.
This same area, near the waste oil tank, has several oil drums that are directly on the floor and
not on containment. These drums need to be placed on containment.
The area of the shop that contains the brake lathe is extremely cluttered. There are books and
binders on the floor, clutter on the workbenches, and clutter on the floor in this entire area. It
appears this is a little utilized and neglected area of the shop. The only activity observed during
the visit was that of turning brake rotors.
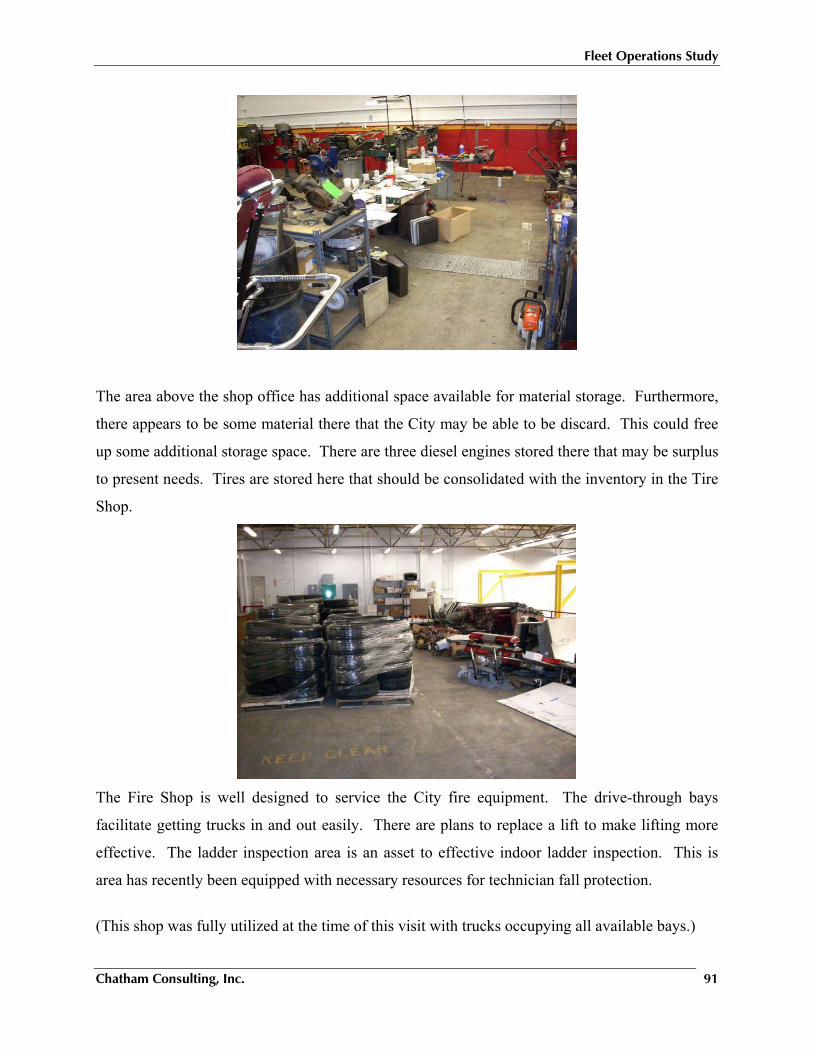
Fleet Operations Study
Chatham Consulting, Inc. 91
The area above the shop office has additional space available for material storage. Furthermore,
there appears to be some material there that the City may be able to be discard. This could free
up some additional storage space. There are three diesel engines stored there that may be surplus
to present needs. Tires are stored here that should be consolidated with the inventory in the Tire
Shop.
The Fire Shop is well designed to service the City fire equipment. The drive-through bays
facilitate getting trucks in and out easily. There are plans to replace a lift to make lifting more
effective. The ladder inspection area is an asset to effective indoor ladder inspection. This is
area has recently been equipped with necessary resources for technician fall protection.
(This shop was fully utilized at the time of this visit with trucks occupying all available bays.)
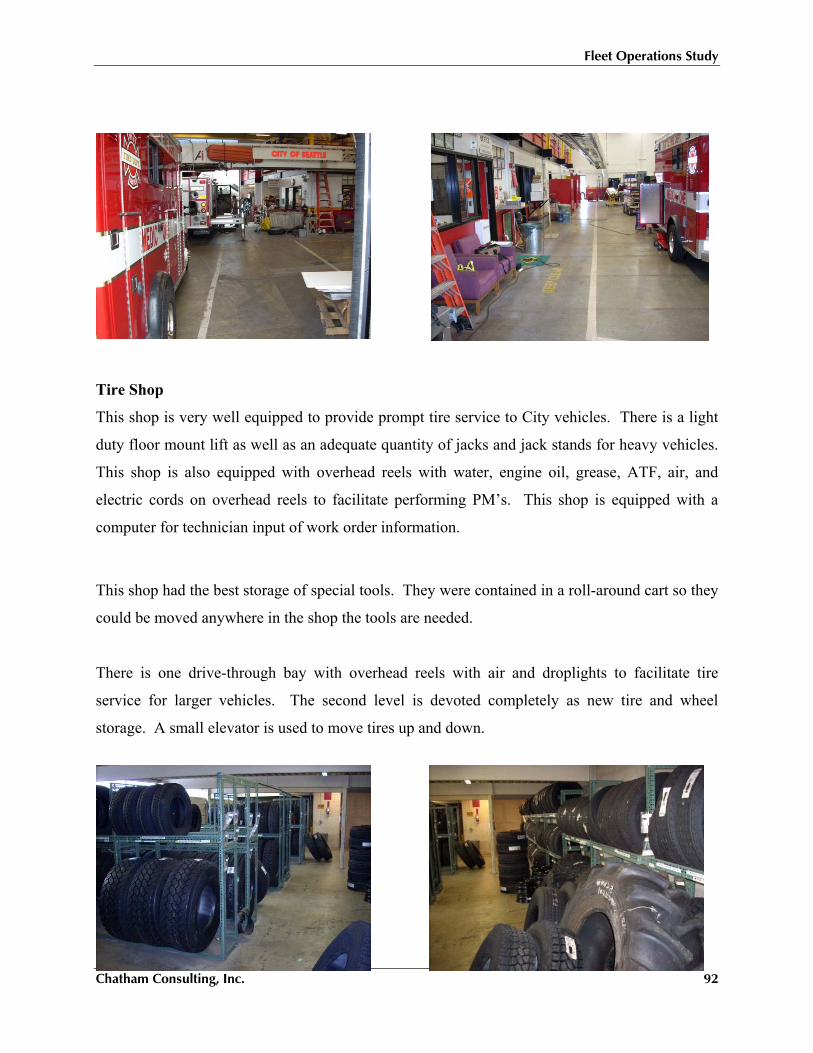
Fleet Operations Study
Chatham Consulting, Inc. 92
Tire Shop
This shop is very well equipped to provide prompt tire service to City vehicles. There is a light
duty floor mount lift as well as an adequate quantity of jacks and jack stands for heavy vehicles.
This shop is also equipped with overhead reels with water, engine oil, grease, ATF, air, and
electric cords on overhead reels to facilitate performing PM’s. This shop is equipped with a
computer for technician input of work order information.
This shop had the best storage of special tools. They were contained in a roll-around cart so they
could be moved anywhere in the shop the tools are needed.
There is one drive-through bay with overhead reels with air and droplights to facilitate tire
service for larger vehicles. The second level is devoted completely as new tire and wheel
storage. A small elevator is used to move tires up and down.
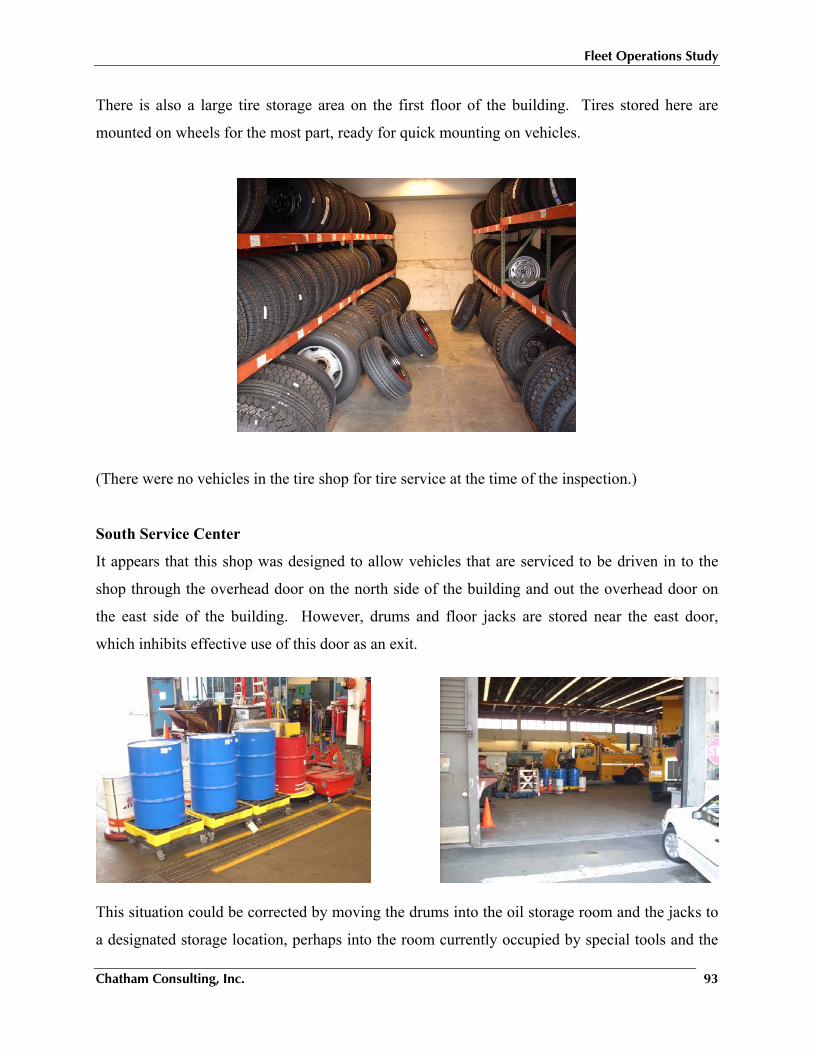
Fleet Operations Study
Chatham Consulting, Inc. 93
There is also a large tire storage area on the first floor of the building. Tires stored here are
mounted on wheels for the most part, ready for quick mounting on vehicles.
(There were no vehicles in the tire shop for tire service at the time of the inspection.)
South Service Center
It appears that this shop was designed to allow vehicles that are serviced to be driven in to the
shop through the overhead door on the north side of the building and out the overhead door on
the east side of the building. However, drums and floor jacks are stored near the east door,
which inhibits effective use of this door as an exit.
This situation could be corrected by moving the drums into the oil storage room and the jacks to
a designated storage location, perhaps into the room currently occupied by special tools and the
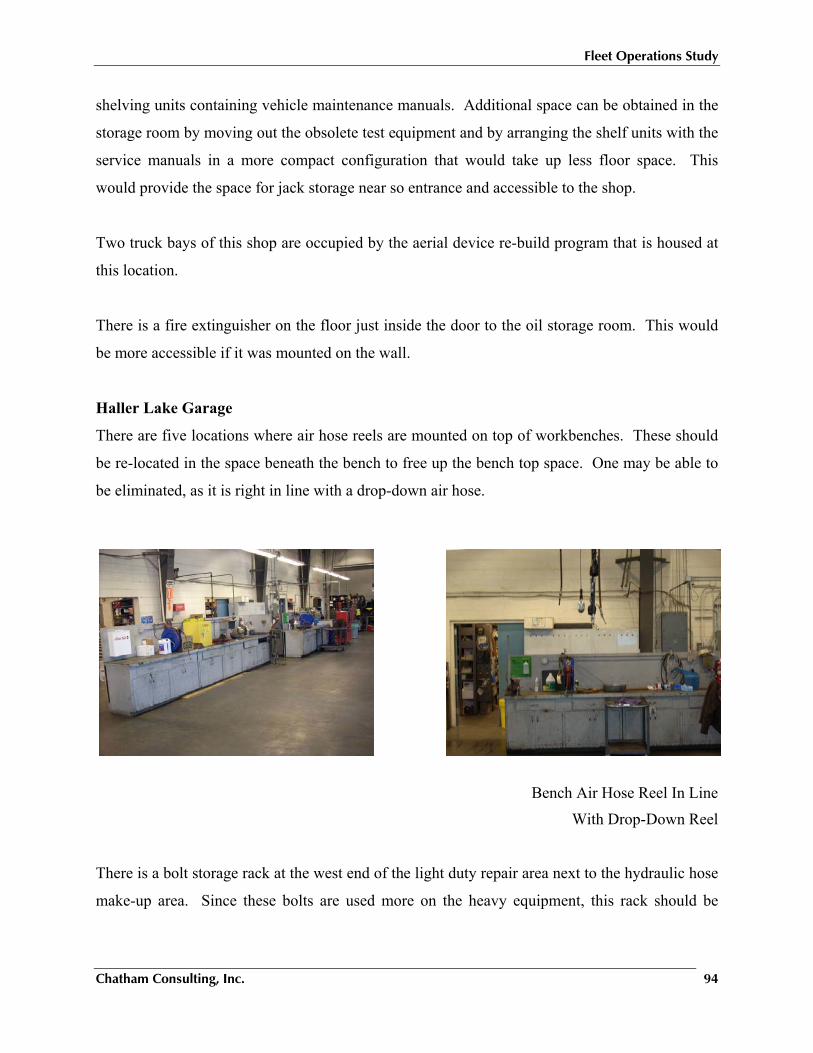
Fleet Operations Study
Chatham Consulting, Inc. 94
shelving units containing vehicle maintenance manuals. Additional space can be obtained in the
storage room by moving out the obsolete test equipment and by arranging the shelf units with the
service manuals in a more compact configuration that would take up less floor space. This
would provide the space for jack storage near so entrance and accessible to the shop.
Two truck bays of this shop are occupied by the aerial device re-build program that is housed at
this location.
There is a fire extinguisher on the floor just inside the door to the oil storage room. This would
be more accessible if it was mounted on the wall.
Haller Lake Garage
There are five locations where air hose reels are mounted on top of workbenches. These should
be re-located in the space beneath the bench to free up the bench top space. One may be able to
be eliminated, as it is right in line with a drop-down air hose.
Bench Air Hose Reel In Line
With Drop-Down Reel
There is a bolt storage rack at the west end of the light duty repair area next to the hydraulic hose
make-up area. Since these bolts are used more on the heavy equipment, this rack should be
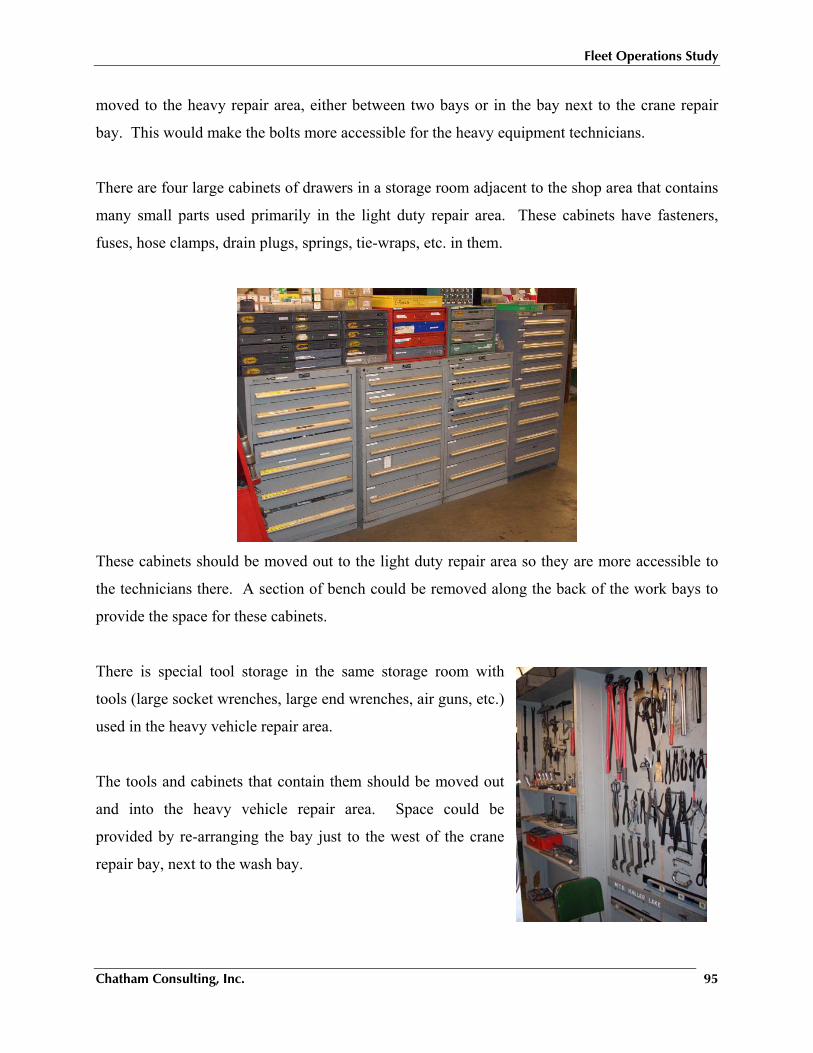
Fleet Operations Study
Chatham Consulting, Inc. 95
moved to the heavy repair area, either between two bays or in the bay next to the crane repair
bay. This would make the bolts more accessible for the heavy equipment technicians.
There are four large cabinets of drawers in a storage room adjacent to the shop area that contains
many small parts used primarily in the light duty repair area. These cabinets have fasteners,
fuses, hose clamps, drain plugs, springs, tie-wraps, etc. in them.
These cabinets should be moved out to the light duty repair area so they are more accessible to
the technicians there. A section of bench could be removed along the back of the work bays to
provide the space for these cabinets.
There is special tool storage in the same storage room with
tools (large socket wrenches, large end wrenches, air guns, etc.)
used in the heavy vehicle repair area.
The tools and cabinets that contain them should be moved out
and into the heavy vehicle repair area. Space could be
provided by re-arranging the bay just to the west of the crane
repair bay, next to the wash bay.
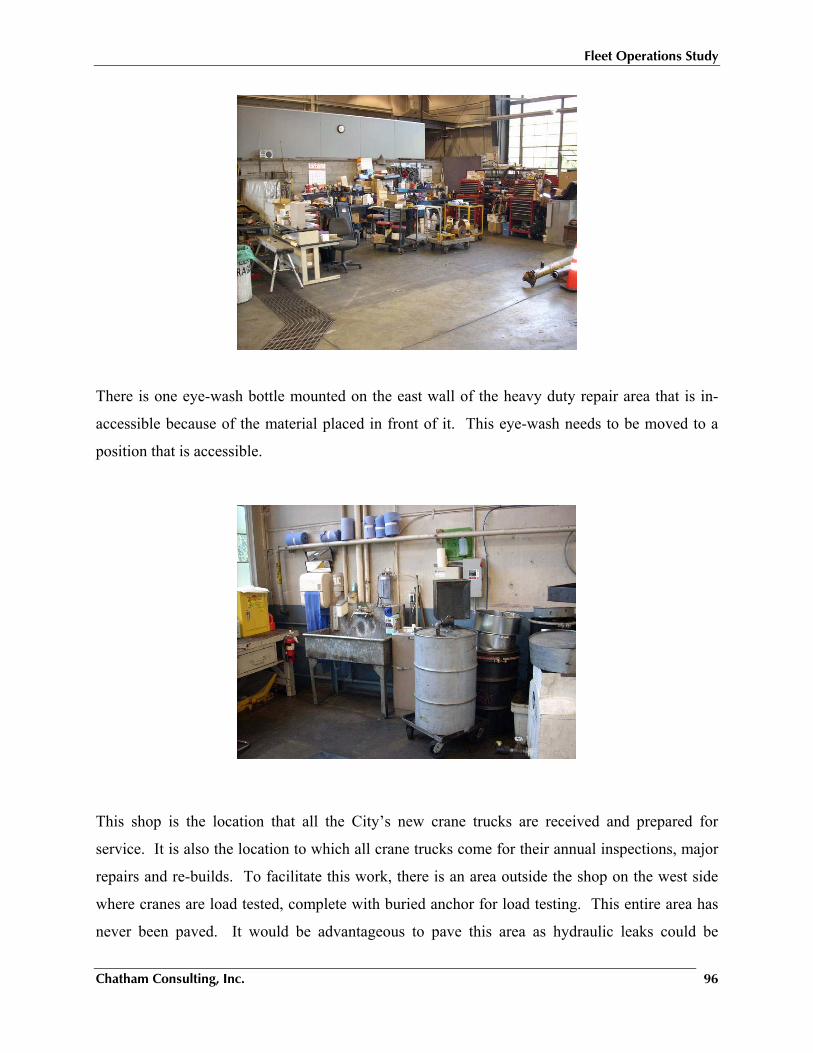
Fleet Operations Study
Chatham Consulting, Inc. 96
There is one eye-wash bottle mounted on the east wall of the heavy duty repair area that is in-
accessible because of the material placed in front of it. This eye-wash needs to be moved to a
position that is accessible.
This shop is the location that all the City’s new crane trucks are received and prepared for
service. It is also the location to which all crane trucks come for their annual inspections, major
repairs and re-builds. To facilitate this work, there is an area outside the shop on the west side
where cranes are load tested, complete with buried anchor for load testing. This entire area has
never been paved. It would be advantageous to pave this area as hydraulic leaks could be
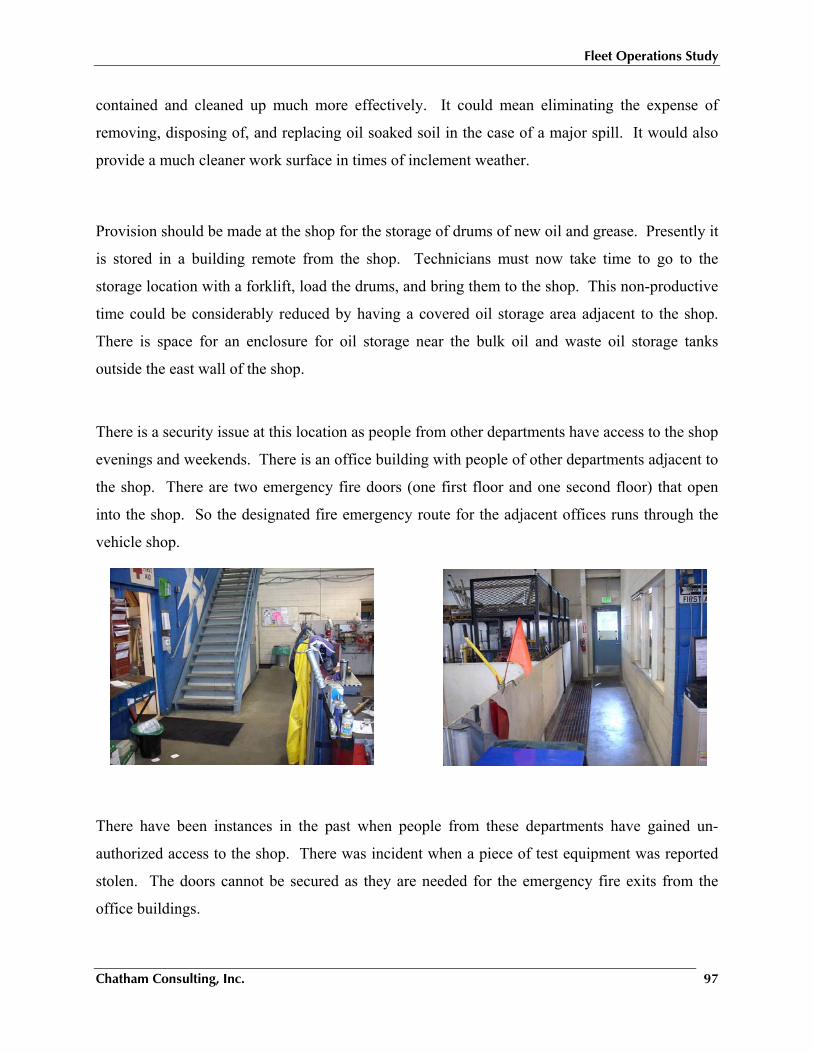
Fleet Operations Study
Chatham Consulting, Inc. 97
contained and cleaned up much more effectively. It could mean eliminating the expense of
removing, disposing of, and replacing oil soaked soil in the case of a major spill. It would also
provide a much cleaner work surface in times of inclement weather.
Provision should be made at the shop for the storage of drums of new oil and grease. Presently it
is stored in a building remote from the shop. Technicians must now take time to go to the
storage location with a forklift, load the drums, and bring them to the shop. This non-productive
time could be considerably reduced by having a covered oil storage area adjacent to the shop.
There is space for an enclosure for oil storage near the bulk oil and waste oil storage tanks
outside the east wall of the shop.
There is a security issue at this location as people from other departments have access to the shop
evenings and weekends. There is an office building with people of other departments adjacent to
the shop. There are two emergency fire doors (one first floor and one second floor) that open
into the shop. So the designated fire emergency route for the adjacent offices runs through the
vehicle shop.
There have been instances in the past when people from these departments have gained un-
authorized access to the shop. There was incident when a piece of test equipment was reported
stolen. The doors cannot be secured as they are needed for the emergency fire exits from the
office buildings.
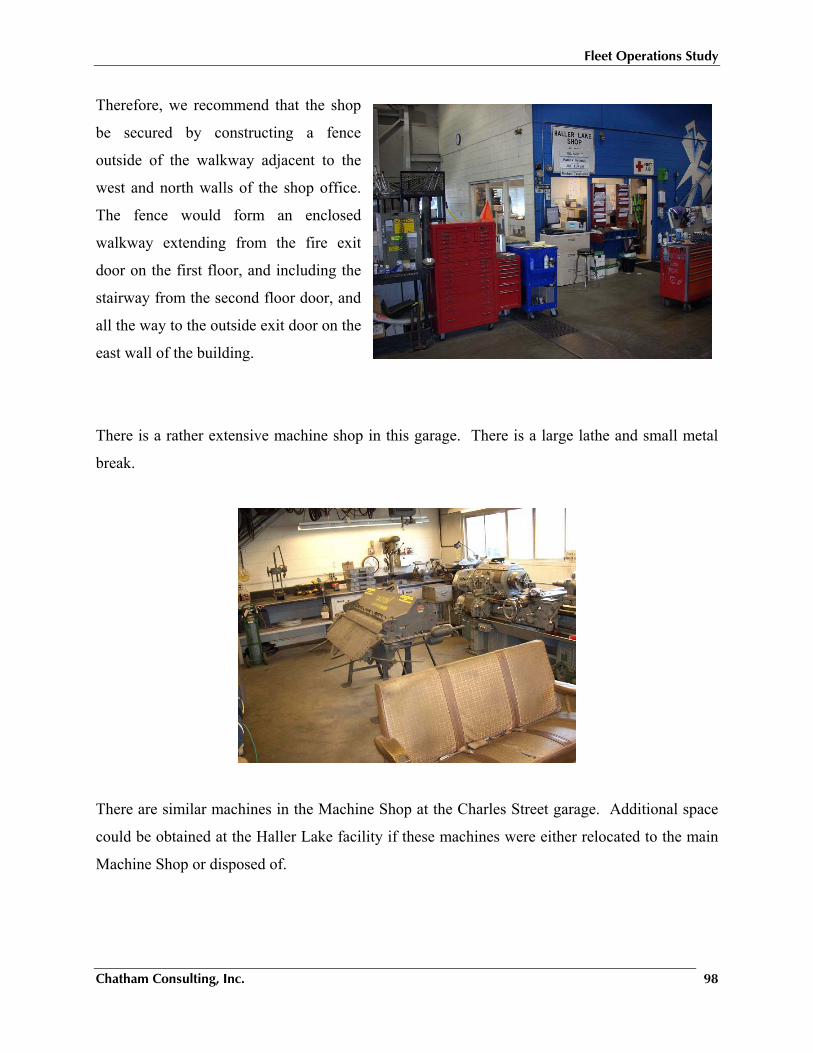
Fleet Operations Study
Chatham Consulting, Inc. 98
Therefore, we recommend that the shop
be secured by constructing a fence
outside of the walkway adjacent to the
west and north walls of the shop office.
The fence would form an enclosed
walkway extending from the fire exit
door on the first floor, and including the
stairway from the second floor door, and
all the way to the outside exit door on the
east wall of the building.
There is a rather extensive machine shop in this garage. There is a large lathe and small metal
break.
There are similar machines in the Machine Shop at the Charles Street garage. Additional space
could be obtained at the Haller Lake facility if these machines were either relocated to the main
Machine Shop or disposed of.
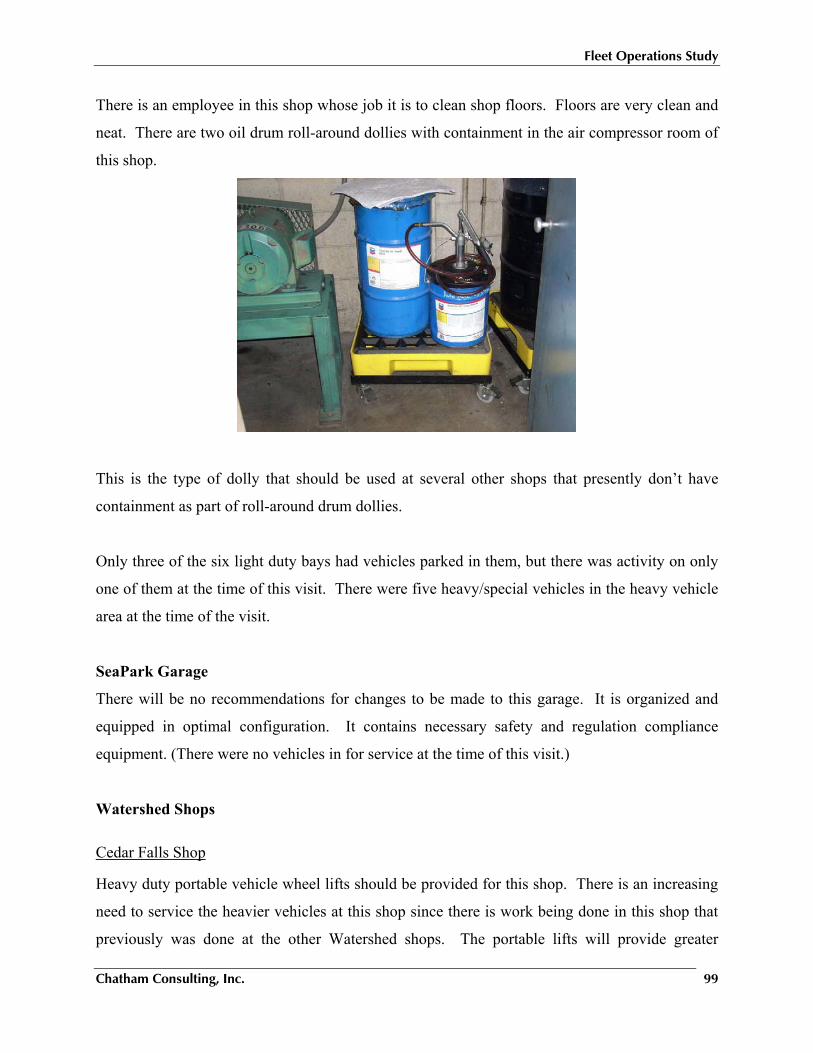
Fleet Operations Study
Chatham Consulting, Inc. 99
There is an employee in this shop whose job it is to clean shop floors. Floors are very clean and
neat. There are two oil drum roll-around dollies with containment in the air compressor room of
this shop.
This is the type of dolly that should be used at several other shops that presently don’t have
containment as part of roll-around drum dollies.
Only three of the six light duty bays had vehicles parked in them, but there was activity on only
one of them at the time of this visit. There were five heavy/special vehicles in the heavy vehicle
area at the time of the visit.
SeaPark Garage
There will be no recommendations for changes to be made to this garage. It is organized and
equipped in optimal configuration. It contains necessary safety and regulation compliance
equipment. (There were no vehicles in for service at the time of this visit.)
Watershed Shops
Cedar Falls Shop
Heavy duty portable vehicle wheel lifts should be provided for this shop. There is an increasing
need to service the heavier vehicles at this shop since there is work being done in this shop that
previously was done at the other Watershed shops. The portable lifts will provide greater
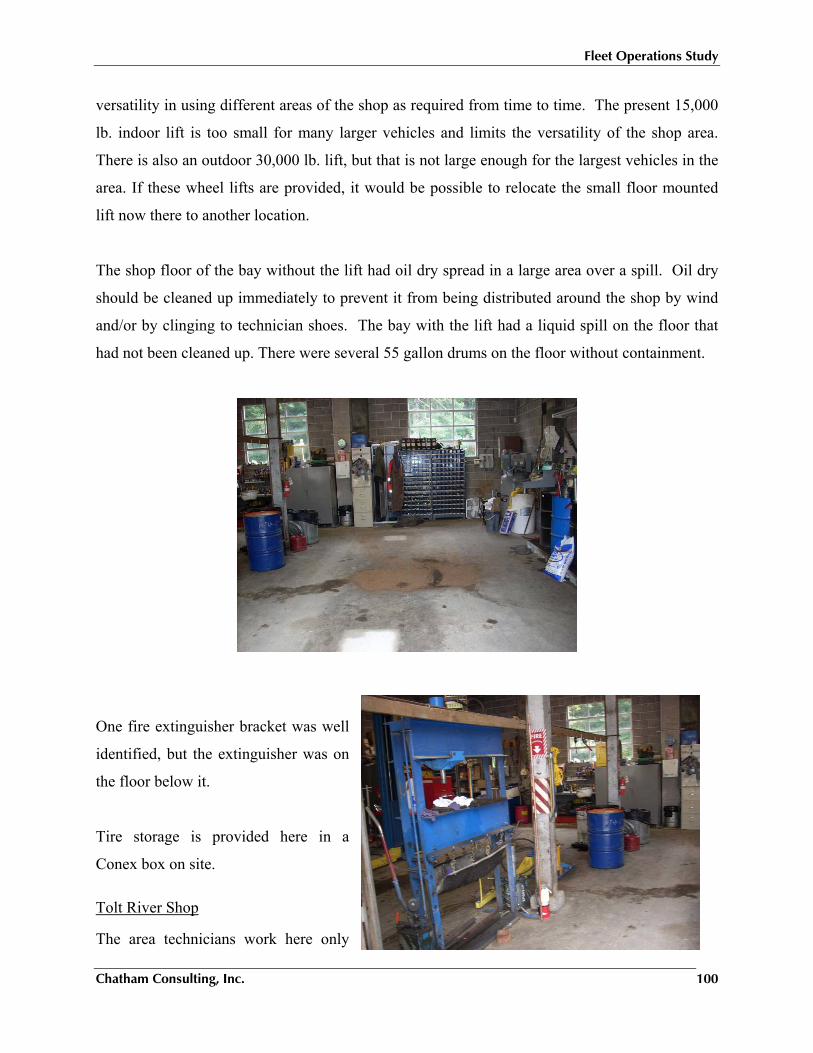
Fleet Operations Study
Chatham Consulting, Inc. 100
versatility in using different areas of the shop as required from time to time. The present 15,000
lb. indoor lift is too small for many larger vehicles and limits the versatility of the shop area.
There is also an outdoor 30,000 lb. lift, but that is not large enough for the largest vehicles in the
area. If these wheel lifts are provided, it would be possible to relocate the small floor mounted
lift now there to another location.
The shop floor of the bay without the lift had oil dry spread in a large area over a spill. Oil dry
should be cleaned up immediately to prevent it from being distributed around the shop by wind
and/or by clinging to technician shoes. The bay with the lift had a liquid spill on the floor that
had not been cleaned up. There were several 55 gallon drums on the floor without containment.
One fire extinguisher bracket was well
identified, but the extinguisher was on
the floor below it.
Tire storage is provided here in a
Conex box on site.
Tolt River Shop
The area technicians work here only
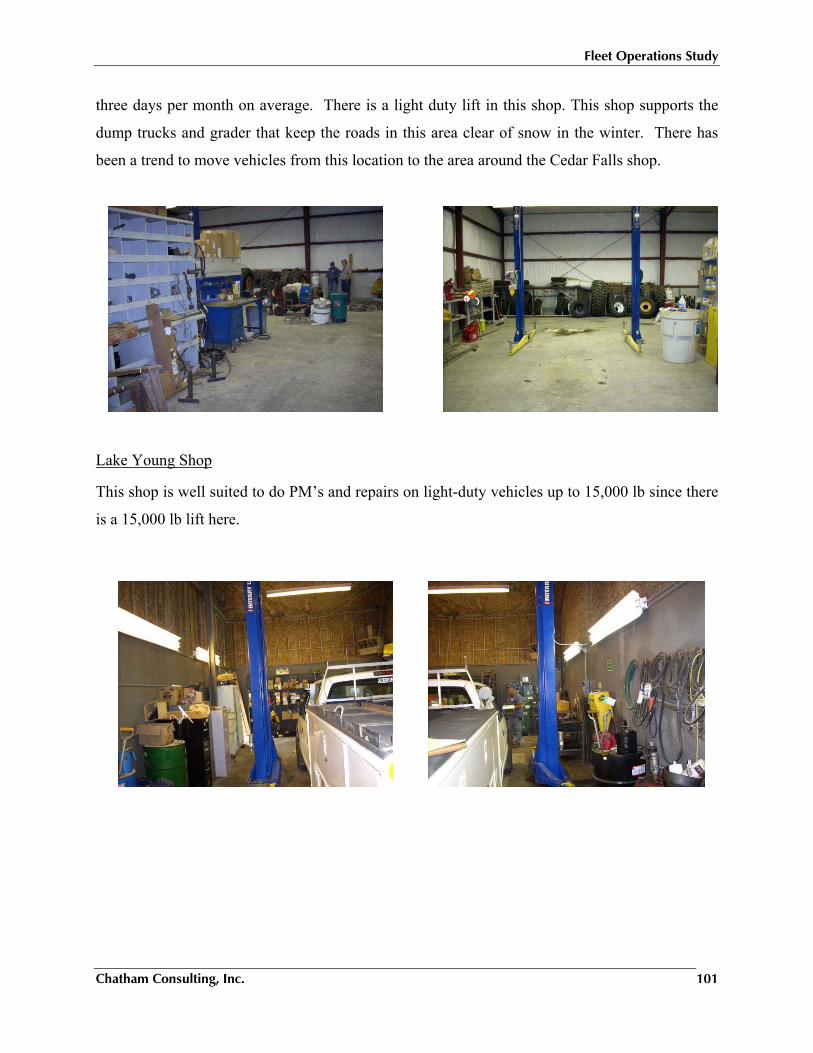
Fleet Operations Study
Chatham Consulting, Inc. 101
three days per month on average. There is a light duty lift in this shop. This shop supports the
dump trucks and grader that keep the roads in this area clear of snow in the winter. There has
been a trend to move vehicles from this location to the area around the Cedar Falls shop.
Lake Young Shop
This shop is well suited to do PM’s and repairs on light-duty vehicles up to 15,000 lb since there
is a 15,000 lb lift here.
Fleet Operations Study
Chatham Consulting, Inc. 102
X. WAREHOUSE OPERATIONS
This chapter examines the Warehouse operations of the Fleet Services Division to improve their
efficiency and effectiveness. For this effort, we:
• Reviewed existing warehouse facilities to determine the effectiveness and efficiency of layout and equipment.
• Analyzed the warehouse operations to develop the inventory carrying cost percentage to help manage the inventory.
• Reviewed on-hand stock needed to meet emergency and special operational requirements.
• Developed a methodology for setting, reviewing, and revising warehouse performance measures, tracking the relevant data, and measuring and reporting results and showed show how inventory can be managed through benchmarking.
• Developed policies and procedures that take into account standard and City-specific warehousing and accounting methodologies and internal controls.
We did not examine the fleet fueling operation as part of this study.
APPROACH
We conducted an extensive series of interviews with administrative, management and technical
personnel from the Fleets and Facilities Department, the Fleet Services Division, including the
Maintenance, Fleet Administration and Warehousing sections.
We also conducted a confidential survey of the warehouse personnel, the results of which are
described in the preceding chapter. We made field inspections and observed operations at each of
the Fleet Services Division’s warehouse facilities. We requested and analyzed the following data
on: • List of stock items. • Non-stock item usage and purchases. • Min-Max for stocked items. • Job descriptions for all positions. • Stock item usage. • Policies and procedures. • Purchases by vendor. • Number of new vehicles per year. • Credit card purchases. • Budget versus actual parts usage for last five years. • Inventory turnover rate. • Yearly inventory variance report for the last two years.
Fleet Operations Study
Chatham Consulting, Inc. 103
EXISTING OPERATIONS The Warehousing section is a support function that has responsibility for the maintaining, issuing
and ordering of inventory, and ordering of any non-stock parts needed for the City’s Fleet
maintenance operation. Warehousing has a complement of 15 employees, and is headed by the
Warehouse Supervisor, who reports to the Director of the Fleet Services Division. The other
staff includes: 1 Chief Warehouser, 8 Senior Warehousers, 3 Warehousers and 1 Maintenance
Aide.
Warehousing currently has five locations that store spare parts. The main storage location is at
the Vehicle Maintenance Building at the Charles Street complex. There are also stockrooms
staffed by Warehouse personnel at the Fire Garage, South Service Center, and Haller Lake
facilities. While the Watershed facilities also stock parts, there are no Warehouse personnel at
these remote locations. Excepting the Fire Garage and Watershed locations, Warehousing
operates two shifts. The Warehousing section uses the FleetAnywhere program to manage the
parts inventory.
WAREHOUSING AND MATERIALS MANAGEMENT CONSIDERATIONS
Understanding how the warehousing and materials management functions and roles work
together harmoniously is the key to have a well run parts supply system. First, the main function
of a Maintenance, Repair and Operation (MRO) warehouse is to provide parts quickly when
needed. This function places the warehouse in the position of a service provider, with the rest of
the maintenance organization as the customers. These customers have a responsibility too, and
that is to communicate their reasonable expectations of service from the warehouse operation.
These expectations involving parts availability should be based on analyzing their impact on
downtime, the likelihood of failure, and the carrying costs of the parts.
Fleet Operations Study
Chatham Consulting, Inc. 104
If a warehouse is run improperly (such as poor inventory accuracy, parts unavailable when
needed due to poor replenishment and procurement practices, etc), the rest of the maintenance
operation has no chance of achieving high service levels of equipment availability and reliability.
Ideally, the time to decide on whether parts should be stocked is when new equipment is placed
in service. Manufacturing and the parts suppliers can work with maintenance in recommending
the spare parts to stock when the new equipment is being purchased.
Management of the warehouse is a Materials Management function that includes the following
areas:
• Inventory Control
o Maintain stock of items to be issued for operations and maintenance.
o Manage inventories of materials and parts and prepare purchase requisitions when stock reaches the reorder point.
o Maintain records and control to prevent duplication of parts minimize loss from pilferage and spoilage and prevent stockouts.
• Procurement
o Select suppliers and issue part requisitions.
o Expedite delivery from suppliers to meet schedules
o Acts as liaison between departments and suppliers.
• Planning.
o Determining the parts that are needed for new purchase vehicles and equipment.
o Developing parts kits to be used during certain p.m. cycles.
WAREHOUSE LAYOUT EFFICIENCY
Layout Principles for Productive Warehouses
We made field visits to each of the Fleet Services Division warehouses and the tire storage areas
at the Tire Shop and Fire Shop at Charles Street. During these visits we looked at their physical
layout and assessed how well they conformed to certain principles that make for a well organized
and productive warehouse. These principles are:
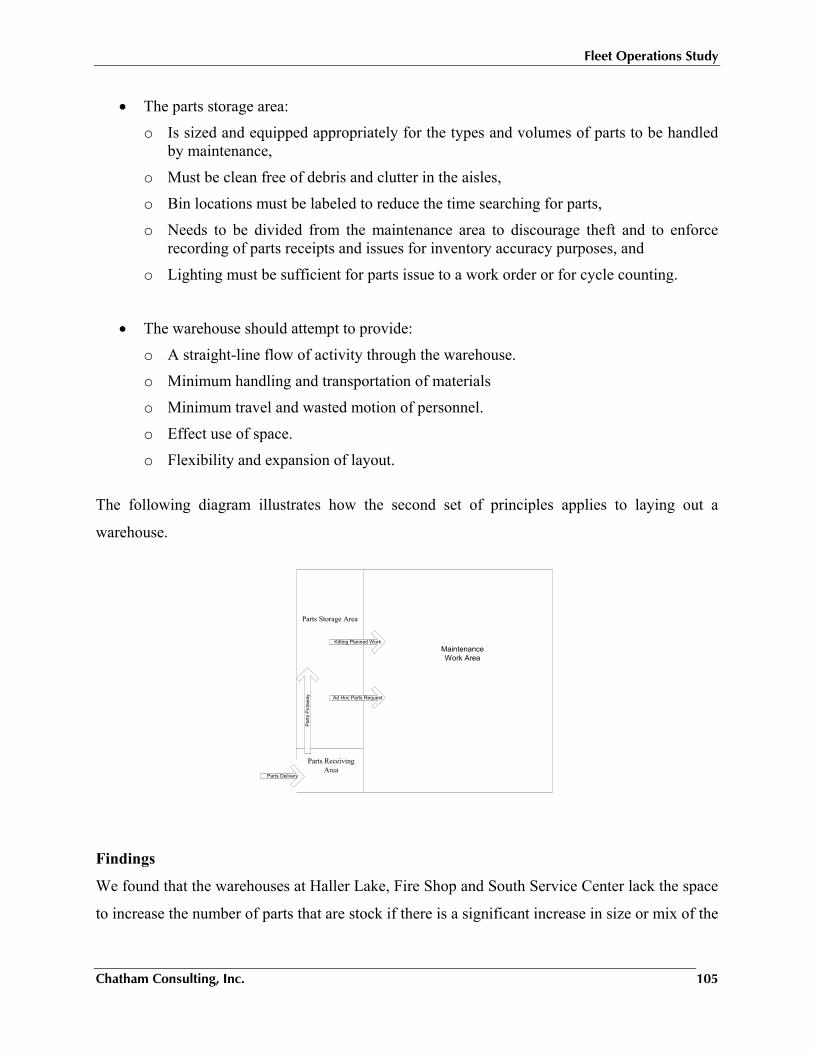
Fleet Operations Study
Chatham Consulting, Inc. 105
• The parts storage area:
o Is sized and equipped appropriately for the types and volumes of parts to be handled by maintenance,
o Must be clean free of debris and clutter in the aisles,
o Bin locations must be labeled to reduce the time searching for parts,
o Needs to be divided from the maintenance area to discourage theft and to enforce recording of parts receipts and issues for inventory accuracy purposes, and
o Lighting must be sufficient for parts issue to a work order or for cycle counting.
• The warehouse should attempt to provide:
o A straight-line flow of activity through the warehouse.
o Minimum handling and transportation of materials
o Minimum travel and wasted motion of personnel.
o Effect use of space.
o Flexibility and expansion of layout.
The following diagram illustrates how the second set of principles applies to laying out a
warehouse.
Parts ReceivingArea
Parts Storage Area
MaintenanceWork Area
Parts Delivery
Ad Hoc Parts Request
Par
ts P
utaw
ay
Kitting Planned Work
Findings
We found that the warehouses at Haller Lake, Fire Shop and South Service Center lack the space
to increase the number of parts that are stock if there is a significant increase in size or mix of the
Fleet Operations Study
Chatham Consulting, Inc. 106
fleet. While each of these locations was generally clean, we observed at several locations
evidence of clutter and parts in the aisle ways.
Presently there is a large tire and wheel inventory in the Tire shop and additional tires stored in
the adjacent Fire shop. This inventory could be larger than necessary. It could be more cost
effective to rely on inventories of local tire suppliers.
The Charles Street warehouse was in the middle of a major rearrangement, but had very little
clutter and no parts in the aisles. The overall condition was average taking into account the
rearrangement effort. Charles Street was locating faster moving parts closer to the issue window
to reduce the warehouser’s travel time.
The South Service Center location was clean but there were parts in the aisles due to the limited
space. The bin locations for parts were clearly identified in the areas that were not in the middle
of rearrangement.
The Haller Lake and Fire Shop locations indicated that they are planning on rearranging parts for
better usage of space. The warehouses are separated from the maintenance area and secured for
limited access. The lighting is adequate to see parts for issuing and inventory counting.
The flow at each warehouse was generally straight-line except at Haller Lake were the intake of
parts for receiving is in the same area as issuing due to the size and layout of the warehouse.
Due to the size and layout of the warehouses, they are set to use the minimal effort and time
stocking or issuing parts. The space is used effectively, but as mentioned previously, most lack
any area for flexibility or expansion.
INVENTORY CARRYING COST
The generally recognized components of inventory carrying cost include inventory financing
charges or the opportunity cost of the inventory investment, insurance, taxes, storage, and
inventory shrink, damage and obsolescence. Below is a brief description of each component:
Fleet Operations Study
Chatham Consulting, Inc. 107
• Opportunity costs: If this value were not invested in inventory, what return could be expected if it were invested in something else, such as treasuries, mutual funds, or even a money market account.
• Inventory insurance: Cost of insuring the inventory and facilities.
• Taxes: Taxes paid on inventory balance.
• Material handling expenses: These expenses are made up mostly of wages and benefits, but include payments or depreciation on material handling equipment, as well as miscellaneous expenses for supplies.
• Warehouse overhead: Total expenses for rent, utilities, repairs and maintenance, and property taxes.
• Inventory shrinkage, damage and obsolescence: The costs of shrinkage, damage and obsolescence are the value of the write- offs taken.
There are several different philosophies on what components make up overhead for material
handling and warehouse. Some material managers only consider the warehouse overhead,
physical space, fixtures, and equipment and ignore any personnel cost. Another group will
include all personnel cost plus physical space, fixtures and equipment. In our opinion, a more
reasonable approach is to include only the personnel cost associated with stocking and picking of
parts, which is generally 20% of the total personnel cost, along with the physical space, fixture
and equipment. Other personnel costs for requisitioning, receiving and issuing would still be
needed if one did not stock any items. (It should be noted that inventory carrying cost is used to
analyzing Economic Order Quantity or stocking philosophy and not for setting markup rates for
charging customers for parts issues. Refer to Chapter XI for a discussion on how these
chargeback rates are computed.)
Estimated Inventory Carrying Costs
Based on our analysis of data provided to us from Fleet Services, we found that warehouse
carrying costs could range between 10 percent and 50 percent, depending how personnel costs
are treated in the computation, as summarized in Chart 55 on the next page. (The detailed
computations are presented in Exhibit 24.)
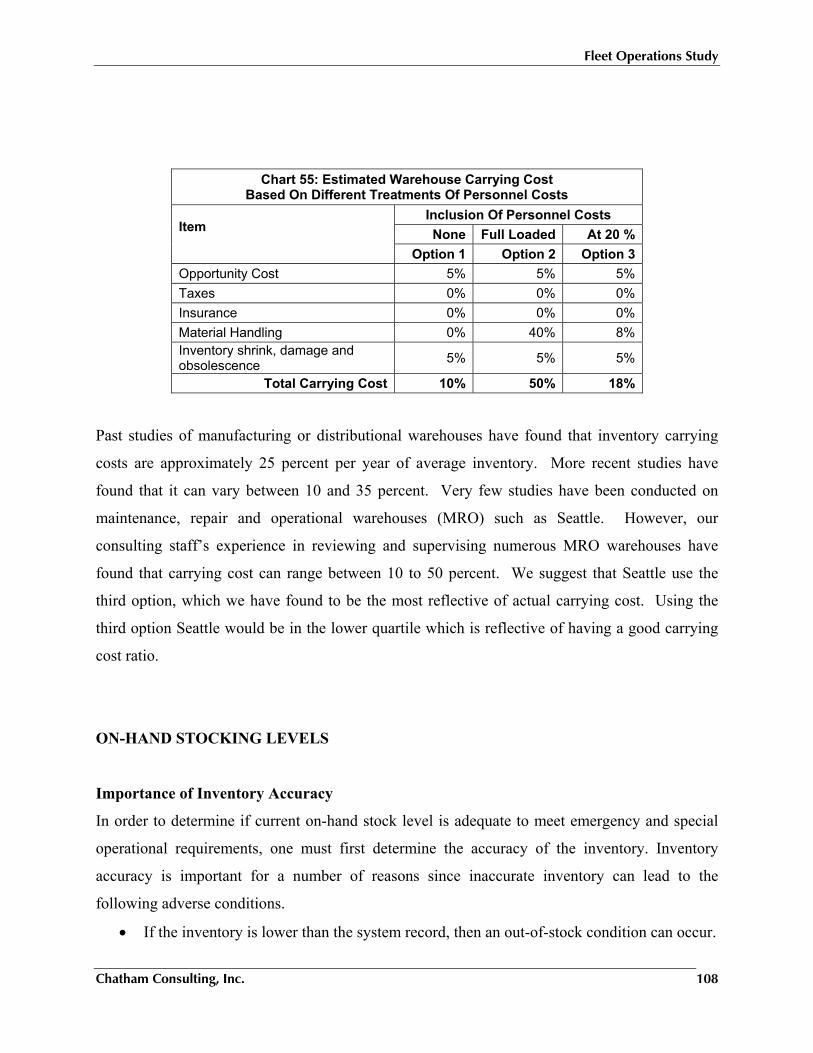
Fleet Operations Study
Chatham Consulting, Inc. 108
Past studies of manufacturing or distributional warehouses have found that inventory carrying
costs are approximately 25 percent per year of average inventory. More recent studies have
found that it can vary between 10 and 35 percent. Very few studies have been conducted on
maintenance, repair and operational warehouses (MRO) such as Seattle. However, our
consulting staff’s experience in reviewing and supervising numerous MRO warehouses have
found that carrying cost can range between 10 to 50 percent. We suggest that Seattle use the
third option, which we have found to be the most reflective of actual carrying cost. Using the
third option Seattle would be in the lower quartile which is reflective of having a good carrying
cost ratio.
ON-HAND STOCKING LEVELS
Importance of Inventory Accuracy
In order to determine if current on-hand stock level is adequate to meet emergency and special
operational requirements, one must first determine the accuracy of the inventory. Inventory
accuracy is important for a number of reasons since inaccurate inventory can lead to the
following adverse conditions.
• If the inventory is lower than the system record, then an out-of-stock condition can occur.
Chart 55: Estimated Warehouse Carrying Cost Based On Different Treatments Of Personnel Costs
Item Inclusion Of Personnel Costs None Full Loaded At 20 %
Option 1 Option 2 Option 3 Opportunity Cost 5% 5% 5% Taxes 0% 0% 0% Insurance 0% 0% 0% Material Handling 0% 40% 8% Inventory shrink, damage and obsolescence 5% 5% 5%
Total Carrying Cost 10% 50% 18%
Fleet Operations Study
Chatham Consulting, Inc. 109
• If the inventory is higher than the system record, then parts could be re-ordered by the system even if not needed.
• If the inventory is not accurate, then the maintenance technicians will lose confidence in the inventory control system. This leads to a growing bench stock, if technicians do not have confidence in the service levels of the warehouse.
Achieving high levels of inventory accuracy requires:
• Recording all parts receipts against purchase orders or outside repair orders.
• Recording receipts of parts returned to the warehouse that were previously issued to a work order but not actually used.
• Recording parts stocking locations.
• Recording all parts issued to a work order.
• Performing routine and accurate cycle counts.
Inventory Assessment of the Fleet Services Division Warehouse
We analyzed data pertaining to reorder point and quantity, issues for the last 12 months and on-
hand quantities to determine if the warehouse recordkeeping is accurate. During this review we
found that the warehouse inventory count accuracy rate has ranged between 17.7 and 16.6
percent from 2004 to 2006. The current parts list furnished by Fleet Services has a 3 percent
error rate which is derived from records that shows parts issued but no quantities or parts with
issue dates but no quantities. This is a snap shot in time and does not reflect the actual error rate
for the year which is based off of the yearend inventory count.
While the overall trend for the City is downward, the trends at Haller Lake and South Service
Center are trending upward. The inventory variance amount for 2006 was approximately minus
$125,000, which is the difference between the yearend inventory and Summit financial system
records. This variance equates to 10 percent of the total inventory value when matched to the
Summit financial system records. This result is above the average that we have observed for this
index at other fleet supply organizations.
During our interviews it was stated that each stock item on the reorder print is counted to ensure
that it is needed, and that this process allows Warehouse personnel to cycle count most stock
items. With the discrepancies in the count at year end and the parts list provided, just verifying
Fleet Operations Study
Chatham Consulting, Inc. 110
the items on the reorder print is not sufficient to ensure the accuracy of the inventory. Accuracy
is also hampered by the multiple descriptions in the system for the same part (i.e. Pump Water,
Water Pump). This can cause extended research time when trying to refer to or find a part by a
mechanic or warehouser.
Without accurate inventory data it is difficult to determine the adequacy of stock to handle day-
to-day operations much less emergency or special operational needs.
Template For Establishing On-Hand Quantities Needed
As previously stated, the inventory accuracy rate is too low for a proper determination of on-
hand quantities needed for emergency and special operational requirements. When the inventory
accuracy rate is within acceptable limits (1 to 3 percent), the Warehousing Section can use the
following template to establish on-hand quantities needed.
1. Determine if the inventory accuracy is within acceptable performance levels.
2. Determine the time duration, seasonal period and extent of interrupted outside services for the emergency or special operational needs.
3. Determine individual parts usage for A and B category parts as follows:
a. Take the monthly usage to see if there are any seasonal patterns. If the parts usage is consistent then:
i. Take the last 12 months total usage and divide by 12 to get the yearly monthly average.
ii. Multiply the yearly average monthly usage by the duration of the event.
iii. Match the amount derived to the reorder point and safety stock; if the derived amount is higher than the quantity is not sufficient.
b. If the event is seasonal then:
i. Take the seasonal month’s total usage and divide by number of months of the seasonal period to get the seasonal monthly average.
ii. Multiply the seasonal average monthly usage by the duration of the event.
iii. Match the amount derived to the reorder point and safety stock; if the derived amount is higher than the quantity is not sufficient.
Fleet Operations Study
Chatham Consulting, Inc. 111
PERFORMANCE MEASURES AND BENCHMARKING
The basic reason for having performance measures is to make sure that the organization being
measured is moving toward a specific long-term goal. Many organizations define too many
measures. In doing so, they sometimes forget the original purpose behind these measures.
While many performance measures exist in materials management, we suggest that four should
be used by an MRO organization. These measures will encourage improvements in the
receiving, storing, and issuing functions in a materials management program. These measures
can also be used to improve inventory security if theft or damage is high. Moreover, by
tightening control on inventory, the potential for stockouts can be reduced and unnecessary
replenishments avoided. The four performance measurements are described below, and are
demonstrated in Exhibit 25 with actual Warehousing data from Fleet Services.
Inventory Accuracy Rate
Inventory accuracy is a measurement between the computer record inventory and the physical
inventory on hand. Inventory accuracy is generally measured through physical count. The
objective is to have on location and in inventory, those items that are being carried on the books.
The inventory accuracy rate indicates how well receipts to and issues from stock locations are
recorded in the computer records. The inventory accuracy rate is determined as follows:
• Inventory Accuracy% = (Number of Accurate Quantities in Bin Locations Inventoried / Total Bin Locations Inventoried) X 100
Inventory Variance Rate
Inventory variances are changes to the inventory balance in the inventory records. Inventory
variances can be made at any time, but are most commonly made after annual physical counts of
stocked items are compared to recorded data. Inventory variances can be either gains or losses,
both of which can indicate problems in inventory management.
• Calculate the sum of the dollar value of inventory gains (IG) and the absolute dollar value of inventory losses (IL) for the period. The result is (IG + IL).
• Calculate the following rate: Inventory Adjustment% = ((IG + IL) / Average Value of Inventory) X 100
Fleet Operations Study
Chatham Consulting, Inc. 112
Inventory Turnover Rate
The inventory turnover rate indicates the number of times that the average item in stock has been
replenished during the year. A low turnover rate is indicative of either a long procurement lead
time or low usage of stocked items. A higher turnover rate could indicate more efficient use of
available resources, provided customer orders are being filled and the prices of stocks purchases
are acceptable. The inventory turnover rate is determined by the following ratio:
• Dollar Value of Total Inventory Issues / Dollar Value of Average Inventory on Hand
Stockout Rate
A stockout is defined as a zero inventory balance for a stocked item. A stockout condition exists
even if demand for the item does not exist. The stockout rate indicates the effectiveness of the
materials management activity’s reordering processes. The stock out rate is determined by the
following ratio:
• Number of Stocked Items with Zero Balance / Total Number of Stocked Items) X 100
Benchmarking
The Benchmarking Chapter of this report produced comparative ratios data regarding materials
management performance indicators. These will be discussed further below.
Inventory
We found among the cities surveyed that the City of Seattle had a total inventory per in-house
MRU (vehicle equivalency) that was greater than average. This reflects a possible overstock
situation or a large amount of emergency stock. Seattle should try to move closer to the center by
analyzing what items are carried in stock. (See Chart 56 on the next page.)
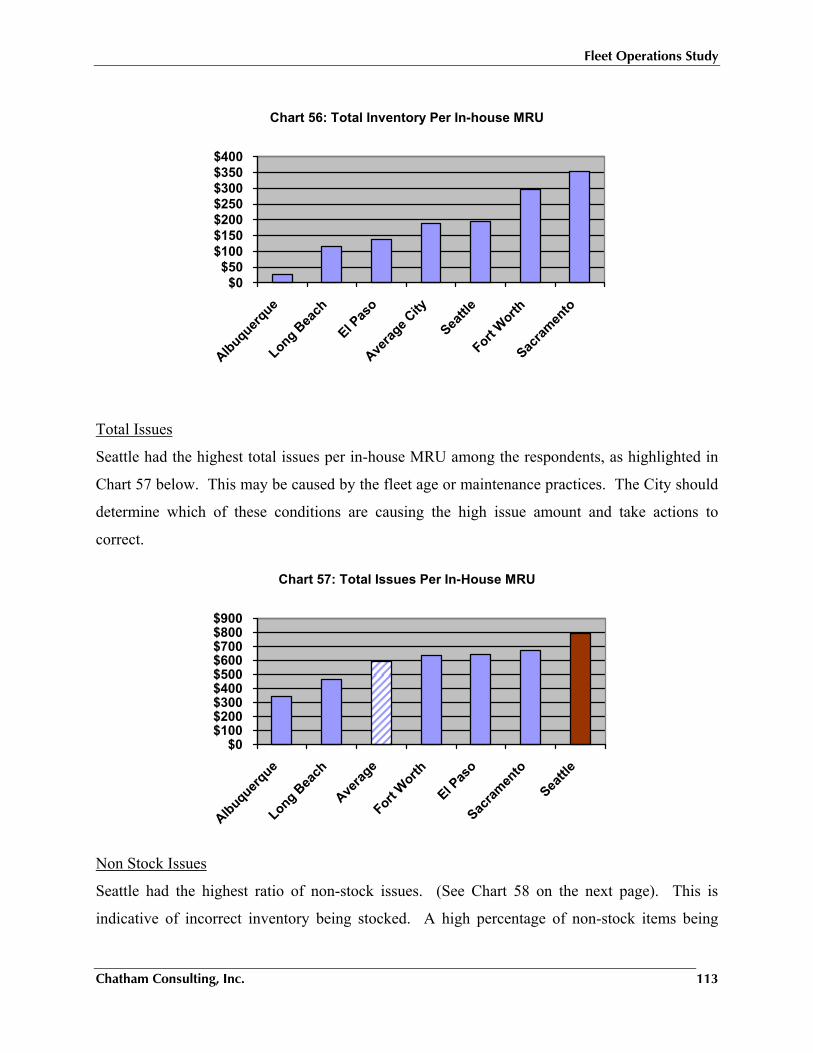
Fleet Operations Study
Chatham Consulting, Inc. 113
Chart 56: Total Inventory Per In-house MRU
$0$50
$100$150$200$250$300$350$400
Albuquerque
Long Bea
ch
El Pas
o
Averag
e City
Seattle
Fort Worth
Sacram
ento
Total Issues
Seattle had the highest total issues per in-house MRU among the respondents, as highlighted in
Chart 57 below. This may be caused by the fleet age or maintenance practices. The City should
determine which of these conditions are causing the high issue amount and take actions to
correct.
Chart 57: Total Issues Per In-House MRU
$0$100$200$300$400$500$600$700$800$900
Albuquerque
Long Bea
ch
Averag
e
Fort Worth
El Pas
o
Sacram
ento
Seattle
Non Stock Issues
Seattle had the highest ratio of non-stock issues. (See Chart 58 on the next page). This is
indicative of incorrect inventory being stocked. A high percentage of non-stock items being
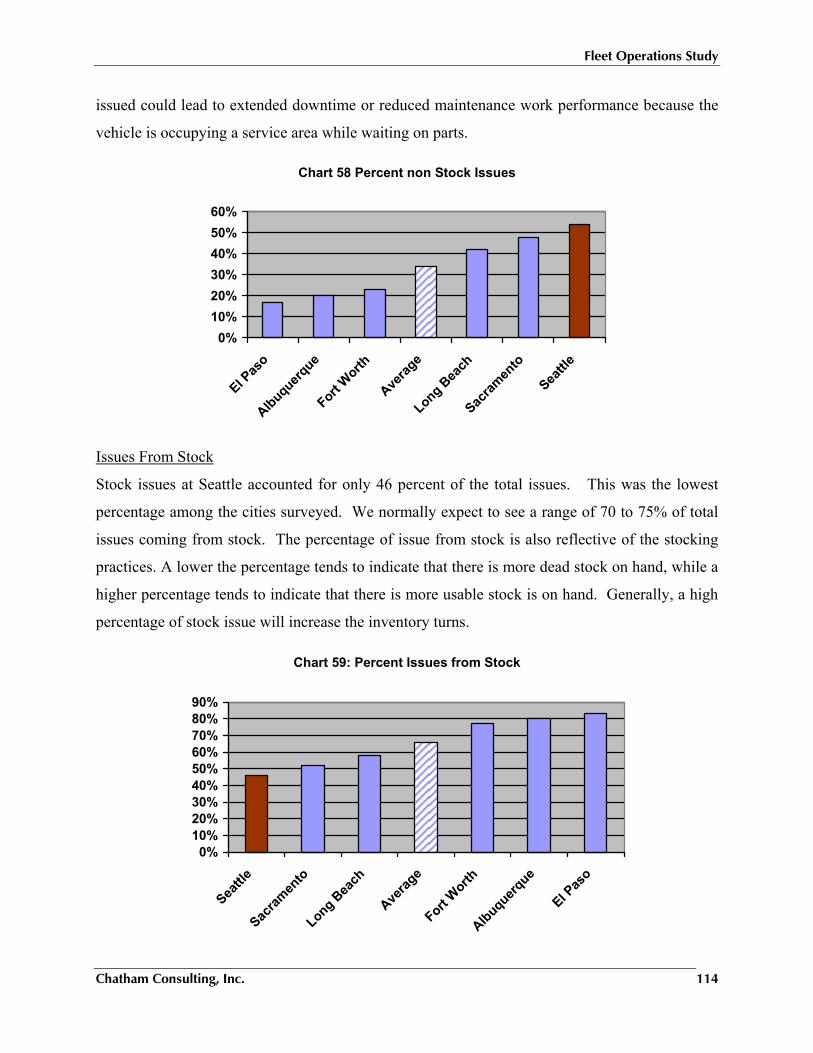
Fleet Operations Study
Chatham Consulting, Inc. 114
issued could lead to extended downtime or reduced maintenance work performance because the
vehicle is occupying a service area while waiting on parts.
Chart 58 Percent non Stock Issues
0%10%20%30%40%50%60%
El Pas
o
Albuquerque
Fort Worth
Averag
e
Long Bea
ch
Sacram
ento
Seattle
Issues From Stock
Stock issues at Seattle accounted for only 46 percent of the total issues. This was the lowest
percentage among the cities surveyed. We normally expect to see a range of 70 to 75% of total
issues coming from stock. The percentage of issue from stock is also reflective of the stocking
practices. A lower the percentage tends to indicate that there is more dead stock on hand, while a
higher percentage tends to indicate that there is more usable stock is on hand. Generally, a high
percentage of stock issue will increase the inventory turns.
Chart 59: Percent Issues from Stock
0%10%20%30%40%50%60%70%80%90%
Seattle
Sacram
ento
Long Bea
ch
Averag
e
Fort Worth
Albuquerque
El Pas
o
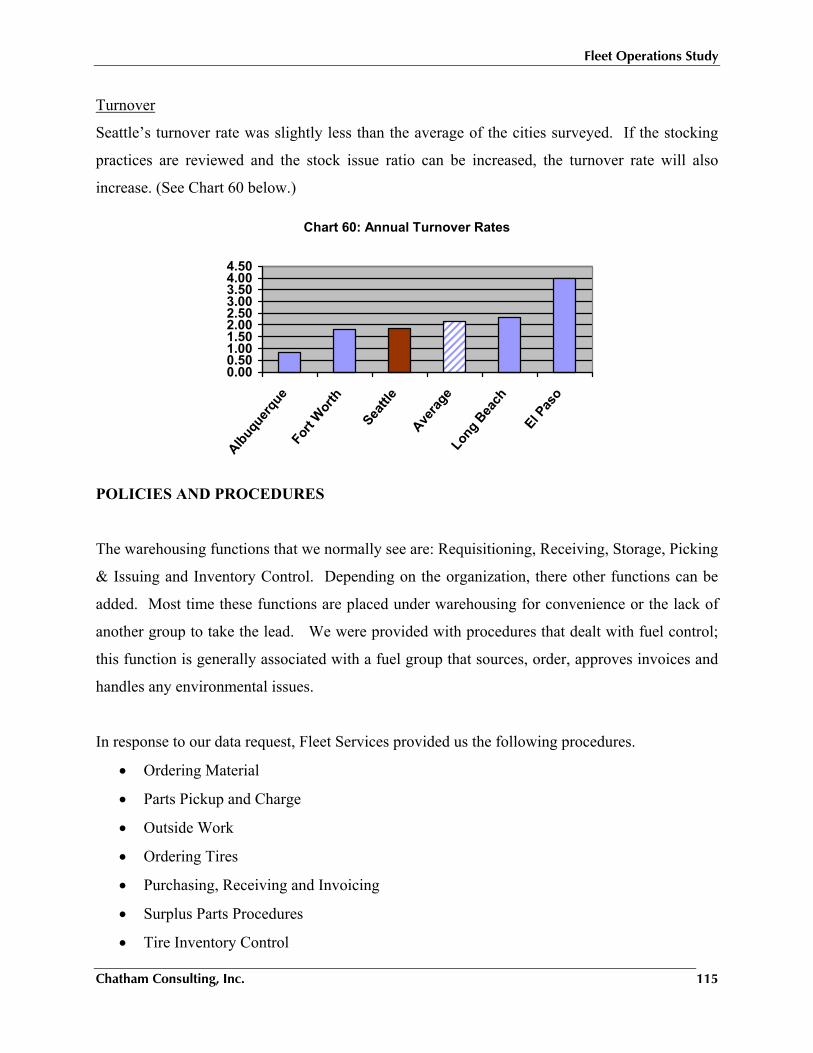
Fleet Operations Study
Chatham Consulting, Inc. 115
Turnover
Seattle’s turnover rate was slightly less than the average of the cities surveyed. If the stocking
practices are reviewed and the stock issue ratio can be increased, the turnover rate will also
increase. (See Chart 60 below.)
Chart 60: Annual Turnover Rates
0.000.501.001.502.002.503.003.504.004.50
Albuqu
erqu
eFo
rt W
orth
Seattl
e
Avera
geLo
ng B
each
El Pas
o
POLICIES AND PROCEDURES
The warehousing functions that we normally see are: Requisitioning, Receiving, Storage, Picking
& Issuing and Inventory Control. Depending on the organization, there other functions can be
added. Most time these functions are placed under warehousing for convenience or the lack of
another group to take the lead. We were provided with procedures that dealt with fuel control;
this function is generally associated with a fuel group that sources, order, approves invoices and
handles any environmental issues.
In response to our data request, Fleet Services provided us the following procedures.
• Ordering Material
• Parts Pickup and Charge
• Outside Work
• Ordering Tires
• Purchasing, Receiving and Invoicing
• Surplus Parts Procedures
• Tire Inventory Control
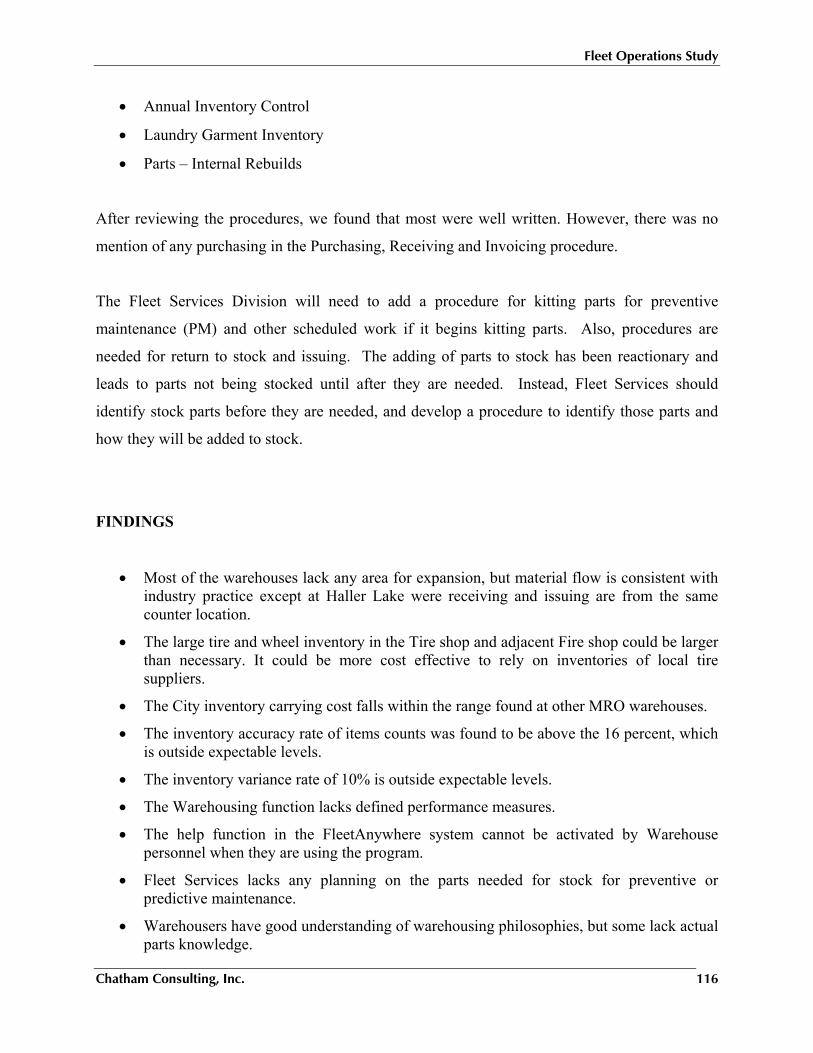
Fleet Operations Study
Chatham Consulting, Inc. 116
• Annual Inventory Control
• Laundry Garment Inventory
• Parts – Internal Rebuilds
After reviewing the procedures, we found that most were well written. However, there was no
mention of any purchasing in the Purchasing, Receiving and Invoicing procedure.
The Fleet Services Division will need to add a procedure for kitting parts for preventive
maintenance (PM) and other scheduled work if it begins kitting parts. Also, procedures are
needed for return to stock and issuing. The adding of parts to stock has been reactionary and
leads to parts not being stocked until after they are needed. Instead, Fleet Services should
identify stock parts before they are needed, and develop a procedure to identify those parts and
how they will be added to stock.
FINDINGS
• Most of the warehouses lack any area for expansion, but material flow is consistent with industry practice except at Haller Lake were receiving and issuing are from the same counter location.
• The large tire and wheel inventory in the Tire shop and adjacent Fire shop could be larger than necessary. It could be more cost effective to rely on inventories of local tire suppliers.
• The City inventory carrying cost falls within the range found at other MRO warehouses.
• The inventory accuracy rate of items counts was found to be above the 16 percent, which is outside expectable levels.
• The inventory variance rate of 10% is outside expectable levels.
• The Warehousing function lacks defined performance measures.
• The help function in the FleetAnywhere system cannot be activated by Warehouse personnel when they are using the program.
• Fleet Services lacks any planning on the parts needed for stock for preventive or predictive maintenance.
• Warehousers have good understanding of warehousing philosophies, but some lack actual parts knowledge.
Fleet Operations Study
Chatham Consulting, Inc. 117
• Fuel control is a very time consuming part of the warehousing duties, and takes away from their core duties.
RECOMMENDATIONS
• Develop and use the ABC analysis technique of stock items to segregate low moving parts so a true inventory turnover rate can be identified. The MRO inventory would then be classified into three categories:
o A - Continual-Use Items – These are maintenance items and other products that are continually used.
o B - Specific-Need Inventory – Though not continually used, these items are used on a regularly scheduled basis.
o C - Emergency-Repair Parts – These are parts whose sporadic usage cannot be predicted, and which should be excluded from the inventory turnover computation.
• The warehouse should begin kitting parts for preventive maintenance and other scheduled work where it is feasible. This will level out the warehouse workload and provide better service (higher availability of parts) to the technicians. If the warehouse personnel have access to the preventive maintenance schedule, they can build PM kits in advance of the scheduled PM time.
• Review existing inventory to ensure that the correct parts and quantities are being stocked, to increase the turns per year and reduce the total inventory on hand. Identify parts that are needed for predictive maintenance and timeline for adding to stock.
• Start planning PM and other definable work in advance and give the schedule to Warehousing for part kitting. Please see Exhibit 26 for illustrative procedure.
• The Warehouse should start collecting data to develop additional performance measures such as inventory accuracy rate, inventory variance rate and inventory stockout rate, to better manage the inventory. The following lists recommended performance targets.
o Inventory Accuracy Rate: 1-3%
o Inventory Variance Rate: 2-5%
o Inventory Turnover Rate: 3-4
o Stockout Rate: 10%
• Identify parts for stock at the time of the vehicle delivery. This should include items immediately needed, and items for predictive maintenance in the future.
• Have the help screens for Fleet Anywhere available while in the system.
• Have Warehouser take the ASE Parts Specialist series to improve their knowledge of parts to compliment their knowledge of warehousing procedures.
Fleet Operations Study
Chatham Consulting, Inc. 118
• The duties and reporting structure for the fuels control personnel should be clarified.
• A study should be done to determine the number and sizes of tires and wheels to be stored by the City.
• It may be possible to cost-effectively reduce tire inventory in Tire Shop to a level that would provide tires for immediate use and rely on inventory maintained at tire suppliers.
Fleet Operations Study
Chatham Consulting, Inc. 119
XI. RATE SETTING AND REPLACEMENT FUNDING
BACKGROUND
The Council of the City of Seattle through ordinance codified the establishment not only of the
Fleets and Facilities Department, but also a Fleets and Facilities Fund. This fund functions as an
internal service fund for the deposit of revenues and payment of expenditures for the
Department. The ordinance also authorized creating separate subfunds for Fleet Services,
Facilities Services, and Administrative Services of the Department. In addition, the ordinance
codified certain financial and operating policies regarding the charging back of operating
expenses, setting aside sufficient funds for the recovery of capital fleet replacements, centralizing
fleet management, establishing inter-departmental memoranda of understanding, and other fleet
administrative responsibilities.
On one hand, the fact that the City has codified a dedicated fleet fund is a best practice since it
provides the foundation for recovery of costs directly associated with fleet operating expenses
and capital expenditures. On the other hand, major improvements are needed in fund structure,
rate computation, capital recovery analysis and transparency. Exacerbating the situation are the
following factors:
• The Fleet Services Division is a large and complex organization that provides a multitude of services for a very large city fleet.
• Its customers have diverse needs, expectations and relationships with the Division.
• The existing methodologies for computing chargebacks are quite complex and not clearly understood by the customer base.
• Replacement funds are comingled with operating funds making it more difficult to easily determine how much money is actually available to meet future replacement needs.
• Existing rates are under recovering current fleet maintenance expenses, and may be under recovering projected capital requirements.
• A lack of transparency, although unintended, in rate development and funding creates:
o Doubt among customers on whether there are sufficient funds to replace their vehicles when due; and,
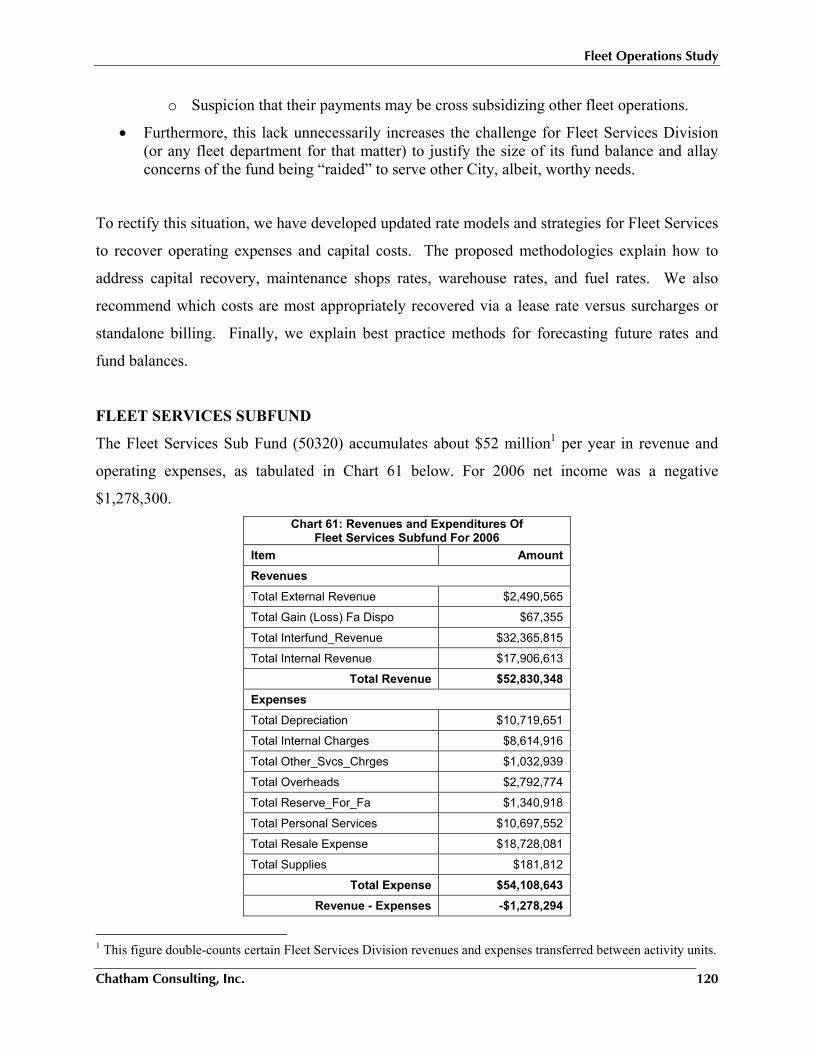
Fleet Operations Study
Chatham Consulting, Inc. 120
o Suspicion that their payments may be cross subsidizing other fleet operations.
• Furthermore, this lack unnecessarily increases the challenge for Fleet Services Division (or any fleet department for that matter) to justify the size of its fund balance and allay concerns of the fund being “raided” to serve other City, albeit, worthy needs.
To rectify this situation, we have developed updated rate models and strategies for Fleet Services
to recover operating expenses and capital costs. The proposed methodologies explain how to
address capital recovery, maintenance shops rates, warehouse rates, and fuel rates. We also
recommend which costs are most appropriately recovered via a lease rate versus surcharges or
standalone billing. Finally, we explain best practice methods for forecasting future rates and
fund balances.
FLEET SERVICES SUBFUND
The Fleet Services Sub Fund (50320) accumulates about $52 million1 per year in revenue and
operating expenses, as tabulated in Chart 61 below. For 2006 net income was a negative
$1,278,300. Chart 61: Revenues and Expenditures Of
Fleet Services Subfund For 2006 Item Amount Revenues Total External Revenue $2,490,565
Total Gain (Loss) Fa Dispo $67,355
Total Interfund_Revenue $32,365,815
Total Internal Revenue $17,906,613
Total Revenue $52,830,348 Expenses
Total Depreciation $10,719,651
Total Internal Charges $8,614,916
Total Other_Svcs_Chrges $1,032,939
Total Overheads $2,792,774
Total Reserve_For_Fa $1,340,918
Total Personal Services $10,697,552
Total Resale Expense $18,728,081
Total Supplies $181,812
Total Expense $54,108,643 Revenue - Expenses -$1,278,294
1 This figure double-counts certain Fleet Services Division revenues and expenses transferred between activity units.
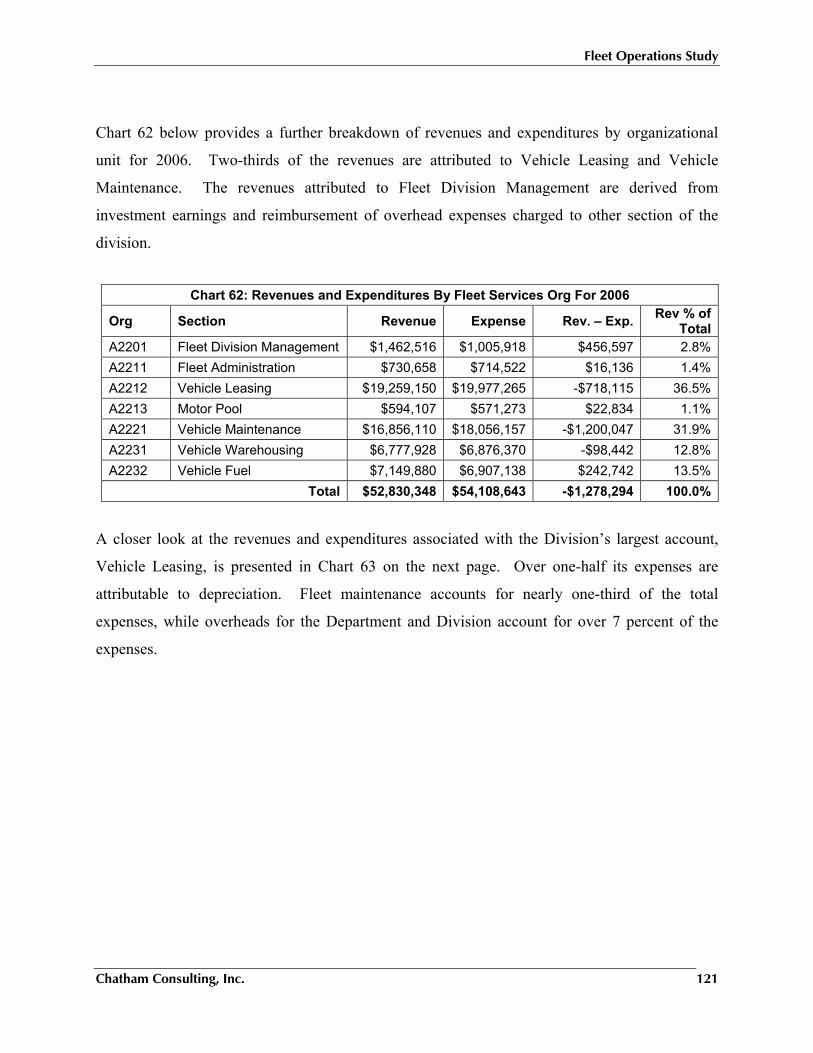
Fleet Operations Study
Chatham Consulting, Inc. 121
Chart 62 below provides a further breakdown of revenues and expenditures by organizational
unit for 2006. Two-thirds of the revenues are attributed to Vehicle Leasing and Vehicle
Maintenance. The revenues attributed to Fleet Division Management are derived from
investment earnings and reimbursement of overhead expenses charged to other section of the
division.
A closer look at the revenues and expenditures associated with the Division’s largest account,
Vehicle Leasing, is presented in Chart 63 on the next page. Over one-half its expenses are
attributable to depreciation. Fleet maintenance accounts for nearly one-third of the total
expenses, while overheads for the Department and Division account for over 7 percent of the
expenses.
Chart 62: Revenues and Expenditures By Fleet Services Org For 2006
Org Section Revenue Expense Rev. – Exp. Rev % of Total
A2201 Fleet Division Management $1,462,516 $1,005,918 $456,597 2.8%A2211 Fleet Administration $730,658 $714,522 $16,136 1.4%A2212 Vehicle Leasing $19,259,150 $19,977,265 -$718,115 36.5%A2213 Motor Pool $594,107 $571,273 $22,834 1.1%A2221 Vehicle Maintenance $16,856,110 $18,056,157 -$1,200,047 31.9%A2231 Vehicle Warehousing $6,777,928 $6,876,370 -$98,442 12.8%A2232 Vehicle Fuel $7,149,880 $6,907,138 $242,742 13.5%
Total $52,830,348 $54,108,643 -$1,278,294 100.0%
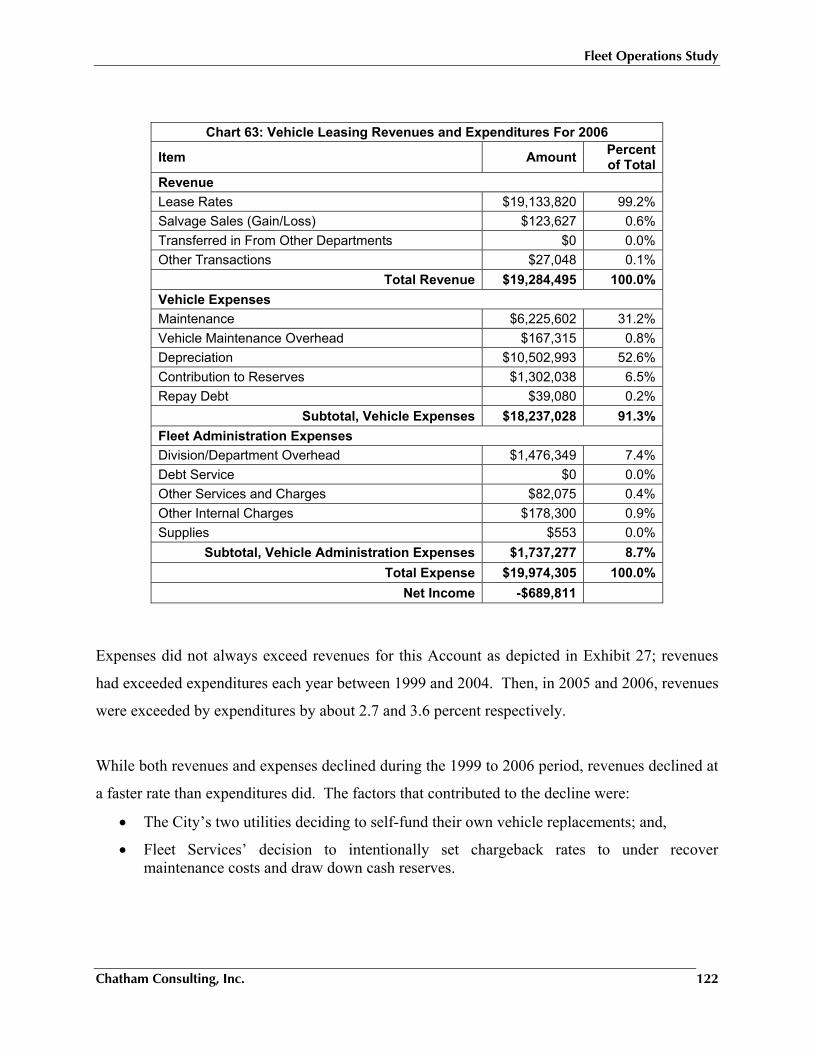
Fleet Operations Study
Chatham Consulting, Inc. 122
Expenses did not always exceed revenues for this Account as depicted in Exhibit 27; revenues
had exceeded expenditures each year between 1999 and 2004. Then, in 2005 and 2006, revenues
were exceeded by expenditures by about 2.7 and 3.6 percent respectively.
While both revenues and expenses declined during the 1999 to 2006 period, revenues declined at
a faster rate than expenditures did. The factors that contributed to the decline were:
• The City’s two utilities deciding to self-fund their own vehicle replacements; and,
• Fleet Services’ decision to intentionally set chargeback rates to under recover maintenance costs and draw down cash reserves.
Chart 63: Vehicle Leasing Revenues and Expenditures For 2006
Item Amount Percent of Total
Revenue Lease Rates $19,133,820 99.2%Salvage Sales (Gain/Loss) $123,627 0.6%Transferred in From Other Departments $0 0.0%Other Transactions $27,048 0.1%
Total Revenue $19,284,495 100.0%Vehicle Expenses Maintenance $6,225,602 31.2%Vehicle Maintenance Overhead $167,315 0.8%Depreciation $10,502,993 52.6%Contribution to Reserves $1,302,038 6.5%Repay Debt $39,080 0.2%
Subtotal, Vehicle Expenses $18,237,028 91.3%Fleet Administration Expenses Division/Department Overhead $1,476,349 7.4%Debt Service $0 0.0%Other Services and Charges $82,075 0.4%Other Internal Charges $178,300 0.9%Supplies $553 0.0%
Subtotal, Vehicle Administration Expenses $1,737,277 8.7%Total Expense $19,974,305 100.0%
Net Income -$689,811
Fleet Operations Study
Chatham Consulting, Inc. 123
The lower section of Exhibit 27 tabulates the changes in cash flow during this period. Cash flow
has been not only negative during the past two years but also significantly so. By 2006 the
negative cash flow equated to over 20 percent of revenues and over 30 percent of cash balance
on hand. Fleet Services has forecasted cash flow to decline during 2007 by about $3 million, and
result in a reduced cash balance of $10 million at year end 2007. The continuing decline in cash
balance may have a dampening effect on Fleet Services’ future ability to make normal
replacements of the fleet let alone of the backlog replacements that currently stand at about $6
million.
The true nature of this impact is obscured by the inherent complexity of the multi-component
rates in the Vehicle Lease program, the comingling of capital and operating dollars in the same
fund, and the lack of separate funds for each department’s fleet.
Volatility Among Departments
While Fleet Services does not dedicate funds to specific departments, it does keep track of
payments, expenditures and cash flow on a department basis. As shown in Exhibit 28, there is
considerable volatility among both net incomes and cash flows by department from year to year.
Furthermore, revenues by department vary somewhat from one year to the next. Instead, they
should be relatively stable and increase only slightly each year.
The graphs of Exhibit 29 further demonstrate these volatilities among the departments by
plotting the Coefficient of Variation from year to year. (The Coefficient of Variation is a relative
measure of dispersion computed by dividing the standard deviation by the arithmetic mean.)
While billed operating expenses should increase slightly because of inflation; replacement
charges should be fairly level as replacement reserves are applied to protect against wide swings
in these charges from one year to the next. Fortunately, all these deficiencies can be corrected as
will be explained in the next section of this Chapter.
Fleet Operations Study
Chatham Consulting, Inc. 124
ESTABLISHING REPLACEMENT RATES
We have developed a four point strategy to establish fleet replacement rates. First, the Fleet
Services Subfund should be split into replacement and operating funds. This can be
accomplished by using the lower level org concept that is already built in the Summit and
OSERS systems and avoids the accounting complexity of establishing a new “fund”.
Second, the replacement fund should be segmented into org funds by major fleet user. The
replacement funds for smaller fleet users could be aggregated into a single org fund, if desired.
These moves will:
• Greatly simplify the accounting of replacement fund balances,
• Increase the transparency of the funds actually available for each customer department,
• Provide justification for retaining fund balances at a given level.
Third, the planning horizon should be increased to ten years for each of the replacement org
funds, except for the Fire Department, which should be increased to fifteen years. From analysis
of replacement programs in other cities, we have found that using too short a replacement
horizon can lead to underfunding of fleet replacement reserves; and, conversely too great a
horizon can to lead to overfunding of these reserves. The Fire Department with apparatus that is
both expensive and kept for at least 15 years should have a planning horizon of at least that
length.
Fourth, the City should adopt a replacement funding analogous to the Vehicle and Equipment
Replacement Program (VERP) used by a Midwestern city and described below. A copy of this
model has been sent under separate cover to Fleet Services.
VERP Model
Seattle can use the VERP model to estimate the funding requirements and replacement rates on a
"smoothed" or “levelized” basis for the designated planning horizon. The model computes
replacement rates based on the projected age and accumulated use of the fleet, as well as
inflation rates and anticipated salvage values. This model enables cities to better plan for the
Fleet Operations Study
Chatham Consulting, Inc. 125
future and level out significant increases in any one year’s budget; by accumulating a pool of
funds from annual payments to a capital asset replacement fund.
Exhibit 30 illustrates the model’s front section which contains the major input and output data;
while Exhibit 31 illustrates the model’s cash flow output during the forecast period. While the
illustrations shown here use a 15 year horizon, the model can be adjusted to use a shorter
horizon.
The replacement payment for the upcoming year is calculated by factoring in the unit price as
delivered, expected service life, residual value, and anticipated inflation to replace the original
unit. The program is flexible enough to permit the fleet analyst to review each year the following
parameters in the funding computations:
• Salvage Values
• Inflation rate
• Life expectancy
• Fund balances
The analyst sets the “VERP Payment Adjustment Factor” to its lowest level without having the
fund balance go below zero. Otherwise, a warning comment appears and the analyst must
increase the adjustment until the warning disappears indicating there is no negative balance in
the fund. Alternately, the analyst has the option of modifying the assumptions used in the model
or making manual adjustments to the payments in the table set aside for this purpose. The whole
process is repeated for the following year so that the analyst has the benefit of reviewing how
close the model’s assumptions match actual experience.
The VERP process is also a cooperative approach among Fleet Administration, Finance and user
departments. Finance has custody of the funds while Fleet Administration manages the fund
balance for each VERP account to ensure that the payments remain fairly level each year and the
cumulative fund balance remains above a prudent reserve amount. Each user department
representative is consulted annually on the VERP as a part of the budget process. Data used to
Fleet Operations Study
Chatham Consulting, Inc. 126
compute the replacement payments are the result of the recommendation by the Fleet Manager
and the user department. This approach has the following advantages:
• Reduces the need for large expenditures when replacement equipment needs to be purchased.
• Provides departments with a greater degree of accuracy in forecasting departmental needs.
• Reduces the need for repairs by funding up-to-date reliable equipment.
• Is sufficiently flexible to account for new vehicle additions as well as surplus funds resulting from holding over vehicles for replacement.
Funding Assumptions
The basic funding assumptions in this replacement model are:
• A fixed amount will be set aside each year for each replacement (i.e. individual or equipment unit).
• The amount set aside grows by a certain percentage each year until the accumulated fund balance approximates the amount needed in the year for the replacement.
• New expansion equipment is not to be funded until the initial purchase is funded by the user fund department.
• Surplus funds are not be used for expansion items, but will adjust the VERP payments in subsequent years.
• The salvage value for the vehicle or equipment is credited to the appropriate department’s VERP account.
• If a department enterprise fund does not have adequate funding for replacement of a like item (such as when the replacement cost exceeds the inflationary rate established in the formula) or the salvage value falls below the estimated amount, the vehicle/equipment cannot be replaced unless approved by Finance.
• If a vehicle or piece of equipment exceeds the estimated salvage value, the individual department VERP fund balance will be credited with the amount in the following fiscal year.
• Vehicles/equipment will not be upgraded without Fleet Administration approval. An upgrade is a change in equipment or vehicles to a higher classification, which is generally more expensive.
Comparison of VERP to Existing Fleet Services Division Lease Program
The VERP formula used to compute replacement rates is not too different from the capital
recovery rate used by Fleet Services. The annual payment is based on: total delivered price less
Fleet Operations Study
Chatham Consulting, Inc. 127
residual, multiplied by appreciation for each year of the service life (compounding inflation), and
divided by service life. However, there are a few notable exceptions in the way this formula is
applied and the mechanics of the model.
• The VERP program creates a separate spreadsheet (or fund) for each department or groups of departments for every year of the planning horizon.
• The VERP program keeps track of funding balances, payments received and expenditures
made for each year and displays this information on the front page of the model.
• The VERP program has lots of flexibility built into it so that changes can easily be made in any of the forecast parameters and their impacts readily seen in graphs and tables.
• The VERP program can be modified for different planning horizons.
• When a vehicle reaches the end of its life expectancy, the VERP model automatically calculates what the replacement value, salvage value and annual replacement payment should be for the new vehicle.
ESTABLISHING OPERATING RATES
Inherent Under Recovery in Existing Rate Structure
The primary goal of a chargeback system is to fully recover the fleet operating expenses and
replacement needs of the organization. As noted earlier, the current rate structure at Seattle
currently does not fully recover operating expenses. The main reason is that Fleet Services
Division management had intentionally set mechanic labor rates during the past couple of years
lower than needed to fully recover maintenance expenses. The intent was to reduce the Fleet
Subfund balance.
However, our analysis found an additional factor that causes under recovery; i.e., the
assumptions used to estimate rates for revenue collection are not borne out in practice. In
particular, chargeable hours have been overestimated; equipment servicer rates lowered average
rates charged to the customer; and, labor accruals resulted in lower revenue than expected at least
in the short run.
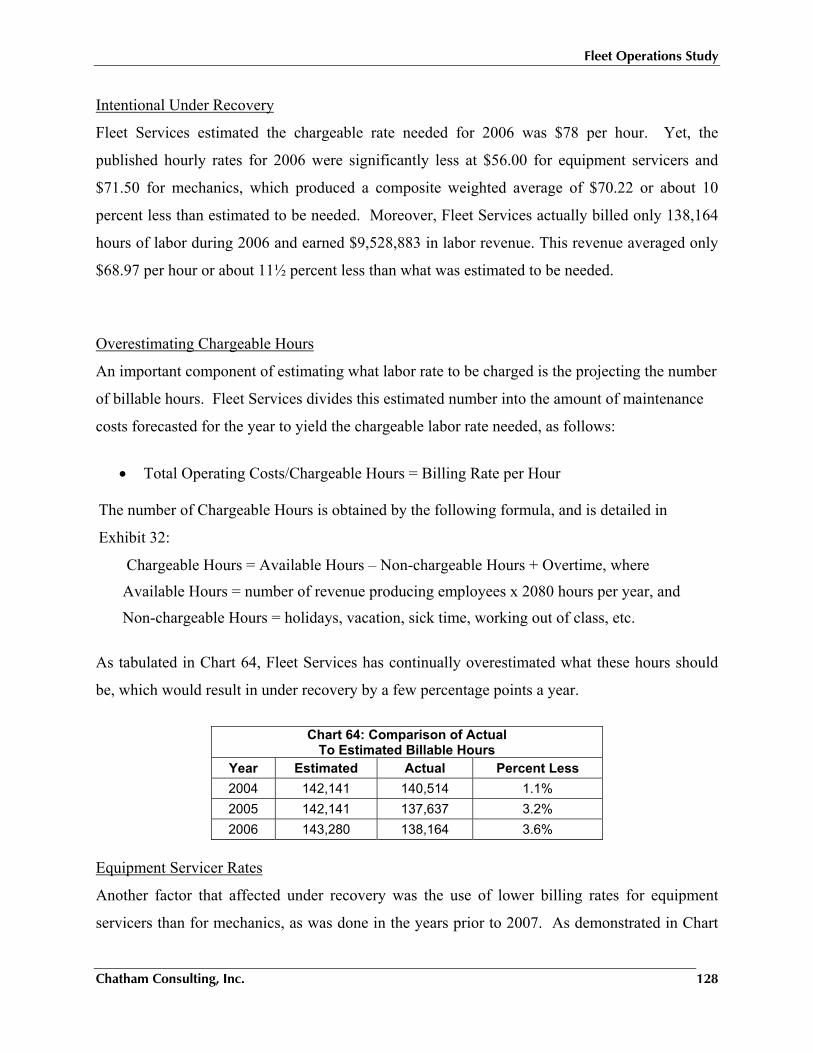
Fleet Operations Study
Chatham Consulting, Inc. 128
Intentional Under Recovery
Fleet Services estimated the chargeable rate needed for 2006 was $78 per hour. Yet, the
published hourly rates for 2006 were significantly less at $56.00 for equipment servicers and
$71.50 for mechanics, which produced a composite weighted average of $70.22 or about 10
percent less than estimated to be needed. Moreover, Fleet Services actually billed only 138,164
hours of labor during 2006 and earned $9,528,883 in labor revenue. This revenue averaged only
$68.97 per hour or about 11½ percent less than what was estimated to be needed.
Overestimating Chargeable Hours
An important component of estimating what labor rate to be charged is the projecting the number
of billable hours. Fleet Services divides this estimated number into the amount of maintenance
costs forecasted for the year to yield the chargeable labor rate needed, as follows:
• Total Operating Costs/Chargeable Hours = Billing Rate per Hour
The number of Chargeable Hours is obtained by the following formula, and is detailed in
Exhibit 32:
Chargeable Hours = Available Hours – Non-chargeable Hours + Overtime, where
Available Hours = number of revenue producing employees x 2080 hours per year, and
Non-chargeable Hours = holidays, vacation, sick time, working out of class, etc.
As tabulated in Chart 64, Fleet Services has continually overestimated what these hours should
be, which would result in under recovery by a few percentage points a year.
Chart 64: Comparison of Actual
To Estimated Billable Hours Year Estimated Actual Percent Less 2004 142,141 140,514 1.1% 2005 142,141 137,637 3.2% 2006 143,280 138,164 3.6%
Equipment Servicer Rates
Another factor that affected under recovery was the use of lower billing rates for equipment
servicers than for mechanics, as was done in the years prior to 2007. As demonstrated in Chart
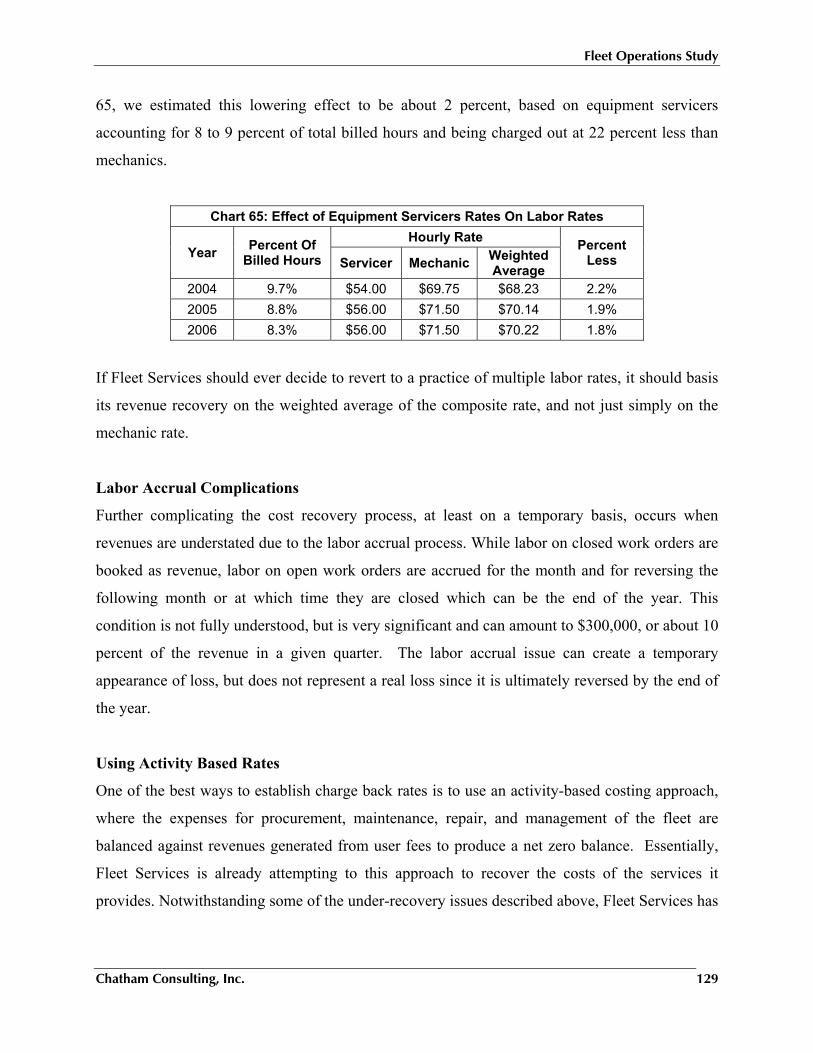
Fleet Operations Study
Chatham Consulting, Inc. 129
65, we estimated this lowering effect to be about 2 percent, based on equipment servicers
accounting for 8 to 9 percent of total billed hours and being charged out at 22 percent less than
mechanics.
Chart 65: Effect of Equipment Servicers Rates On Labor Rates
Year Percent Of Billed Hours
Hourly Rate Percent Less Servicer Mechanic Weighted
Average 2004 9.7% $54.00 $69.75 $68.23 2.2% 2005 8.8% $56.00 $71.50 $70.14 1.9% 2006 8.3% $56.00 $71.50 $70.22 1.8%
If Fleet Services should ever decide to revert to a practice of multiple labor rates, it should basis
its revenue recovery on the weighted average of the composite rate, and not just simply on the
mechanic rate.
Labor Accrual Complications
Further complicating the cost recovery process, at least on a temporary basis, occurs when
revenues are understated due to the labor accrual process. While labor on closed work orders are
booked as revenue, labor on open work orders are accrued for the month and for reversing the
following month or at which time they are closed which can be the end of the year. This
condition is not fully understood, but is very significant and can amount to $300,000, or about 10
percent of the revenue in a given quarter. The labor accrual issue can create a temporary
appearance of loss, but does not represent a real loss since it is ultimately reversed by the end of
the year.
Using Activity Based Rates
One of the best ways to establish charge back rates is to use an activity-based costing approach,
where the expenses for procurement, maintenance, repair, and management of the fleet are
balanced against revenues generated from user fees to produce a net zero balance. Essentially,
Fleet Services is already attempting to this approach to recover the costs of the services it
provides. Notwithstanding some of the under-recovery issues described above, Fleet Services has
Fleet Operations Study
Chatham Consulting, Inc. 130
the financial and technical tools already available to it in the City’s Summit and OSERS
financial reporting systems and Fleet Services’ FleetAnywhere fleet information system.
The financial systems have numerous account codes and lower level Org codes to facilitate the
assignment of costs to services. Similarly, the fleet information system has many direct and
indirect codes to separate these labor costs.
Where it becomes challenging is determining:
• How simple or complicated the chargeback rate structure should be?
• Whether costs should be averaged by vehicle class or passed directly through to individual vehicle account?
• How to fairly and properly allocate different overhead costs?
• How much to mark up labor and other operating expenses to collect sufficient revenue?
• How to insure that there is sufficient working capital so that the fleet organization has enough money to operate every month of the year?
There is no one answer to these questions, other than that revenues should be sufficient to meet
expenses. As noted in Chapter VIII - Benchmarking Survey Results, other cities use a variety of
approaches to recover their costs. Each fleet organization needs to determine how best to
distribute its overhead. What we will explain below will be how to adapt best practices to
Seattle’s specific situation.
Classifying Fleet Expenses for Rate Making
The American Public Works Association (APWA) has a simple but excellent framework to
classify fleet expenses into meaningful categories for computing fleet rates. These categories are:
fuel, parts, direct and indirect labor, contract work, operating fees, direct and indirect overhead.
• Fuel consists of the costs of fuel and the fuel distribution system for those fleets that manage their own fuel system.
• Parts include shop supplies, inventory parts and non-inventory parts.
• Direct labor includes the cost of wages and benefits of shop personnel who spend most of their time working on vehicles and equipment
Fleet Operations Study
Chatham Consulting, Inc. 131
• Indirect labor includes management and administrative personnel whose time is not easily charged to specific vehicles and consists of their salaries and benefits. In some cases an employee may some of their time as a supervisor and some in direct activities.
• Contract work includes the costs of private-sector vendors engaged in vehicle maintenance and repairs and other support activities.
• Operating fees consists of such expenses as title, license tags and vehicle inspection fees charged by various jurisdictions for the ownership and operation of the vehicle.
• Direct overhead consists of all other expenses associated with fleet operations and under the budgetary control of the fleet division. This includes all expenses associated with administrative work, minor investment capital (tools and equipment), utilities, and service fees. Any fleet division expense that cannot be assigned to a specific vehicle is accounted for as direct overhead
• Indirect Overhead expenses are those expenses assessed by another department or agency. This includes expenses for human resources, financial services, city/county administrator's salaries. These expenses are not under the control of the fleet manager.
Seattle’s financial system basically follows a framework analogous to this by classifying
expenses into such categories like personnel services, supplies, etc. and assigning them to lower
level Orgs aligned with the services provided such as vehicle maintenance, warehousing, etc. In
addition, the financial system distinguishes between direct overhead expenses like Fleet Division
management and Fleet Services Administration, and indirect overhead expense like those from
the Fleets and Facilities Department and the revenues attributable to the main activity centers of
the Fleet Services Division. Exhibit 35 provides a detailed listing of these various direct and
indirect expenses by activity center and the corresponding revenues for the activity.
Other Considerations
Once all the direct and overhead costs associated with a particular activity have been assigned, it
just becomes a matter of dividing the activity’s cost by an appropriate transaction volume to
yield the necessary rate. Where it becomes interesting is deciding on which transactions are most
appropriate to use, how difficult are they to measure, how simple or complicated they should be
and what level of accuracy is needed. There is a tradeoff between accuracy and the costs of
measurement.
Fleet Operations Study
Chatham Consulting, Inc. 132
When dealing with direct services like maintenance and repair, warehousing operations, and
vehicle fueling the transactions to use are fairly self-evident like mechanic hours consumed, parts
volume issued or gallons of fuel consumed. When dealing with overhead functions, there are
many ways to allocate these costs such as the following parameters.
• Costs • Labor hours
• Staff size • Repair orders, and
• Fleet size • Other transaction volumes. Furthermore, there are two additional considerations to be kept in mind. First, the direct
overhead costs of the function providing the service such as shop supervision or warehouse
supervision should be assigned directly to their respective services.
Second, when assigning indirect overhead costs it is important to consider if any of the indirect
costs would remain if the direct function were outsourced. For example, if maintenance services
or warehouse services were totally outsourced, there still would remain some management and
supervisory oversight needed in the fleet organization. These costs should be segregated from the
costs of maintenance or warehouse service delivery. This segregation is essential in making fair
comparisons when considering whether to outsource or not, and insuring that customers as well
as mechanics have an accurate representation of what their true costs are. Unfortunately, not all
fleets are either able or willing to make such a distinction. Seattle is fortunate, though, to have
the accounting tools to make this distinction.
TEMPLATE FOR RATE DEVELOPMENT
The following discussion provides a template for developing chargeback rates, while the next
section applies this template in computing example rates for the various services provided by
Fleet Services. This template has been divided into three parts: Overhead Allocations; Vehicle
Leasing Charges; and, Operating Rates.
Fleet Operations Study
Chatham Consulting, Inc. 133
Overhead Allocations
Department Overhead Allocations
• The Fleet Services Division’s share of FS&D Department overhead costs should be divided into two segments.
• The first segment would be included as part of an indirect overhead cost that is recovered as part of the chargeback rates developed for each of the following Activity Centers:
o Fleet Administration,
o Vehicle Maintenance,
o Warehousing,
o Fuel Supply, and
o Motor Pools.
• The second segment treats these costs as part of a monthly “fleet management” fee that is paid by customers that lease vehicles from Fleet Services or use Fleet Services’ fleet maintenance services.
Division Overhead Allocations
• The overhead costs of Fleet Services’ management costs should also be divided into two segments.
• One segment treats these costs as an indirect overhead cost to be recovered as part of the Activity Center.
• The second segment treats these costs as part of a monthly “fleet management” fee that is paid by customers that lease vehicles from Fleet Services or use Fleet Services’ fleet maintenance services.
Fleet Administration Section Overhead Allocations
• The costs of the Fleet Administration Section should also be divided into the two overhead segments:
o Organizational support of an activity that is recovered by the activity’s chargeout rates, and a
o Monthly “fleet management” fee that is paid by customers that lease vehicles from Fleet Services or use Fleet Services’ fleet maintenance or specification services.
• The results from the activity survey we conducted of the Fleet Administration Section can be used as guidance, and will be described in the section on Illustrative Rate Computations.
Fleet Operations Study
Chatham Consulting, Inc. 134
Overhead Proxies
• One or more of the following proxies for activity volumes can be used in computing the distribution of overhead costs. (These too will be explained in the next section.)
o Budget Costs (properly adjusted to exclude resale or pass through costs and depreciation)
o In Service Vehicle Costs
o Personnel Costs
o Number of FTEs
o Transaction volumes (e.g. number of work orders)
o Maintenance and Repair Expense
Vehicle Leasing Charges
Vehicle Replacement Charge
• Per VERP formulas or equivalent, calculate the annual vehicle replacement charge for each vehicle and equipment unit under the lease program.
• Identify this charge as a separate amount on the monthly invoice sent to customer.
Fleet Management Fees
• This fee is to recover overheads cost of the Department and Division, and is to be added to the vehicle charges as a fixed rate per vehicle.
• Because of the different customer agreements in place with the utilities fleet, this fee needs to be differentiated among:
o Vehicles owned and maintained by Fleet Services
o Vehicles owned by the Utility but maintained by Fleet Services.
o Vehicles owned and maintained by Utility and specified by the Utility.
o Vehicles owned and maintained by Utility and specified by Fleet Services.
Operating Rates
Common Considerations
As will become clear, the common threads amongst all the operating rate protocols are:
• All costs for the Activity Center should be identified, including
o Labor
o Facilities
Fleet Operations Study
Chatham Consulting, Inc. 135
o Supplies and Materials
o Utilities
o Overheads and incidentals.
• Each Activity Center should recover its costs.
Repair Labor Rates
• Rates should be fully burdened.
• Hourly Labor Rate = (Total Direct + Overhead Costs)/ (Billable Hours per period).
• Billable Hours should be based on actual experience and not targeted goal.
• Targets are fine for performance measurement, but not for rate setting.
• Billable hours actually charged have averaged 137,900 and not the 143,000plus hours used in recent rate estimates.
• Billable hours need to be carefully monitored and compared annually to the amount assumed in the rate computation.
• The assumed amount should be adjusted annually, if needed based on this comparison and any significant changes in staffing levels anticipated for the upcoming year.
Parts Surcharges
• These charges should recover the full costs of parts stocking and distribution.
• The markup can be a fixed amount or percentage markup.
• Percentage markup is recommended since it is the easiest and most resembles commercial practice.
• Percentage Markup per Part = (Total Direct + Overhead Costs of Warehouse Operation per Period)/ (Total Costs of Parts Issued Per Period) X 100.
Commercial Repair Surcharges
• This surcharge is designed to recover the administration costs associated with outsourced work.
• This surcharge can be a fixed or percentage markup. Either approach is acceptable.
• Percentage markup per part = (Total Direct + Overhead Costs of Warehouse Operation per Period)/ (Total Costs of Parts Issued per Period) X 100.
• Fixed Markup Cost per Commercial Work Order = (Total Direct + Overhead Costs of Managing Outside Work per Period / (Number of Commercial Work Orders per Period).
Fleet Operations Study
Chatham Consulting, Inc. 136
• Percentage Markup Cost per Commercial Work Order = (Total Direct + Overhead Costs of Managing Outside Work per Period / (Total Costs of Commercial Work Orders per Period) X 100.
Environmental & Incidental Surcharges
• This surcharge is designed to recover environment fees and costs assigned to the vehicle maintenance function.
• The surcharges can be either a fixed fee or percentage markup per repair. Either approach is acceptable.
• Seattle is using the fixed fee approach of approximately $7.50 per work order.
• This fee is acceptable provided that:
o The environmental costs have been properly identified, and
o The reason and amount of the surcharge are identified on the monthly invoice sent to customer.
Motor Pool Rates
• These rates should recover the total cost of Ownership and Operation of the vehicles.
• The rates can be based on time, use or combination of time and use vary by type of vehicle rented. Commercial practice for light vehicles is daily or weekly rental charge, while commercial practice for equipment is or weekly rental charge plus hourly rate.
• Time Unit Rate = Total Annual Cost of Operation and Ownership/ (Annual Rate Time Units X Estimated Percent of Time Units Utilized).
• Use Unit Rate = Total Annual Cost of Operation and Ownership/ (Estimated Annual Miles Utilized).
• Combination Rate = Total Annual Cost of Ownership/ (Annual Rate Time Units X Estimated Percent of Time Units Utilized) plus Total Annual Cost of Operation / (Estimated Annual Miles Utilized).
ILLUSTRATIVE RATE COMPUTATIONS
Basics
We applied the principals of the template described above to develop a series of sample rate
computations based on year end data of 2006. This process consisted of the following steps:
• Isolating Department, Division and Section Overhead expenses,
Fleet Operations Study
Chatham Consulting, Inc. 137
• Allocating these indirect overhead expenses to activity centers based on one or more of the following proxies
o Personnel Costs
o Transaction volumes (e.g. number of work orders)
o Vehicle Counts
• Distinguishing overhead costs used to support and be recovered by a Fleet Services organization versus overhead costs to be directly billed as part of a fleet management fee or work order surcharge to customers.
• Combining the assigned overhead costs with the direct and other indirect costs of the activity center to produce the total costs of the activity center to be recovered.
• Dividing the total activity center costs by one of the following cost drivers:
o Billable hours
o Parts costs
o Fuel consumption in gallons
Overhead Allocations
We first converted the detailed revenue and cost data of Exhibit 35 into the summary table of
Exhibit 34. We then isolated the three indirect overheads of the Department, Division and
Section for reallocation. Similarly, we isolated personnel expenses for computing percentages to
distribute overheads associated with the support of human resources activities. An acceptable
alternative would be to use FTE employee counts to distribute this overhead.
We computed a “net expense” by subtracting overheads, depreciation and resale expenses from
total expenses. We added allocated overhead costs to the net expenses to compute markups for
the respective activity.
Exhibit 36 demonstrates the overhead allocation process. To allocate Department overhead costs,
we divided the Fleet Services share ($1,149,084) of this overhead into five segments that match
in proportion to the Department wide Finance and Administration Program (A1000’s orgs)
source of this overhead. Then depending on the particular segment, we allocated the Department
overhead either as a support cost to Fleet Services orgs or as part of a customer bill as a work
order surcharge or monthly fee. Similarly, we allocated Division overhead costs to Fleet Services
orgs or as part of a customer bill as a work order surcharge or monthly fee.
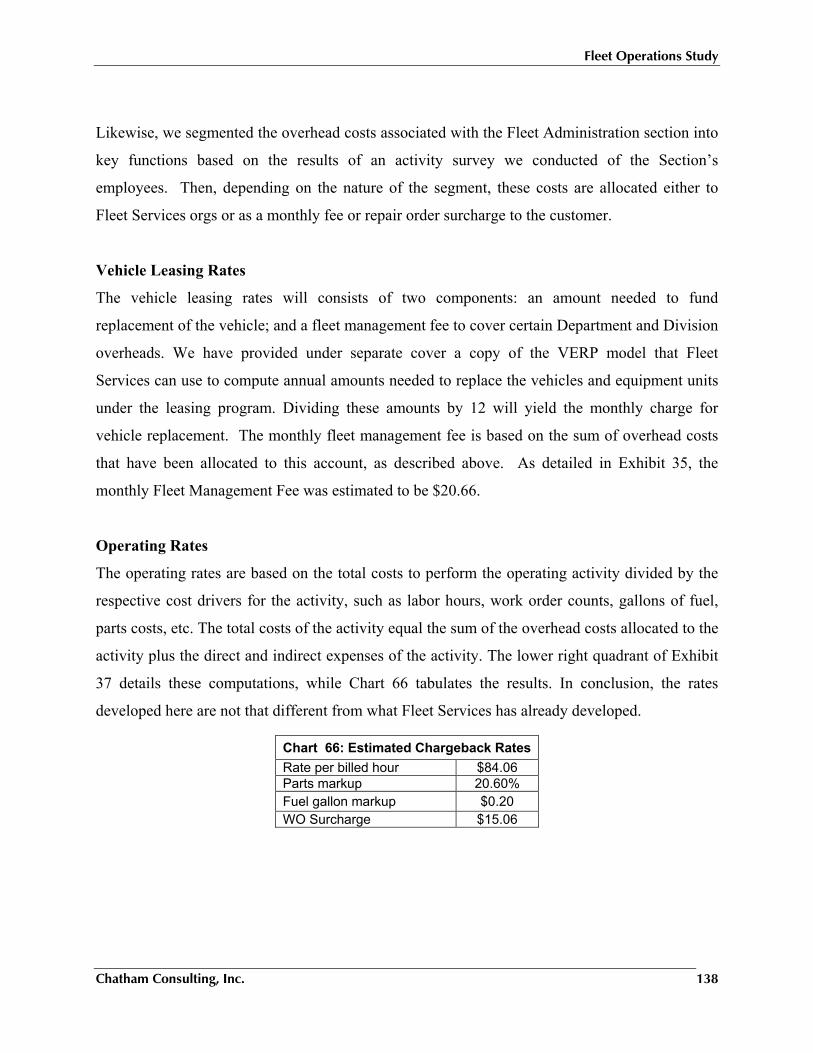
Fleet Operations Study
Chatham Consulting, Inc. 138
Likewise, we segmented the overhead costs associated with the Fleet Administration section into
key functions based on the results of an activity survey we conducted of the Section’s
employees. Then, depending on the nature of the segment, these costs are allocated either to
Fleet Services orgs or as a monthly fee or repair order surcharge to the customer.
Vehicle Leasing Rates
The vehicle leasing rates will consists of two components: an amount needed to fund
replacement of the vehicle; and a fleet management fee to cover certain Department and Division
overheads. We have provided under separate cover a copy of the VERP model that Fleet
Services can use to compute annual amounts needed to replace the vehicles and equipment units
under the leasing program. Dividing these amounts by 12 will yield the monthly charge for
vehicle replacement. The monthly fleet management fee is based on the sum of overhead costs
that have been allocated to this account, as described above. As detailed in Exhibit 35, the
monthly Fleet Management Fee was estimated to be $20.66.
Operating Rates
The operating rates are based on the total costs to perform the operating activity divided by the
respective cost drivers for the activity, such as labor hours, work order counts, gallons of fuel,
parts costs, etc. The total costs of the activity equal the sum of the overhead costs allocated to the
activity plus the direct and indirect expenses of the activity. The lower right quadrant of Exhibit
37 details these computations, while Chart 66 tabulates the results. In conclusion, the rates
developed here are not that different from what Fleet Services has already developed.
Chart 66: Estimated Chargeback RatesRate per billed hour $84.06 Parts markup 20.60% Fuel gallon markup $0.20 WO Surcharge $15.06
Fleet Operations Study
Chatham Consulting, Inc. 139
XII. COST OF SERVICE ANALYSES
This section provides a cost of service analysis for the following key products and services
offered by the Fleet Services Division.
• Metal/Machine Shop
• Capitalization Shop
• Paint & Body Shop
• Aerial Device Overhaul Shop
• Tanker Refueling Service
This analysis documents the major labor, materials, facilities and support costs for these business
processes. It also develops a fully burdened labor rate for comparison to outside vendors and
results obtained from outside quotations for service. This Chapter then provides templates for
evaluating when to use overtime, rely on outside vendors and/or expand capacity. The Chapter
concludes with discussions of real world strategies regarding the outsourcing and insourcing of
work.
ESTIMATED SERVICE COSTS
Exhibit 36 tabulates the allocation of direct and indirect costs by major shop category. These
consist of: direct and supervisory shop labor, associated fringe benefits expense, plus support
costs for operations, facilities, personnel and overhead. These costs are then combined and
divided by the function’s billable hours to yield the fully burdened costs of labor for comparing
to outside services.
Labor Costs and Fringe Benefits
Labor costs were estimated by multiplying the number of direct and support employees
providing the service times the average salary for the position and then factoring in the cost of
fringe benefits. Average salary was computed by multiplying the position’s average hourly wage
rate times 2080 hours per year. The fringe benefit rate was estimated to be 36.1 percent of
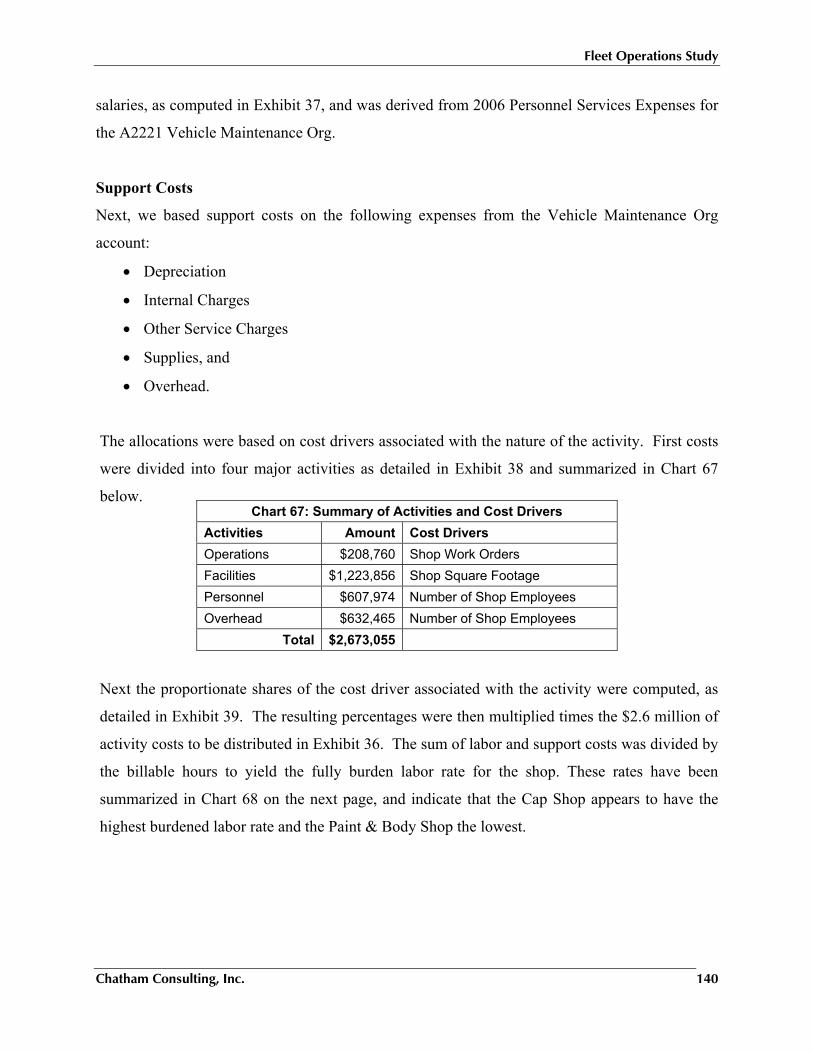
Fleet Operations Study
Chatham Consulting, Inc. 140
salaries, as computed in Exhibit 37, and was derived from 2006 Personnel Services Expenses for
the A2221 Vehicle Maintenance Org.
Support Costs
Next, we based support costs on the following expenses from the Vehicle Maintenance Org
account:
• Depreciation
• Internal Charges
• Other Service Charges
• Supplies, and
• Overhead.
The allocations were based on cost drivers associated with the nature of the activity. First costs
were divided into four major activities as detailed in Exhibit 38 and summarized in Chart 67
below.
Next the proportionate shares of the cost driver associated with the activity were computed, as
detailed in Exhibit 39. The resulting percentages were then multiplied times the $2.6 million of
activity costs to be distributed in Exhibit 36. The sum of labor and support costs was divided by
the billable hours to yield the fully burden labor rate for the shop. These rates have been
summarized in Chart 68 on the next page, and indicate that the Cap Shop appears to have the
highest burdened labor rate and the Paint & Body Shop the lowest.
Chart 67: Summary of Activities and Cost Drivers Activities Amount Cost Drivers Operations $208,760 Shop Work Orders Facilities $1,223,856 Shop Square Footage Personnel $607,974 Number of Shop Employees Overhead $632,465 Number of Shop Employees
Total $2,673,055
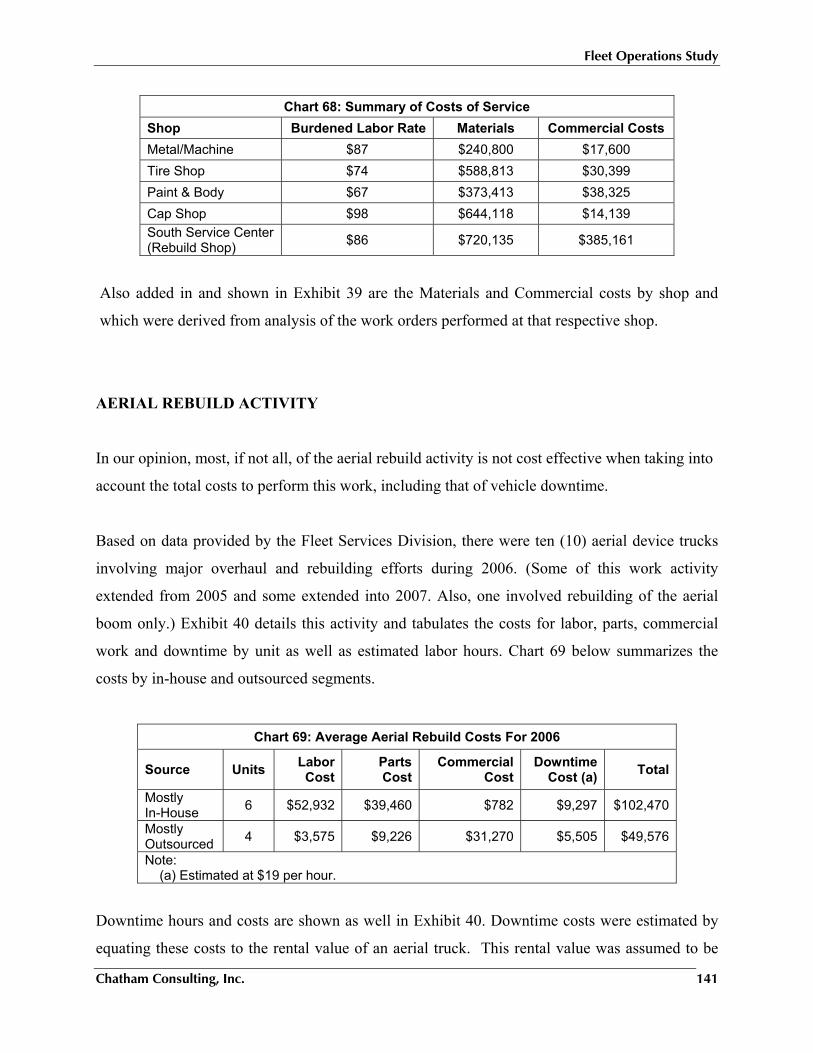
Fleet Operations Study
Chatham Consulting, Inc. 141
Chart 68: Summary of Costs of Service Shop Burdened Labor Rate Materials Commercial Costs Metal/Machine $87 $240,800 $17,600 Tire Shop $74 $588,813 $30,399 Paint & Body $67 $373,413 $38,325 Cap Shop $98 $644,118 $14,139 South Service Center (Rebuild Shop) $86 $720,135 $385,161
Also added in and shown in Exhibit 39 are the Materials and Commercial costs by shop and
which were derived from analysis of the work orders performed at that respective shop.
AERIAL REBUILD ACTIVITY
In our opinion, most, if not all, of the aerial rebuild activity is not cost effective when taking into
account the total costs to perform this work, including that of vehicle downtime.
Based on data provided by the Fleet Services Division, there were ten (10) aerial device trucks
involving major overhaul and rebuilding efforts during 2006. (Some of this work activity
extended from 2005 and some extended into 2007. Also, one involved rebuilding of the aerial
boom only.) Exhibit 40 details this activity and tabulates the costs for labor, parts, commercial
work and downtime by unit as well as estimated labor hours. Chart 69 below summarizes the
costs by in-house and outsourced segments.
Chart 69: Average Aerial Rebuild Costs For 2006
Source Units Labor Cost
Parts Cost
Commercial Cost
Downtime Cost (a) Total
Mostly In-House 6 $52,932 $39,460 $782 $9,297 $102,470
Mostly Outsourced 4 $3,575 $9,226 $31,270 $5,505 $49,576
Note: (a) Estimated at $19 per hour.
Downtime hours and costs are shown as well in Exhibit 40. Downtime costs were estimated by
equating these costs to the rental value of an aerial truck. This rental value was assumed to be
Fleet Operations Study
Chatham Consulting, Inc. 142
$3,000 per month. Dividing this amount by 160 hours per month yields the rental rate average of
$19 per hour. We multiplied this rate times the number of user downtime hours to produce the
estimated cost of downtime for the vehicle being rebuilt.
Of the six units rebuilt in-house, the costs of rebuilding ranged between $72,000 and $116,000
before downtime costs are taken into account. Including downtime, the cost range increases to
$80,000 to $108,000. Average in-house labor hours were 740 per unit. The remaining four units were largely outsourced and only involved nominal amounts of in-
house labor, as detailed in Exhibit 40. Total work order costs ranged between $40,000 and
$50,000, before downtime costs are taken into account. Including overtime, the range increases
to $50,000 to $56,000.
After reviewing these costs, we found that:
• Overhaul work that is primarily outsourced work costs less than that done primarily in house.
• The amount of in-house hours to perform this work appears excessive.
o In previous benchmarking surveys that we have conducted for the utility industry, we have found that the average number of work hours reported to rebuild the aerial device was 150, and to rebuild the cab and chassis unit was 100.
• Furthermore, the costs of some of the in-house overhauls plus downtime appear to be greater than the industry average costs of new units.
• Also, acquisition costs for Seattle’s aerial device trucks appear to be higher than industry averages:
o Best practice utility fleets spent about $115,000 to $120,000 for new medium duty (about 33,000 GVW) aerial trucks in 2006, in contrast to the $230,000 plus that Seattle pays.
o Heavier units (about 54,000 GVW) cost about average about $150,000 to $170,000 on average, in contrast to the in contrast to the $270,000 plus that Seattle pays. Based on our field observations, we attribute this large discrepancy in costs to over-specifying of equipment
Fleet Operations Study
Chatham Consulting, Inc. 143
TANKER SERVICE
Fleet Services provides a refueling service with a markup of 44 cents per gallon. As developed
in Exhibit 41, we estimate that the markup should be significantly higher at 70 cents per gallon.
The markup was based on amortization of the costs of the two tanker trucks used in this service,
their annual maintenance expense, and labor costs involved. Dividing these costs by the amount
of gallons pumped produced the estimated 70 cents markup per gallon.
OTHER ACTIVITIES
There are other activities where further analysis is needed. These consist of the Metal/Machine
Shop and the Capitalization shop. As noted in the benchmarking analysis, Seattle has an
extraordinary amount of personnel in its specialty shops.
While we recognize that the Metal/Machine Shop services not only vehicles but facility
machinery, it is only fair to question the cost effectiveness of this shop activity. We have
completed the first step in estimating in the fully burdened labor rate for this shop. But Fleet
Services will need to complete the remaining steps by not only comparing these rates to outside
machine shop rates, but also comparing the costs of selected work products to what can be
purchased on the outside. This is the so-called “Yellow Pages” test and will necessitate Fleet
Services auditing what products have been manufactured by the Metal/Machine shop - such as
brackets, tampers and other items – and that can be procured readily from outside automotive
supply sources.
Similarly, vehicle upfitting costs should be compared to obtaining vehicles already upfitted by
automotive dealers. In particular, the costs of outfitting patrol cars should be compared to what
can be obtained by competitive bids. In 2006, there were 52 patrol sedans that were upfitted by
Fleet Services. The average costs reported of this activity are summarized in Chart 70 on the
next page. While the $29,100 total price may be competitive to commercial sources, the overall
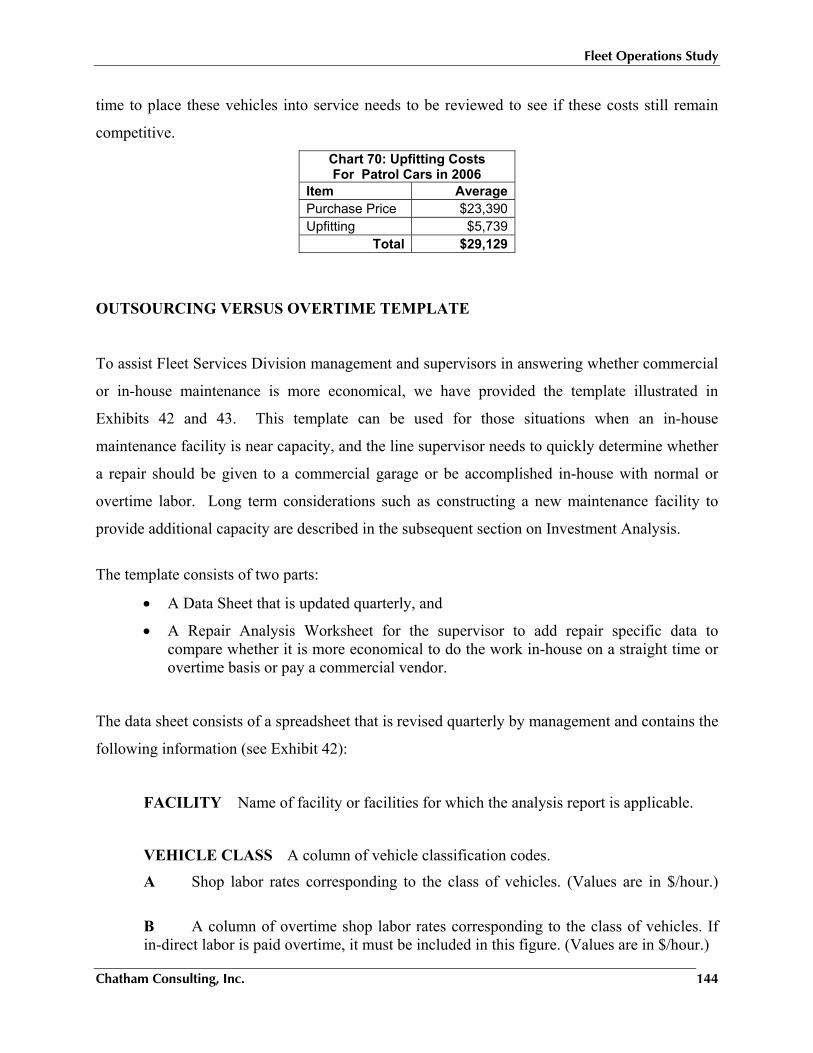
Fleet Operations Study
Chatham Consulting, Inc. 144
time to place these vehicles into service needs to be reviewed to see if these costs still remain
competitive. Chart 70: Upfitting Costs For Patrol Cars in 2006
Item AveragePurchase Price $23,390Upfitting $5,739
Total $29,129
OUTSOURCING VERSUS OVERTIME TEMPLATE
To assist Fleet Services Division management and supervisors in answering whether commercial
or in-house maintenance is more economical, we have provided the template illustrated in
Exhibits 42 and 43. This template can be used for those situations when an in-house
maintenance facility is near capacity, and the line supervisor needs to quickly determine whether
a repair should be given to a commercial garage or be accomplished in-house with normal or
overtime labor. Long term considerations such as constructing a new maintenance facility to
provide additional capacity are described in the subsequent section on Investment Analysis.
The template consists of two parts:
• A Data Sheet that is updated quarterly, and
• A Repair Analysis Worksheet for the supervisor to add repair specific data to compare whether it is more economical to do the work in-house on a straight time or overtime basis or pay a commercial vendor.
The data sheet consists of a spreadsheet that is revised quarterly by management and contains the
following information (see Exhibit 42):
FACILITY Name of facility or facilities for which the analysis report is applicable.
VEHICLE CLASS A column of vehicle classification codes.
A Shop labor rates corresponding to the class of vehicles. (Values are in $/hour.)
B A column of overtime shop labor rates corresponding to the class of vehicles. If in-direct labor is paid overtime, it must be included in this figure. (Values are in $/hour.)
Fleet Operations Study
Chatham Consulting, Inc. 145
C Commercial labor rates corresponding to the class of vehicle. (Values are in $/hour.)
D Pickup and delivery costs corresponding to the class of vehicle. (Values are in $/mile.)
Q Average parts discounts corresponding to the class of vehicle. (Values are expressed as 1-discount.)
R Vehicle costs corresponding to the vehicle classification and life. This value is used to determine the cost of the vehicle being out of service and equals monthly rental divided by available hours per month. (Values are in $/hour.)
The supervisor would transfer the appropriate data from the data sheet to upper line of the Repair
Analysis Worksheet (Exhibit 43) and then provide the following information that is specific to
the repair under consideration.
Line T The estimated direct hours of labor necessary to complete the repair. Line U The total dollar cost (list price) of the parts needed to affect the repair. Line V The number of hours the unit is estimated to be out of service if the repair is fit in the shop work schedule (in hours). Line W The number of hours the unit is estimated to be out of service if the repair is accomplished by working over time (in hours). Line X The number of hours the unit is estimated to be out of service if the repair is performed by a commercial contractor (in hours). Line Y The vehicle need factor. This should be determined by the using agency. The need factors are:
2.0: The vehicle is needed for immediate service. A replacement must be rented or system degradation will result. 1.5: The vehicle is required but status quo can be maintained during repair. 1.0: Normal need factor for equipment. 0.5: Vehicle is not needed immediately for service.
Fleet Operations Study
Chatham Consulting, Inc. 146
With this information, the supervisor through a process of simple multiplication and addition
estimates the following costs under each of the three alternatives: Normal (Straight Time),
Overtime and Commercial.
1. Repair Costs
2. Parts Costs
3. Pickup & Delivery
4. Out Of Service Costs
Then the totals appearing at the bottom of the page express the relative differences in costs
among the three options. The lowest amount indicates the most economical solution. The
difference between the lowest and each alternative is the added expense of choosing other than
the lowest. It must be remembered that the totals do not represent the total cost of the repair.
These values are relative indicators to allow selecting among the three alternatives; costs
common to all three are not included in the totals.
INVESTMENT ANALYSIS
For those situations where maintenance facilities are non-existent, in-adequate, or falling behind
on a regular basis the alternatives consist of:
1. Increased use of commercial vendors, or
2. Investment in expanded facilities and/or equipment.
If commercial maintenance is less than in-house maintenance, then there would be no economic
justification for investing in facilities. On the other hand, if commercial maintenance were more
expensive, the investment in expanded facilities and/or equipment requiring a long-term analysis
of investment and return factors. In order for the investment to make economic sense, the
savings must be greater than the investment, or at worst, equal to the investment.
Fleet Operations Study
Chatham Consulting, Inc. 147
Internal-Rate-of-Return
The analysis of a proposed investment to reduce costs is a classical engineering economy
problem. Its solution involves projecting cash flows through the life of the asset and then
computing an “internal rate of return” based on present worth analysis. This rate of return is
compared the threshold or hurdle rate that management has set for evaluating capital projects. If
the rate of return equals or exceeds the hurdle rate, the project makes economic sense. The hurdle
rate at a minimum should be set at to equal the organization’s long-term costs for capital. It can
be set higher to account for the degree of risk associated with the project.
The cash flows consist of the cost of the initial investment made in year “0” followed by the
projected net cash flows for each year of the project. The net cash flows reflect the differences
in annual savings and costs for the project. These net cash flows are discounted to their present
worth values. The interest rate that results in the sum of the present worth values of cash flows
equaling zero is considered the internal rate of return. This rate is usually estimated via an
iterative process by initially guessing what the rate should be and then gradually changing it until
the present worth sums reach zero balance.
The financial factors needed for this analysis are as follows:
• Investment required for the new or expanded facility or equipment,
• Anticipated service life of the new asset,
• Salvage value of the new asset,
• Financial hurdle rate, and
• Inflation rate.
Projected Savings
The primary sources of savings resulting from the investment are:
• Increased In-house Repair Capabilities
• Reduced Parts Costs
• Reduced Pickup and Delivery Costs
• Reduced Downtime
Fleet Operations Study
Chatham Consulting, Inc. 148
Estimating these savings closely parallels the techniques described in the Overtime versus
Commercial repair framework described in the previous section.
Increased In-house Repair Capabilities
Since the purpose of investing in facilities or tools is to increase in-house repair
capabilities, the most direct measure of this capability is the number of additional direct
labor hours that become available. For a maintenance shop, this equates to the additional
number of mechanic hours the additional work bays will be utilized during the year.
Similarly, if the decision involves procurement of a machine such as a brake rotor
grinder, the number of hours spent in commercial maintenance per year for this operation
would be estimated; and, the portion of those hours to be transferred to in-house work
would be determined. Savings would be estimated by multiplying repair hours times the
difference in commercial and in-house labor rates, inclusive of taxes. If these labor rates
vary significantly by repair type or vehicle classification, then weighted averages of labor
rate should be used.
Reduced Parts Costs
The fourth factor is the potential savings associated with parts. On one hand, there are
savings associated with purchasing parts at a discount greater than what a commercial
vendor would charge for the part when making a repair. These savings are estimated by
multiplying the discount rate times the value of parts purchased. However, these savings
need to be reduced by the cost of procuring the part and carrying it as inventory.
Purchasing costs include determination of needed parts, freight and delivery charges, and
costs of inspection and acceptance. Inventory carrying costs include the tie-up of money
in parts on the shelf, inventory control, and losses due to parts obsolescence. (These are
explained in more detail in Chapter X on Warehousing.) Depending on the degree of
precision needed for the analysis, a simplifying assumption could be made that the cost of
buying and inventorying parts would offset the savings of purchasing at a lower price.
Making this assumption would remove part costs from the analysis.
Fleet Operations Study
Chatham Consulting, Inc. 149
Reduced Pickup and Delivery Costs
The third factor gained by increasing in-house capabilities is the reduction in pickup and
delivery costs. This gain is estimated by multiplying the number of pick up and delivery
trips saved times the miles saved per trip times the cost per trip mile.
Reduced Downtime
The next major factor is the predicted reduction in downtime. This value is obtained by
multiplying the total out-of-service time saved from in-house maintenance times the
value of the vehicles to the operation. This is computed for each class of vehicles to be
serviced by a new facility or added piece of equipment.
Projected Costs
These costs will consist of projected changes in maintenance, operations and overhead costs for
each year of the project’s life.
Maintenance and Operating Costs
Adding facility and tool capacity may result in increases in maintenance and operating
expenses of the facility or equipment being considered. Increased operation and
maintenance costs will needed to be estimated for each year of the project. Since these
costs typically increase with time, the rate of inflation must be taken into account as well.
Overhead Costs
If an increase in capacity necessitates an increase in supervision, then the costs for this
additional overhead will need to be added. It may however be possible to add some
capacity without adding supervision. In such cases, there are no added costs. In fact it
may be argued that this situation increases the utilization of existing overhead and results
in a slightly lower cost of overhead per unit of work. Still, since the comparison is being
made on the basis of changes in overall costs and not unit costs per se, then the benefits
of increased overhead utilization can be ignored.
Fleet Operations Study
Chatham Consulting, Inc. 150
Resulting Cash Flow
For an internal rate of return analysis, the investment costs are treated as a negative values for the
“0” year of the project. Annual savings are treated as positive numbers, while added costs are
treated as negative numbers. Salvage value is treated as a positive number and is added to the last
year of the project life. Adding the costs and savings for each year produces the net cash flow for
the year. Then, standard financial tables or worksheet functions can be used to compute present-
worth values and internal rates of return to complete the analysis.
REAL WORLD CONSIDERATIONS
The decision to “outsource” is often a difficult and arduous process which impacts many areas of
the business and should take into account the many aspects and implications of the decision. The
following “tool” provides some “real-world” questions and/or issues to consider during the
outsourcing evaluation process. These questions were derived from a recent publication entitled
“Insourcing vs. Outsourcing: Guide Factors to Consider,” produced by the Distribution
Construction and Maintenance (DC&M) Committee of the American Gas Association. Their
impacts must be considered and fully understood before a decision to move forward is
implemented, and have been organized into the following areas.
• Core Competency • Safety and Training • Customer Contact • Employee Engagement/Morale • Labor/Union issues
Since the issue of core competency of the business must be identified as part of the outsourcing,
there are several questions to assist in real world discussions of that issue.
Core Competency
• Does our process provide us a competitive advantage?
• Are we really good at this process?
• Is this process an area of strength or weakness?
Fleet Operations Study
Chatham Consulting, Inc. 151
• Is this a function that we should be focusing resources on?
• Does this function tie to the Division’s primary mission?
• Does any external company have the capability and knowledge to perform this function?
• What is the impact on the organization if someone else performs this function?
• What is the impact on employees if someone else performs this function?
• Do we truly understand the costs and critical process that interface with function?
• Will the outsourcing of this work allow Division personnel to focus more on core competencies?
Safety & Training
• Does the contractor have experience in the work being outsourced?
• Does the contractor have experienced crew leaders and forepersons?
• Does the contractor have the specialized equipment necessary to do the work?
• To what degree is ‘local’ operating knowledge critical in performing the work being performed?
• What internal and external regulations and procedures will the contractor need to be aware of to perform the desired work?
• What impacts will the outsourcing have on emergency response times considering reduced internal staffing?
• Can the contractor respond to off-hour emergencies if needed?
• Does the contractor have ‘local’ qualified resources available?
• Does the contractor have a documented safety compliance program or procedures?
• Does the contractor perform internal and documented safety inspections?
• Does the contractor have a poor performance record with OSHA?
• Does the contractor promote safety throughout the organization from the top down?
• Does the contractor have an internal training department?
• Are training records readily accessible if needed to comply with DOT or regulatory requirements?
• Are contractor employees experienced with and/or trained using similarly approved equipment and materials?
• What is the typical turnover rate for the contractor?
Fleet Operations Study
Chatham Consulting, Inc. 152
Customer Contact
• What level of customer contact is the contractor required to have?
• What additional training is required with the desired customer contact?
• Are there political or legal concerns with contractors performing customer contact?
• What process changes will need to be implemented for outsourcing customer contact work (i.e. paperwork, scheduling, and posting notifications)?
• Does the contractor perform background checks on new hires?
• Does the contractor have a complaint resolution process or procedure?
• What impact will the contractor’s activities have on established performance metrics?
• Does the contractor have an acceptable reputation in the area?
• Does contractor’s management structure support customer service work?
• What impact will the contractor’s efforts have on Division image?
Employee Engagement/Morale
• What is the impact of contracting with a union verses non-union workforce?
• Are concessions required for work being transferred to an outside workforce?
• Does outsourcing create the possibility of union action/activities?
• Will insource and outsource workforce be held to the same standards?
• Do our employees feel their jobs are at risk?
Labor/Union Issues
• Is the activity currently a union activity?
• Is outsourcing prohibited by the labor contract?
• How is your union contract structured relative to contracting jobs?
• What is the labor cost difference?
• Will contractor personnel and bargaining unit personnel be required to work together?
INSOURCING CONSIDERATIONS
Similarly, there are a number of considerations when evaluating insourcing opportunities.
Insourcing is the opposite of outsourcing. While outsourcing involves a fleet removing
Fleet Operations Study
Chatham Consulting, Inc. 153
unprofitable operations from its facilities and contracting out these tasks to other parties,
insourcing involves a fleet identifying potentially profitable operations and accepting contracts to
do work for outside parties.
Typically, a larger fleet will accept contracts from smaller fleets to maintain and service their
vehicles in the larger fleet's maintenance facilities. The smaller fleet obtains access to
experienced labor; parts purchased through economies of scale; and advanced maintenance skills
capabilities that they may not be able to afford with their own in-house operation. The larger
fleet benefits from generating a profit from facilities it was already maintaining. This can reduce
overhead and make more efficient use of the existing maintenance facility infrastructure.
When considering whether to insource work, management must take a careful look at the
specific conditions within its fleet and its intended service area. It needs to realize that the heart
of what the operation is selling is their expertise and talent.
Management will need to examine the market place and answer such questions as:
• How large is the potential market?
• How much competition would the proposed operation face from other outside maintenance contractors?
• Is there an adequate supply of trained technicians to expand existing staff to take on new business?
• Can you deliver a superior product?
• Can it be provided at a competitive price?
• What type of warranty will you provide on your work?
• How many claims can you afford before it becomes a drag on your business?
In addition, management will need to have a well thought out business plan that examines the
potential costs, revenues and risks of taking on additional work. The plan should address how
growth will be managed so that facilities could be expanded without adding too much overhead.
Thought must also be given to the types of customers to seek and not seek. For example,
customers that won't authorize critical safety repairs are not desirable to have.
Fleet Operations Study
Chatham Consulting, Inc. 154
The business plan should factor in the cost of increased insurance to account for the additional
liability associated with in-sourced work.
The fleet operation will also need a well-constructed support process for billing and collection.
Who will send the bill, and who will do the collection. These processes may be separate from
fleet management and an arrangement will need to be worked without the billing and collections
department.
Excellent customer service skills will be needed. On one hand, the quality of service to internal
customers cannot be sacrificed to take of the external customers. On the other hand, the external
customers will not want to hear excuses either. Both sets of customers will need to be kept
happy, even though there will always be the suspicion that you are favoring one over the other.
Fleet Operations Study
Chatham Consulting, Inc. 155
XIII. PERFORMANCE MEASUREMENT AND REPORTING
This Chapter reviews the current state of performance measurement at Fleet Services, explains
how to develop key performance measures and standards, analyzes current productivity levels
and maintenance performance against industry standards, and proposes strategies and specific
recommendations to improve shop maintenance operations and work practices. It begins with a
discussion of performance measurement in general, how it apples to fleet management and then
examines Seattle’s specific situation.
GENERAL CONCEPTS
Performance measurement is a management tool that quantifies performance or productivity in
an organization. It enables management to document and assess the progress an organization is
making toward reaching goals and assess how competitive it is in using resources.
Performance measurement quantifies two major areas: effectiveness and efficiency.
Effectiveness relates to how well a set of results is achieved, while efficiency relates to how
many resources were needed to achieve the results. Thus, by measuring and comparing the ratio
of output achieved (effectiveness) over input resources consumed (efficiency), within a specified
period of time, we have a means to quantify performance to assess whether it is improving or
not. For most organizations, resources consist of capital, labor, material and energy or some
combination thereof.
There are several important factors that need to be considered when using this management tool
in general and especially when applied to a fleet operation. First, performance measurement
should be considered as means to an end – improved performance – and not an end unto itself.
This tool like any management tool has the potential of making an operation more effective if
applied correctly and kept in perspective.
Fleet Operations Study
Chatham Consulting, Inc. 156
Second, we must be certain of what we are measuring. The selection of goals and definitions of
the tasks needed to reach those goals are of critical importance. Unlike a simple manufacturing
or assembly process where measuring the number of acceptable versus unacceptable products
may suffice as a productivity indicator, the management of automotive and construction
equipment is not a simple process. Measuring the wrong elements can cause just the opposite
result you are trying to achieve through measurement.
Similarly, it is important to measure more than one indicator. For example, measuring the
percentage of preventive maintenance inspections is important and achieving a high completion
rate is a worthy goal. But unless the number of breakdowns and amount of vehicle downtime are
also measured, we do not know how effective the preventive maintenance program actually is.
Finally, best practice fleet operations recognize that performance improvement is a continuing
process whereby management is involved in an ongoing effort to utilize resources more
effectively to achieve quality results. The best organizations always measure against themselves
through time as well as periodically check their performance to other similar organizations and
commercial operations.
FleetAnywhere™ and Performance Measurement
The Fleet Services Division utilizes the Maximus’ FleetFocus FA (FleetAnywhere ™) system to
manage its work order, asset, fueling services, and other fleet data. This is a well known and
robust fleet management information system with full capabilities to manage fleet operations and
measure performance. As applied by Fleet Services, the system contains basically all the data
needed to measure performance such data as the following:
• Downtime
• Direct and indirect labor activity
• Work order class, cause and location
• Work description
Nevertheless, what do appear to be needed are summary reports and charts where management
and supervisors can see at a glance how well their performance compares to pre-determined
Fleet Operations Study
Chatham Consulting, Inc. 157
standards regardless if the standards were developed in-house or are based on outside industry
practice.
The next few paragraphs will explain how to aggregate the myriad of data that is being produced
or is capable of being produced from the FA system to provide meaningful information to
improve shop maintenance operations and work practices.
MEASURING FLEET PERFORMANCE
Desirable Traits
The best measurements compare actual performance against a predetermined target of
performance. The measurements should:
• Accurately track all resources utilized in the process,
• Aid in decision making by identifying problem areas,
• Provide also a customer’s perspective of effectiveness of doing the right things,
• Be cost effective,
• Be easily understood, managed and simple to accomplish,
• Capable of comparing performance levels among different locations,
• Compatible with existing information system,
• Easily monitored and displayed at all times,
• Limited in number, with more than 15 indicators subject to justification,
• Provide a historical perspective so that changes in productivity can be emphasized.
Establishing Standards Generally, there are several sources and methods establishing for standards.
• Those that are established by reviewing an organization’s goals and objectives.
• Those that are based upon records of past performance and can be used to compare performance levels.
• Those from external sources (sometimes referred to as industry averages or standards) and be used:
o To compare or benchmark performance among “similar” organizations
Fleet Operations Study
Chatham Consulting, Inc. 158
o To compare internal performance commercial benchmarks for cost-effectiveness evaluations.
Internally developed standards have some inherent advantages over externally derived standards.
Internal standards can be targeted to very specific goals of the organization, such as:
• Meeting budgetary or financial goals,
• Achieving a certain percentage of alternative fueled vehicles in the fleet,
• Mechanics meeting certification or training goals,
• Achieving a certain customer satisfaction grade, etc.
Internal standards can be measured consistently across the organization, such as:
• Preventive maintenance completion rates
• Percent of time that is billable, etc.
On the other hand, in order to identify gaps in performance and learn best practices from outside
organizations, it is necessary to compare performance to outsider “similar” organizations as best
possible. Also, to test competitiveness it is necessary to make comparisons to commercial
vendors and/or industry publications like Chilton’s, or Motors, etc.
There are even limitations with the outside comparisons approach. First, no two operations are
exactly alike even if they are in the same industry. This is why it is important not to focus too
much on minor difference in performance, especially if it regards only a single indicator.
Instead, it is much better to examine multiple indicators and see if there are major differences in
performance levels.
Second, there may be significant differences in the cost accounting among fleets from different
organizations. This can in turn lead to identification of practices that may appear cost effective in
the comparative mode but in actual practice are not. Two of the most glaring examples are the
methods used to account for the cost of a maintenance and repair labor hour and the manner in
which overhead costs may or may not be allocated.
Fleet Operations Study
Chatham Consulting, Inc. 159
In like regard, the “rolling up” of internal costs for a basic “performance metric” can be
challenging for some public service fleet managers. Their cost accounting systems may not fully
account for all costs associated with a particular activity to benchmark. While it may be possible
to track and identify these additional costs that reside outside of the measured entity, there may
be unwillingness on the part of the internal manager to be evaluated based on costs which he/she
may legitimately feel are out of their control.
This is why using “commercial benchmarks” for the development of “Performance Metrics”
should be considered as well. In addition to avoiding some of the difficulties in benchmarking
against peer organizations, commercial benchmarks have the following advantages over inter-
organizational comparisons.
• Commercial benchmarks allow the true comparison of the “business alternative” to the performance of the activity “in house.” In other words, the commercial benchmark can establish for the company the actual cost of having this task done for the company, if in fact, this work were to be contracted to a third party.
• Commercial benchmarks typically represent the most effective cost of performing this activity as the firms who produce this “advertised cost” must compete in the market place for this business and as a result have constant pressure to be more efficient at the service.
• The commercial benchmark must also represent the “high end” of the comparative cost as the outside firms must support a profit margin not applicable to the internal costing of the service or activity.
• Commercial benchmarks also allow the identification of costing structures for the different commercial infrastructures that support a mixed fleet of light vehicles, medium trucks, heavy trucks and equipment makeup. In other words, there is typically is a difference in the labor rate charged for work done on an automobile as opposed to work done on a heavy truck.
Commercial rates have their set issues to consider when making comparisons. Flat rate manuals
are designed for dealers to earn a profit and may include an extra allotment time for the dealer
and mechanic to share in the revenue. Also, dealer mechanics are continuously working on the
same make of vehicle. This situation is unlike that of the typical government or utility mechanic
Fleet Operations Study
Chatham Consulting, Inc. 160
who has to work on a very broad range of makes, models and equipment types which vary from
one day to the next for servicing. Also, there may not be a readily available commercial standard
for the particular work to be done. This is generally more of the case with heavy trucks equipped
with very specialized equipment than it is with light vehicles.
Standardization
An integral part of any performance measurement process is the development and adherence to
commercially available vehicle and equipment standards. Economical, reliable vehicle and
equipment performance cannot exist in a culture that allows individual users to select equipment
based on their opinion of needs. Standardization must take place at four (4) levels.
A. Vehicle Configuration – Such as Compact Sedan, Light Duty Pickup, Medium Duty
Backhoe, 50-55 ft. Class Material Handling Aerial, etc.
B. Vehicle Make – This may change but should not happen on an annual basis as the reliance of long term, strategic alliance with key suppliers is an essential. This contract should be the result of a comprehensive bidding process where the expectation of the alliance is clearly articulated in the RFP.
C. Component Configuration – This level of standardization entails the specifying of upfitting and auxiliary hydraulic and other powered equipment. Standards at this level would include service body length and compartment configuration, pintle hook arrangements, auxiliary lighting requirements, auxiliary power generation, DOT lighting, vehicle marking (decaling), etc.
D. Component Make – This is similar to the standardization of the manufacturer of the vehicle or piece of equipment but entails the selection of a supplier for individual vehicle components as described in “C” above. This includes the selection of a single, strategically aligned and RFP awarded supplier for service and utility bodies, van interiors, pickup truck accessories, lighting components, etc.
Performance Monitored
While all of the shop supervisors that participated in our survey indicated that they used
“Performance Measures” to monitor and manage the performance of their shop operation, most
of these measures were qualitative in nature and varied by supervisor. While some stated that
they compared basic tasks among mechanics, others made comparisons to flat rate manuals and
Fleet Operations Study
Chatham Consulting, Inc. 161
outside vendors. Just about everyone mentioned the annual performance appraisal as a tool for
measuring performance. Furthermore, eighty two percent (82%) reported that they periodically
compared the costs of their operations to those available from an outside commercial supplier.
PERFORMANCE DEFINITIONS AND TARGETS
We list below key performance measures and goals for consideration by Fleet Services. These
measures are well known in the industry and much has been written on suggested targets for
these indicators.
• Fully Burdened Labor Rate The fully burdened labor rate is analogous to the dealer labor rate. It is computed by dividing the sum of all direct and indirect costs associated with fleet maintenance and repair by the total number of billable hours charged by the mechanic workforce. This metric measures the efficiency of maintenance and repair services performed against other providers of these services. It makes fleet management aware of its costs and encourages fleet users to hold fleet management accountable for the cost and value of the service.
o Target: Local vendor labor rates typical for vehicle class involved.
• Turn-Around Time Turn-around time is the amount of clock time it takes for a vehicle to be returned to service after it has been put in the shop for repair. A high turn-around rate can signify that mechanics are not doing a good job of preventive maintenance so that unresolved minor repairs turn into major repairs that require more time in the shop. It could mean that vehicle repairs have been delayed because: repair parts are not available when they are needed; work priorities are not managed; and, the equipment that is in for more extensive repairs is receiving priority over those in for minor repairs.
o Targets:
Less than 24 hours: At least 70 percent
24 to 48 hours: 20 percent
Longer than 48 hours: Not to exceed 10 percent
• Preventive vs. Corrective Repairs, Scheduled vs. Unscheduled Work Work in the shop can be scheduled or unscheduled. Scheduled work consists of PM plus the work that results from the PM and which has been scheduled to be performed at a later date. Also, scheduled work includes annual DOT inspections. All preventive maintenance work is scheduled. The operation should strive for a greater percentage of its work as scheduled and preventive maintenance. If the shop is engaged in excessive unscheduled repair work, overall maintenance and repair costs will be higher and fleet reliability lower. Furthermore, scheduling of the workforce becomes more challenging when most vehicle work is unscheduled as opposed to predictive.
o Target for Scheduled Work: (As a percentage of total work) 50 to 70 percent
Fleet Operations Study
Chatham Consulting, Inc. 162
o Target for Preventive Maintenance: (As a percentage of total work) about 50 percent
o Target for Corrective Repairs: (As a percentage of total work) 30 to 40 percent
• Repeat Work Repeat work is maintenance work that has to be redone, because it was not done correctly in the first attempt. It is a clear indication of poor workmanship or misdiagnosis.
o Target for Repeat/Rework: Less than 2.5 percent
• Downtime and Breakdowns These two are very important indicators of the quality of work done by a maintenance operation. Downtime measures the amount of time the equipment is out of service because it needs to be repaired. A high amount of downtime either means that service is disrupted, since a vehicle is not available, or a large number of spare vehicles are required as backups. Break down measures the frequency with which a vehicle must be taken out of service because of repair problems. Both indicators speak to the overall management of the maintenance operation and the quality of repair work done.
o Recommended overall standard for downtime (excluding accidents): Not to exceed 6 percent
o Typical targets by vehicle type:
• Construction Equipment: 3-5 percent
• Administrative vehicles and trucks: 1-2 percent
• Medium/heavy trucks: 2-4 percent
• Specialized equipment: 6-8 percent
• Law enforcement, marked: 2-3 percent
• Law enforcement, unmarked undercover cars: 1-3 percent
• Mechanic Utilization This is a measure of the percentage of available time mechanics spends “turning wrenches”, or working on vehicles rather than doing other things such as running for parts, waiting for work, cleaning up the work area or running errands. The objective is to maximize the amount of time mechanics spend working on vehicles versus other activities.
o Target: 65 percent to 70 percent
• Preventive Maintenance This indicator measures all preventive maintenance inspections and required annual state emissions performed as compared to the total number scheduled in a given period of time.
o Target for PM inspections: 95 percent
o Target for Emission inspections: 100 percent
• Inventory Turn Ratio Measures the total number of parts used annually divided by average number of parts on hand. This measure is an indicator of too much or too little stock levels and also shows slow moving or obsolete stock. For a further discussion of
Fleet Operations Study
Chatham Consulting, Inc. 163
this and other spare parts management performance metrics, please refer to Chapter X on Warehousing Operations.
o Target ratio: 4 to 5
ASSESSMENT OF CURRENT PERFORMANCE AND PRODUCTIVITY
Fleet Services compares favorably to most of the indictors listed above where data were
available.
Fully Burdened Labor Rate
As estimated in Chapter XI, we estimated that the fully burdened labor rate of Fleet Services
shop personnel is $84 per hour. This is competitive to the average vendor labor rates of $102 per
hour for heavy truck work and $92 per hour for light vehicle work, as indicated in a recent
market survey conducted by Fleet Services Division.
Mechanic Utilization
Fleet Services mechanic utilization exceeds the 65 percent to 70 percent target for this indicator.
Overall Downtime
Based on downtime data provided to us by Fleet Services, we found that that the overall
downtime averaged 6.3 percent for the full year of 2005; and 7.1 percent for the first eight
months of 2006. These rates are slightly greater than the downtime target of 6 percent.
Turnaround Time Data on turnaround time were not provided to us, but should be collected and monitored in the future.
Preventive Versus Corrective Repairs As developed in Exhibit 44, we estimated that the percentage of labor hours for scheduled work
is only 52 percent, and for preventive maintenance only 28 percent. Both of these are on the
Fleet Operations Study
Chatham Consulting, Inc. 164
lower side and indicate that more attention is needed in completing preventive maintenance
inspections on time and having sufficient staff to do so.
Also, fleet age is another factor that influences this outcome. As illustrated in Exhibit 45, the
percentage of work that is breakdown repairs tends to increase with the age of the vehicle.
PERIODIC PERFORMANCE REPORTING
Just collecting performance data is not enough. It is important to track and plot data periodically
so that any changes in performance levels can be spotted more easily. That is why we
recommend the development of weekly, monthly and annual performance reporting utilizing
most if not all of the indicators listed above on a shop basis. These can be supplemented by
additional indicators such as the ones listed below. They are only limited by the availability of
data and resources to produce them.
Maintenance Management
• Amount of backlog work
• Average repair length
• Downtime due to unavailability of parts
• Fleet availability
• Fully burdened labor rate by shop
• Annual maintenance cost per by vehicle and by vehicle class
• Maintenance cost per mile or per hour
• Miles between road calls
• MRUs to mechanic ratio
• Number of PM no shows
• Number of vehicles awaiting parts
• Out of Service Ratio
• Summary listings of vehicles remaining out-of-service
Fleet Operations Study
Chatham Consulting, Inc. 165
Fleet Usage and Size
• Miles per vehicle
• Engine hours per vehicle
• Employees per vehicle
Fuel Economy
• Fuel cost per mile
• Fleet wide miles per gallon
• Percent of fleet vehicles that are alternate fuel vehicles (AFV)
Other
• Procurement cycle times
• Upfitting cycle times
• Average fleet age
• Percent of fleet beyond replacement age/mileage guideline
Shop Profit and Loss Statement
To encourage each of the shops to operate as a business, we recommend that a quarterly “profit
and loss” statement be created for each one. “Revenues” would consist of the amount of work
earned or billed by the mechanics during a given month plus parts charged to customers. The
cost of goods sold (i.e. parts) would be subtracted to yield Gross Margin. This would be
compared to the total operating expenses of the garage such as labor, rents, utilities, and other
garage overheads to assess whether a garage were profitable and whether mechanics were fully
utilized.
Borrowing From Outsourcing Contracts
Another set of performance indicators to consider are those associated with maintenance
performed by outside contractors. Increasingly, public service fleet organizations have been
adding metrics such as the following to provide rewards and penalties regarding the maintenance
and repair of their fleet. Chart 71 on the following page lists some of the typical ones used.
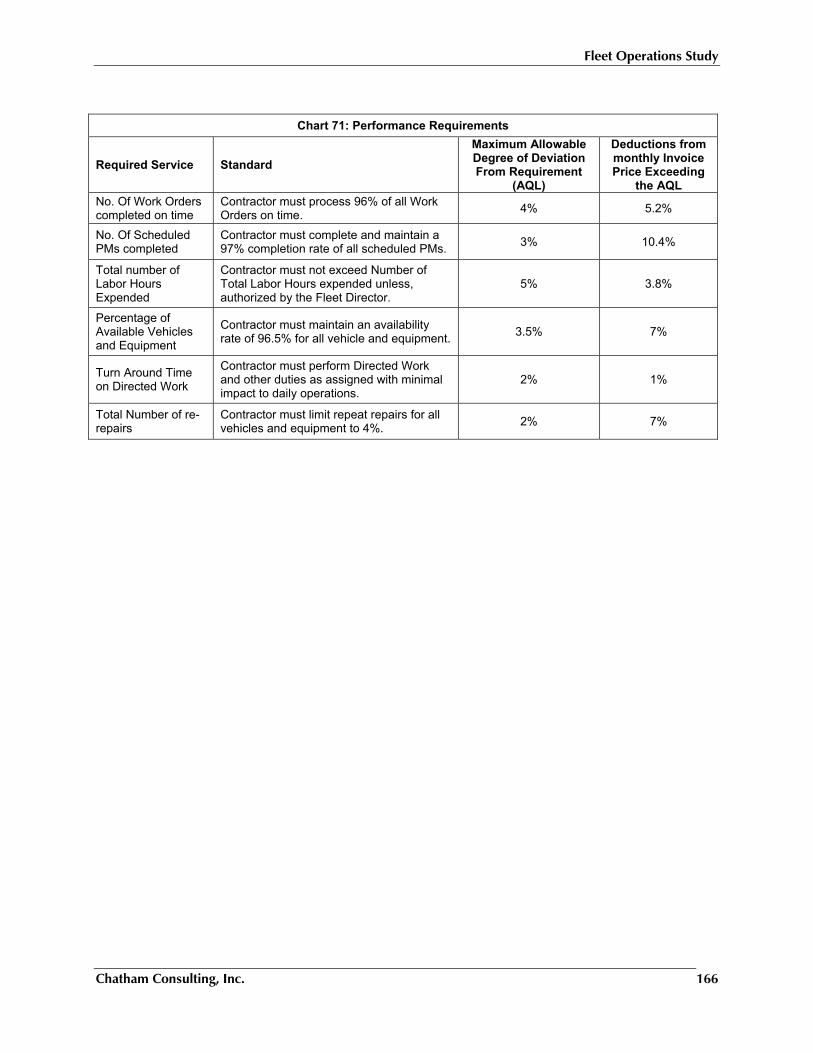
Fleet Operations Study
Chatham Consulting, Inc. 166
Chart 71: Performance Requirements
Required Service Standard Maximum Allowable Degree of Deviation From Requirement
(AQL)
Deductions from monthly Invoice Price Exceeding
the AQL No. Of Work Orders completed on time
Contractor must process 96% of all Work Orders on time. 4% 5.2%
No. Of Scheduled PMs completed
Contractor must complete and maintain a 97% completion rate of all scheduled PMs. 3% 10.4%
Total number of Labor Hours Expended
Contractor must not exceed Number of Total Labor Hours expended unless, authorized by the Fleet Director.
5% 3.8%
Percentage of Available Vehicles and Equipment
Contractor must maintain an availability rate of 96.5% for all vehicle and equipment. 3.5% 7%
Turn Around Time on Directed Work
Contractor must perform Directed Work and other duties as assigned with minimal impact to daily operations.
2% 1%
Total Number of re-repairs
Contractor must limit repeat repairs for all vehicles and equipment to 4%. 2% 7%
Fleet Operations Study
Chatham Consulting, Inc. 167
XIV. WORK PRIORITY AND SCHEDULING SYSTEM
This Chapter describes templates to facilitate the scheduling of work at Fleet Services shops. As
previously noted, work scheduling at these shops must not only take into account normal
maintenance and repair, but also some capital work and work that originates at other
maintenance facilities in Fleet Services. The templates described herein are designed to be
simple, effective and flexible.
ESTABLISHING PRIORITIES
Priorities for scheduling work should be documented in a single page to provide guidance but not
dictum to the garage staff. The number of priorities should be kept to a minimum and based on a
consensus obtained from a Fleet Services and User Group Committee. A three-level priority
system, as outlined below, should meet most of Fleet Service’s daily work load scheduling.
• Priority A is immediate action work. Priority A is exclusively reserved for emergency work, or work that must be done the day it is requested even if overtime is required. Whenever possible, Priority A work should be done after regularly scheduled work is completed. Typically, it is only necessary to complete the Priority A work before the next day.
• Priority B is for jobs that are to be placed on the schedule for the next workday.
• Priority C is for jobs that can wait and be placed on future schedules according to dates required for completion.
As a guide, the fleet operation should consider the following factors in formulating priorities:
• Vehicle related
o Vehicle classification
o Intended vehicle use
o Availability of spare unit
• Repair related
o Safety
Fleet Operations Study
Chatham Consulting, Inc. 168
o Severity of repair
o Condition, if left uncorrected, would damage equipment
• Shop related
o Work load of mechanics
o Availability of parts
WORKLOAD FORECASTING
To apply this system, workloads should be forecasted using the forms in Exhibits 46 and 47 as
guides.
Monthly Planner
Exhibit 46 presents an illustrative planning form that can be used to plan the overall work load at
a garage one month in advance. The form can be set up as a spreadsheet or manual document and
can be modified, as the fleet organization deems necessary.
The shop supervisor uses the form to anticipate potential overload or under load situations for a
given garage. The information in the form is used as a basis to plan priorities, work schedules,
overtime or contract maintenance needs in advance. The document is divided into three sections:
• Available time,
• Work load and backlog estimate, and
• Comparison of work with time.
In the "Available Time" section, the service writer estimates the net mechanic hours available in
the month. This estimate is based on both known and unknown factors. Known factors include
the number of mechanics in the month, workday, holiday and vacation days. The time spent in
"other" activities will consist of both known and unknown components. Time for coffee breaks,
cleanup, etc. will remain generally constant each month. Time for parts chasing, training and
other indirect activities may not be known precisely in advance but can be estimated from past
data as a percent of mechanics' time.
Fleet Operations Study
Chatham Consulting, Inc. 169
In the "Work load and Backlog Estimate" section, the amounts of time to perform scheduled,
unscheduled and other work in the garage are estimated. Scheduled maintenance time should be
developed from averages of past activities. Information regarding the number of PM's due per
month by vehicle classification and the number of state inspections required should be used for
estimating scheduled maintenance activities. Other planned maintenance activities would be
included in the "other" category.
Next, the supervisor estimates from past experience the number of road calls and turn-ins to be
anticipated and then multiplies these instances times the average expected time for each. Any
other type of unplanned repairs or other activity is estimated from past experience and is
included in line "o" through “q” for other". For example, the time required for fueling vehicles
could be estimated here. Or the amount of work to be generated from vehicles based at other
facilities could be estimated by examining past patterns of work. Alternately, this time does not
have to be identified separately. Instead, it could be included as part of the percentage for "other"
activities listed in line "f". In either case, this form provides flexibility to the fleet staff to
accommodate either as much detail or as much aggregation as needed.
Finally, the estimate of workload for the forecast month is added to the backlog of the previous
months to yield total work for the forecast month. This sum (shown in line "u") is compared to
the net mechanic hours available (shown in line "h") to estimate either a potential under load or
overload situation. The service writer can then use this information to alter the scheduled work
plan, plan for overtime and/or contract out work.
Daily Planner
Exhibit 47 illustrates another document to aid the scheduling of daily workload and backlog.
This document lists all scheduled maintenance, demand activated repairs and fill-in activities.
For each item are also listed:
• Priority of work,
• Estimated completion time, and
• Mechanic responsible for activity.
Fleet Operations Study
Chatham Consulting, Inc. 170
To schedule work with this document, the shop supervisor performs the following steps:
1. Determines the work force available for each shift taking into account known absences due to illness, injury or meetings.
2. Applies a factor for indirect labor activities.
3. Prior to each shift identifies all known work in advance.
4. Lists all known work on the daily workload planner according to category.
5. Lists expected completion time for all work on the schedule.
6. Assigns priorities to all work on the schedule, taking into account the following categories of work.
a) Category I: Scheduled Maintenance (SM)-fixed workload and the preventative maintenance workload. Subtracting the hours for this first category from total hours available, the supervisor next determines the amount of time available for:
b) Category II: Demand Activated Repairs (DAR) - The service writer then pre-
schedules a portion of that remaining time with items from the DAR work orders. Depending on the location and section, approximately 40% to 60% of the DAR time is pre-scheduled from existing work orders. It is assumed that the remaining unscheduled time will be filled with work from DAR that cannot be deferred, high priority work requested during the shift, or from the third category of work:
c) Category III: Fill-in Maintenance (FIM) - This group includes repairs, which do
not significantly affect vehicle safety or operation.
7. Once the schedule has been completed, the service writer determines if the vehicle, skills, equipment, parts, or tools are available. If the decision is "no," reschedule. If the decision is "yes,” the service writer assigns the first two hours of work based on priorities. The remaining work is assigned later or as other work order requests are submitted.
8. Next, the service writer decides if a sublet contractor or Fleet staff should be utilized to complete necessary work.
a) Sublet Contractor: If the decision is made to use an outside contractor, the service
writer makes appropriate arrangements.
b) Fleet Staff: If the decision is made to use internal staff, the supervisor decides whether the work should (or can) be performed on the regular shift, overtime is required, or the work can be delayed to other shifts or the next day.
9. During the first two hours of the shift, the service writer evaluates the schedule and make adjustments based on late-arriving priority work and unknown absences. Previously scheduled work may have to be deferred or DAR work orders added.
Fleet Operations Study
Chatham Consulting, Inc. 171
10. This whole process is repeated prior to the start of the next shift. It should be noted that the best time for mechanics to work on vehicles and equipment is during the time when the equipment is not in use. For most pieces of equipment, such as utility trucks and construction equipment, this period is the evening shift. This is referred to as non-conflicting scheduling and will result in fewer pieces of equipment being out of service for maintenance, and less need for spare equipment to be loaned. For passenger cars, where inspections and repairs may be less time-consuming than those for heavy equipment, work is often scheduled during the day shift. In summary, scheduled maintenance work should be kept to a minimum during the day shift and attention should be instead directed to handling emergency or turn-in work.
WORKLOAD UNITS
Expected completion times will be needed in order for the shop supervisor to quantify workload
and backlog. Initially, the supervisor should use his or her independent estimates of the time
required to do certain tasks. This will enable the supervisor to focus on development of
scheduling skills rather than the ability to retrieve detailed standard data from a large manual.
Next, certain work activities that are repetitive, well defined and readily standardized should be
identified. For these work tasks, expected completion time should be developed by a
combination of work sampling, flat rate manual and supervisor opinion polling, and analysis of
work order histories.
This analysis should identify those 20 percent of the repair activities that account for 80 percent
of the work done. Using this information as a database average expected completion times and
variances can be estimated for selected types of work. These in turn should later be verified and
adjusted, if needed.
Fleet Operations Study
Chatham Consulting, Inc. 172
XV. EMPLOYEE EDUCATION AND INCENTIVES
Employees represent the most valuable resource that an organization can have. In this Chapter
we present ways to enhance this resource through education and incentives and discuss methods
to support staff in achieving performance goals. The programs described here were derived from
best practice fleet operations and take into account what we learned from the input we received
from shop supervisory and mechanic personnel.
MECHANIC AND SUPERVISOR INPUT
We learned from the attitudinal survey we took of the mechanic workforce that pay and benefits
were one of the top areas of concern where they felt improvement is needed. Most of the
mechanics noted that the City needed to raise its compensation package not only to retain
qualified mechanics, but also attract new ones. What was most interesting were the ideas that
that compensation should be based on job skills, and that the current stepped pay scale system
should be eliminated at least for new hires.
Similarly, they also expressed need for more specialized (factory-based) and certification
training and less policy or safety training that they are receiving now. They also seek incentive
pay for certifications like ASE and EVT.
The Supervisors echoed many of the same concerns that the mechanics made, although the
supervisors had placed a caveat on certification. They stated that certification alone is not
enough. Instead, certification needed to be coupled with pay increases. As previously noted in
the Supervisor Survey Results, they felt that certification would provide the following benefits:
• A training tool,
• Increasing general competence,
• Keeping skills up to date,
• Giving the organization a certain “clout,”
Fleet Operations Study
Chatham Consulting, Inc. 173
• Justifying better wages to retain keep quality people, and
• Promoting pride in work quality.
In addition, they believed that more specialized training, especially factory-based, would be
more beneficial than the broad training provided by vendors to mechanics. In particular, they
cited more training was needed on the diagnosis and repair of heavy equipment engines and
running gear. Also needed was more updated training on automotive diagnostic equipment.
SEATTLE MULTI-STEP SYSTEM
The mechanic job classification and pay system at Seattle is a multi-pay grade approach that is
generally similar to those used by most other government fleet operations. The successively
higher pay scales provide the mechanic some incentive to stay and move up through the ranks.
At other fleets the entry level position is the mechanic helper position. In contrast, at Seattle the
entry level position is Automotive Mechanic Apprentice, which is followed by Auto Mechanic,
Auto Mechanic, Senior and Auto Maintenance Crew Chief. The Equipment Servicer position is
a standalone or terminal position and not part of the mechanic group progression series.
Whereas the Automotive Mechanic Apprentice is expected to attend formal classes to
supplement on-the-job training, the Equipment Servicer is not.
RECENT TRENDS
Recently, some government fleet operations have introduced the concept of incentive pay for
certification. Their goal is to empower employees to determine their salaries while improving
skill levels. These programs often involve certification through the National Institute of
Automotive Service Excellence (ASE). By passing at least one ASE exam and providing proof
of two years of relevant work experience, a technician becomes ASE-certified.
Fleet Operations Study
Chatham Consulting, Inc. 174
Fleets that have introduced these programs report that the increased technical knowledge
improves mechanic productivity and results in faster turn-around times. They also use these
programs to not only improve mechanic morale and the professionalism of their shop operations,
but also retain qualified existing staff and recruit new personnel.
Multiple Approaches Used
Government fleets have used a variety of ways to implement an incentive program. For example,
at Chesterfield County VA, eligible employees take one or more of the ASE examinations and
the EPA Section 605 air conditioning certification. The County’s incentive program allows
successful technicians to earn an additional 15-percent professional incentive pay increase in
their annual salary. However, those employees can earn only one professional incentive increase
within a two-year period.
At the Town of Greenwich, CT a program called “Project Blue Seal” was created that converted
the shift foreman position into a shift supervisor position, provided the shift foreman obtained a
Master ASE certification. The shift supervisors would have to maintain their ASE Master
certifications and recertify as a job requirement. Also, heavy duty “mechanics” who obtain four
ASE certifications, from courses selected by the fleet manager, would move up a pay grade to
heavy duty “vehicle technician” status. Those technicians who do not recertify drop back a
grade. Also, the technicians pay for the ASE testing and study and take the test on their own
time. Since it is a union shop, those mechanics who did not want to certify are allowed to remain
at the lower pay rate and grade. However, new hires have to commit to take the ASE
certifications to become a heavy duty technician.
Similarly, our benchmarking survey reflected the wide variety of approaches being used
regarding compensation and certification. With the exception of Seattle, each of the survey
respondents had an incentive program in place involving mechanic training and certification
beyond just paying for the tests. In some cases, there were financial incentives. In one case
there were non-financial incentives such as recognition ceremonies and consideration for
awarding merit pay increases.
Fleet Operations Study
Chatham Consulting, Inc. 175
Range of Incentives
As reported in a recent article in Automotive Fleet magazine, there are no industry standards for
certification incentive pay. Incentive pay is often negotiated as part of a union agreement. The
range of additional pay for master-level ASE mechanics is an additional $1 to $2 per hour. Some
other examples of incentive pay are described below:
• Los Angeles County pays its mechanics $0.25 per hour bonus for each of eleven ASE certifications.
• At the City of Oxnard, CA promotion to Mechanic II, a 5 percent raise, is dependent on the mechanic attaining ASE Master Technician status.
• At Orange County, CA, the employee and supervisors agree on a goal such as obtaining up to three ASE certifications.
• At Sacramento County, CA, an employee is allowed up to 4 percent of their base for ASE certification. They are awarded a 0.5 percent per category for a maximum of 3.5 percent. For master certification, they are awarded a total of 4 percent. For welding certification, the employee gets a 2 percent incentive. Thus, the total incentive for having both sets of certifications is 6 percent.
• The City of Riverside, CA requires as a condition of probation four ASE certifications, but chose different certifications depending on the position. For example, Mechanic II would be based on the “T” series or heavy-duty, whereas Mechanic I or II would be the “A” series. The only pay increase in any of these classifications was 5 percent once a Master ASE certification was acquired. This Master certification had to be maintained or the incentive pay would decrease to zero.
• At Bloomington, IL a new union contract was negotiated where the City will pay a 10 cents per hour bonus for each ASE and EVT certification. Management had looked at having different levels of technicians, but felt that offering bonus pay would work better.
• The City of Honolulu has the following requirements:
o Apprentice I: Completion of an Associates Degree in Diesel Technology two year program. The apprentice program is for heavy vehicle mechanics only because local market conditions make it difficult to attract qualified heavy vehicle mechanics.
o Fleet Mechanic I: Associate degree in diesel or automotive technology with two years of experience.
Fleet Operations Study
Chatham Consulting, Inc. 176
o Fleet Mechanic II: Automotive Journeyman mechanic and lower level heavy vehicle mechanic. No certifications required.
o Fleet Mechanic III: Journeyman heavy mechanic includes construction equipment class. This class receives a Recruitment-Retention-Incentive of $430 per month or $2.50 per hour based on actual hours worked in addition to their regular pay. Rate also applies to any overtime hours worked.
o Fleet Technician I: Auto mechanic with master certification.
o Fleet Technician II: Heavy vehicle with master certification. Also receives incentive pay of $430 per month.
• Metro Nashville, TN uses a step increase model with associated pay increases after six months, two years, four years and six years. For Automotive Mechanics, certification adds about $0.785 per hour and Master Technician status adds another $1.46 per hour. For Equipment Mechanics (which are paid about $1,600 more per year than Automotive Mechanics), certification adds about $0.745 per hour and Master Technician status adds another $0.714 per hour. At Master Technician status, Automotive and Equipment mechanics pay are the same.
• At the Metropolitan Washington Airports Authority, the ASE Certified Master Automobile Technician and the ASE Certified Master Heavy Truck Technician are paid $2,600 per year more. The Authority does not pay premiums for individual ASE Certifications, but will reimburse an employee (with proof of registration and certification) for any passed ASE tests.
EMPLOYEE EDUCATION CONSIDERATIONS
The development of a progressive, incentive based training program for in-house vehicle and
equipment maintenance and repair is essential for the development of a cost effective fleet
operation. A basic program should provide incentives for qualified personnel to progress through
a series of industry recognized certifications in order to maintain inclusion in the fleet
department. In commercial settings this usually means “up or out” as potential candidates must
either have the required certifications or be motivated by profession to make a long term
commitment to the department and the training requirements. In public agency settings, this
would mean that an employee would need to progress through the series to qualify for
Fleet Operations Study
Chatham Consulting, Inc. 177
compensation increases. Also, in a public setting existing employees would be “grandfathered”
but new hires would have to meet the certification requirements.
A basic set of Technician Qualification guidelines should involve a progression through the
Institute for Automotive Service Excellence (ASE) sequence of testing and progression.
Individual functions within the Fleet Services Division may elect certain series of certifications
relevant to their particular needs, but should at a minimum require basic entry level competence
or certification completion. Exhibit 48 is a copy of the certifications and relevant tests that may
be required for progression through the fleet garage mechanic series.
In addition to the ASE test there are other recognized industry standards that can be required.
These may be hydraulic certification, vehicle inspection licensing, emergency vehicle technician
and other industry or manufacturer certified programs.
INCENTIVE TRAINING PROGRAM
We present in this section how an incentive pay system could work. The program establishes a
base requirement for entrance into the Fleet Management Technician Series and sets forward a
progression within the series based on an individual’s documented experience or certification
achievements specific to the job within a specified period of time. Exhibit 49 illustrates the steps
in the progression/training program.
Technicians entering the job series will have to possess job specific skills.
• ASE Certifications
• A Technical Degree in Automotive Technology
• Job related experience prior to entering job series.
Promotion would not be automatic, but will be dependent on successful testing and personal
initiative.
Fleet Operations Study
Chatham Consulting, Inc. 178
Technicians possessing job skills will have the opportunity to use those skills without the
restrictions of waiting for a specified amount of time. They will have the opportunity to certify
in the categories that will advance them to the next step.
Technicians can fully qualify in twelve (12) months if so motivated. Technicians entering the
Fleet Management Technician Series will be more inclined to stay longer because of personal
interest and lower frequency of personnel change. Also tied to this progression will be a steadily
incremental pay schedule so that Technicians on whom the City of Seattle expends resources for
certification will be motivated to stay and not use the City to finance their education and then go
off to better-paying jobs on the outside.
Employees interested in entering the Fleet Management Technician Series will need to satisfy
the following requirements in order to be considered qualified.
1. High School Diploma or GED.
2. Two (2) years formal education in the automotive repair field and two (2) years experience working in an automotive repair facility or five (5) years working in an automotive repair facility.
3. Must possess a basic set of personal tools (list to be developed).
4. Successful completion of written technical test (pass/fail within a specified time).
5. Successful completion of hands-on technical test that will be administered at a central location.
Progression
When items (1) through (5) are satisfied, the technicians may enter the job series at a Level 1.
They may remain in Level 1 (Garage Mechanic A) for a maximum of two (2) years. During that
period the technicians must prepare themselves to advance to Level 2 (Garage Mechanic B).
Failure to do so will require them to leave the job series. Based on qualification and
demonstrated job performance the Level 2 technician can than progress to a Level 3 (Garage
Mechanic C). Failing to demonstrate the performance associated with obtaining the
qualifications would require the Technician to leave the series.
Fleet Operations Study
Chatham Consulting, Inc. 179
Minimum Training Hours
We are recommending that the City of Seattle dedicate between two to four weeks of formalized
technician training per year. This is consistent with the utility industry and to somewhat less than
that required by the motor companies for their representatives at local dealerships. This training
requirement should also be tied to the technician certification process and involve incentives for
the Technician to obtain the certifications on their own and that the City of Seattle provide more
specific training on particular equipment based on their maintenance demands
Suggested Compensation Amounts
We would suggest a pay increase of $0.25 for the obtaining of each set (Automobile and Light
Truck, Medium and Heavy Duty Truck, etc.) of ASE Certifications.
OTHER CONSIDERATIONS
We believe that the key to any incentive or performance improvement program is management
leadership. The director of any successful fleet organization needs to have a clear vision of what
they want for the organization. The successful leader needs to be unequivocally committed to
that vision. That vision needs to be communicated repeatedly to all employees so they surely
know the direction of where the division is headed.
The successful director also needs to have basic management skills, but more importantly must
have a commitment to and total rapport with people that serve in the Division. Without that
commitment as well as a focus on customer service it becomes more difficult to succeed.
Fleet Operations Study
Chatham Consulting, Inc. 180
XVI. CUSTOMER RELATIONS AND OUTREACH
Focusing on and reaching out to customers are some of the key ingredients in a successful fleet
management organization. As a service organization, fleet operations would not exist unless they
had customers to serve. In this chapter, we develop recommendations for:
• Improving customer communications,
• Motivating customer compliance with Fleet policies, and
• Improved customer-driven data and reporting.
We also provide guidance and supporting templates in conducting customer surveys and
developing service level agreements with fleet customers. Our recommendations were based on:
what we learned from the interviews and surveys we conducted of Fleet Services personnel and
its customers, a review of the Fleet Policies and Procedures manual, and our knowledge of best
fleet management practices in other successful organizations.
INPUT FROM SURVEYS
From the customer survey, we learned of their lack of understanding of the rate system and their
potential concerns that cross subsidies may exist. Customers also want to know what their fund
balances and complain that Fleet Services does not share such information with them.
Most notable were the many comments we received from the customers that communication
needed to be improved not only between them and Fleet Services management, but also they
believed within the administrative levels within the Fleet Services Division itself. They would
like Fleet Services to be more proactive in explaining changes in decisions regarding vehicle that
may have been previously agreed to. They seek more collaboration, cooperation and trust and
want to be treated with respect.
Fleet Operations Study
Chatham Consulting, Inc. 181
From the mechanics survey, we learned of their frustration in getting customers to bring in their
vehicles to the shop when due for preventive maintenance inspection. We also learned that some
felt that customers need to be better as “customers” instead of being “bullies.”
From the supervisor’s perspective, the City offers too many choices to its customers. All this
costs the City money in parts inventory, training, tools or down times. The supervisors would
like departments (fleet coordinators, supervisors and operators) to agree on standardization of
pickups, trailers of the same classes and heavy equipment in order to make outfitting the fleet
more cost efficient.
The supervisors were also asked to identify any barriers to communication and suggest possible
remedies. We found that many of these “barriers” can be attributed to customers avoiding or not
knowing what the proper communications channels are and/or not fully understanding Fleet
Services’ responsibilities and priorities. Some of these barriers can be remedied by properly
structured service level agreements that will clearly identify the roles and responsibilities of the
parties involved. But some will require greater customer attention, awareness and information-
sharing on the part of the Fleet Services Division.
FLEET SERVICES POLICY MANUAL
We reviewed the Fleet Services policy manual and did not find any content dealing with
customer responsibilities and relationships. We recommend that a section be added to the
existing manual that details what customer responsibilities are. Some of the topics that should be
added are:
• Vehicle operator qualifications, including the distinction between those operators that need to have a valid Commercial Drivers License (CDL).
• The responsibility of the vehicle operator to inspect their vehicle equipment daily and report any problems.
• The responsibility of the operator of those units requiring a CDL to conduct a pre- and post-trip inspection in accordance with a specific driver checklist that meets the requirements of the Federal Motor Carrier Safety Act.
Fleet Operations Study
Chatham Consulting, Inc. 182
• The need to comply with the preventive maintenance program that has been prescribed by the Fleet Services for the particular class of vehicle.
• The need to maintain the cleanliness of the vehicle operated.
• Subjecting employees who violate the provisions of the policy to disciplinary action.
It would be beneficial to codify the vehicle operator responsibilities in municipal ordinance to
enhance the compliance process.
To provide guidance to Seattle, we have provided an illustrative policy and procedures document
in Exhibit 50 on customer responsibilities concerning operation of City-owned vehicles.
Additional examples are shown in the text boxes below.
Preventive Maintenance The department/property and driver are responsible for making the vehicle/equipment available for Preventive Maintenance (PM) and repairs. The operations manager and staff shall coordinate through Fleet Services’ personnel, a contact person that will provide assistance in ensuring that all vehicles/equipment are properly maintained, as required, and are made available for all maintenance.
Cleanliness of Motor Vehicles
Employees using [comment: make the following word generic?]County motor vehicles shall remove all garbage from the vehicle after each use. The Department of General Services is responsible for general cleaning of shared and priority County motor vehicles on a periodic basis. Cleaning of dedicated vehicles is primarily the responsibility of the department, Office or agency to which the vehicle is assigned. A shared or priority vehicle that is particularly dirty (either interior or exterior) should be reported to the General Services Manager as soon as possible.
Operator Responsibilities An operator has a responsibility for his/her particular piece of equipment and is expected to inspect this equipment daily, checking tire pressure, checking for fluid leaks, lubricant levels, belt conditions, battery connection and cleanliness, lights, signals and horn, windshield wipers, and wiper fluids and reporting any problems. For equipment which requires a Commercial Driver’s License, federal law dictates a specific driver checklist. Vehicle Service Technicians need to know the details of daily operations and defects.
Fleet Operations Study
Chatham Consulting, Inc. 183
SERVICE LEVEL AGREEMENTS
A tool that best practice organizations use to manage their fleets is the service level agreement.
These are formal, intra-agency service agreements with fleet customers that set out fleet services,
charges, and responsibilities of the parties, and levels of services including priorities, policies
and standards. These agreements are often used in conjunction with chargeback systems.
Vehicle/Equipment Operators Shall:
• Maintain the proper operator license • Comply with all Federal, State and local laws relating to the
operation of assigned vehicle equipment. • Inspect assigned vehicle/equipment prior to operation. • The inspection will include, but not be limited to the following
safety items depending upon vehicle/equipment type: o Water and oil levels o Foot and emergency brake o Head, tail and brake lights o Turn signals o Tire pressure and tire condition o Windshield wipers o Mirrors o Visual damage (dents, large scratches, cracked windows,
etc.) • Report deficiencies discovered through operator’s inspection,
which are beyond the operators capability, to the immediate supervisor for referral to the Fleet Management Office for repairs.
• Not put vehicle/equipment in motion until all occupants are restrained by seat belts.
• Not install, nor allow being installed, any additional electrical or electronic equipment such as stereo, CB’s, light, light chargers and radio chargers in any county vehicle/equipment.
• Equipment of this type will be installed by the Office of Fleet Management or an approved county vendor.
• Radar detectors are strictly prohibited in county vehicles. • Report all accidents in accordance with the County Safety Policy.
Fleet Operations Study
Chatham Consulting, Inc. 184
The main reason fleet organizations enter into service level agreements is to improve the
effectiveness and efficiency of their service delivery. Such agreements provide the following
benefits to both the fleet service provider and the customer groups:
• Establish clear performance expectations for the customer and service provider.
• Clarify the roles and responsibilities of both parties.
• Focus attention on the customer’s priority needs.
• Encourage a service quality culture, and continuous improvement.
• Provide a mechanism for both parties to plan for the future.
• Provide a useful tool for the customer to monitor performance.
• Place service providers in a better position to plan their delivery functions.
Key Features
The main features of a service level agreement include:
• Purpose statement: This states the general scope, the parties to the agreement and its duration.
• Business assumptions: This would include accountabilities, business processes, policies and definitions.
• Services to be provided: This should describe the services, what is included and excluded, costing principles and costs, etc.
• Service levels: This should deal with response time, resolution time and quality indicators.
• Performance measures: The quantitative indicators to measure how well the service provider is meeting its goals.
• Responsibilities of the service provider: This should set out reporting practices, prioritization, competencies, training and cost control.
• Responsibilities of the service user: This should include planning, lead times and effective communication with the provider.
Negotiating Approach
We list below some of the key steps involved in developing and negotiating a service level
agreement with Fleet Services customers.
1. Obtain general guidance from senior level management. 2. Meet with customer business unit to obtain detailed guidance on what they need. 3. Identify the services to be provided, their protocols, and priorities. 4. Identify the performance indicators to be measured.
Fleet Operations Study
Chatham Consulting, Inc. 185
5. Most importantly, identify the responsibilities of the customer as well. 6. Draft a preliminary agreement for review with customer. 7. Evaluate impact on existing fleet services operations. 8. Develop plan for meeting new operational requirements. 9. Refine plan and service level agreement. 10. Finalize agreement. 11. Obtain senior management approval. 12. Jointly publicize agreement with customer and Fleet Services staff. 13. Implement plan to deliver customer service. 14. Provide performance data to customer.
Service Level Templates
The Appendix contains two sample service level agreements for consideration by Fleet Services.
One has been drawn from the public sector while the second is from the private sector.
CUSTOMER PERFORMANCE METRICS
We suggest the following monthly set of performance metrics for Fleet Services to provide its customers:
• Number of PMs scheduled and completed.
• Number of PM no shows.
• Number and percent of work orders completed on time.
• Vehicle downtime report showing number of repairs completed within 24 hours, 24 to 48 hours and more than 48 hours.
• Percentage of vehicles and equipment available.
• Number of road calls per month.
• Summarized charges per cost center each month distinguishing between Fleet Administrative fees, maintenance and repair, vehicle replacements, fuel charges, accidents, capitalization charges.
On an annual basis, a replacement fund status report should be provided that tabulates year-to-
date and life to-date VERP (or equivalent) payments into the customer designated fund,
expenditures made from the fund and balance on hand. Also it should note any holdovers of
vehicles that were scheduled for replacement during the year, but are being deferred and the
reason they are being deferred, and the impact of the deferral.
Fleet Operations Study
Chatham Consulting, Inc. 186
Finally, Fleet Services should provide an online reporting tool available to its customers based
on the new FleetAnywhere web reporting tool that is being rolled out.
CUSTOMER AWARENESS PROGRAM
Fleet employees and customers need to be educated about each other. This can be accomplished
through the establishment of a Customer Awareness Program that is dedicated to education,
communication and understanding of the respective operations and needs of both groups.
Initially, Fleet Services employees should be educated about the operations of customer
departments by requesting customer departments develop a communications program about their
department, and then present that program to fleet employees at scheduled meetings. The
presentations should be geared toward informing fleet staff about the work functions each group
performs, explaining how their vehicles/equipment are used, and the conditions and terrain in
which they must work. Each group should also discuss how the garage operations impacted
their ability to do their work in both a positive and negative way.
After educating fleet personnel, the next step is to educate customers about the Fleet Services
Division and its operations. One technique that can be successful is to establish a speaker's
bureau for Fleet Services. This group should include personnel from the Division office as well
as field locations. These personnel should be available to speak to any user groups at staff
meetings, safety meetings, communication councils, or any other gatherings where a speaker is
requested. The purpose of this bureau is to tell the user groups about the organization of the
Fleets Services Division, its purpose in the City, and the services that are available.
.
In addition to the speaker's bureau, regular schedules for visiting counterparts in the major user
departments should be established. User departments should be visited to discuss problems,
concerns, or to exchange information that is relevant to both work groups such as the quality and
timeliness of the service provided. These meetings provide the opportunity for ongoing contact
with the users and help establish better working relationships and friendships between work
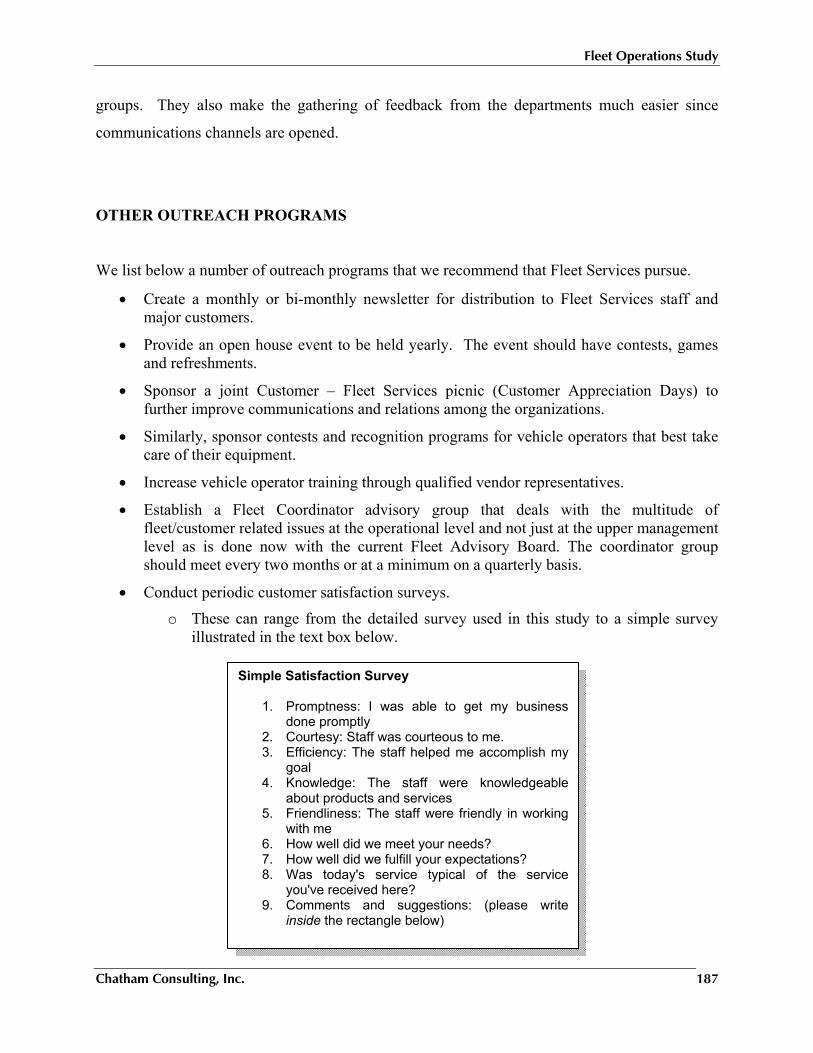
Fleet Operations Study
Chatham Consulting, Inc. 187
groups. They also make the gathering of feedback from the departments much easier since
communications channels are opened.
OTHER OUTREACH PROGRAMS
We list below a number of outreach programs that we recommend that Fleet Services pursue.
• Create a monthly or bi-monthly newsletter for distribution to Fleet Services staff and major customers.
• Provide an open house event to be held yearly. The event should have contests, games and refreshments.
• Sponsor a joint Customer – Fleet Services picnic (Customer Appreciation Days) to further improve communications and relations among the organizations.
• Similarly, sponsor contests and recognition programs for vehicle operators that best take care of their equipment.
• Increase vehicle operator training through qualified vendor representatives.
• Establish a Fleet Coordinator advisory group that deals with the multitude of fleet/customer related issues at the operational level and not just at the upper management level as is done now with the current Fleet Advisory Board. The coordinator group should meet every two months or at a minimum on a quarterly basis.
• Conduct periodic customer satisfaction surveys.
o These can range from the detailed survey used in this study to a simple survey illustrated in the text box below.
Simple Satisfaction Survey
1. Promptness: I was able to get my business done promptly
2. Courtesy: Staff was courteous to me. 3. Efficiency: The staff helped me accomplish my
goal 4. Knowledge: The staff were knowledgeable
about products and services 5. Friendliness: The staff were friendly in working
with me 6. How well did we meet your needs? 7. How well did we fulfill your expectations? 8. Was today's service typical of the service
you've received here? 9. Comments and suggestions: (please write
inside the rectangle below)
Fleet Operations Study
Chatham Consulting, Inc. 188
XVII. FINDINGS, CONCLUSIONS AND RECOMMENDATIONS
OVERALL ASSESSMENT
The City of Seattle has a large and diversified fleet operation involving 4,365 vehicles,
equipment and trailer units. Fleet management in Seattle is complicated and sometimes
conflicted, since fleet specification, replacement, and maintenance rests with multiple
organizations in the City.
Nevertheless, we found fully burdened labor rates to be competitive with local vendors and
maintenance and repair expenses comparable to other municipalities which we benchmarked.
Also, Seattle compares favorably to most maintenance and repair service indicators except
downtime and the proportion of work that is scheduled, which we believe are being adversely
affected by a shortage of maintenance and repair personnel and the advanced age of some of the
specialty fleet units. We estimate this shortage to be about four to five (4 to 5) mechanics.
Customers seem to be satisfied with the technical competence of the Fleet Services Division
mechanic workforce. However, they are less satisfied with Fleet Services Division management
and its processes related to billing, providing spare vehicles, and budgeting.
Despite their concerns about pay, Seattle mechanics still, as a whole, were more satisfied with
their working environment and the supervisors they work for than the mechanics we surveyed
recently from other cities.
Fleet Operations Study
Chatham Consulting, Inc. 189
FINDINGS
Benchmarking Results
We benchmarked Seattle to five other municipal fleets in the West. These were comparable in
population size to the City of Seattle, and included: Albuquerque, El Paso, Fort Worth, Long
Beach, and Sacramento. From our comparisons survey, we found:
• Seattle’s overall fleet department size is about seven (7) percent smaller than the other respondents, when taking into account the size and composition of its fleet in MRU vehicle equivalents.
• Seattle’s total maintenance and repair expenses per MRU were close to or below the median values.
• Seattle is unique with its Metal/Machine and Aerial Rebuilding Shops - none of the other cities reported having such operations.
• Given the size of its operation and the diversity of services it performs, the composition of the Fleet Services Division organization is not unusual.
• Seattle seems to have more in common with the two other West Coast cities of Long Beach and Sacramento in performing nearly all capital work in-house.
• Seattle was among the fleets that have a fleet replacement funding mechanism in place – not all cities surveyed have one.
• Nevertheless, Seattle was the only fleet that does not separately account for fleet replacement and fleet operating funds.
• Seattle’s markups for parts, tires, and fuel are within industry averages.
• Seattle’s markup of vendor repair is higher than average, but is not the highest.
• Seattle’s technical training hours per year were among the lowest.
• All but Seattle have some incentives for mechanics to obtain certification.
• Seattle, besides Albuquerque, was one of only two fleets that reported not having service level agreements in place with customers.
Performance Analysis
Seattle’s maintenance and repair expenditures per MRU vehicle equivalent are comparable to
other cities benchmarked. The Fleet Services Division also compares favorably to most
maintenance and repair service indicators except downtime and the proportion of work that is
scheduled. This indicates to us that more attention is needed in completing preventive
maintenance inspections on time and having sufficient staff to do so.
Fleet Operations Study
Chatham Consulting, Inc. 190
Fleet age is another factor that influences this outcome since breakdown repairs tend to increase
with the age of the vehicle. This is particularly noticeable for aerial trucks, some cranes and
construction equipment, where the Seattle vehicles are generally older and taking more time to
maintain and repair than industry averages.
CONCLUSIONS AND RECOMMENDATIONS
Rate Setting and Fund Management
Conclusions
On one hand, the fact that the City has codified a dedicated fleet fund is a best practice since it
provides the foundation for recovery of costs directly associated with fleet operating expenses
and capital expenditures. On the other hand, major improvements are needed in fund structure,
rate computation, capital recovery analysis and transparency. Exacerbating the situation are the
following factors:
• The Fleet Services Division is a large and complex organization that provides a multitude of services for a very large city fleet.
• Its customers have diverse needs, expectations and relationships with the Division.
• The existing methodologies for computing chargebacks are quite complex and not clearly understood by the customer base.
• Replacement funds are commingled with operating funds making it more difficult to easily determine how much money is actually available to meet future replacement needs.
• Existing rates are under recovering current fleet maintenance expenses, and may be under recovering projected capital requirements.
• A lack of transparency, although unintended, in rate development and funding creates:
o Doubt among customers on whether there are sufficient funds to replace their vehicles when due; and,
o Suspicion that their payments may be cross subsidizing other fleet operations.
• Furthermore, this lack unnecessarily increases the challenge for Fleet Services (or any fleet department for that matter) to justify the size of its fund balance and allay concerns of the fund being “raided” to serve other City, albeit, worthy needs.
Fleet Operations Study
Chatham Consulting, Inc. 191
These challenges can be mitigated by adopting the rate setting and fund management strategies
described in the Recommendations section.
Recommendations
Fleet Services should adopt activity-based concepts in estimating future charge back rates. This
report explains how this process works. Most importantly, rates should be designed to recover
full costs; i.e., direct, indirect and overhead. Maintenance and repair rates should not be used to
lower cash reserves in the Fleet sub fund.
The org cost accounts should be used to establish separate “funds” for capital and operating
costs. The capital “funds” should be divided among individual major department and
consolidated smaller departments. An annual status report should be provided to the fleet
customers on the amount of revenues collected, expenditures made, and reserves on hand in their
respective accounts.
Fleet Services should adopt a vehicle replacement program similar in concept to the VERP
program described in this report. The VERP model, which was submitted under separate cover
to Fleet Services, computes the annual replacement charges by vehicle by department. Also, the
planning horizon to compute replacement rates should be extended to ten years from the five
years presently used, except for fire tucks which should use a fifteen year forecast period.
Staffing
Conclusions
Compared to other large city fleet operations, the overall size of the Fleet Services organization
is slightly smaller per MRU vehicle equivalent. However, the amount of personnel and facility
resources that Fleet Services has in specialty shop operations like Paint & Body, Metal/Machine
and Capitalization are significantly greater. Furthermore, none of the other city fleets surveyed
for this study performs aerial device rebuilding in-house like the Fleet Services Division does.
Furthermore, detailed MRU analysis revealed that Fleet Services is shorthanded by four to five
(4 to 5) mechanics for maintenance and repair work.
Fleet Operations Study
Chatham Consulting, Inc. 192
Recommendations
Fleet Services needs to reconsider the 1,500 hours per year it uses as a target to estimate
mechanic requirements. This rate is unrealistic. Instead, a more realistic target would be 65 or
possibly 70 percent. Fleet Services should increase its maintenance and repair staff by four to
five (4 to 5) mechanics. Also, Fleet Services should apply the results of the MRU and
origin/destination analysis of this study to ensure that staffing remains balanced to workload by
shop.
Work Scheduling
Conclusions
Work scheduling practices need to be improved. Challenging factors include: many facilities
performing work on vehicles based at other shops; and significant amounts of capitalization
work are done at facilities other than the Capitalization shop.
Recommendations
Fleet Services should improve its work scheduling practices, using the templates included in this
report as a guide. Closer attention should be paid to the amount of a facility’s work that is
generated from vehicles assigned to other Fleet Services shops in the system. This inter-facility
workload can be significant and affects a facility’s scheduling process and staffing requirements.
Performance Measurement
Conclusions
Just collecting performance data is not enough. It is important to track and plot data periodically
so that any changes in performance levels can be spotted more easily. While most supervisors
indicated that the fleet information system provided them with the proper information to manage
their operation and work load, they cited improvement was needed in the consistency, accuracy,
and timeliness of the data.
Recommendations
Fleet Services should increase the number of performance indicators it measures, especially the
numbers of preventive maintenance no shows and the amount of turn-around time by vehicle
Fleet Operations Study
Chatham Consulting, Inc. 193
class, shop and department. The turn-around times, as described in this report, should be the
number of work orders completed within 24 hours, 48 hours, and more than 48 hours. Fleet
Services should also consider developing a monthly profit and loss statement by shop. Also, the
performance reports should be aggregated for each shop and the division as a whole to facilitate
trending through time.
Vehicle Specification
Conclusions
Based on our field observations and results from our surveys of customers, shop supervisors and
mechanics, we conclude that vehicle specification and standardization should be increased.
Recommendations
Fleet Services should revisit its vehicle specification process to increase the standardization of
the fleet. Insufficient standardization adversely affects mechanic productivity, and parts
warehousing and vehicle acquisition costs. Similarly, vehicle specifications should be written to
provide a more cost efficient unit.
Specialty Unit Life Cycle Analysis
Conclusions
Seattle averages significantly more hours to maintain and repair specialty equipment like aerial
devices and digger derrick trucks, when compared to industry averages. However, the ages of
these units are significantly greater than average as well.
Recommendations
Fleet Services needs to update the life cycle cost analysis of its specialty equipment like aerial
trucks, digger derricks and cranes. The results should be shared with City Light so that they can
reevaluate their vehicle replacement and funding practices. Aged units adversely affect not only
Fleet Services’ mechanics’ productivity, but also City Light’s cost for maintenance, repair and
downtime.
Fleet Operations Study
Chatham Consulting, Inc. 194
Cost of Service Analysis
Conclusions
In our opinion, most, if not all, of the aerial rebuild activity is not cost effective when taking into
account the total costs to perform this work, including that of vehicle downtime.
While we recognize that the Metal/Machine Shop services not only vehicles but facility
machinery, it is only fair to question the cost effectiveness of this shop activity. Similarly,
vehicle upfitting costs should be compared to obtaining vehicles already upfitted by automotive
dealers. In particular, the cost of outfitting patrol cars and time needed to place them in service
should be compared to what can be obtained by competitive bids.
Recommendations
Fleet Services should issue requests-for-quotation for the following services:
• Aerial device rebuilding,
• Vehicle capitalization/upfitting work,
• Metal/Machine work, and
• Tire service.
The quotations should include not only pricing but process times as well. We have provided
templates to assist Fleet Services in comparing these quotations to the costs of performing this
work in house. Furthermore, alternative procurement strategies should be pursued such as
acquiring vehicles on a turnkey basis, whereby the vendor supplies the vehicle already upfitted.
Outsourcing Versus Overtime
Conclusions
Overtime and outsourcing certain tasks on occasion can be used as an effective management tool
to meet peak or specialty work needs in the short run. Meeting longer term needs requires
additional economic analysis.
Fleet Operations Study
Chatham Consulting, Inc. 195
Recommendations
We recommend that Fleet Services adapt the templates in this report to assist in making
decisions regarding the use of overtime or outsourcing to meet peak or specialty needs. These
templates can be used for those situations when an in-house maintenance facility is near
capacity, and the line supervisor needs to quickly determine whether a repair should be given to
a commercial garage or be accomplished in-house with normal or overtime labor. Long term
considerations, such as constructing a new maintenance facility to provide additional capacity or
take on additional work, should be evaluated using internal rate of return analysis (or equivalent),
as described in this report.
Facilities
Conclusions
In general, we found that regulation compliance in all shops met the intent and spirit of OSHA
and WAC regulations for the types of workplaces operated by the City. Shop cleanliness and
housekeeping in general are commendable. We did find some capacity deficits at the Fire Shop,
SeaPark and South Service Center facilities. Capacity can be added without constructing new
facilities by shifting some of the workload from one facility to another, adding a work shift to the
Fire Shop, reallocating space and making some modest physical improvements.
Recommendations
There appear to be some capacity deficits at the Fire Shop, SeaPark and South Service Center
facilities. Capacity can be added without constructing new facilities by shifting some of the
workload from one facility to another, adding a work shift to the Fire Shop, and
• Reallocating existing space, such as:
o Moving machine tools out of Haller Lake and Fire shops to Charles Street to provide more space to support the vehicle repair operations.
o Expanding the body shop preparation area into one bay presently devoted to welding area.
o Conducting a study to determine the number and sizes of tires and wheels stored at the Tire shop.
• Adding some additional resources, such as:
o A heavy-duty lift for the Cedar Falls shop,
Fleet Operations Study
Chatham Consulting, Inc. 196
o Several computers for the Charles Street Truck Shop,
o Up-to-date scanning tools for vehicle and equipment diagnosis,
o Up-to-date subscriptions for on-line service manuals,
o Improved lighting at the Fire Garage,
o Sun screen shades for the west side of the Charles Street Shop, and
o Security fencing at the Haller Lake shop.
To accommodate future change in fleet size and its impact on facility requirements, Fleet
Services should develop a long term strategic plan and facility planning process.
Warehousing
Conclusions
Some of the Fleet Services Division’s warehouses (Haller Lake, Fire Shop and South Service
Center) lack the space to increase the number of parts that are stock if there is a significant
increase in size or mix of the fleet. While each of these locations was generally clean, we
observed at several locations evidence of clutter and parts in the aisle ways. Also, we found:
• The City inventory carrying cost falls within the range found at other MRO warehouses.
• The inventory accuracy rate of items counts exceeded 16 percent, which is outside expectable levels.
• The inventory variance rate of 10 percent is also outside expected levels.
• The Warehousing function lacks defined performance measures.
• The help function in the FleetAnywhere system cannot be activated by Warehouse personnel when they are using the program.
• Fleet Services lacks any planning on the parts needed for stock for preventive or predictive maintenance.
• Warehousers have good understanding of warehousing philosophies, but some lack actual parts knowledge.
• Fuel control is a very time consuming part of the warehousing duties, and takes away from their core duties.
• The large tire and wheel inventory in the Tire and adjacent Fire Shops could be larger than necessary. It could be more cost effective to rely on inventories of local tire suppliers.
Fleet Operations Study
Chatham Consulting, Inc. 197
Recommendations
• Develop and use the ABC analysis technique of stock items to segregate low moving parts so a true inventory turnover rate can be identified.
• Begin kitting parts for preventive maintenance and other scheduled work where it is feasible.
• Review existing inventory to ensure that the correct parts and quantities are being stocked, to increase the turns per year and reduce the total inventory on hand.
• Identify parts that are needed for predictive maintenance and timeline for adding to stock.
• Start planning PM and other definable work in advance and give the schedule to Warehousing for part kitting.
• Collect additional data for performance measures such as inventory accuracy rate, inventory variance rate and inventory stockout rate.
• Identify parts for stock at the time of the vehicle delivery. This should include items immediately needed, and items for predictive maintenance in the future.
• Make the help screens for Fleet Anywhere available while in the system.
• Have Warehousers take the ASE Parts Specialist series to improve their knowledge of parts to complement their knowledge of warehousing procedures.
• The duties and reporting structure for the fuels control personnel should be clarified.
• A study should be done to determine the number and sizes of tires and wheels to be stored by the City.
o It may be possible to cost-effectively reduce tire inventory in the Tire Shop to a level that would provide tires for immediate use and rely on inventory maintained at tire suppliers.
Employee Relations and Development
Conclusions
Despite their concerns about pay, Seattle mechanics were still, as a whole, more satisfied with
their working environment and the supervisors they work for than the mechanics we surveyed
recently from other cities. Nevertheless, Seattle mechanics had lower satisfaction levels with
their compensation and benefits than mechanics of other government fleets surveyed. The
mechanics and their supervisors seemed receptive to certification provided it was tied into
incentive compensation.
Fleet Operations Study
Chatham Consulting, Inc. 198
Recommendations
Establish a mechanic incentive and training program, whereby future compensation is tied in
with certification. The Institute for Automotive Service Excellence (ASE) has a sequence of
testing and progression that we recommend. Individual functions within the Fleet Services
Division may elect certain series of certifications relevant to their particular needs, but should at
a minimum require basic entry level competence or certification completion.
In addition to the ASE tests there are other recognized industry standards that can also be
required. These may be hydraulic certification, vehicle inspection licensing, emergency vehicle
technician and other industry or manufacturer certified programs.
We are recommending that the City of Seattle dedicate about two weeks of formalized technician
training per year.
Finally, management leadership is the key to the success of any incentive or performance
improvement program. Accordingly, the committee that is searching for a replacement to the
recently retired Fleet Services Director should look for candidates possessing certain leadership
qualities like:
• Having a clear vision for the Division,
• Being unequivocally committed to that vision
• Capable of communicating that vision effectively to all its employees,
• Committed to and total rapport with people that serve in the division, and
• Have basic management skills.
Customer Relations and Outreach
Conclusions
Customer relations and communications need to be improved. While most customers seem to be
satisfied with the technical competence of the Fleet Services Division’s mechanic workforce,
they are less so regarding Fleet Services’ management and its processes related to: billing, rate
systems, fund balances, spare vehicles, and budgeting. Furthermore, customers cited
communications most frequently as the area needing improvement, not only between them and
Fleet Operations Study
Chatham Consulting, Inc. 199
Fleet Services’ management, but also within the administrative levels of the Fleet Services
Division itself. This was corroborated when nearly all of the shop supervisors and crew chiefs
we surveyed indicated the same barriers to effective communications with customers.
Recommendations
Fleet Services should also improve customer relations and outreach by:
• Periodically reporting to them:
o Number of PMs scheduled and completed.
o Number of PM no shows.
o Number and percent of Work Orders completed on time.
o Vehicle downtime report showing number of repairs completed within 24 hours, 24 to 48 hours and more than 48 hours.
o Percentage of vehicles and equipment available.
o Number of road calls per month.
o Summarized charges per cost center each month distinguishing between fleet administrative fees, maintenance and repair, vehicle replacements, fuel charges, accidents, capitalization charges.
• Distributing newsletters to them.
• Holding annual open house events.
• Sponsoring Customer Appreciation Days.
• Sponsoring contests and recognition programs for vehicle operators that best take care of their equipment.
• Increasing vehicle operator training through qualified vendor representatives.
• Conducting periodic customer satisfaction surveys.
• Establishing service level agreements with major customers, using the guidelines described in this report.
• Establishing an advisory committee of fleet coordinators to discuss on a regular basis the tactical issues as opposed to the strategic issues that the FAB discusses.