Embed Size (px)
Citation preview

Flabellate Leaf Morphogenesis in Gingko biloba
Bethany Taylor-Garrett
Introduction
Gingko biloba, the sole extant species of the
gymnosperm order of the Ginkgoales first
appeared in the Jurassic period around 201.3–
145 million years ago and as such is regarded
as a living fossil (Sun, 1998). The fossil record
indicates that initially the Ginkgo genus was
widely distributed in both the Northern and
Southern hemispheres, but became
constrained in its diversity and distribution
with global cooling through the Lower
Cretaceous and into the Pleistocene, when the
genus became constrained to a sole surviving
species, Ginkgo biloba, in Southwest Japan (Del
Tredici, 2000) (Figure 1). Gingko biloba, a
species native to China, has been used
medicinally since 1505 AD (Isah, 2015), and is
still in use today, sold as the extract EGb761
with ‘neuroprotective, anticancer,
cardioprotective, stress alleviating, and
memory enhancing effects and possible effects
on tinnitus, geriatric complaints, and
psychiatric disorders’ (Mahadevan and Park,
2007).
Figure 1: The global distribution of present day Ginkgo biloba: torquoise areas show native Ginkgo biloba, and brown patches indicate where Ginkgo biloba has been introduced (Kew Science, 2017).
However, the species Ginkgo biloba, is not only
important to the scientific community in terms
of its medicinal prospects, but also as keystone
species in the evolution of flowering plants
(Friedman and Floyd, 2001).
Gingko biloba exhibits a somewhat rare,
flabellate ‘fan-like’ leaf shape (Figure 2), and as
such, the intricacies regarding its development
pose an interesting area of study. At present,
there are two hypotheses endeavouring to
elucidate the development of such a strange
leaf type. The first hypothesis, proposed by
Hara in 1980, attempts to explain Ginkgo leaf
development in terms of ‘tissue splitting’
whereby leaf primordia undergo three distinct
bifurcations to allow the protuberance to
unfold (Figure 3) (Hara, 1980). The alternative
hypothesis, explains Ginkgo leaf development
in terms of ‘differential growth’, in this
instance, the unique leaf shape is produced by
the increased cell growth along one plane of
the primordia which results in the cruciate
protrusion which is observed anatomically
during early ontogeny (Figure 3).
Figure 2: The flabellate (fan-shaped) leaf of Ginkgo biloba.
In this paper, I aim to address the mystery
surrounding Ginkgo leaf development using
two main approaches: anatomy and clonal
analysis to assess the validity of each of the
afore mentioned hypotheses.
Whilst the flabellate leaf is rarely found in
nature, the processes underlying the
hypotheses are seen elsewhere in the plant
world: Cladopus queenslandicus exhibits tissue
splitting by cell separation during leaf
formation (Koi, Imaichi and Kato, 2005), whilst
the orientation of cell division influences leaf
formation in Sarracenia purpurea (Fukushima
et al., 2015).
In terms of anatomy, Ginkgo were studied with
light microscopy and with EdU: a technique
which addresses a cell’s ability to proliferate by
incorporating 5-ethynly-2’-deoxyuridine, a
nucleoside analogue of thymidine (thymine
bonded to deoxyribose) into DNA during
translation, which can then be detected by a
copper-catalysed covalent reaction
(Invitrogen, 2011). Two types of EdU
experiment were used: the first, was the
classical whole-mount method whilst the
second used the pulse-chase method thus
allowing the direction of cell proliferation to be
measured (Yin and Tsukaya, 2016).
The second technique – clonal analysis –
utilises leaf variegation to detect cell lineage.
Leaf variegation arises from the presence of
two distinct genotypes in the same plant which
together form a genetic mosaic. By observing
the pattern of variegation along the petiole
and throughout the leaf, it is possible to
determine the origin of the cells from the
primordia.
Materials and Methods
Gingko biloba seedlings were collected from
The University of Tokyo’s Hongo campus, in
mid-June when they were approximately 17
centimetres tall with 4-5 leaves in total, at
different stages during development.
EdU
Whole mount
The shoot apical meristem and youngest
primordia were removed from the stem of the
seedling under a dissecting microscope using
Dumont #55 pointed forceps, and a
fragmented, mounted Feather razor blade. The
dissected shoot apices were then incubated in
Murashige-Skoog medium (MS) (2% (w/v)
sucrose with 10µM 5-ethynyl-2’-deoxyuridine)
at 22.9C in continuous light.
After a two hour or three-hour pulse period,
the samples were removed from the MS
medium and fixed in FAA (formaldehyde,
acetic acid and alcohol), and any excess air
B) Cruciate Dichotomy formed by Cell
A) Hara (1980) Initial Plan of Cruciate
Dichotomy
C) Cruciate Dichotomy formed by Differential Cell
Growth
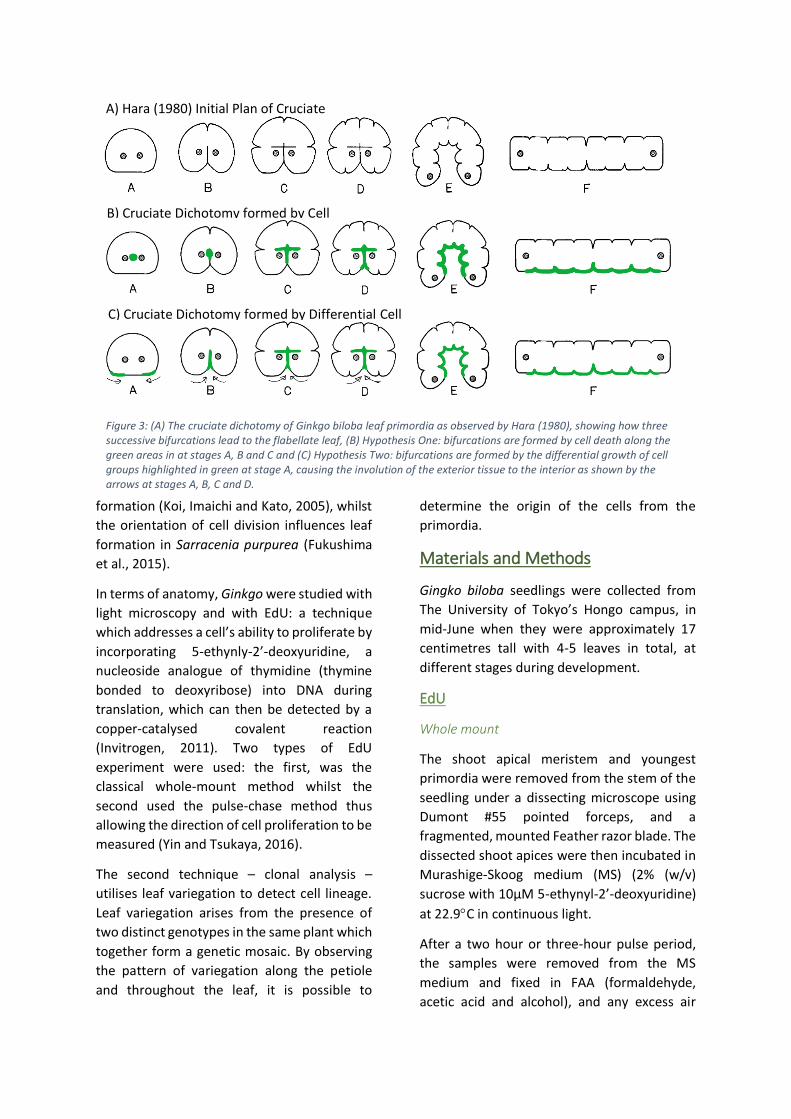
Figure 3: (A) The cruciate dichotomy of Ginkgo biloba leaf primordia as observed by Hara (1980), showing how three successive bifurcations lead to the flabellate leaf, (B) Hypothesis One: bifurcations are formed by cell death along the green areas in at stages A, B and C and (C) Hypothesis Two: bifurcations are formed by the differential growth of cell groups highlighted in green at stage A, causing the involution of the exterior tissue to the interior as shown by the arrows at stages A, B, C and D.

trapped within the plant tissue was removed to
allow deeper penetration of the FAA (50%
ethyl alcohol, 2.5% glacial acetic acid and 2.5%
formalin) using centrifugation at 10000g for 1
minute. The samples were then washed twice
in phosphate-buffered saline (PBS) combined
with 0.5% (v/v) Triton X-100, and then twice
with PBS for five minutes in each instance.
Leaf primordia were then removed from the
shoot apices using forceps and a mounted
blade and placed in the Click-iT® reaction
cocktail, which was then stored in darkness, at
room temperature for 30 minutes.
The primordia were then washed three times
in the PBS and 0.5% (v/v) Triton X-100
combination for twenty minutes each time,
and then mounted onto microscopy slides with
PBS and viewed by fluorescence microscopy
using a Leica DM4500.
Whole mount pulse-chase
As in the classical whole-mount EdU
experiment, Ginkgo seedlings were collected,
dissected and then incubated at 22.9 C
according to the method outlined above, but
the pulse period was significantly lower than in
the pulse-only method (Tables 1, 2 and 3).
Following incubation, seedlings were washed
in MS solution three times, for five minutes in
each instance and then returned to incubation
for the chase period. Following the chase
period, the samples were treated in the same
manner as the pulse only method.
Three trials were carried out in order to
improve the conditions of the pulse-chase
experiment: previous work had indicated that
a one-hour pulse followed by a seven-hour
chase was preferable, though few conditions
had been tested – three, seven and nineteen
hours, none of which produced optimal results.
Consequently, the initial trial aimed to bridge
the gap between seven and nineteen hours
(Table 1).
Trial One
Table 1: The conditions trialled in the first pulse-chase experiment.
Pulse Period Chase Period
1 hour
7 hours
10 hours 13 hours
16 hours
Trial Two
Table 2: The conditions trialled in the second pulse-chase experiment.
Pulse Period Chase Period
1 hour
7 hours
10 hours 16 hours
24 hours
Trial Three
Table 3: The conditions trialled in the third pulse-chase experiment. Note the decreased pulse period to correct for significant background signals, and increased chase periods in response to the outcome of trial two.
Pulse Period Chase Period
30 minutes
16 hours
24 hours 32 hours
Clonal Analysis
Variegated, ‘chimeric’ Ginkgo seedlings were
collected from the area surrounding Sanshiro
Pond on Hongo Campus, University of Tokyo.
Samples were then examined by naked eyes
for patterns of green and white variegation
that passed from the leaf into the petiole
(Figure 4), and then dissected under a
dissecting microscope using forceps and a
mounted blade into sections beginning at the
base of the leaf and proceeding along the
length of the petiole (Figure 4).

Figure 3: an example of a variegated Ginkgo biloba leaf suitable for clonal analysis due to the pattern of variegation passing down from the leaf into the petiole.
Results
EdU
The results of the whole mount pulse-only EdU
experiments agreed with previous findings in
that the three-hour pulse period produced
results superlative to the two-hour pulse
period in that more signals were observed.
The pulse-chase experiments suggested a
pulse of thirty minutes, followed by a chase
period of twenty-four hours were the best
among examined conditions for Gingko biloba
leaf primordia. Observation of the results
produced by these conditions showed what
appeared to be a random distribution of
signals, in varying directions (Figure 7).
Clonal Analysis
Twenty-six samples were dissected based on
the visibility of striations proceeding from the
lamina into the petiole. Post-dissection,
twenty-two samples were found to exhibit
traceable patterns. The patterns found within
these samples fell into two categories:
patterns of green cells moving from the
interior of the petiole to the exterior on
approach to the leaf, and patterns along the
edge of the sectors appearing to move towards
the adaxial lamina surface. The former pattern
was found in varying extents in all twenty-two
samples, whereas the latter was found in only
seven.
Discussion
EdU
Initial trials suggest that in fact, a longer chase
period than seven hours is beneficial in
observing Gingko biloba leaf primordia. The
best samples observed were those with a
thirty-minute pulse period followed by a
twenty-four-hour chase period.
Samples trialled in conditions with a one-hour
pulse period were seen to exhibit a large
amount of background noise: the reduction in
pulse period reduced this background by
reducing the number of cells which were able
to both uptake and replicate genetic material
containing the EdU. The primordia observed in
the first trial of the twenty-four-hour chase
period appeared to exhibit a second round of
cell division (Figure 5), which suggested that
the chase period may be too long, leading to
the following trial testing chase periods of
sixteen, twenty-four and thirty-two hours,
however, the second trial observed no pairs
exhibiting this secondary round of cell division.
Figure 4: The results of the one-hour pulse followed by the twenty-four-hour chase period. Pairs of mother and daughter cells are identified by blue circles and pairs in a second round of cell division are indicated by red circles.
The thirty-minute pulse followed by a sixteen-
hour chase was successful in producing
observable pairs (Figure 6A), although signals
were very few. In contrast, the thirty-minute

pulse followed by the thirty-two-hour chase
produced a high density of signals (Figure 6B),
and as such, any pairs that were present were
difficult to observe. The twenty-four-hour
chase period seemed to produce the best
results: signals were present in a reasonable
density and allowed pairs to be isolated
without too much difficulty (Figure 7).
Given the three-dimensional structure of the
leaf primordia, signals away from the surface
of the sample were difficult to focus on during
microscopic observation – given that the pulse-
chase period has now been improved since
preceding trials, it is now advisable that the
experiment be carried out under the thirty
minute pulse and twenty-four hour chase
period, but samples should be prepared by
serial paraffin sectioning using a rotary
microtome as opposed to whole-mount, to
produce images of an improved resolution
which can then be used to trace the direction
of cell division (Yin and Tsukaya, 2016).
Regardless of the issues regarding the image
focus, the study of the images produces during
the trials suggest there is no significant pattern
to the position of signals nor to the orientation
of mother and daughter cells – this insinuates
that there is no particular area of the
primordium in which there is an increased level
of cell growth in a particular direction and thus
discourages the idea that the cruciate
dichotomy is formed by hypothesis two (Figure
3C).
Clonal Analysis
The clonal analysis of variegated Gingko biloba
revealed two types of patterns involving
patches of green and white cells: patterns
whereby there was a movement of cells from
the interior to the exterior of the petiole
(Figure 8A) and those of patterns along the
edge of the petiole moving from the corners of
sectors towards the adaxial lamina.
The former pattern (Figure 8A) was seen in all
twenty-two dissected samples whereas
patterns of the latter type (Figure 8B) were
observed in only seven of the dissected
samples – all of which also exhibited the
former pattern to varying extents. Pattern one
may only be explained by hypothesis one
(Figure 3B): patches of green originating in the
centre of the primordia appear to move
towards the adaxial lamina and then spread
out. Pattern two, however, may be explained
by both hypothesis one and hypothesis two
A
B
Figure 6: The results of the thirty-minute pulse followed by the sixteen-hour chase (A) and the thirty-two-hour chase (B). Observable pairs of daughter cells are circled. The inset image on the top left of each image portrays the bright-field view of the sample.
Figure 7: The results of the thirty-minute pulse followed by the twenty-four-hour chase. Pairs are indicated by solid circles and possible pairs are indicated by circles with dashed lines. The inset image on the top left of each image portrays the bright-field view of the sample.

(Figure 3B and 3C). This fact, coupled with the
recognition of pattern one in all samples with
sufficient variegation to allow tracking
suggests that clonal analysis supports
hypothesis one.
Given that the preliminary results of the EdU
pulse-chase fail to portray an obvious density
of dividing cells in a restricted area of the
primordia, and in a specific direction as would
be expected if the hypothesis of differential
cell growth was true and the results of the
clonal analysis, it appears at this early stage of
study that the hypothesis of cell death is more
feasible in explaining the method of
bifurcation in Gingko biloba leaf development.
References
Del Tredici, P. (2000). Ginkgo biloba. Boca
Raton: CRC Press.
Friedman, W. and Floyd, S. (2001).
PERSPECTIVE: THE ORIGIN OF FLOWERING
PLANTS AND THEIR REPRODUCTIVE
BIOLOGY—A TALE OF TWO PHYLOGENIES.
Evolution, [online] 55(2), p.217. Available at:
http://friedmanlab.oeb.harvard.edu/files/frie
dmanlab/files/2001_friedman_floyd_evolutio
n.pdf [Accessed 14 Jun. 2017].
Fukushima, K., Fujita, H., Yamaguchi, T.,
Kawaguchi, M., Tsukaya, H. and Hasebe, M.
(2015). Oriented cell division shapes
carnivorous pitcher leaves of Sarracenia
purpurea. Nature Communications, 6, p.6450.
Hara, N. (1980). Morphological study on early
ontogeny of the Ginkgo leaf. The Botanical
Magazine Tokyo, [online] 93(1), pp.1-12.
Available at:
https://link.springer.com/article/10.1007/BF0
2489482 [Accessed 9 Jun. 2017].
Invitrogen (2011). Click-iT® EdU Imaging Kits.
Available at
https://tools.thermofisher.com/content/sfs/
manuals/mp10338.pdf [Accessed 12 Jun.
2017].
Isah, T. (2015). Rethinking Ginkgo biloba L.:
Medicinal uses and conservation.
Pharmacognosy Reviews, 9(18), 140–148.
http://doi.org/10.4103/0973-7847.162137
Kew Science (2017). Plants of the World:
Ginkgo biloba. [online] Available at:
http://powo.science.kew.org/taxon/urn:lsid:i
pni.org:names:262125-1 [Accessed 25 Jul.
2017].
Koi, S., Imaichi, R. and Kato, M. (2005).
Endogenous Leaf Initiation in the Apical‐
Meristemless Shoot of Cladopus
queenslandicus (Podostemaceae) and
Implications for Evolution of Shoot
Morphology. International Journal of Plant
Sciences, 166(2), pp.199-206.
Figure 8: The two types of pattern observed in Ginkgo biloba chimeras - blue circles indicate the pattern supporting the cell death hypothesis: the green cells appear to start on the interior in a central position and then move towards the adaxial lamina, whilst the red lines indicate patches of green cells that appear to start on the periphery of the section, and then traverse the adaxial lamina to a more central position – thus supporting both hypotheses (Figure 3).

Mahadevan, S. and Park, Y. (2007).
Multifaceted Therapeutic Benefits of Ginkgo
biloba L.: Chemistry, Efficacy, Safety, and Uses.
Journal of Food Science, [online] 73(1), pp.R14-
R19. Available at:
https://www.ncbi.nlm.nih.gov/pubmed/1821
1362 [Accessed 14 Jun. 2017].
Takada, S., Takada, N. and Yoshida, A. (2013).
ATML1 promotes epidermal cell differentiation
in Arabidopsis shoots. Development, [online]
140(9), pp.1919-1923. Available at:
http://dev.biologists.org/content/140/9/1919
[Accessed 13 Jun. 2017].
Smith, A. (2009). Plant biology. New York:
Garland Science.
Sun, W. (1998). Ginkgo biloba. The IUCN Red
List of Threatened Species 1998:
e.T32353A9700472.
http://dx.doi.org/10.2305/IUCN.UK.1998.RLTS
.T32353A9700472.en.
Yin, X. and Tsukaya, H. (2016). A pulse-chase
strategy for EdU labelling assay is able to
rapidly quantify cell division orientation. New
Phytologist, [online] 211(4), pp.1462-1469.
Available at:
http://onlinelibrary.wiley.com/doi/10.1111/n
ph.13980/abstract [Accessed 16 Jun. 2017].