Embed Size (px)
Citation preview

Fix NYC Advisory Panel Report — January 2018
Fix NYC Advisory Panel Report
January 2018

Fix NYC Advisory Panel Report — January 2018
2

3
Fix NYC Advisory Panel Report — January 2018
TRANSMITTAL LETTER
January 19, 2018
As New Yorkers, we face two serious transportation crises on a daily basis – one above ground and one below.
While subway delays have always been part of life in New York City (NYC), the frequency of delays and breakdowns in the subway system — largely caused by overcrowding and deteriorating infrastructure — require the development of a plan for immediate action.
Similarly, traffic congestion in Manhattan has long been a defining feature of our city, but over the past few years, the gridlock caused by congestion has become more impactful on daily life. The periods of time during which the Central Business District (CBD) seems to grind to a halt last longer and occur more frequently throughout the day.
Despite these challenges, population, employment and tourism are all at historic highs and show no signs of slowing. NYC is as vibrant and attractive a place to live, work, and visit as it has ever been.
In October 2017, Governor Andrew M. Cuomo brought together a mix of community representatives, government officials, and business leaders from across the region to serve on the Fix NYC Advisory Panel. The Panel was tasked with developing recommendations to address the severe traffic congestion problems in Manhattan’s CBD and identify sources of revenue to fix the ailing subway system.
The Panel met in October, November, and December of last year and January of this year, and was supported by staff from New York State’s transportation agencies and HNTB Corporation. We received presentations on previous pricing proposals, international case studies, current data and research con-ducted by experts, and transportation modeling scenarios. The policy recommendations and options for implementation included in this report are based on our analysis of this information and our joint discussions at the Panel meetings.
The Panel believes the MTA must first invest in public transportation alternatives and make improve-ments in the subway system before implementing a zone pricing plan to reduce congestion. Before asking commuters to abandon their cars, we must first improve mass transit capacity and reliability.
While some may inaccurately claim our proposals are regressive, the Panel’s recommendations attempt to consider to the needs of outer borough commuters and present options for congestion relief to New Yorkers in ways that are both fair and feasible.
We urge the Governor and New York State (NYS) Legislature to consider these strategies for reducing congestion in Manhattan and improving mobility across the region. Fixing NYC is everyone’s responsibility.
Mitchell L. Moss Director, Rudin Center for Transportation, NYU
Sam Schwartz CEO, Sam Schwartz Engineering
Scott Rechler Chairman, Regional Plan Association
Kathy Wylde President and CEO, Partnership for New York
Bill Rudin Chairman, Real Estate Board of New York
John Samuelsen International President, Transport Workers Union
Peter Ward President, New York Hotel Trades Council
Tom Prendergast Former Chairman and CEO, MTA
Fernando Ferrer MTA Vice Chairman
Reverend Dr. Floyd Flake Former U.S. Congressman
Hon. David Paterson Former Governor, New York State
Darryl Towns Former Assemblyman, Brooklyn Former Commissioner, NYSHCR
James Molinaro Former Borough President, Staten Island
Kevin Law President & CEO, Long Island Association
Hon. Steve Bellone Suffolk County Executive

Fix NYC Advisory Panel Report — January 2018
4
Executive Summary
Traffic CongestionNew York City traffic congestion now ranks second worst among cities in the United States and third worst among cities in the world, and is estimated to cost the New York metro area economy $100 billion over the next five years. Although overall traffic volume into the CBD is decreasing, gridlock and congestion continue to grow. With greater emphasis on livability initiatives, available roadway capacity in the CBD has been reduced because of the installation of pedestrian plazas, bike lanes, and dedicated bus lanes. Truck volumes have also increased with the rise of e-commerce. Tourism continues to flourish, bringing more and more pe-destrians, tour buses and intercity coaches. With-out adequate enforcement of traffic violations, pe-destrians encounter unsafe conditions, bus lanes and intersections are frequently blocked, and dou-ble parking is pervasive. Finally, there has been an undeniable increase in application-based for-hire vehicles (app-based FHVs) within the CBD. All of these factors combined have led to an untenable condition of congestion.
Subway ChallengesThe subway system has suffered from years of overcrowding and neglected maintenance result-ing in chronic breakdowns and delays. In June 2017, Governor Cuomo declared the Metropolitan Transportation Authority (MTA) to be in a state of emergency and directed its leadership to produce a recovery plan for the subway system. Chairman Joseph Lhota submitted his Subway Action Plan (SAP) in July 2017 and asked New York City and New York State to each contribute half of the $836 million needed for Phase One of the program. Even after short-term remedies are implemented, additional funding will be required for the transfor-mative upgrades the system requires.
Proposed SolutionsIn an effort to address the needs of our transpor-tation networks above and below ground, Gover-nor Cuomo created the Fix NYC Advisory Panel in October 2017. He directed the Panel to focus on strategies to address the severe traffic congestion problems in Manhattan’s CBD and to identify sourc-es of revenue to help fix the ailing subway system.
The Panel has developed the following recommen-dations:
A Phased Approach is EssentialPhase One initiates investments to improve tran-sit connectivity between the CBD and the outer boroughs and suburbs and calls for immediate stepped up enforcement by NYPD of existing traf-fic laws. Phase Two calls for a surcharge on taxi and FHV trips in the CBD at the conclusion of a ten month period to allow transportation service com-panies to install the appropriate GPS technology in all vehicles. Phase Three features the installation of a zone pricing program, first for trucks, and then for all vehicles, entering Manhattan’s CBD below 60th Street.
In Phase One, the Panel offers six recommenda-tions:
1. Identify Public Transportation Improvements for the Outer Boroughs and SuburbsThe Panel has learned lessons from internation-al examples that strongly support first investing in public transportation alternatives before im-plementing a zone pricing plan to reduce con-gestion. These investments, once identified, will enhance the capacity of public transporta-tion alternatives to accommodate those who may choose to leave their vehicles at home upon implementation of a pricing zone and will yield significant private economic benefit to surrounding properties and businesses. The Panel recommends that the Legislature support the Governor’s budget proposal to authorize Tax Increment Financing for the MTA. Plus, the Panel strongly endorses the Governor’s recom-mended procurement process modifications.

5
Fix NYC Advisory Panel Report — January 2018
2. Improve Enforcement of Traffic Laws within the CBDNYC can have an immediate impact on conges-tion by adequately enforcing existing laws and regulations such as spillback (blocking the box) and bus lane enforcement.
3. Overhaul the NYC Placard ProgramThe State of New York should empanel a joint NYS/NYC review board to reevaluate the distri-bution of all government issued parking plac-ards eligible for use in New York City.
4. Assess and Address the Impact of Bus Congestion the CBDThe NYS Department of Transportation, in con-sultation with the NYC Department of Transpor-tation and the Port Authority of New York and New Jersey (PANYNJ), should perform a com-prehensive review of conditions and regula-tions related to commuter, intercity, charter and tour buses that have a particularly detrimental impact on congestion on the West Side of Mid-town and in lower Manhattan.
5. Reform Taxi and Limousine Commission (TLC) RegulationsThe City Council of New York and the TLC should review the existing FHV class catego-ries to ensure they accurately reflect techno-logical advancements with the objective of a consistent policy framework.
6. Begin Early Work on Zone Pricing Infrastructure InstallationThe installation of the zone pricing infrastruc-ture will require approximately 24 months for planning, design, and construction, including completion of an Environmental Impact State-ment (EIS).
TERMS USED THROUGHOUT THIS DOCUMENT:
Central Business District (CBD) – the commer-cial and business center of a city. In the context of this report, CBD refers to an area of Manhattan bounded by 60th Street on the north and Battery Park on the south, the Hudson River on the west and the East River on the east.
Dynamic Pricing – A pricing system where rates are continually adjusted according to traffic con-ditions to maintain a free-flowing level of traffic. Rates are determined in real-time throughout the day.
For Hire Vehicles (FHVs) – There are three class-es of FHV service in NYC: Community Cars (Liv-eries), Black Cars (including application-based transportation services), and Luxury Limousines.
Peak Pricing – A variable pricing system that charges higher rates during times of peak traffic or peak congestion.
Transportation Service Companies – Includes yellow and green taxis, and all classes of For Hire Vehicles.
Variable Pricing – A pricing system that estab-lishes different rates for various times of the day or week that are based on a predetermined set of conditions, such as traffic speed, congestion lev-els, traffic demand, or other measurable param-eters. Variable rates do not change in real-time.
Zone Pricing – An area that is encircled by a boundary or cordon with trips that cross into the area being charged a fee during certain times of the day and/or week. In the context of this report, the term zone represents the area within Man-hattan encompassed by the precise boundary line of the Central Business District (CBD).

Fix NYC Advisory Panel Report — January 2018
6
In Phase Two, the Panel recommends implemen-tation of a surcharge policy for taxis and FHVs op-erating within the CBD with revenues dedicated to the MTA for transit improvements.
7. Implement a Congestion Surcharge on FHV and Taxi Trips in the CBDTransportation service companies should be afforded a period of ten months to install the equipment necessary to fulfill the requirements of a surcharge policy on trips entering or origi-nating in the CBD. Options for consideration in-clude: the geographical boundaries of the sur-charge zone, the amount of the surcharge, and the hours of the day and days of the week the surcharge will be in effect. The panel also urges consideration of a significantly reduced rate for pool trips, as well as methods for reducing the amount of time FHVs spend cruising the CBD without passengers. All revenues from the sur-charge should be dedicated to the MTA for the Subway Action Plan and transit improvements identified under Recommendation 1.
In Phase Three, the panel recommends implemen-tation of a pricing zone, with the boundary defined as the CBD, to reduce traffic congestion and pro-vide another dedicated stream of revenue to the MTA for system improvements. The Panel sug-gests that FDR Drive be exempt from the pricing zone from the Brooklyn Bridge to 60th Street. In addition, the Panel recommends that drivers using tolled facilities to enter the pricing zone (the Lin-coln, Holland, Hugh L. Carey, and Queens Midtown Tunnels) receive a credit against the zone charge for the amount of the toll already paid.
8. Implement Zone Pricing for Trucks Entering the CBD Once the infrastructure is in place, the panel recommends initiating the zone charging pro-gram inside the CBD with an assessment on trucks that enter the zone during certain peak hours. A brief period of truck-only charging will permit potential operational issues to be identi-fied and corrected.
9. Implement Zone Pricing for All Vehicles Entering the CBDOnce the pricing zone infrastructure is oper-ating properly and smoothly, the Panel rec-ommends implementation of zone pricing for all vehicles. The panel urges consideration of variable and dynamic pricing options in order to maximize congestion reduction.
Performance MeasuresFair and frequent review of the program and oppor-tunities to make modifications when necessary are critical to earning and maintaining public support for the congestion reduction program. The panel recommends evaluation of these metrics twice a year, published in a report available to all, which assesses the efficacy of the surcharge and zone pricing programs.
ConclusionTo remain a world-class city and region, New York must address the increasing congestion on our roadways and bring the subway system back to a reliable state. We encourage leaders at all levels of government to work collaboratively to sustain the region’s economic competitiveness, enhance the quality of life for all New Yorkers, and help our city retain its place as the greatest city in the world.
7
Fix NYC Advisory Panel Report — January 2018
Traffic Congestion
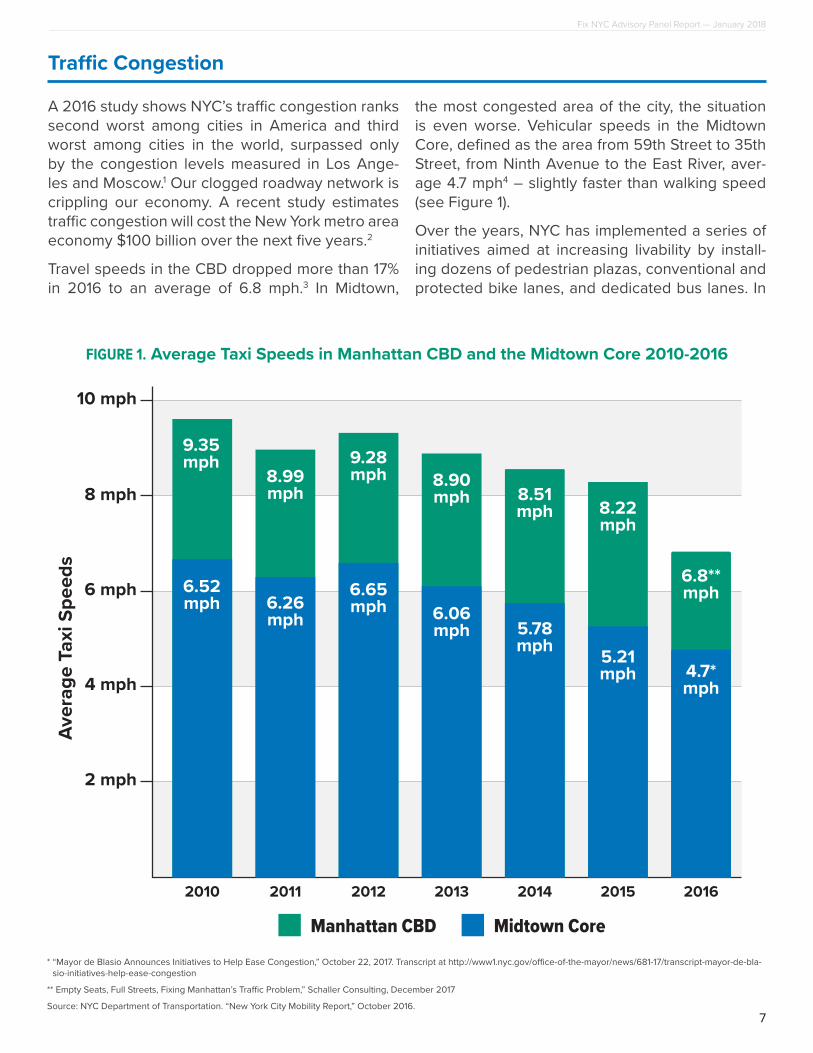
A 2016 study shows NYC’s traffic congestion ranks second worst among cities in America and third worst among cities in the world, surpassed only by the congestion levels measured in Los Ange-les and Moscow.1 Our clogged roadway network is crippling our economy. A recent study estimates traffic congestion will cost the New York metro area economy $100 billion over the next five years.2
Travel speeds in the CBD dropped more than 17% in 2016 to an average of 6.8 mph.3 In Midtown,
the most congested area of the city, the situation is even worse. Vehicular speeds in the Midtown Core, defined as the area from 59th Street to 35th Street, from Ninth Avenue to the East River, aver-age 4.7 mph4 – slightly faster than walking speed (see Figure 1).
Over the years, NYC has implemented a series of initiatives aimed at increasing livability by install-ing dozens of pedestrian plazas, conventional and protected bike lanes, and dedicated bus lanes. In
FIGURE 1. Average Taxi Speeds in Manhattan CBD and the Midtown Core 2010-2016
2010 2011 2012 2013 2014 2015 2016
Aver
age
Taxi
Spe
eds
4 mph
2 mph
6 mph
8 mph
10 mph
Manhattan CBD Midtown Core
6.52mph
9.35mph
6.26mph
8.99mph
6.65mph
9.28mph
6.06mph
8.90mph
5.78mph
8.51mph
5.21mph
8.22mph
4.7*mph
6.8**mph
* “Mayor de Blasio Announces Initiatives to Help Ease Congestion,” October 22, 2017. Transcript at http://www1.nyc.gov/office-of-the-mayor/news/681-17/transcript-mayor-de-bla-sio-initiatives-help-ease-congestion
** Empty Seats, Full Streets, Fixing Manhattan’s Traffic Problem,” Schaller Consulting, December 2017
Source: NYC Department of Transportation. “New York City Mobility Report,” October 2016.

Fix NYC Advisory Panel Report — January 2018
8
fact, 23 pedestrian plazas,5 17 bus lanes,6 and 109 miles of bike lanes7 are located within or include portions within the CBD.
Pedestrians, too, are flooding the sidewalks, spill-ing over into the streets and bike lanes, particularly in Midtown. Between 2009 and 2015, the number of pedestrians increased 18 percent on weekdays and 31 percent on the weekends.8 This influx of pedestrians into the streets slows traffic, increases congestion, and obstructs vehicles attempting to turn corners at crowded crosswalks. The queuing of vehicles at pedestrian-packed intersections fur-ther impedes the flow of traffic and creates serious safety concerns.
Despite dedicated bus lanes on numerous CBD streets, and upgrades to the bus fleet, bus speeds continue their steady decline. Bus movements are often impacted when unauthorized vehicles enter or park in the bus lanes or when vehicles “block the box” at intersections. The MTA bus system lost 100 million passenger trips over the last eight years, according to an October 2016 report by the Office of the NYC Comptroller.9 Manhattan has seen the greatest decline in bus ridership, down 16 percent since 2011.10
Truck volumes into NYC are increasing, fueled by the rise of e-commerce. The New York Metropoli-tan Transportation Council (NYMTC) is forecasting a 46 percent rise in freight tonnage through 2040, which will increase congestion in the CBD caused by additional truck deliveries and through trips.11
The rapid growth in internet “app” or “on-demand” based transportation services has contributed sig-nificantly to recent congestion spikes. NYC TLC data indicates the number of trips and the number of total vehicle hours for app-based FHVs have both dramatically increased since 2013 (see Figure 2), while the number of yellow taxi trips and vehicle hours in the CBD are in steep decline.12 The impact of app-based FHVs roaming within the CBD is un-deniable, according to a report issued in December 2017 by former NYC Department of Transportation Deputy Traffic Commissioner Bruce Schaller:
“These large increases in the number of vehicles (both occupied and unoccupied) in the CBD clearly have a very significant im-pact on CBD traffic flow. The growth in taxi/TNC [FHV] vehicles is even more remarkable given that traffic counts at avenues crossing 60th Street and the East River crossings show steady declines in the number of ve-hicles entering the CBD. As a result of these two trends — more taxis/TNC [FHV] vehicles but an overall drop in vehicles entering the CBD — taxis/TNC [FHV] vehicles have be-come a very large part of overall traffic.” 13
Source: Schaller Consulting, “Empty Seats, Full Streets. Fixing Manhattan’s Traffic Problem.” December 2017
2013 20170
50k
100k
150k
200k
250k
300k
350k
400k
450k
500k
Taxi
Black car
App-BasedTransportation
Services
Trip
s (A
vera
ge W
eekd
ay)
378,166Taxi
249,767
202,262
17,818
FIGURE 2. Taxi and FHV Service Trips in the Manhattan CBD, 2013-17
9
Fix NYC Advisory Panel Report — January 2018
Subway Challenges
“The subway system is no doubt in distress and we’re here for solutions.”
– MTA Chairman Joseph Lhota, June 2017
Not unlike their fellow New Yorkers driving on the surface streets, NYC’s straphangers have been coping with breakdowns and delays on a subway system that is finding its way through a prolonged period of distress and disarray.
The legal structure and operating procedures of the MTA and NYCTA are important to understand. While over the decades there have been many dif-ferent elected officials and appointed executives with varying opinions and strategies, what gov-erns are the legal responsibilities, especially for management, operating and capital costs. In 1953, legislation creating the New York City Transit Au-thority was enacted for the purpose of transferring operational management of the subways to the new Transit Authority from their owner/operator, the City of New York.14 The legislation confirmed the City’s continuing legal ownership and leased the operation to the NYCTA for management pur-
poses. As owner, NYC retained the obligation to fund all capital projects, as well as other rights. Lat-er that year this enacted law was modified in order to vest with the board of estimate (now the Mayor under current law) approval authority over any cap-ital expenditures made by NYCTA exceeding five million dollars. This $5 million figure had no infla-tion adjustment and subsequent legislation never changed the figure.15
Once the Transit Authority was up and running, the City’s leadership shifted its focus to the expansion of highway infrastructure. With little attention over the next two decades, the Transit Authority strug-gled. Construction and maintenance were deferred, trains broke down and entire lines were shut down. There were additional efforts to establish alterna-tive sources of capital for the subways, such as bonding authority for the Transit Authority and the new Metropolitan Transportation Authority in the
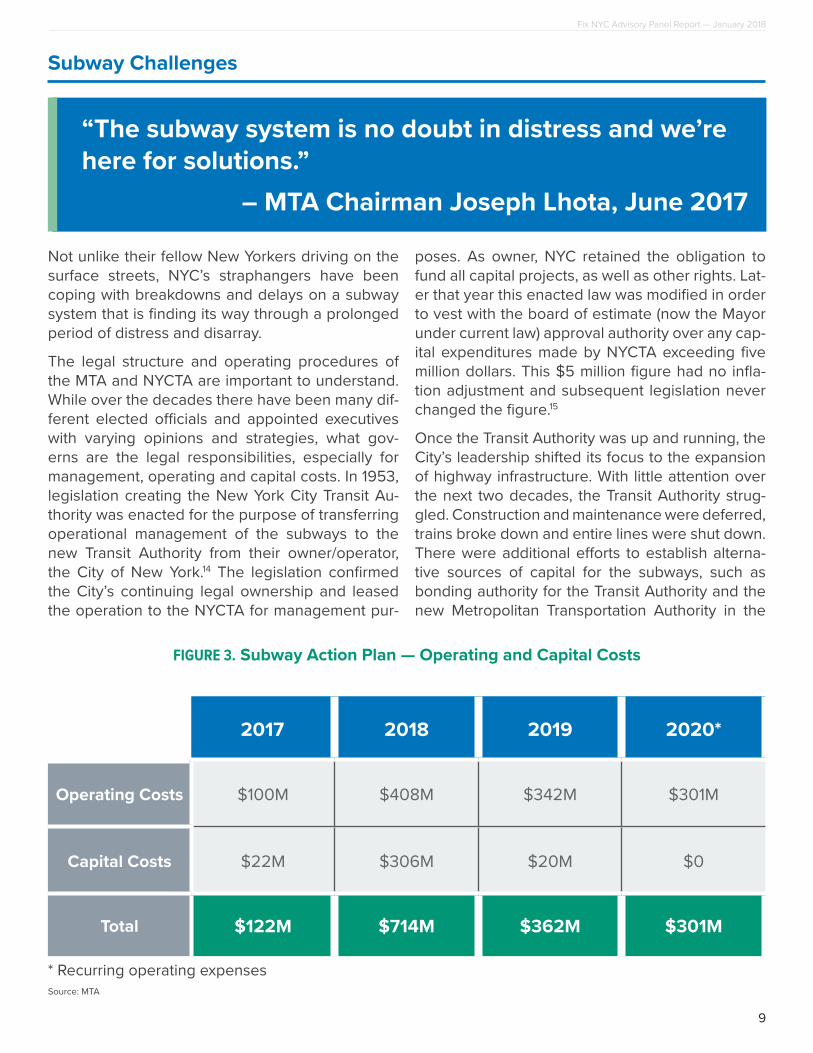
FIGURE 3. Subway Action Plan — Operating and Capital Costs
2017 2018 2019 2020*
Operating Costs $100M $408M $342M $301M
Capital Costs $22M $306M $20M $0
Total $122M $714M $362M $301M
* Recurring operating expensesSource: MTA

Fix NYC Advisory Panel Report — January 2018
10
1960s. Nothing modified the City’s contractual and statutory obligation to fund capital improvements.
By the late 1970s, the subway system was plagued by crime and graffiti and in a state of total disre-pair. In the midst of its own historic economic crisis, the City was unable to meet the many needs and challenges facing the system. The state govern-ment stepped up in 1981 with desperately need-ed financial assistance and institutional reform.16 These changes included the formation of a Capi-tal Program Review Board (CPRB) to examine and approve five-year plans submitted by the MTA for agencies and facilities. CPRB’s members represent the Governor, the Speaker, and the Senate Tem-porary President. In addition, a representative of the Mayor of New York was appointed to the board but only for review of the Transit Authority’s por-tion of the plan. The Governor’s, the Speaker’s and the Senate Temporary President’s members on the CPRB may veto any MTA plan or any plan of its subsidiary entities. The Mayor’s member may only veto or approve the NYCTA plan. The Mayor-al appointee’s veto power was meant to unify the concept of mayoral approval for capital obligations over $5 million established in the 1950’s with the new CPRB structure. The State has no statutory re-sponsibility to fund the capital or operating plans separate from MTA finances.
Throughout the 1980s and into the 1990s the City continued to have financial hardships and inter-im ad hoc negotiations between the city and the state instituted different financial arrangements with the State providing funding beyond its le-gal obligation to stabilize the NYCTA operation. Through the administration of Mayor David Din-kins a number of agreements were reached to provide temporary assistance. In 1995, Mayor Gi-uliani became more assertive of the City’s owner-ship and capital plan veto authority of the NYCTA, as evidenced by him shifting control of policing from the NYCTA Police Department to the New York City Police Department.
During the spring of 2017, New Yorkers suffered through months of seemingly daily failures of the tracks, signals, switches or power systems, includ-ing three derailments. In June, Governor Cuomo took the unprecedented yet necessary step of de-claring the MTA – specifically the NYCTA – to be
in a state of emergency and directed its new lead-ership to produce a recovery plan within 30 days. Upon his return to the role of Chairman, Joseph Lhota submitted his SAP in July 2017 (see Figure 3), and asked the State and the City of New York to each contribute half of the required funding. While Chairman Lhota’s request was not legally justifi-able, it reflected the historic response in the 1980s emergency situation in which the state stepped in to provide support. By law, if the NYCTA has an operating deficiency the MTA’s recourse is either to reduce operating costs or raise fare revenue. If the NYCTA has a capital needs request, the MTA can submit a capital needs plan to the CPRB, which can approve or disapprove, and the Mayor’s mem-ber has a unilateral veto/approval. The Mayor’s member can negotiate with the MTA to reduce or increase the total amount of the capital plan, or ne-gotiate the projects within the plan.
Chairman Lhota’s “emergency” plan had both cap-ital and operating needs and requested a 50/50 State/City split which avoided a fare increase. Gov-ernor Cuomo, who had declared the emergency, agreed to fund 50% of the plan (capital and oper-ating) and has provided such funding in his 2019 budget plan. The City has thus far refused to agree to fund its 50%. If the City refuses to fund 50% of the capital and operating cost, Chairman Lhota’s legal options are to reduce the scope and cost of improvements, extend the construction timeline to future years, or to increase fares to cover the City’s 50% of the operating cost.
MTA Subway Action Plan StatusPhase One of the SAP was devised to stabilize and improve the system by addressing key drivers of 79 percent of the major incidents causing failures and delays (see Figure 4).
Several months in, there are signs the Plan is work-ing. Weekday major incidents are down 21 percent in October 2017 from June 2017 and down 10 per-cent from October 2016. Weekday major signal incidents decreased 36 percent in October 2017 from June 2017 and 45 percent from October 2016. Using the same comparison periods, weekday major track incidents improved by more than four percent, and weekday major power incidents im-proved by 50 percent.17

11
Fix NYC Advisory Panel Report — January 2018
The repairs included in the SAP will fortify the ag-ing system and bring subway service back to a lev-el of reliability New Yorkers deserve and expect. The Panel is encouraged that the plan is already showing progress, but is concerned about the on-going debate over its funding.
The region’s commuters are tired of uncertainty and delays. We are glad the State has committed to contributing half of the $836 million Plan; we must work together to fund the remainder. Our elected leaders and officials must recognize that we are all in this together, and as such, we are all responsible.
International Experiences
“The Stockholm charges went from the most expensive way ever devised to commit political suicide to something that the initially hostile media declared to be a success story.”
– Jonas Eliasson, Director, Stockholm City Transportation Administration
While heavy traffic is a sign of a bustling, expanding economy, there is a point at which too much con-gestion represents a threat to economic growth. The Manhattan CBD is only one example of many such areas around the globe where that threat is now real. While city streets are typically public goods, free for all to use, there is a point at which the next user reduces the utility value for everyone else, a situation often referred to as the “tragedy of the commons.” With each additional user, the level of service that the roadway provides becomes fur-ther and further eroded, as manifest in increasing levels of congestion, reduced vehicle speeds and increased pollution.
Under conditions of severe congestion, commut-ing workers bear excess fuel and vehicle operating costs, which in turn increase employer costs by virtue of their having to pay higher wages. Higher
delivery costs similarly add to business operating costs. Workers spending more on gasoline and auto maintenance will have less disposable in-come to spend on other goods and services. Simi-larly, the added commuting times reduce both time spent working and time spent engaging in leisure activities, resulting in a reduction in productivity and reduced sales for businesses in the leisure and hospitality sector.
The precipitous decline in vehicle speeds within the Manhattan CBD to near walking speed is a sig-nal that those who choose to drive into the most congested part of the City are not bearing the full cost of that choice. In the economics literature, this situation represents a classic case of a negative externality and indicates the presence of a severe market failure. A fee set at the appropriate level addresses that failure by compelling drivers to in-
FIGURE 4. Primary Causes of Subway Delays
Signals, Track & Power
Stations
Medical
Fire
Cars
Water
54%4%4% 7%5%5%Source: MTA

Fix NYC Advisory Panel Report — January 2018
12
ternalize the full social cost of their travel choices, which is why several international cities have opt-ed for zone pricing.
As the examples below demonstrate, zone pricing improves the flow of traffic by imposing a charge on drivers that can vary with the level of congestion or time of day. Drivers pay a higher price to drive into the zone when traffic is heavy and a lower price when traffic is light. Drivers can choose to avoid the charge entirely by choosing to share rides, use mass transit, travel at off-peak times, or travel on alternative, less congested routes. Although zone pricing has yet to be employed in the U.S. as an approach to reducing excessive traffic congestion, it has been successfully implemented in several large international cities.
SingaporeSingapore first implemented a congestion pricing plan, known as the Area Licensing System, in 1975; the system was redesigned in 1998 and renamed the Electronic Roadway Pricing (ERP) system.18
The ERP system operates from 7am to 7pm and charges vehicles $2 per crossing. Upon imple-mentation of the ERP system, Singapore saw a 24 percent reduction in weekday traffic entering the Central Business Zone and increases in average travel speeds. In 2020, Singapore will move to a satellite based system for congestion charging.
LondonLondon implemented their congestion charging system in 2003 after first studying the problem as far back as 1964.19 Starting with a cordon that cov-ered an eight-square-mile portion of their heavily congested CBD, London started charging drivers £5 ($7.50) per day for entering the charging zone area between 7am and 6pm (the fee has since in-creased to $15). The cordon area was expanded by another eight square miles in 2005. London uses a camera-based collection system for recording vehicle license plates, which has proven more ex-pensive to operate and maintain than a transpon-der-based system. The initial cost of setting up the system was $260 million in 2003.
To prepare for the introduction of the congestion charge and ensure its success, London made sig-nificant transit investments upfront, by adding new bus routes to their network prior to implementa-tion. More than five hundred extra buses were put in service during peak hours to receive passengers choosing mass transit over cars, thus relieving ca-pacity pressures that would have been absorbed by the London Underground.
Once zone charging went live, London saw an im-mediate congestion reduction of 25 percent with average speeds increasing by 30 percent. Carbon dioxide emissions dropped by 20 percent. Imple-mentation was so successful that the system fell far short of its initial revenue target of $195 million due to the reduction in the number of autos entering the zone;20 first year collections totaled only $98 million. Taxis and FHVs are exempt from London’s congestion fee. Nevertheless, the London strategy succeeded in making the city more “multimodal” by encouraging and expanding the supply of bus service and allowing car lanes to be converted to bus and bike lanes without increasing traffic con-gestion, implying environmental as well as purely economic benefits.21
StockholmAfter careful study of the approach taken in Lon-don, Stockholm implemented Sweden’s first con-gestion charging system for its CBD, an area ac-cessible only by a series of bridges.
In the face of strong initial public opposition to the program, the City opted to implement its system as a seven-month pilot program in 2006. They invested $136 million in new bus purchases, and introduced new bus routes running parallel to their most crowded subway lines. The charges ranged from $1.33, $2.00, and $2.67 for vehicles entering the CBD from 6:30am to 6:30pm with a maximum of three charges per day. Taxis were exempt from the congestion charge. The system of overhead gantries and transponders required a capital in-vestment of $410 million with annual operating costs of approximately $30 million.22

13
Fix NYC Advisory Panel Report — January 2018
Stockholm’s zone pricing program proved suc-cessful from day one. Congestion dropped by 25 percent and average speeds rose 25 percent. Use of public transportation increased between six and nine percent. Carbon dioxide emissions dropped by 10 percent to 14 percent in the inner city.23
In late 2007, a public referendum easily passed making the program permanent. Program reve-nues presently total approximately $100 million on an annual basis.
Unlike the London system, Stockholm implement-ed time-varying prices, which along with the city’s smaller size has been cited as allowing Stockholm to sharply cut congestion while charging much less than London.24
MilanA zone pricing system was implemented in Milan with a focus on both reducing congestion and vehicle emissions. In 2008, Milan launched a trial system called “Ecopass,” which charged vehicles based on emissions class and banned the worst polluting vehicles. Like Stockholm and sister city Gothenburg, the charge zone is surrounded by 43 gantries supporting cameras, but like London, the charge does not vary over the course of the day. A three-year trial period was followed by a successful referendum in 2011. The Milan system underwent a redesign in 2012, reopening under the name “Area C,” and has been successful in improving the city’s air quality.25
Road Pricing Concepts Considered
The Panel reviewed several types of road pricing systems that have been used successfully in the United States and internationally. Most road pricing concepts are used on highway corridors, bridges, and tunnels. The experience in the United States has mainly been focused on priced managed lanes (sometimes called High-Occupancy Toll (HOT) lanes) to help manage traffic demand and maxi-mize capacity. A second focus of road pricing in the United States is conventional toll facilities for roads, bridges, and tunnels to fund their construc-tion. Internationally, various cities have introduced cordon or zone-based charging to help control congestion in the Central Business Districts. In ad-dition, numerous countries have introduced truck tolling programs to help offset the costs of high-way deterioration and environmental degradation caused by trucks. The Panel also reviewed the use of adjusting parking surcharges and vehicle regis-tration fees for their potential impact on congestion and revenue.
Conventional toll facilities to help pay for the con-struction of infrastructure were not considered ap-propriate for the Fix NYC Program since specific
infrastructure is not being constructed (such as a new road, bridge, or tunnel). Given the nature of Manhattan’s street system, where it is difficult to channelize traffic given the required access to resi-dences, businesses and attractions, price managed lanes would be extraordinarily difficult to imple-ment and enforce. Finally, increasing registration fees would unfairly penalize residents of the CBD who own cars and are not the only contributors to roadway congestion.
Given the indisputable success of congestion charging using a cordon or zone-based system, the Panel finds this option best suited for controlling congestion within the CBD especially with Man-hattan’s street network layout and access options from points east and west. However, the panel rec-ognizes that we now live in the new era of urban-ized transportation where more and more of the congestion on city streets is the result of increased use of app-based transportation companies. These vehicles are now the most significant source of congestion and the panel suggests unprecedent-ed approaches for tackling the challenge head on.
Fix NYC Advisory Panel Report — January 2018
14
A Phased Approach is Essential
“Enhanced public transportation services are an essential component of a zone-based pricing system and must be comprehensively planned and deployed well in advance of zone-based charging.”
– Federal Highway Administration, February 2017
The Panel recommends a comprehensive, phased congestion reduction plan that steps up enforce-ment of existing traffic laws and initiates transit im-provements for the outer boroughs and suburbs. As confidence is restored in the subway system, it becomes appropriate to implement a surcharge on taxi and FHV trips in the CBD, followed by the in-stallation of a zone pricing program, first for trucks, and then for all vehicles entering Manhattan’s CBD below 60th Street.
While expectations are high for the introduction of a traffic reduction plan that will provide immediate relief from congestion, the Panel has concluded that there are lessons to learn from experiences abroad. London and Stockholm invested in public transportation improvements in advance of imple-menting a zone pricing system, including substan-tial capacity expansion to accommodate diverted commuters. We must commit to doing the same in NYC, recognizing that such projects cannot hap-pen overnight.
Similarly, the installation of infrastructure such as gantries, E-ZPass equipment, and cameras in sup-port of a zone pricing program require extensive planning and environmental review, as well as in-put from local communities.
Most importantly, the installation of zone pricing infrastructure and the implementation of public transportation improvements require capital invest-ments for which no funding is currently identified.
For these reasons, the Panel suggests that a phased approach is essential for a congestion re-duction and revenue generation program in NYC. A methodical approach, coupled with an ongoing awareness of how the myriad other transportation projects underway around NYC impact residents and their mobility, will ensure the congestion re-duction program’s success in the long run.

15
Fix NYC Advisory Panel Report — January 2018
Phase One Recommendation: Create a Plan Foundation
The first phase includes identifying capital invest-ments needed to improve public transportation in the outer boroughs and suburban counties, and increasing enforcement of existing traffic laws. Phase 1 should begin in 2018.
1. Identify Public Transportation Improvements for the Outer Boroughs and SuburbsHaving learned from the experiences of cities that have already successfully implemented cor-don pricing, the Panel recommends investments in public transportation to connect the outer bor-oughs and suburbs to the CBD and to each oth-er to accommodate commuters willing to change their mode of travel.
Decisions on appropriate investments must include input from elected officials, business groups, tran-sit experts, community representatives, the MTA, PANYNJ, the NYS Department of Transportation and the NYC Department of Transportation.
The City and State should consider investments that will support the diverted trips resulting from the installation of the zone pricing system. It should consider, for example, investments in transportation options and technologies serving residents of Staten Island, Brooklyn, Queens, and the Bronx, as well as the suburban counties within the MTA district. Non-capital-intensive solutions, including alternative fare structures, should also receive consideration.
The MTA’s infrastructure must be maintained in a state of good repair, while necessary upgrades are made to improve service especially in the outer boroughs and our transit deserts. In order to meet these goals, the MTA is constantly making histor-ic and significant investments into its facilities, but it faces two challenges in maximizing returns on such investments.
First, these investments yield significant private economic benefit to surrounding properties and businesses, but these are not returned to the MTA. It is only fair that the customers of the MTA recoup these significant benefits, paid for by their fares and tolls. Therefore, the Panel recommends that the Legislature support the Governor’s budget proposal to authorize Tax Increment Financing for the MTA. Doing so would allow the MTA to recoup significant returns on its capital investments, which could then be leveraged into future projects.
Second, the MTA’s current procurement process-es required by law are cumbersome, inefficient, and obsolete. The Governor has recommended changes to these processes that will allow the MTA to make necessary investments identified as part of this recommendation at a faster pace. The Panel strongly supports the Governor’s rec-ommended procurement process modifications. Time is of the essence, and the Panel suggests wasting no time in delivering these necessary in-vestments for NYC residents.
2. Improve Enforcement of Traffic Laws Within the CBDThroughout the day, vehicles clog intersections by “blocking the box,” illegally weaving in and out of designated bus lanes to make pickups and drop offs, and parking illegally in travel lanes and at the curb. All of these actions restrict the free flow of traf-fic and prevent responsible use of curbside space for deliveries. To point fingers at the drivers of cars, trucks and buses alone while assessing blame for the outrageous level of congestion in the CBD ig-nores human nature: no one will change their be-havior when no one is holding them accountable. NYC is responsible for issuing violations for these offenses, which are broken into two classes – mov-ing violations and parking violations.
Fix NYC Advisory Panel Report — January 2018
16
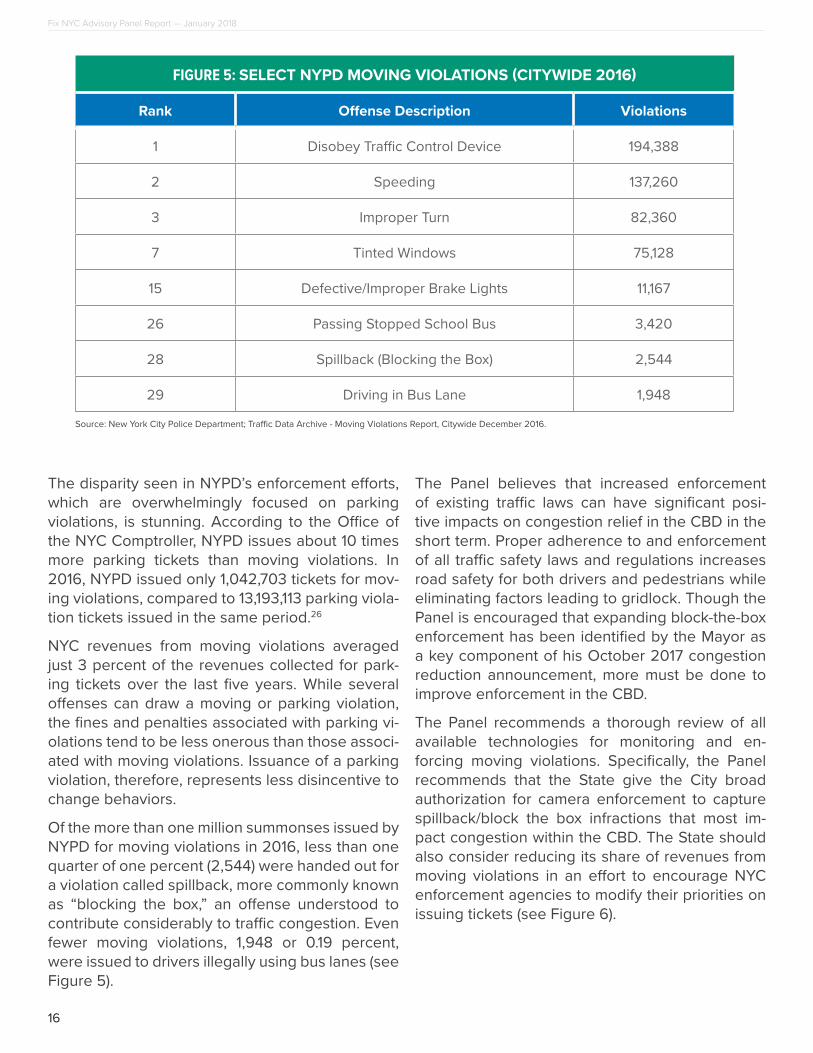
The disparity seen in NYPD’s enforcement efforts, which are overwhelmingly focused on parking violations, is stunning. According to the Office of the NYC Comptroller, NYPD issues about 10 times more parking tickets than moving violations. In 2016, NYPD issued only 1,042,703 tickets for mov-ing violations, compared to 13,193,113 parking viola-tion tickets issued in the same period.26
NYC revenues from moving violations averaged just 3 percent of the revenues collected for park-ing tickets over the last five years. While several offenses can draw a moving or parking violation, the fines and penalties associated with parking vi-olations tend to be less onerous than those associ-ated with moving violations. Issuance of a parking violation, therefore, represents less disincentive to change behaviors.
Of the more than one million summonses issued by NYPD for moving violations in 2016, less than one quarter of one percent (2,544) were handed out for a violation called spillback, more commonly known as “blocking the box,” an offense understood to contribute considerably to traffic congestion. Even fewer moving violations, 1,948 or 0.19 percent, were issued to drivers illegally using bus lanes (see Figure 5).
The Panel believes that increased enforcement of existing traffic laws can have significant posi-tive impacts on congestion relief in the CBD in the short term. Proper adherence to and enforcement of all traffic safety laws and regulations increases road safety for both drivers and pedestrians while eliminating factors leading to gridlock. Though the Panel is encouraged that expanding block-the-box enforcement has been identified by the Mayor as a key component of his October 2017 congestion reduction announcement, more must be done to improve enforcement in the CBD.
The Panel recommends a thorough review of all available technologies for monitoring and en-forcing moving violations. Specifically, the Panel recommends that the State give the City broad authorization for camera enforcement to capture spillback/block the box infractions that most im-pact congestion within the CBD. The State should also consider reducing its share of revenues from moving violations in an effort to encourage NYC enforcement agencies to modify their priorities on issuing tickets (see Figure 6).
FIGURE 5: SELECT NYPD MOVING VIOLATIONS (CITYWIDE 2016)
Rank Offense Description Violations
1 Disobey Traffic Control Device 194,388
2 Speeding 137,260
3 Improper Turn 82,360
7 Tinted Windows 75,128
15 Defective/Improper Brake Lights 11,167
26 Passing Stopped School Bus 3,420
28 Spillback (Blocking the Box) 2,544
29 Driving in Bus Lane 1,948
Source: New York City Police Department; Traffic Data Archive - Moving Violations Report, Citywide December 2016.

17
Fix NYC Advisory Panel Report — January 2018
3. Overhaul the NYC Placard ProgramThe Panel strongly recommends that NYS and NYC create a joint review board to assess the impacts of parking placard use within the CBD and establish criteria for the retention of existing placards and the distribution of new ones. NYC has issued ap-proximately 160,500 placards, with roughly 114,600 of those held by NYC employees.27 All too often, these placards are used illegally. Cars with plac-ards are often seen parked illegally at bus stops, in loading zones, and at unpaid meters, none of which are allowable uses. Placard abuse signifi-cantly contributes to congestion, by taking up curbside parking without paying the meter, which, in turn, forces buses to stop in travel lanes to serve riders and trucks to double park instead of access-ing the curb to make deliveries.
4. Assess and Address the Impacts of Bus Congestion in the CBDThe significant rise in the number of buses in the CBD and the evolution of their function have nega-tive impacts on street congestion, road safety, and air quality. The increase in volume has occurred at the same time as parking lots and spaces available for commuter, charter and tour buses on the West
Side are disappearing. The Hudson Yards develop-ment is rapidly shrinking the capacity to handle bus volumes due to loss of road space, parking lots and suitable curb space.28 With no place to park, buses are routinely circling around West Side neighbor-hoods, parking illegally, or heading out to New Jer-sey to park. The trip to NJ creates two additional trans-Hudson trips, exacerbating congestion in the already crowded Holland and Lincoln Tunnels.
As New York continues to see record high tourism numbers, more intercity and private charter buses are clogging traffic lanes than ever before, particu-larly on the West Side of Midtown and Lower Man-hattan. The number of tour buses licensed to op-erate in NYC has risen from 54 in 200329 to 237 in 2016.30 Making matters worse, tour buses fall into a murky regulatory area where they evade many regulations, leading to numerous safety violations and accidents in recent years.
The panel recommends that NYSDOT initiate a comprehensive review, along with PANYNJ and NYCDOT, of parking and operating regulations and licensing of motor coaches operating in Midtown and in downtown.
Source: New York City Comptroller Scott Stringer; New York City Fine Revenues Update; May 3, 2017.
FY 2012$0
$100
$200
$300
$400
$500
$600
FY 2013 FY 2014 FY 2015 FY 2016
Parking Tickets Moving Violations
($ in
mill
ions
)$513
$12
$467
$19
$546
$14
$565
$11
$545
$24
FIGURE 6. New York City Parking Ticket & Moving Violation Revenues (FY 2012-2016)

Fix NYC Advisory Panel Report — January 2018
18
5. Reform TLC RegulationsMassive shifts have taken place within NYC’s trans-portation service industry and action must be tak-en to reexamine State and local laws and regula-tions that guide it. As an example, the lines between livery, black car, and app-based transportation companies have now blurred beyond recognition; regulations must be updated to accurately guide the industry.
Incentives currently exist to increase the supply of transportation service vehicles during peak hours. Now that the supply exceeds demand, these incentives should be examined.
6. Begin Early Work on Zone Pricing Infrastructure InstallationWork must begin now on the development of poli-cies, environmental and legal reviews, and design for the zone pricing program. The Panel has re-ceived estimates of approximately 24 months for the planning, environmental work, design, and construction of the infrastructure and establishing the software systems and business processes re-quired for a pricing program. Much of this work can proceed in advance of final decisions on pric-ing rates, times of the day, exemptions, special conditions, and other aspects of the zone pricing program. The Panel recommends that the early work commence as soon as possible, undertaken by the MTA.
The Panel recommends that the zone encompass the CBD in Manhattan extending from 60th Street to the south, with the exception of FDR Drive from the Brooklyn Bridge to 60th Street (see Figure 7). Vehicles will be charged electronically to enter this zone by a system of cameras or transponders and
readers, which we already know as E-ZPass. The fee can vary by time of day, route, and vehicle type. This is consistent with all previous congestion re-duction proposals for NYC.
The panel recommends that the existing Payroll Mobility Tax (PMT) be dedicated to the MTA to cov-er the bonding and debt service costs of the in-frastructure necessary to operate the zone pricing program. Right now, the PMT must be appropriated annually by the State legislature. This step is un-necessary; every dollar of the PMT belongs to the MTA. Eliminating this appropriation ensures that if PMT revenue is pledged to bondholders, it will flow in a timely manner, making bonds secured by it stronger. The Panel commends the Governor for including this proposal in his budget submission.
Potential Zone Pricing
BoundaryDoes NotInclude
FDR DriveNorth of the
Brooklyn Bridge
60th St
FIGURE 7. Potential Zone Pricing Boundary

19
Fix NYC Advisory Panel Report — January 2018
Phase Two Recommendation: Implement Surcharges on Taxi and FHV Trips in the CBD
Once the SAP is well underway and a sense of reliability and dependability has returned to the subway system, more attention and resources can be focused on the congestion crisis above ground. We now know that app-based FHVs are a signifi-cant contributor to the dramatic increase in road congestion. The goal of Phase Two is to raise ad-ditional revenues to provide funding to meet on-going subway and transit improvement needs and potentially reduce the number of vehicles in the CBD. Phase 2 should begin in 2019.
7. Implement a Surcharge on FHV and Taxi Trips in the CBD
“No anti-congestion plan will be successful unless it deals head-on with the prolifera-tion of on-demand ride services.” – Bruce Schaller, NY Daily News, December 28, 2017
The widely held belief that the unchecked pro-liferation of app-based FHVs in the CBD is a significant contributor to congestion has been confirmed. A recent report found that taxis and app-based FHVs now contribute to as much as half of the congestion in the CBD.31 The Panel rec-ommends that the State introduce a uniform sur-charge policy for all transportation service trips (taxis, limousines, liveries, black cars, and app-based FHVs) that touch the CBD.
All vehicles must have the appropriate GPS tech-nology installed within ten months for accurate tracking to ensure swift implementation, uniform enforcement and monitoring of conditions within the CBD. Potential methods of enforcement must also be considered.
Options for consideration for the initial FHV and taxi surcharging program should include a charging zone with a northern boundary at 60th Street or 96th Street (see Figure 8). As traffic congestion in Manhattan is hardly a weekday-only phenomenon, consideration should also be given to extending the effective hours into weekday evenings and
weekends (see Figure 9). Revenue raised under these various surcharge options should flow to the MTA to be utilized for the SAP and for transit improvements in the outer boroughs or suburban counties, including bus systems. A significantly lower surcharge should apply to pooled trips and pool services.
Cruising ChargesThe tremendous rise in FHV trip volumes has con-tributed to increasing congestion in yet another way – an increase in time spent idling in the CBD with-out passengers, waiting for the next fare. Schaller
Potential Taxiand FHV Charging
60th St
96th St
Potential Zone Pricing
BoundaryDoes NotInclude
FDR DriveNorth of the
Brooklyn Bridge
FIGURE 8. Potential Taxi and FHV Charging Zones

Fix NYC Advisory Panel Report — January 2018
20
estimates that unoccupied FHV hours rose from virtually zero in 2013 to 36,500 by 2017. He also estimates that FHV drivers spend an average of 11 minutes between dropping off one passenger and picking up the next. The result is a “proliferation of waiting drivers … in the CBD, particularly in Mid-town”32 (see Figure 10).
To reduce the duration of idling within the CBD, the Panel recommends exploring both regulatory and fee-based solutions that permit app-based compa-nies and their drivers to determine the most effi-cient strategy for achieving the desired goal. New strategies would likely emerge as dispatch technol-ogies become even more sophisticated.
SURCHARGE OPTIONSWithin CBD/Touching CBD weekend rate
FIGURE 9. ESTIMATED FHV & TAXI TRIP SURCHARGE GROSS REVENUE (IN $MILLIONS)
Below 60th Street Below 96th Street
Mon–Fri6am–8pm
Mon–Fri6am–11pm
Mon–Fri 6am–11pm
Sat and Sun 12pm–10pm
Mon–Fri6am–8pm
Mon–Fri6am–11pm
Mon–Fri 6am–11pm
Sat and Sun 12pm–10pm
$2.00 fee (all CBD-touching trips) $155 $195 $245 $190 $235 $295
$4.00/$2.00 $2.00 weekends $225 $285 $335 $305 $380 $440
$4.00/$2.00 weekdays and weekends $225 $285 $360 $305 $380 $480
$5.00/$3.00 (6am - 8pm) $2.50/$1.50 (8pm - 11pm) $2.00 weekends
$290 $330 $380 $385 $435 $495
$5.00/$3.00 $2.00 weekends $290 $370 $420 $385 $480 $540
$5.00/$3.00 weekdays and weekends $290 $370 $465 $385 $480 $600
$5.00 fee (all trips) $2.00 weekends $355 $450 $500 $430 $545 $605
2013
2017
10k0 20k 30k 40k 50k 60k 70k 80k
Taxi
Black carApp-BasedTransportation Services
Hours
34,148
Taxi28,541 36,539 2,877
FIGURE 10. Taxi and App-Based Transportation Services unoccupied vehicle hours (between passengers) in Manhattan CBD, 2013-17
Schaller, Bruce. “Empty Seats, Full Streets. Fixing Manhattan’s Traffic Problem,” Schaller Con sulting, December 2017

21
Fix NYC Advisory Panel Report — January 2018
Phase Three Recommendations: Implement Zone Pricing for Vehicles Entering the CBD
The goal of Phase Three is to reduce the number of vehicles into the CBD during peak hours and raise additional revenues to provide the necessary funding for the MTA to meet ongoing subway and transit improvement needs. Phase 3 should begin in 2020.
8. Implement Zone Pricing for Trucks Entering the CBDThe Panel believes that trucks are a significant con-tributor to congestion in the CBD. Once the design and construction of the zone pricing infrastructure is complete the Panel recommends that zone pric-ing begin with a congestion fee only on trucks. While truck volumes into the CBD represent less than 8 percent of total vehicles, truck emissions account for 18 percent of total emissions from the transportation sector in NYC.33 Based on the analy-sis performed by the technical team supporting the Panel, the suggested zone entry fee E-ZPass rate for trucks should be 2.2 times the automobile rate, consistent with the existing range of rates for the toll tunnels connecting lower Manhattan to the out-er boroughs and New Jersey, where trucks are cur-rently tolled at approximately 2.2 times automobile
tolls. A one-way charge of $25.34 is equivalent to 2.2 times the MOVE NY suggested two-way charge of $5.76 (see Figure 11). This scenario would raise more than $100 million gross revenue, depending on the hours of operation.
In addition to consideration of the pricing schedule shown below, the Panel recommends consider-ation of the use of truck zone pricing to encourage shifts in delivery schedules and reductions in con-gestion during the peak periods.
The Panel looks forward to the study of traffic congestion resulting from truck deliveries in Man-hattan below 59th Street undertaken by the NYC Department of Transportation due later this year. In the meantime, the Panel encourages the Governor and Mayor to undertake a comprehensive review of options to incentivize companies to receive de-liveries during the overnight periods. Any review, however, must also focus on ensuring that resi-dents within the CBD continue to receive essential and urgent deliveries without any delay related to road pricing.
FIGURE 11. ESTIMATED TRUCK ZONE ENTRY PRICE GROSS REVENUE (ASSUMES ONCE PER DAY) (IN $MILLIONS)
Mon–Fri
6am–8pm
Mon–Fri 6am–8pm
Sat and Sun 12pm–10pm
All days 24hrs/day
$25.34 fee $105 $120 $180
*Chart above presumes MOVE NY’s two-way automobile E-ZPass toll rate of $11.52

Fix NYC Advisory Panel Report — January 2018
22
9. Implement Zone Pricing for All Vehicles Entering the CBDAfter an appropriate period of truck-only zone pric-ing, during which the system is deemed to be func-tioning properly and smoothly, zone pricing should be extended to all vehicles. This should coincide with the re-opening of the L Train connecting Man-hattan with Brooklyn.
By then, the infrastructure and back office opera-tions of the zone pricing program will have been operational for several months, ensuring a smooth transition to an all-vehicles policy. The revenues collected from the zone pricing program shall flow to the MTA and will provide funding for both the on-going transit improvements supporting diver-sion and continued rehabilitation and restoration of the subway system for future generations.
Proposed Zone Pricing Program
To bring about a meaningful reduction in traffic congestion within the CBD, the Panel considered a one-way pricing zone E-ZPass charge of $11.52 for passenger vehicles, once per day, Monday through Friday, between the hours of 6am to 8pm. This charge is identical to the two-way charge of $5.76 suggested by MOVE NY, and aligned with average E-ZPass toll rates for automobiles at the MTA and PANYNJ tolled tunnels. In addition to raising reve-nues, the program is designed to incentivize driv-ers to shift to either commuting to work or making deliveries during off-peak hours where possible.
The Panel recommends that all buses, taxis and FHVs be exempt from the zone charge.
It is also recommended that the program exempt drivers using the FDR Drive from the Brooklyn Bridge to 60th Street. An example of this route would be a car entering Manhattan via the Brook-lyn Bridge, immediately accessing the FDR Drive and driving north to a doctor’s office on the Upper East Side.
This scenario is estimated to raise gross revenues of $705 million from autos and $105 million from commercial vehicles for a total of $810 million, not including FHVs. The plan is expected to reduce en-tries into the CBD between 6am and 8pm by an estimated 13 percent. The economic benefit asso-ciated with an increase in average vehicle speeds of 9 percent will help to mitigate the new cost to drivers engendered by this plan (see Figure 12).
Congestion in the CBD, of course, is not limited to weekdays alone. The Panel recommends explo-ration of expanding the period during which the drivers face a zone charge if congestion reduction targets are not being met. This could include the
weekend hours between 11am and 9pm, consis-tent with Port Authority’s weekend peak toll rates at the Holland and Lincoln Tunnels. Due to week-end mass transit service plans offering slightly less frequent services relative to weekday options, the Panel suggests a lower charge for weekend travel-ers. Expanding to weekends raises gross revenues collected from autos and trucks to $1.025 billion.
Another option for consideration is a variable pric-ing schedule. Under such a scenario, higher rates are charged during peak traffic periods and lower rates are charged outside of this peak period. Un-der this scenario, the zone fee is in effect 365 days a year, 24 hours a day. An analysis of traffic data in-dicates that the volume of cars entering the CBD is greatest between 6am and 9am on weekdays and 12pm to 10pm on weekends. This scenario raises gross revenues of $1.1 billion from autos and trucks, not including revenues from FHVs (see Figure 13).
Moreover, those who choose to highlight these proposals as regressive also choose to ignore the facts. Census data indicate that only four percent of outer borough working residents commute to jobs in Manhattan in a vehicle, or approximately 118,000 residents. Of those 118,000, more than half are higher income individuals, more than a quarter are moderate income individuals and less than 5,000 of them qualify as working poor. Compare those numbers to the 2.2 million New York City residents, including 190,000 of the working poor, who rely on mass transit to get to work day in and day out, and who would benefit from transit improvements paid for by the zone pricing plan.34 Consideration should be given to a tax benefit for these lower income commuters most impacted by the pricing zone who have no choice but to commute in vehicles.

23
Fix NYC Advisory Panel Report — January 2018
Weekday Zone Fees
12 1
$12
$10
$8
$6
$4
$2
2 3 4 5AM PM
6 7 8 9 10 11 12 1 2 3 4 5 6 7 8 9 10 11
11pm-5am
5am-6am
$5.50
$8.50
9am-11pm$8.50
6am-9am$11.50
Weekend Zone Fees
12 1
$12
$10
$8
$6
$4
$2
2 3 4 5AM PM
6 7 8 9 10 11 12 1 2 3 4 5 6 7 8 9 10 11
10pm-12pm$5.50
12pm-10pm$8.50
FIGURE 13. Variable Zone Pricing Rate Tables
FIGURE 12. ESTIMATED ZONE FEE GROSS REVENUE (ASSUMES ONCE PER DAY) (IN $MILLIONS)
Below 60th Street
Mon–Fri 6am–8pm
Mon–Fri 6am–8pm
Sat and Sun 12pm–10pm
Variable Pricing – See Rate Tables Below
Mon–Sun 24-hours per Day
Revenue: Autos ($11.52 fee) $705 $905 $970
Revenue: Trucks ($25.34 fee) $105 $120 $130
Total: Autos/Trucks $810 $1,025 $1,100
Congestion Reduction (Reduction in CBD entries during specified charging periods)
13% 14% 8%
Average CBD Speed Increase 9% 9% 8%
Congestion reduction and average speed increase estimates are based on a flat $2 pickup charge on CBD originating taxi and FHV trips.
Chart above presumes MOVE NY’s two-way automobile E-ZPass toll rate of $11.52 unless otherwise specified
Fix NYC Advisory Panel Report — January 2018
24
Performance Measures
A successful congestion reduction program will require attention well beyond enactment of a bud-get agreement. Fair and frequent review of the program, and the opportunity to make modifica-tions when necessary, are critical to earning and maintaining public support. This evaluation must pay particular attention to determining whether the program is having disproportionate impact on any particular set of individuals.
To this end, the panel suggests consideration of performance measures utilized by the U.S. Depart-ment of Transportation, and endorsed by the U.S. Government Accountability Office, to monitor and evaluate similar projects.35 These metrics provide an approach for ensuring that the established poli-cies are successful in achieving their goals:
1) Availability of funds for transportation pro-grams: The implemented program must raise sufficient funding to produce measurable and perceptible improvements in the NYC transit system.
2) Driver behavior, traffic volumes, and travel speeds: Similarly, a zone pricing program must produce measurable and perceptible declines in traffic volume and improvements in CBD travel speeds.
3) Transit ridership: If disincentives for driving into the CBD are appropriately presented with significant transit improvements, daily trips on public transportation should rise as a result.
4) Air quality: Reduced traffic congestion should improve the NYC air quality and have positive impacts on public health.
5) Equity for low-income individuals: Congestion reduction should have a positive impact on the City’s economy and all of its residents. If the impact of zone pricing is shown to be overly burden-some on any subgroup, the program must be reformed and amelioration should be considered.
Fortunately, certain data on vehicle movements and vehicular speeds in the CBD are already col-lected on a routine basis and can be used to de-termine the impacts of the zone pricing charges. These include:
• Vehicle-miles traveled for each trip within the CBD, collected by TLC;
• Volume of vehicles entering the CBD annually, collected by NYMTC; and
• Transit ridership and average bus speeds for routes within the CBD, collected by the MTA.
The Panel recommends twice yearly evaluation of these metrics, as well as data from newly required GPS technologies implemented in Phase 2. These should be published in public reports that assess the efficacy of the zone pricing program. If the stated goals are not met, the MTA should recom-mend to the Governor a set of policy adjustments designed to improve the program.

25
Fix NYC Advisory Panel Report — January 2018
Conclusions
Zone pricing very effectively reduced congestion in London, Stock-holm and Singapore. It also increased average speeds, spurred in-creased mass transit use and improved air quality in each city. The level of congestion within Manhattan’s CBD requires action, and it is time to move forward on the concept which has been studied and debated in NYC for over a decade. To remain a world-class city and region, New York must address the increasing congestion on our roadways and bring the subway system back to a reliable state. The Fix NYC Panel’s proposed strategies in this report are the first step toward tackling congestion and providing a dedicated funding stream for the region’s future transportation needs. The strategies presented in the report are proposed for implementation in a phased manner that will require political will and transparency about the goals of the program.
Implementing new fees and surcharges should always be viewed as a last resort, but the dire state of the NYC subway system demands action. Environmental author David Owen describes NYC as having the smallest carbon footprint of any city in the United States and one of the smallest in the world.36 The NYC subway system is critical to making that possible. The Fix NYC Panel’s recommendations help to put the MTA’s plan to fix that system on an affordable path.
Though millions of New Yorkers will benefit from transit improve-ments paid for by the zone pricing plan, the State should consider ways to ease the burden on those outer borough commuters who must drive to work in Manhattan’s CBD.
The recommendations contained herein are informed by internation-al examples of success and lessons learned in cities that have adopt-ed zone pricing as a means to reduce traffic in their business districts and generate revenues. The Panel encourages our City, State and regional leaders to carefully review these recommendations and work together in the coming months to improve NYC’s transit system – sustaining the region’s economic competitiveness, enhancing the quality of life for all New Yorkers, and retaining NYC’s place as the greatest city in the world.

Fix NYC Advisory Panel Report — January 2018
26
27
Fix NYC Advisory Panel Report — January 2018
Appendix A

Fix NYC Advisory Panel Report — January 2018
28 Appendix A
Previous NYC Congestion Pricing Proposals
Proposals for the implementation of congestion pricing in NYC have been in existence for more than a decade (see Figure 14). The first formal pro-posal was unveiled in 2006 by the Citizens Budget Commission.37 That was followed in 2007 by for-mer Mayor Michael Bloomberg’s PlaNYC propos-al.38 During Governor David A. Paterson’s adminis-tration in 2008, another proposal was advanced by then Lieutenant Governor Richard Ravitch.39 While each concept had certain unique features, all three of these plans represented variations on the same theme: the implementation of cordon around the CBD, with charges for crossing into the CBD rang-ing up to $10. Another common feature of the three plans was the dedication of the revenues collected from congestion charging toward transportation improvements.
More recently, a proposal issued by Sam Schwartz and carried forward under the name ‘MoveNY’ in 2015 includes tolls on the currently untolled East River bridges and a cordon charge at 60th Street to be applied in both directions at a charge of $5.76 each way (for a total trip charge of $11.52).40 Essentially, this plan eliminates the common prac-tice of “bridge shopping” where car and truck drivers weave their way around the City to utilize the cheapest crossing into the CBD. MoveNY’s proposal equalizes the total fee paid by drivers to enter and exit the CBD at about $11.50 no matter which crossing is chosen. The Schwartz plan also charges FHV trips in the CBD below 96th Street based on time and distance traveled, and reduces tolls on MTA bridges located outside of the CBD. Like other previous plans, MoveNY dedicates most of the revenue collected net of toll reductions to-ward transportation improvements, including MTA system upgrades and certain road and bridge re-pairs. The MoveNY plan estimates congestion re-duction to be 20 percent upon full implementation.

29
Fix NYC Advisory Panel Report — January 2018
Appendix A
FIGURE 14. PREVIOUS NYC CONGESTION PRICING PROPOSALS
Features Citizens Budget Com-mission (2006 & 2015)
Mayor Bloomberg’s plaNYC (2007)
Commission on MTA Financing (2008) MoveNY (2017)
Cordon Fee• Amount• Hours• Boundary• Direction
Yes (2006)• $4/night, $7/day,
$10/peak• 24/7• 60th Street• In
Yes• $8/cars; $21/trucks• 6am – 6pm, M-F• 86th Street
(60th Street)• In, Intra-Zone
No
Yes• $5.76 each way ($11.52)/
cars, higher/trucks• 24/7• 60th Street for Cordon• In, Out
Toll Offsets • N/A• Deduct tolls paid
by E-ZPass for NYC bridges and tunnels
• N/A
• $5 decrease in tolls for MTA major bridges, $2 decrease for MTA minor bridges
Exemptions • N/A
• Emergency, transit, medallion taxis, handicapped plates, neighborhood car services
• N/A
• No double tolling (East River MTA crossings and Lincoln and Holland Tunnels)
• Taxis and FHVs exempt from cordon
Taxis and TNCs • N/A • N/A • N/A• 35% surcharge plus $0.50
drop charge south of 96th Street/trip
Other fees/taxes
• Increase motor vehicle fees or fuel taxes
• Vehicle-Miles Traveled tax of $2.80/cars & $7.63/trucks (2015)
• N/A • 0.33% Regional Mobility Tax
• Elimination of reduction for parking garage sales tax (Manhattan)
Other revenues • Increase MTA tolls 25% - 50% • N/A
• Regular increase in MTA fares & tolls (bi-annual, Regional CPI)
• N/A
Other tolling• MTA to toll East River
Bridges at cordon rates in each direction
• N/A
• MTA to toll Harlem River and East River bridges at same rates as subway fares
• Toll East River Bridges $5.76 each way ($11.52)

Fix NYC Advisory Panel Report — January 2018
30 Appendix A

31
Fix NYC Advisory Panel Report — January 2018
Appendix B
Appendix B

Fix NYC Advisory Panel Report — January 2018
32 Appendix B
Zone Pricing Tolling Analysis Methodologies
The traffic and revenue estimates of various toll-ing strategies were performed using the Balanced Transportation Analyzer, or BTA. This spreadsheet model, developed by Charles Komanoff, provides a framework for assessing the extent to which zone pricing can both generate revenue and improve traffic conditions in the Central Business District (CBD). The BTA was chosen as the tool for this study because it offers four key advantages in sup-porting the zone pricing analysis:
• As a spreadsheet model, it can rapidly evaluate and compare multiple tolling strategies.
• The model draws from a broad array of well-documented sources of traffic and transportation data.
• It is transparent. The underlying data is clearly identified and the assumptions governing the use of this data are highlighted.
• It yields the outputs that are most relevant to our analysis—namely, increase in revenue, improvement in average vehicular speed, and reduction in congestion.
• The version of the BTA used to generate the results contained in this report includes:
• Updated taxi and FHV data to include 2017 conditions.
• Updated data on through traffic (i.e. traffic passing through the CBD without making an intermediate stop).
• A revised volume of truck traffic.
• The most recent Hub-bound traffic volumes available from NYMTC (2016).
• Updated time- and price-elasticities based on the latest available research.
The team’s efforts were focused on validating and running pricing scenarios using the latest version of the BTA which entailed the following tasks:
• The team reviewed the functionality of the BTA, including a review of the model’s structure, its key formulas, and the relationships among the various tabs that comprise the model. Though HNTB had performed a similar review in 2015, the model had evolved in the interim. It was essential to understand how the model had changed.
• Reviewed the key assumptions made by the BTA, the input data used, and the limitations of the model. This was especially critical given the exponential growth in app-based transportation services, accompanied by a gradual decline in the use of yellow cabs.
• Identified and updated data sources to latest available data. This involved a detailed scrub of taxi and for-hire vehicle (FHV) data captured by the Taxi and Limousine Commission (TLC).
• Identified preliminary pricing scenarios.
• Modified the model as needed to accommodate unique characteristics of the various pricing scenarios.
• Ran initial model validation scenarios to develop baseline test cases and to test sensitivities of key variables.
• Interacted with the developer (Charles Komanoff) to provide feedback on functionality, to identify potential modifications to the model, and to update data sources as required.
• Ran zone-based and surcharge based pricing scenarios varying truck volumes, time-based elasticities and cost-based elasticities.
• Evaluated results, which included gross revenue estimation, reduction in vehicular congestion, and increases in average vehicle speed.
33
Fix NYC Advisory Panel Report — January 2018
Appendix B
A critical component of the analysis was to under-stand and validate the BTA’s handling of trip elas-ticities. The model uses various elasticity values to help estimate the following:
• First, the “price-elasticity” values measure how vehicles respond to the imposition of new tolls. When drivers are faced with an additional charge, they may choose to either (a) not make the trip at all, (b) change modes (if that is an option), or (c) change their time of travel (if they have the flexibility to do so).
• Second, the “time-elasticity” values measure how vehicles respond to a change in travel time. As drivers are “tolled off” the roadway network, the vehicles that remain experience faster travel times. This improvement in performance will entice some vehicles to re-enter the network.
The BTA captures the current volume of vehicles that enter the CBD in Manhattan, the current toll and taxi and FHV fare structures as the baseline scenario. The team then input various zone pric-ing scenarios that represent new fees to enter the CBD, including new toll rates and taxi and FHV fare structures. Using the price and time elasticities, the BTA estimates how drivers will respond to these changes and generates post zone charging vehicle volumes. These volumes are then used to generate estimates of revenue for each scenario. Using the new vehicular volumes, the BTA can also estimate the reduction in vehicle miles traveled (VMT) and the associated increases in average speeds.
Because the model’s results are strongly relat-ed to the assumed values for price-elasticity and time-elasticity the team considered a range of elas-ticity values to evaluate the sensitivity of the key outputs to these assumed values. The team also studied available elasticity data from the MTA and the PANYNJ from previous reports and studies.
The end result of the analysis was an updated and reliable BTA model that could readily generate re-sults tailored to a diverse array of pricing scenarios.
Fix NYC Advisory Panel Report — January 2018
34
Endnotes1 “Inrix 2016 Global Traffic Scorecard,” Inrix, Inc., February 16 2017.
2 The Partnership for New York City, “$100 Billion Cost of Traffic Congestion in Metro New York”, January 2018.
3 Schaller, Bruce. “Empty Seats, Full Streets. Fixing Manhattan’s Traffic Problem,” Schaller Con-sulting, December 2017.
4 Trottenberg, Commissioner Polly. “Mayor de Blasio Announces Initiatives to Help Ease Conges-tion.” October 22, 2017. Transcript.
5 http://www.nyc.gov/html/dot/downloads/pdf/list-of-plazas.pdf
6 http://www.nyc.gov/html/brt/downloads/pdf/bus_lanes_map.pdf
7 http://www.nyc.gov/html/dot/downloads/pdf/bike-safety-study-fullreport2017.pdf
8 Hu, Winnie, “New York’s Sidewalks Are So Packed, Pedestrians are Taking to the Streets”, NY Times, June 30, 2016.
9 Stringer, Scott M., “The Other Transit Crisis: How to Improve the NYC Bus System”, New York City Comptroller, November 2017.
10 “Average Weekday Ridership.” MTA New York City Transit and MTA Bus Company.
11 New York Metropolitan Transportation Council, “Regional Freight Plan Update,” February 2014.
12 Schaller, Bruce. “Empty Seats, Full Streets. Fixing Manhattan’s Traffic Problem,” Schaller Con-sulting, December 2017.
13 Schaller, Bruce. “Empty Seats, Full Streets. Fixing Manhattan’s Traffic Problem,” Schaller Con-sulting, December 2017.
14 NYS Laws of 1953, Chapter 200, Chapter 201, Chapter 880, and Chapter 881.
15 NYS Public Authorities Law 1203 (1) (b).
16 Chapter 314 of the Laws of 1981.
17 Lhota, Joseph. “Chairman’s Report,” New York Metropolitan Transportation Authority Board Meeting, December 2017.
18 US Department of Transportation, Federal Highway Administration, “Lessons Learned from International Experience in Congestion Pricing,” August 2008.
19 Ibid.
20 BBC News, “Congestion charge leads to budget shortfall,” June 12, 2003.
21 Carlos Daganzo and Lewis Lehe, “Zone Pricing in Theory and Practice: Final Report,” University of California Center for Economic Competitiveness in Transportation, April 12, 2016.
22 US Department of Transportation, Federal Highway Administration, “Lessons Learned from International Experience in Congestion Pricing,” August 2008.
23 US Department of Transportation, Federal Highway Administration, “Lessons Learned from International Experience in Congestion Pricing,” August 2008.
24 Daganzo and Lehe, op. cit.
25 Ibid.
26 New York City Police Department; Traffic Data Archive - Moving Violations Report, Citywide December 2016.
27 Taylor, Kate, “The New Math of Parking Placards”, NY Times, May 26, 2017.
28 Manhattan Community Board 4. “Bus Congestion on the West Side of Manhattan,” Report, June 2014.
29 Plangianos, Irene, “City Council Aims to Limit Number of Tour Buses in the City”, dnainfo, Octo-ber 19, 2015.
30 Pinto, Nick, “NYC Has a Tour Bus Problem”, The Village Voice, October 11, 2016.
31 Schaller, Bruce. “Empty Seats, Full Streets. Fixing Manhattan’s Traffic Problem,” Schaller Con-sulting, December 2017.
32 Schaller, Bruce. “Empty Seats, Full Streets. Fixing Manhattan’s Traffic Problem,” Schaller Con-sulting, December 2017.
33 Schaller, Bruce. “Empty Seats, Full Streets. Fixing Manhattan’s Traffic Problem,” Schaller Con-sulting, December 2017.
34 Community Service Society of New York, “Congestion Pricing – CSS Analysis,” October 24, 2017.

35
Fix NYC Advisory Panel Report — January 2018
35 United States Government Accountability Office, “Traffic Congestion, Road Pricing Can Help Reduce Congestion, but Equity Concerns May Grow,” January 2012, p. 14.
36 David Owen, “Green Manhattan: Everywhere should be more like New York,” The New Yorker, October 18, 2004, p. 111.
37 Citizen’s Budget Commission, “Danger Ahead! How to Balance the MTA’s Budget,” June 2006.
38 City of New York, “plaNYC,” May 2007.
39 Commission on Metropolitan Transportation Authority Financing, “Report to Governor David A. Paterson,” December 2008.
40 Schwartz, Sam. “Move NY Fair Plan: Overview,” 2017.