Embed Size (px)
Citation preview
Five-Year Effectiveness of theMultidisciplinary Risk Assessmentand Management Programme–Diabetes Mellitus (RAMP-DM) onDiabetes-Related Complicationsand Health Service UsesdAPopulation-Based and Propensity-Matched Cohort StudyDiabetes Care 2018;41:49–59 | https://doi.org/10.2337/dc17-0426
OBJECTIVE
To evaluate the 5-year effectiveness of a multidisciplinary Risk Assessment andManagement Programme–Diabetes Mellitus (RAMP-DM) in primary care patientswith type 2 diabetes.
RESEARCH DESIGN AND METHODS
A 5-year prospective cohort study was conductedwith 121,584 Chinese primary carepatients with type 2 DM who were recruited between August 2009 and June 2011.Missing data were dealt with multiple imputations. After excluding patients withprior diabetes mellitus (DM)-related complications and one-to-one propensity scorematching on all patient characteristics, 26,718 RAMP-DM participants and 26,718matched usual care patients were followed up for a median time of 4.5 years. Theeffect of RAMP-DM on nine DM-related complications and all-cause mortality wereevaluated using Cox regressions. The first incidence for each event was used for allmodels. Health service use was analyzed using negative binomial regressions. Sub-group analyses on different patient characteristics were performed.
RESULTS
The cumulative incidence of all events (DM-related complications and all-causemor-tality) was 23.2% in the RAMP-DM group and 43.6% in the usual care group.RAMP-DM led to significantly greater reductions in cardiovascular disease (CVD) riskby 56.6% (95%CI 54.5, 58.6),microvascular complications by 11.9% (95% CI 7.0, 16.6),mortality by 66.1% (95% CI 64.3, 67.9), specialist attendance by 35.0% (95% CI 33.6,36.4), emergency attendance by 41.2% (95% CI 39.8, 42.5), and hospitalizations by58.5% (95% CI 57.2, 59.7). Patients with low baseline CVD risks benefitted the mostfromRAMP-DM,which decreasedCVDandmortality risk by 60.4% (95%CI 51.8, 67.5)and 83.6% (95% CI 79.3, 87.0), respectively.
CONCLUSIONS
This naturalistic study highlighted the importance of early optimal DM control andrisk factor management by risk stratification and multidisciplinary, protocol-driven,chronic disease model care to delay disease progression and prevent complications.
1Department of Family Medicine and PrimaryCare, Ap Lei Chau Clinic, Ap Lei Chau, The Univer-sity of Hong Kong, Hong Kong, People’s Republicof China2School of Nursing, The University of Hong Kong,Hong Kong, People’s Republic of China3Primary and Community Services Department,Hospital Authority Head Office, Hong Kong Hos-pital Authority, Hong Kong, People’s Republic ofChina
Corresponding author: Esther Yee Tak Yu, [email protected].
Received 1 March 2017 and accepted 23 Sep-tember 2017.
This article contains Supplementary Data onlineat http://care.diabetesjournals.org/lookup/suppl/doi:10.2337/dc17-0426/-/DC1.
© 2017 by the American Diabetes Association.Readers may use this article as long as the workis properly cited, the use is educational and notfor profit, and thework is notaltered.More infor-mation is available at http://www.diabetesjournals.org/content/license.
Eric Yuk Fai Wan,1
Colman Siu Cheung Fung,1
Fang Fang Jiao,1 Esther Yee Tak Yu,1
Weng Yee Chin,1 Daniel Yee Tak Fong,2
Carlos King Ho Wong,1
Anca Ka Chun Chan,1
Karina Hiu Yen Chan,1
Ruby Lai Ping Kwok,3 and
Cindy Lo Kuen Lam1
Diabetes Care Volume 41, January 2018 49
EPIDEM
IOLO
GY/H
EALTH
SERVICES
RESEA
RCH
With population aging and increasingprevalence of obesity, the number of pa-tients with diabetes mellitus (DM) andglobal health expenditure related to DMare forecast to growsubstantially, totalingan estimated U.S. $642 million and U.S.$802 billion, respectively, by 2040 (1). In-creasing demand for health care servicescoupled with limitations in resourceshave led to several international guide-lines, including those by the American Di-abetes Association and the NationalInstitute for Health and Care Excellence,recommending regular risk assessmentand multidisciplinary management (1–3).A chronic disease service delivery modelthat incorporates risk-stratified care plan-ning, a multidisciplinary team of healthprofessionals to provide ongoing treat-ments, patient education, and scheduledhealth assessments for monitoring of dis-ease control and complications has beenpromoted globally as a more holistic andcost-effective way to manage patientswith diabetes (4–8).Several studies (9–21) have demon-
strated that treatments targeting bloodglucose, blood pressure (BP), and choles-terol control improve surrogate out-comes and delay macrovascular and/ormicrovascular complications. However,only two randomized controlled trials (RCTs)and one observational study have exam-ined the impact of implementing a chronicdisease service delivery model using multi-disciplinarymanagement and risk-stratifiedprotocol-based treatments. These studieshave found that the chronic disease modelof care is associated with reductions inhemoglobinA1c (HbA1c), BP, and predicted10-year cardiovascular disease (CVD) risks(14–16), but their results havebeenbasedon surrogate CVD markers rather thanactual clinical events such as CVD andmor-tality and are not conclusive about theeffectiveness in preventing DM-relatedcomplications. One RCT with a short6-month follow-up period conductedin the U.S. demonstrated the effective-ness of multidisciplinary managementon health service use such as hospitaladmissions (22).To date, most studies examining the ef-
fectiveness of therapeutic interventions fordiabetes have been performed under rela-tively artificial conditions with strict inclu-sion criteria or haveused studypopulationsfrom hospital-based settings. The findingsof such studiesmay not be reflective of theoutcomesof care forpatientswithdiabetes
who are managed in real-world primarycare settings. As the trend for themanage-ment of type 2 DM has shifted from hospi-tals to primary care (23), naturalisticpopulation-based studies evaluating theeffectiveness of chronic disease interven-tions for patientswithdiabetes are neededto confirm the benefits of this model ofcare.
The Risk Assessment andManagementProgramme–Diabetes Mellitus (RAMP-DM) was introduced to complement theusual care into thepublic primary caregen-eral outpatient clinics (GOPCs) of HongKong in 2009 (24). RAMP-DM is basedon a chronic disease model of care anduses risk-stratified care planning, multi-disciplinary care (coordinated by a nursemanager), and scheduled monitoring ofcomplications. Our preliminary analysesfound an improvement in surrogate out-comes and cardiovascular complicationsover 3 years (25,26). This study evaluatedthe long-term effectiveness of the RAMP-DM regarding all DM-related complica-tions and health service uses over 5 yearsto determine the characteristics of patientsreceiving the greatest health benefits fromthe program.
RESEARCH DESIGN AND METHODS
Study DesignThis was a territory-wide prospectivecohort study to compare the risks ofCVD, microvascular complications, andall-cause mortality, and the frequenciesof health service uses over 5 years be-tween RAMP-DM participants and pa-tients receiving usual primary care (i.e.,in GOPCs).
Setting of RAMP-DMThe Hong Kong Hospital Authority (HA),an organization governing all public sec-tor hospitals and primary care clinics inHong Kong, launched RAMP-DM in Au-gust 2009 as a territory-wide program toimprove the quality of care for primarycare patients with DM. The details ofRAMP-DM have been reported in the pre-vious study protocol (24). All patientswith DM attending the HA GOPCs wereeligible to be enrolled into the RAMP-DM.All clinics used the same RAMP-DM pro-tocol. Given that Hong Kong has a sub-stantial subsidized public health caresystem, the HA provides care for at least90% of the patients with diagnosed dia-betes in Hong Kong (27).
All eligible GOPCpatientswere invited toenroll into the RAMP-DM randomly duringtheir regular follow-up consultations withthe GOPC doctor. The workflow of theRAMP-DM is shown in SupplementaryFig. 1. Patients enrolled in the RAMP-DMinitially undergo an intake risk assess-ment, which includes a physical exami-nation, laboratory testing, eye and footassessment, drug adherence and lifestyleassessment, and screening for existing di-abetic complications. The screening resultswere reviewed by trained registerednurses who are engaged as RAMP-DMcare managers, who stratify participantsinto “very high-risk,” “high-risk,” “medium-risk,” or “low-risk” groups according tothe classification rules developed by theJoint Asia Diabetes Evaluation (JADE)study (28). The nurse care manager alsoprovides individualized diabetes educa-tion, lifestyle advice (exercise, diet, smok-ing, and drinking), and an explanation ofthe CVD risk levels. The patient’s diseaseprofile is recordedonan electronic clinicalmanagement system platform, which isused for the sharing of information be-tween the multidisciplinary health careteam, including doctors, nurses, and otherallied health professionals (optometrists,dietitians, podiatrists, and physiothera-pists), and for referrals. Care plans are de-veloped based on individual’s risk factorsaccording to a standardized risk-stratifiedguide.
Patients in the usual care group contin-ued tobemanaged by their GOPCdoctorsbased on theHong Kong reference frame-work for diabetes care in primary care(29) without, however, performance ofany risk assessment and stratification.Carewas coordinatedby theGOPCdoctorwhowould arrange for tests and referralsto allied health as deemed necessary.Routine follow-up visits were scheduledevery 3 months for review by the GOPCdoctor and the dispensing ofmedications.Usual care patients had access to thesame drug formulary and could stillbe referred for physical examination, lab-oratory testing, and various allied healthservices at their doctor’s discretion. Al-though the RAMP-DM is a territory-wideprogram intended for all DM patientsmanaged in the GOPC, the rollout of theprogram could only be performed instages because of the enormous numberof patients with diabetes being managedand limitations of resources and man-power. This saturation of health service
50 Five-Year Effectiveness of RAMP-DM Diabetes Care Volume 41, January 2018
delivery provided a small window of op-portunity to conduct a comparison of theeffect of RAMP-DM and usual care in areal-world primary care setting. Patientselection for earlier enrollment into theRAMP-DM was by random allocation.
SubjectsSubject inclusion criteriawere as follows: 1)age at least 18 years, 2) clinical diagnosisof type 2 DM (identified by the Interna-tional Classification of Primary Care-2[ICPC-2] code “T90” before the baselinedate), and 3) no prior CVD or microvascu-lar complications. Clinical datawereextract-ed from the clinical management system ofthe HA. The RAMP-DM group was com-posed of subjects with DM who wereenrolled into the RAMP-DM between1 August 2009 and 30 June 2011 with thecorresponding baseline date defined as thefirst date of the nurse intake assessment.The usual care group included GOPC
patients with DM who had not yet beenenrolled into the RAMP-DM by 30 Novem-ber 2015 and had at least one GOPC at-tendance between 1 August 2009 and30 June 2011. The corresponding baselinedate for theusual care cohortwas definedas the first attendance date of GOPCwithin the period. For each clinical out-come, each patient was observed fromtheir baseline date to the date of inci-denceof anoutcomeevent, all-causemor-tality, or last follow-up as censoring until30 November 2015, whichever came first.
Propensity Score MatchingTo reduce the selection bias, all RAMP-DM participants and usual care patientswere well matched using a propensityscore-matching technique. Propensityscore matching aims to create similarcomparison groups by using a logistic re-gression model that summarizes all rele-vant baseline covariates for each patientand generates an index score (known asthe propensity score) and then matchesthe two groups by that score (30–32). Apropensity score is the conditional prob-ability of participating in the programgiven the observed covariates (33). Forevery patientwithDM, a propensity scorewas generated using all baseline covari-ates (including sociodemographic data,laboratory results, and clinical charac-teristics) modeled as independent vari-ables and the RAMP-DM intervention asthe dependent variable. The propensityscoremapping was performed using the
psmatch2 command with one-to-onematching without replacement methodand with a caliper measurement of 0.001in Stata (34). Unmatched subjects wereexcluded from the analysis.
Outcome MeasuresThe primary outcome in this study wasthe incidence of all-cause mortality. Mor-tality data were extracted from the HongKong Death Registry, a population-basedofficial government registry covering allregistered deaths for the residents ofHong Kong. Other outcome measures in-cluded the incidences of CVD events (con-sisting of coronary heart disease [CHD],heart failure, or stroke), microvascularcomplications (consisting of retinopathy,nephropathy, neuropathy, end-stage re-nal disease [ESRD], and sight-threateningdiabetic retinopathy [STDR]), and ser-vice use rates. The diagnosis coding sys-tems of ICPC-2 and ICD-9-CM from theclinical management system of the HAwere used to identify events (shown inSupplementary Table 1). Service use dataincluded the number of (overnight) hos-pitalizations, accident and emergency(A&E) attendances, specialist outpatientclinic (SOPC) attendances, and GOPCattendances.
Baseline CovariatesBaseline covariates consisted of a pa-tient’s sociodemographic data, laboratoryresults, and clinical characteristics. Socio-demographic data included sex, age, andsmoking status. Laboratory results in-cluded HbA1c, systolic BP (SBP), diastolicBP (DBP), lipid profile (LDL cholesterol[LDL-C], total cholesterol [TC] to HDLcholesterol [HDL-C] ratio, and triglycer-ide levels), BMI, and estimated glomerularfiltration rate (eGFR). Clinical characteris-tics included self-reported duration ofDM; diagnosed hypertension; usage of in-sulin, oral antidiabetic drugs, antihyper-tension drugs, and lipid-lowering agents;and Charlson index. Hypertensionwas de-fined by the ICPC-2 code “K86” or “K87.”All laboratory assays were performed inlaboratories accredited by the College ofAmerican Pathologists, theHongKongAc-creditation Service, or the National Asso-ciation of Testing Authorities, Australia.
Data AnalysisMissing baseline covariates were handledby multiple imputation (35). This methodcan effectively reduce unnecessary biases
(35,36), raise the power of the analysis,and producemore reliable and applicablemodels within clinical practice (37–39).Each missing value was imputed five timesby the chained equation method. For eachof the five imputed data sets, the sameanalysis was performed and the five setsof results were combined using the rulesof Rubin (40). Multiple imputation wasperformed using the “mi impute” com-mand in Stata.
TheRAMP-DMgroup subjectswerefirstmatchedwith usual care group subjects bypropensity score matching. Descriptivestatistics were displayed for both groupsaftermatching anddifferences in thebase-line characteristics between both groupswere compared using x2 tests for categor-ical variables or independent t tests forcontinuous variables. Differences in clini-cal characteristics between baseline and60-month follow-up were assessed bypaired t tests for each of the RAMP-DMand usual care groups and the difference-in-difference between the two groupswas assessed by independent t tests.
Incidence rates for CVD events, micro-vascular complications, and all-causemortality were estimated by an exact95% CI based on a Poisson distribution(41). The cumulative number of inci-dences and incidence rates of outcomeevents with 95% CIs were reported. Mul-tivariable Cox proportional hazards re-gression models were conducted toestimate the effect of RAMP-DM on theincidences of CVD, microvascular compli-cations, and all-causemortality, which ac-counted for all baseline characteristics ofsubjects. Proportional hazards assump-tion was also checked by examining theplots of the scaled Schoenfeld residualsagainst time for the covariates, and thepresence of multicollinearity was also as-sessed by the variance inflation factor.Analysis of the data showed that allmodels fulfilled the proportional haz-ards assumption and no multicollinear-ity existed.
Frequencies and event rates for serviceuses in both groups were compared, andnegative binomial regressionmodels withthe adjustment of baseline covariateswere used to evaluate the effect ofRAMP-DM on the frequencies of episodeevents as the count outcomes were over-dispersed. A sensitivity analysis was con-ducted using a complete case cohort, inwhich missing values of baseline covari-ates were not imputed.
care.diabetesjournals.org Wan and Associates 51
To explore the benefit of RAMP-DMamong different patient subsets, sub-group analyses were performed on theeffect of RAMP-DM versus usual carefor all outcomes stratified by sex(male, female), age (,65, $65 years),smoking status (smoker, nonsmoker), du-ration of DM (,2, $2 years), eGFR(,60, $60 mL/min/1.73 m2), HbA1c
(,7%,$7%),BMI (,27.5,$27.5kg/m2),BP (,130/80, $130/80 mmHg), LDL-C(,2.6, $2.6 mmol/L), and CVD risk(low, medium, high).All significance tests were two tailed,
and those with a P value,0.05were con-sidered to be statistically significant. Sta-tistical analysis was performed usingStata version 13.0.
Ethics ApprovalEthics approval of this study was grantedby all local institutional review boards.
RESULTS
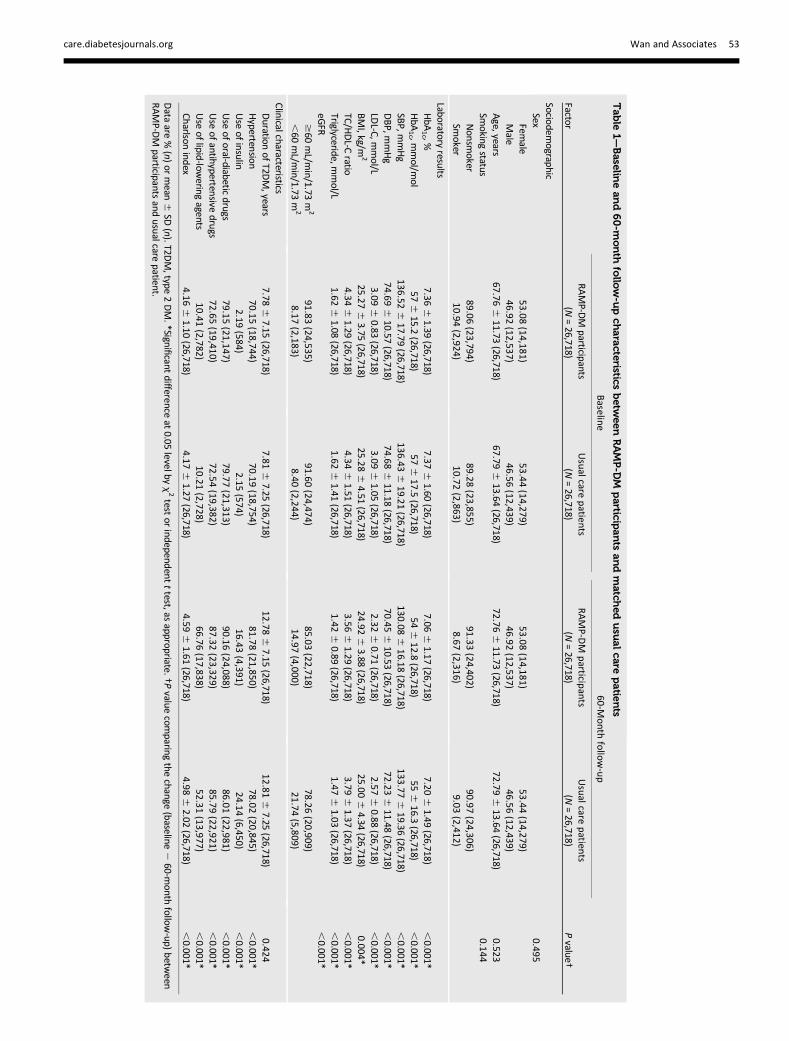
Supplementary Fig. 2 shows the subjectrecruitment flow. In total, 121,584 Chi-nese subjects with DM (RAMP-DM group73,366 subjects; usual care group 48,218subjects) received care for their DM inprimary care clinics of the HA between1 August 2009 and 30 June 2011. Afterexcluding 30,418 patients (RAMP-DMgroup 11,596 patients; usual care group18,822 patients) without fulfilling thesubject inclusion criteria, 91,166 patients(RAMP-DM group 61,770 patients; usualcare group 29,396 patients) remained.Supplementary Table 2 shows the com-pletion rates for all baseline covariates,which ranged from 50.2% to 100%. In to-tal, 26,718 subjects in each group wereincluded for analysis after multiple impu-tation and propensity score matching.Supplementary Table 3 demonstratedthat the completion rates in most labora-tory and clinical assessments were nearly100% in the baseline nurse assessmentamong individuals in the RAMP-DM groupbutwere substantially lower before enroll-ment in the program and in the usual caregroup.Table 1 displays the baseline and
60-month characteristics between theRAMP-DM and usual care groups. As ex-pected, there were no significant differ-ences between the two groups afterpropensity score matching. A total of97.8% and 89.8% of patients, respec-tively, were followed up until 2015 in
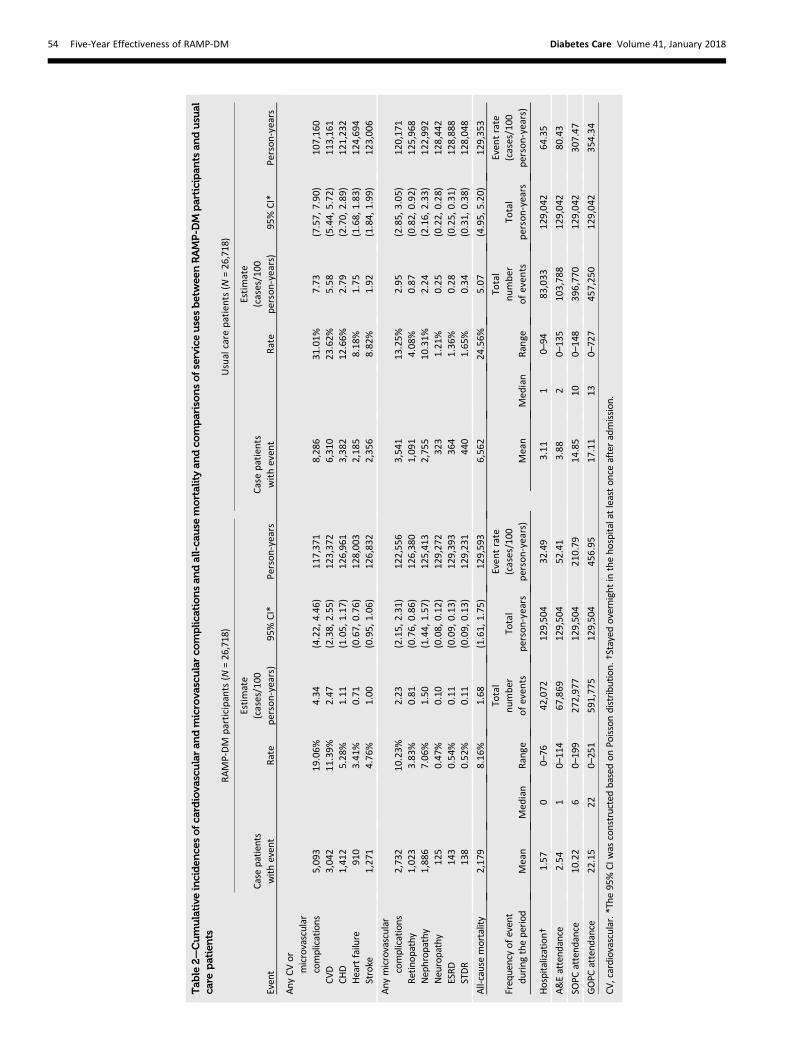
the RAMP-DM and usual care groups.After 60 months, the RAMP-DM groupshowed significant reductions in allclinical parameters, indicating thatthe RAMP-DM group had greater im-provements than the usual care group.Comparedwith usual care subjects, signif-icantlymore RAMP-DMparticipantswerediagnosed with hypertension and usedoral antidiabetic drugs, antihyperten-sive drugs, and lipid-lowering agents.The cumulative incidence of all events(DM-related complications and all-causemortality) was 23.2% in the RAMP-DMgroup and 43.6% in the usual care group.The cumulative incidences of each out-come event and comparisons of serviceuses are shown in Table 2. In general,fewer cases of observed events were ob-served in the RAMP-DM group. For in-stance, there were 4.34 cases of CVD/microvascular complications per 100person-years for RAMP-DM partici-pants, whereas the incident rate ofCVD/microvascular complications inthe usual care group was 7.73 per100 person-years during a median fol-low-up period of 57.5 months. For all-cause mortality, the incident rates were1.68 for RAMP-DM and 5.07 for theusual care groups. Fewer numbers ofhospitalizations, A&E attendances andSOPC attendances were observed in theRAMP-DM group. Conversely, the eventrates of GOPC attendance for the RAMP-DM and usual care groups were 457.0 and354.3, respectively, indicating that theRAMP-DM group experienced more pri-mary care attendances than the usualcare group.
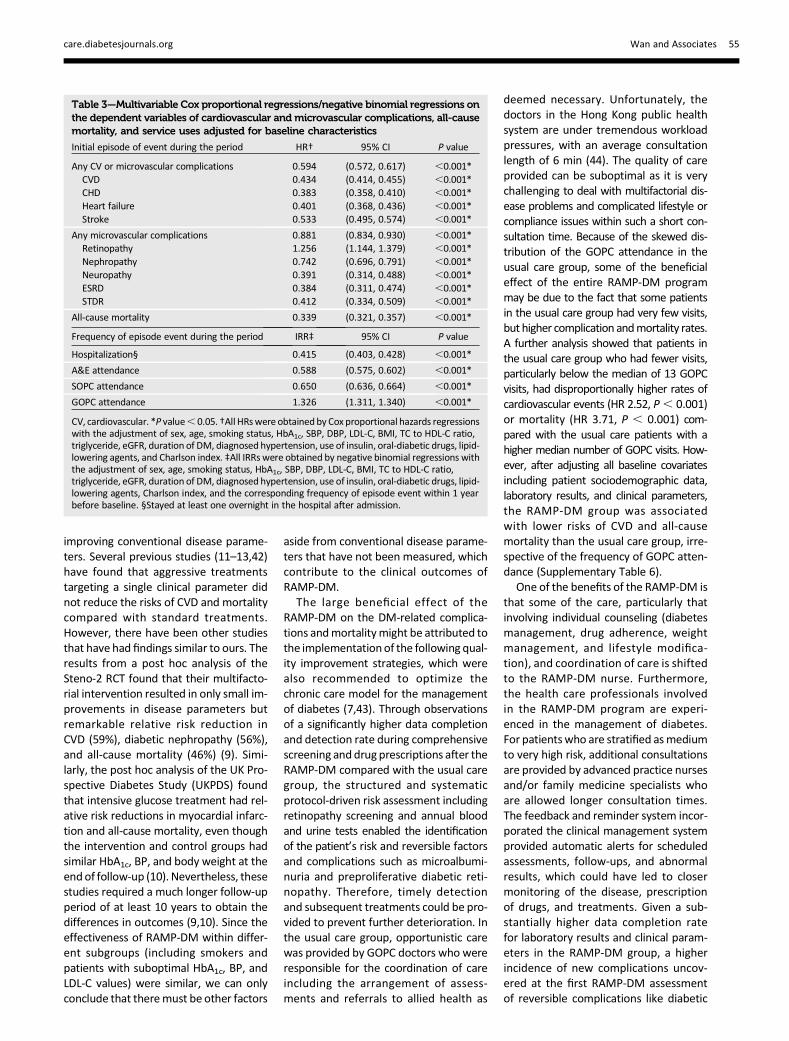
Table 3 shows the adjusted effect ofRAMP-DM on DM-related complicationsand all-cause mortality and the usage fre-quencies of different public health ser-vices. After adjusting for all baselinecovariates, the RAMP-DM group was as-sociated with a 40.6% (hazard ratio [HR]0.594, P, 0.001) and 66.1% (HR = 0.339,P , 0.001) greater reduction in the risksof CVD/microvascular complications andall-cause mortality than the usual caregroup. Significantly lower incidences ofindividual CVD and microvascular compli-cations (HR 0.383–0.742, P , 0.001), ex-cept retinopathy (HR 1.256, P , 0.001),were observed among individuals in theRAMP-DM group. The incidence rate ra-tios (IRRs) for service use using negativebinomial regression models found thatthe RAMP-DM group had significantly
fewer numbers of hospitalizations (IRR0.415, P , 0.001), A&E attendances (IRR0.588, P, 0.001), and SOPC attendances(IRR 0.650, P, 0.001) but a higher num-ber of GOPC attendances (HR 1.326, P,0.001) comparedwith usual care subjects.The results of the sensitivity analysisfound that the complete case cohortwas similar to that of the main analysis(Supplementary Tables 4 and 5).
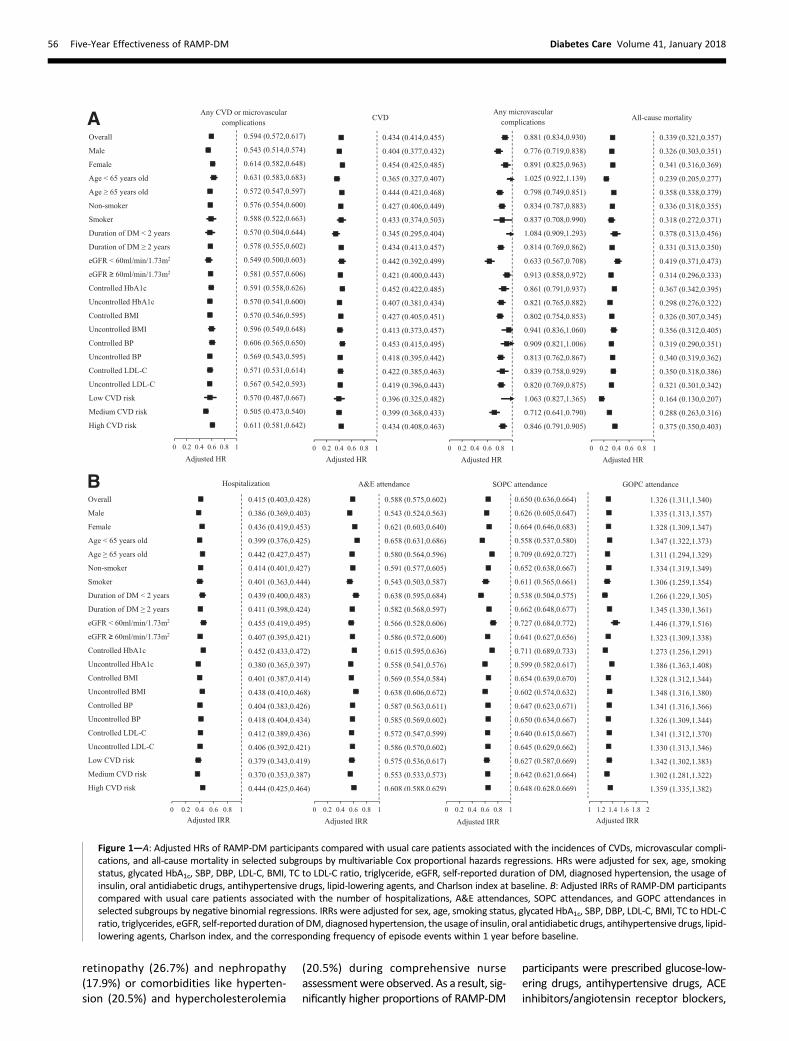
Subgroup analyses were conducted onthe outcomes of CVD,microvascular com-plications, all-causemortality. and serviceuses, as shown in Fig. 1A andB. In general,RAMP-DM participants in all subgroupsobserved a 40% greater risk reduction ineach CVD/microvascular complicationsand a 55–85% risk reduction in all-causemortality over that of usual care subjects.In addition, RAMP-DM participants in allsubgroups had significantly fewer hospi-talizations, A&E attendances, and SOPCattendances but more GOPC attendancesthan usual care patients. Among thesesubgroups, RAMP-DM participants ,65years of age with a DM duration of ,2years or with low/medium CVD risks re-ceived the greatest benefits from theRAMP-DM.
CONCLUSIONS
This was a large population-based studyto investigate the effectiveness of aRAMP involving multidisciplinary interven-tions based on a chronic disease model ofcare for patients with diabetes in a real-world primary care setting. Our findingsdemonstrated that the RAMP-DM led tosignificantly greater reductions in CVD/microvascular complications and secondary/tertiary care service uses compared withusual care. The number needed to treatto prevent one CVD event was 8 and thenumber needed to treat for all-causemortality was 6. Our results also showedthat patients with lower CVD risks re-ceived the greatest benefits from theRAMP-DM.
This study found that a chronic diseasemodel of care was effective in reducingDM-related complications and all-causemortality when compared with usualcare. It was startling to find that the riskreductions in DM-related complicationsand mortality were much higher thanthe observed improvements in the dis-ease parameters including HbA1c, BP,and LDL-C between groups. This dis-crepancy suggests that the benefits ofa RAMP-DM extends beyond simply
52 Five-Year Effectiveness of RAMP-DM Diabetes Care Volume 41, January 2018
Tab
le1—Baselin
ean
d60-m
onth
follo
w-u
pch
aracteristics
betw
eenRAMP-D
Mparticip
ants
andmatch
edusu
alcare
patie
nts
Factor
Baselin
e60-M
onth
follow-up
Pvalue†
RAMP-D
Mparticipants
(N=26,718)
Usualcare
patien
ts(N
=26,718)
RAMP-D
Mparticip
ants
(N=26,718)
Usualcare
patien
ts(N
=26,718)
Sociodem
ographic
Sex0.495
Female
53.08(14,181)
53.44(14,279)
53.08(14,181)
53.44(14,279)
Male
46.92(12,537)
46.56(12,439)
46.92(12,537)
46.56(12,439)
Age,years
67.766
11.73(26,718)
67.796
13.64(26,718)
72.766
11.73(26,718)
72.796
13.64(26,718)
0.523Sm
oking
status0.144
Non
smoker
89.06(23,794)
89.28(23,855)
91.33(24,402)
90.97(24,306)
Smoker
10.94(2,924)
10.72(2,863)
8.67(2,316)
9.03(2,412)
Laboratory
resultsHbA
1c ,%
7.366
1.39(26,718)
7.376
1.60(26,718)
7.066
1.17(26,718)
7.206
1.49(26,718)
,0.001*
HbA
1c ,m
mol/m
ol57
615.2
(26,718)57
617.5
(26,718)54
612.8
(26,718)55
616.3
(26,718),0.001*
SBP,m
mHg
136.526
17.79(26,718)
136.436
19.21(26,718)
130.086
16.18(26,718)
133.776
19.36(26,718)
,0.001*
DBP,m
mHg
74.696
10.57(26,718)
74.686
11.18(26,718)
70.456
10.53(26,718)
72.236
11.48(26,718)
,0.001*
LDL-C,m
mol/L
3.096
0.83(26,718)
3.096
1.05(26,718)
2.326
0.71(26,718)
2.576
0.88(26,718)
,0.001*
BMI,kg/m
225.27
63.75
(26,718)25.28
64.51
(26,718)24.92
63.88
(26,718)25.00
64.34
(26,718)0.004*
TC/HDL-C
ratio4.34
61.29
(26,718)4.34
61.51
(26,718)3.56
61.29
(26,718)3.79
61.37
(26,718),0.001*
Triglyceride,mmol/L
1.626
1.08(26,718)
1.626
1.41(26,718)
1.426
0.89(26,718)
1.476
1.03(26,718)
,0.001*
eGFR
,0.001*
$60
mL/m
in/1.73m
291.83
(24,535)91.60
(24,474)85.03
(22,718)78.26
(20,909),60
mL/m
in/1.73m
28.17
(2,183)8.40
(2,244)14.97
(4,000)21.74
(5,809)
ClinicalcharacteristicsDuration
ofT2D
M,years
7.786
7.15(26,718)
7.816
7.25(26,718)
12.786
7.15(26,718)
12.816
7.25(26,718)
0.424Hyperten
sion
70.15(18,744)
70.19(18,754)
81.78(21,850)
78.02(20,845)
,0.001*
Use
ofinsulin
2.19(584)
2.15(574)
16.43(4,391)
24.14(6,450)
,0.001*
Use
oforal-diabetic
drugs79.15
(21,147)79.77
(21,313)90.16
(24,088)86.01
(22,981),0.001*
Use
ofantihyperten
sivedru
gs72.65
(19,410)72.54
(19,382)87.32
(23,329)85.79
(22,921),0.001*
Use
oflipid
-lowering
agents10.41
(2,782)10.21
(2,728)66.76
(17,838)52.31
(13,977),0.001*
Charlson
index
4.166
1.10(26,718)
4.176
1.27(26,718)
4.596
1.61(26,718)
4.986
2.02(26,718)
,0.001*
Data
are%(n)
ormean
6SD
(n).T2DM,type
2DM.*Significant
differenceat
0.05levelby
x2test
orindepend
entttest,as
appropriate.†P
valuecom
paringthe
change(baseline
260-m
onth
follow-up)
betw
eenRAMP-D
Mparticipants
andusu
alcarepatient.
care.diabetesjournals.org Wan and Associates 53
Tab
le2—
Cumulative
inciden
cesofca
rdiova
scularan
dmicro
vascularco
mplic
ationsan
dall-ca
use
mortalityan
dco
mparisonsofserviceusesbetwee
nRAMP-D
Mparticipan
tsan
dusu
alca
repatients
Event
RAMP-DM
participan
ts(N
=26,718)
Usualcare
patients
(N=26,718)
Casepatients
withevent
Rate
Estimate
(cases/100
person-years)
95%CI*
Person-years
Casepatients
witheven
tRate
Estimate
(cases/100
person-years)
95%CI*
Person-years
Any
CVor
microvascular
complications
5,09
319
.06%
4.34
(4.22,
4.46
)11
7,371
8,28
631
.01%
7.73
(7.57,
7.90)
107,160
CVD
3,04
211
.39%
2.47
(2.38,
2.55
)12
3,372
6,31
023
.62%
5.58
(5.44,
5.72)
113,161
CHD
1,41
25.28%
1.11
(1.05,
1.17
)12
6,961
3,38
212
.66%
2.79
(2.70,
2.89)
121,232
Heartfailure
910
3.41%
0.71
(0.67,
0.76
)12
8,003
2,18
58.18
%1.75
(1.68,
1.83)
124,694
Stroke
1,27
14.76%
1.00
(0.95,
1.06
)12
6,832
2,35
68.82
%1.92
(1.84,
1.99)
123,006
Any
microvascular
complications
2,73
210
.23%
2.23
(2.15,
2.31
)12
2,556
3,54
113
.25%
2.95
(2.85,
3.05)
120,171
Retinop
athy
1,02
33.83%
0.81
(0.76,
0.86
)12
6,380
1,09
14.08
%0.87
(0.82,
0.92)
125,968
Nephrop
athy
1,88
67.06%
1.50
(1.44,
1.57
)12
5,413
2,75
510
.31%
2.24
(2.16,
2.33)
122,992
Neuropathy
125
0.47%
0.10
(0.08,
0.12
)12
9,272
323
1.21
%0.25
(0.22,
0.28)
128,442
ESRD
143
0.54%
0.11
(0.09,
0.13
)12
9,393
364
1.36
%0.28
(0.25,
0.31)
128,888
STDR
138
0.52%
0.11
(0.09,
0.13
)12
9,231
440
1.65
%0.34
(0.31,
0.38)
128,048
All-causemortality
2,17
98.16%
1.68
(1.61,
1.75
)12
9,593
6,56
224
.56%
5.07
(4.95,
5.20)
129,353
Frequencyof
event
during
theperiod
Mean
Med
ian
Range
Total
number
ofeven
tsTotal
person-years
Even
trate
(cases/100
person-years)
Mean
Med
ian
Ran
ge
Total
number
ofeven
tsTotal
person-years
Even
trate
(cases/100
person-years)
Hospitalization†
1.57
00–76
42,072
129,504
32.49
3.11
10–94
83,033
129,042
64.35
A&Eattend
ance
2.54
10–114
67,869
129,504
52.41
3.88
20–135
103,788
129,042
80.43
SOPC
attend
ance
10.22
60–199
272,97
712
9,504
210.79
14.85
100–148
396,770
129,042
307.47
GOPC
attend
ance
22.15
220–251
591,77
512
9,504
456.95
17.11
130–727
457,250
129,042
354.34
CV,cardiovascular.*The
95%CIw
asconstructedbasedon
Poissondistribu
tion
.†Stayed
overnightintheho
spitalat
leaston
ceafteradmission
.
54 Five-Year Effectiveness of RAMP-DM Diabetes Care Volume 41, January 2018
improving conventional disease parame-ters. Several previous studies (11–13,42)have found that aggressive treatmentstargeting a single clinical parameter didnot reduce the risks of CVD and mortalitycompared with standard treatments.However, there have been other studiesthat have had findings similar to ours. Theresults from a post hoc analysis of theSteno-2 RCT found that their multifacto-rial intervention resulted in only small im-provements in disease parameters butremarkable relative risk reduction inCVD (59%), diabetic nephropathy (56%),and all-cause mortality (46%) (9). Simi-larly, the post hoc analysis of the UK Pro-spective Diabetes Study (UKPDS) foundthat intensive glucose treatment had rel-ative risk reductions in myocardial infarc-tion and all-cause mortality, even thoughthe intervention and control groups hadsimilar HbA1c, BP, and body weight at theendof follow-up (10). Nevertheless, thesestudies required a much longer follow-upperiod of at least 10 years to obtain thedifferences in outcomes (9,10). Since theeffectiveness of RAMP-DM within differ-ent subgroups (including smokers andpatients with suboptimal HbA1c, BP, andLDL-C values) were similar, we can onlyconclude that theremust be other factors
aside from conventional disease parame-ters that have not been measured, whichcontribute to the clinical outcomes ofRAMP-DM.
The large beneficial effect of theRAMP-DM on the DM-related complica-tions andmortalitymight be attributed tothe implementationof the following qual-ity improvement strategies, which werealso recommended to optimize thechronic care model for the managementof diabetes (7,43). Through observationsof a significantly higher data completionand detection rate during comprehensivescreening anddrug prescriptions after theRAMP-DM compared with the usual caregroup, the structured and systematicprotocol-driven risk assessment includingretinopathy screening and annual bloodand urine tests enabled the identificationof the patient’s risk and reversible factorsand complications such as microalbumi-nuria and preproliferative diabetic reti-nopathy. Therefore, timely detectionand subsequent treatments could be pro-vided to prevent further deterioration. Inthe usual care group, opportunistic carewas provided by GOPC doctors who wereresponsible for the coordination of careincluding the arrangement of assess-ments and referrals to allied health as
deemed necessary. Unfortunately, thedoctors in the Hong Kong public healthsystem are under tremendous workloadpressures, with an average consultationlength of 6 min (44). The quality of careprovided can be suboptimal as it is verychallenging to deal with multifactorial dis-ease problems and complicated lifestyle orcompliance issues within such a short con-sultation time. Because of the skewed dis-tribution of the GOPC attendance in theusual care group, some of the beneficialeffect of the entire RAMP-DM programmay be due to the fact that some patientsin the usual care group had very few visits,but higher complication andmortality rates.A further analysis showed that patients inthe usual care group who had fewer visits,particularly below the median of 13 GOPCvisits, had disproportionally higher rates ofcardiovascular events (HR 2.52, P, 0.001)or mortality (HR 3.71, P , 0.001) com-pared with the usual care patients with ahigher median number of GOPC visits. How-ever, after adjusting all baseline covariatesincluding patient sociodemographic data,laboratory results, and clinical parameters,the RAMP-DM group was associatedwith lower risks of CVD and all-causemortality than the usual care group, irre-spective of the frequency of GOPC atten-dance (Supplementary Table 6).
One of the benefits of the RAMP-DM isthat some of the care, particularly thatinvolving individual counseling (diabetesmanagement, drug adherence, weightmanagement, and lifestyle modifica-tion), and coordination of care is shiftedto the RAMP-DM nurse. Furthermore,the health care professionals involvedin the RAMP-DM program are experi-enced in the management of diabetes.For patientswho are stratified asmediumto very high risk, additional consultationsare provided by advanced practice nursesand/or family medicine specialists whoare allowed longer consultation times.The feedback and reminder system incor-porated the clinical management systemprovided automatic alerts for scheduledassessments, follow-ups, and abnormalresults, which could have led to closermonitoring of the disease, prescriptionof drugs, and treatments. Given a sub-stantially higher data completion ratefor laboratory results and clinical param-eters in the RAMP-DM group, a higherincidence of new complications uncov-ered at the first RAMP-DM assessmentof reversible complications like diabetic
Table 3—Multivariable Cox proportional regressions/negative binomial regressions onthe dependent variables of cardiovascular andmicrovascular complications, all-causemortality, and service uses adjusted for baseline characteristics
Initial episode of event during the period HR† 95% CI P value
Any CV or microvascular complications 0.594 (0.572, 0.617) ,0.001*CVD 0.434 (0.414, 0.455) ,0.001*CHD 0.383 (0.358, 0.410) ,0.001*Heart failure 0.401 (0.368, 0.436) ,0.001*Stroke 0.533 (0.495, 0.574) ,0.001*
Any microvascular complications 0.881 (0.834, 0.930) ,0.001*Retinopathy 1.256 (1.144, 1.379) ,0.001*Nephropathy 0.742 (0.696, 0.791) ,0.001*Neuropathy 0.391 (0.314, 0.488) ,0.001*ESRD 0.384 (0.311, 0.474) ,0.001*STDR 0.412 (0.334, 0.509) ,0.001*
All-cause mortality 0.339 (0.321, 0.357) ,0.001*
Frequency of episode event during the period IRR‡ 95% CI P value
Hospitalization§ 0.415 (0.403, 0.428) ,0.001*
A&E attendance 0.588 (0.575, 0.602) ,0.001*
SOPC attendance 0.650 (0.636, 0.664) ,0.001*
GOPC attendance 1.326 (1.311, 1.340) ,0.001*
CV, cardiovascular. *P value, 0.05. †All HRswere obtainedby Cox proportional hazards regressionswith the adjustment of sex, age, smoking status, HbA1c, SBP, DBP, LDL-C, BMI, TC to HDL-C ratio,triglyceride, eGFR, duration of DM, diagnosed hypertension, use of insulin, oral-diabetic drugs, lipid-lowering agents, and Charlson index. ‡All IRRs were obtained by negative binomial regressions withthe adjustment of sex, age, smoking status, HbA1c, SBP, DBP, LDL-C, BMI, TC to HDL-C ratio,triglyceride, eGFR, duration of DM, diagnosed hypertension, use of insulin, oral-diabetic drugs, lipid-lowering agents, Charlson index, and the corresponding frequency of episode event within 1 yearbefore baseline. §Stayed at least one overnight in the hospital after admission.
care.diabetesjournals.org Wan and Associates 55
retinopathy (26.7%) and nephropathy(17.9%) or comorbidities like hyperten-sion (20.5%) and hypercholesterolemia
(20.5%) during comprehensive nurseassessmentwere observed. As a result, sig-nificantly higher proportions of RAMP-DM
participants were prescribed glucose-low-ering drugs, antihypertensive drugs, ACEinhibitors/angiotensin receptor blockers,
Figure 1—A: Adjusted HRs of RAMP-DM participants compared with usual care patients associated with the incidences of CVDs, microvascular compli-cations, and all-cause mortality in selected subgroups by multivariable Cox proportional hazards regressions. HRs were adjusted for sex, age, smokingstatus, glycated HbA1c, SBP, DBP, LDL-C, BMI, TC to LDL-C ratio, triglyceride, eGFR, self-reported duration of DM, diagnosed hypertension, the usage ofinsulin, oral antidiabetic drugs, antihypertensive drugs, lipid-lowering agents, and Charlson index at baseline. B: Adjusted IRRs of RAMP-DM participantscompared with usual care patients associated with the number of hospitalizations, A&E attendances, SOPC attendances, and GOPC attendances inselected subgroups by negative binomial regressions. IRRs were adjusted for sex, age, smoking status, glycated HbA1c, SBP, DBP, LDL-C, BMI, TC to HDL-Cratio, triglycerides, eGFR, self-reporteddurationof DM, diagnosedhypertension, the usage of insulin, oral antidiabetic drugs, antihypertensive drugs, lipid-lowering agents, Charlson index, and the corresponding frequency of episode events within 1 year before baseline.
56 Five-Year Effectiveness of RAMP-DM Diabetes Care Volume 41, January 2018
and lipid-lowering agents after the pro-gram. Another key aspect of the RAMP-DM is the risk stratification process, whichmight help to motivate patients to adopt ahealthier lifestyle to prevent potential DMcomplications. Patients also had access togroup classes and a patient support callcenter designed to help facilitate betterself-care behaviors and empower the pa-tient to take care of themselves better.The benefits of the structure of diabetesempowerment programs have beenconfirmed in meta-analyses (45–47).Multiple contacts with different healthprofessionals helped to consolidateknowledge, adherence, and self-manage-ment (48–50).We found that the RAMP-DM group
had a higher risk of diabetic retinopathybut a lower risk of STDR compared withthe usual care group. A possible explana-tion was that all RAMP-DM participantsunderwent a formal systematic retinopa-thy screening through the use of a fundicamera by an optometrist during risk as-sessment, so an early stage of diabeticretinopathy such as background and pre-proliferative diabetic retinopathy could beidentified early in order to prevent furtherprogression to STDR by timely interven-tions. Several studies (51,52) suggestedthat the early stage of diabetic retinopa-thy might be reversible by improved con-trol of DM. On the other hand, patients inusual care may receive informal retinop-athy assessment using indirect ophthal-moscopy by the consulting doctor, andsuch screening was totally dependenton their doctors’ discretion. The earlystage of diabetic retinopathy may prog-ress to advanced stages without produc-ing any immediate symptoms in thepatients. As a consequence, usual carepatients had a higher risk of STDR thanRAMP-DM participants.Our results from the subgroup analysis
showed that patients in different riskgroups all benefited from the RAMP-DMwith a reduction in the risks of CVD andall-cause mortality. We observed that pa-tients with lower baseline CVD risks actu-ally had a higher relative risk reductionfrom RAMP-DM than those in higher-risk groups. One possible explanation isthat many patients with high CVD riskmight already have irreversible complica-tions or atherosclerosis, making it harderfor any intervention to prevent the devel-opment of CVD. Previous observationalstudies (28,53) also concluded that
interventions for patients with diabetesare more effective when commenced atan earlier stage of the disease progression.Our findings highlight the importance ofearly optimal DM control and risk factormanagement inorder todelaydiseasepro-gression and prevent the development ofcomplications. A further study should berequired to confirm the health benefit ofearly optimal DM control.
It was encouraging to find lower rates ofuse of secondary or tertiary care services(SOPC, A&E, and hospitalizations) in theRAMP-DM group compared with usualcare group. Despite no direct comparisonwith the existing literature, previous stud-ies (22,54,55) showed the multidisciplin-ary management, computer-supportedcare management, and improvement ofsurrogate outcomes such as HbA1c de-creased the health service use. One rea-sons for the reduction of service uses wasthat patients receiving RAMP-DM carehad fewer complications and thereforeneeded less secondary/tertiary care. Thereduced risk of CVD enabled patients re-ceiving RAMP-DM care to continue to befollowed up in primary care. Supportingthis, higher rates of primary care serviceuse (GOPC)wasobserved in theRAMP-DMgroups, which could be attributed to ahigher acceptance of the program.
There were several strengths to thisstudy. First, a comprehensive evaluationon the effectiveness of RAMP-DM in-cluded not only surrogate markers butalso actual observed events and serviceuses. Second, the propensity score match-ing and subgroup analyses increased thereliability of the findings because of thelarge population-based sample. Third, alldata were extracted from a computerizedadministrative database, which helps toassure data accuracy.
There were also several limitations tothis study. First, this was a prospectivecohort study and not an RCT. Hence, un-observed potential confounders mightinfluence the conclusion. Nonetheless,it may be infeasible to carry out such ahigh-evidence trial in primary care set-tings. High attrition rates, a low numberof incident events, short follow-up times,and strict subject inclusion criteria aresome known drawbacks of the RCT thatreduce the applicability to patients withdiabetes in clinical practices (56,57). Toovercome some of the limitations of co-hort studies, the comparison group wasselected by propensity score matching
with no significant differences in patientcharacteristics between groups. Second,ICPC-2 and ICD-9-CM diagnosis codingwere used to identify complications.There was no validation study performedto assess the accuracy and completenessof the coding, and thus the data may besusceptible to misclassification bias.Third, data on the patient’s financial bur-den, compliance, drug adherence, mentalhealth, and lifestyle behaviors were notcollected and may have contributed toCVD and mortality risk. A further studyincluding these factors may help to con-firm the current findings. Last, becauseof the limited number of usual care pa-tients, not all RAMP-DMparticipants couldbe matched with usual care patients,which may cause potential biases on theresults.
In conclusion, this large territory-widenaturalistic study in a real-world primarycare setting showed that RAMP-DM, irre-spective of any patient characteristics, ledto significantly greater reduction in anyCVD or microvascular complications andsecondary or tertiary service use for pa-tients with diabetes. Among all sub-groups, patients with lower CVD riskmay have received the most benefitfrom the RAMP-DM. Our findings high-light the importance of early optimalDM control and risk factor managementby risk assessment and stratification andmultidisciplinary management in order todelay disease progression and prevent thedevelopment of complications. Furtherstudies to evaluate the cost-effectivenessof RAMP-DM from health service providerand societal perspectives should be con-ducted to confirm whether the RAMP-DMis cost-effective.
Acknowledgments.The authors thank themul-tidisciplinary risk-stratification–based DM man-agement program team at the HA head office,the chief of service in primary care, the programcoordinator in each cluster, and the Statistics andWorkforce Planning Department at the HA fortheir contributions to this work.Funding. This study was funded by the HA(Reference #8011014157) and the Health andHealth Services Research Fund, Hong Kong SpecialAdministrativeRegionFoodandHealthBureau,andthe Health and Medical Research Fund Commis-sioned Study on EnhancedPrimary Care (Reference#EPC-HKU-2).The funders had no role in study design, data
collection and analysis, decision to publish, orthe preparation of the manuscript.Duality of Interest. No potential conflicts of in-terest relevant to this article were reported.
care.diabetesjournals.org Wan and Associates 57
Author Contributions. E.Y.F.W., C.S.C.F., andC.L.K.L. contributed to the study design andacquisition of data, researched the data, contributedto the statistical analysis and interpretation of theresults, and wrote the manuscript. F.F.J., E.Y.T.Y.,D.Y.T.F., C.K.H.W., K.H.Y.C., and R.L.P.K. contrib-utedtotheinterpretationoftheresults.Allauthorsreviewedandedited themanuscript.W.Y.C. andA.K.C.C. contributed to the statistical analysisand the interpretation of the results and wrotethemanuscript. E.Y.F.W. is the guarantor of thiswork and, as such, had full access to all the datain the study and takes responsibility for theintegrity of thedata and theaccuracyof thedataanalysis.
References1. International Diabetes Federation. IDF Diabe-tes Atlas. 7th ed. Brussels, Belgium, InternationalDiabetes Federation, 20152. American Diabetes Association. Children andadolescents. Sec. 11. In Standards of MedicalCare in Diabetesd2015. Diabetes Care 2015;38(Suppl. 1):S70–S763. National Institute for Health and Care Excellence.Type 2 diabetes in adults: management [Internet],2015. Available from https://www.nice.org.uk/guidance/ng28. Accessed 15 February 20174. Bodenheimer T, Wagner EH, Grumbach K. Im-proving primary care for patients with chronicillness: the chronic care model, part 2. JAMA2002;288:1909–19145. Bodenheimer T, Wagner EH, Grumbach K. Im-proving primary care for patients with chronicillness. JAMA 2002;288:1775–17796. Wagner EH, Grothaus LC, Sandhu N, et al.Chronic care clinics for diabetes in primary care:a system-wide randomized trial. Diabetes Care2001;24:695–7007. Wagner EH, Austin BT, Davis C, Hindmarsh M,Schaefer J, Bonomi A. Improving chronic illnesscare: translating evidence into action. Health Aff(Millwood) 2001;20:64–788. Larme AC, Pugh JA. Attitudes of primary careproviders toward diabetes: barriers to guideline im-plementation. Diabetes Care 1998;21:1391–13969. Gaede P, Lund-Andersen H, Parving H-H,Pedersen O. Effect of a multifactorial interventionon mortality in type 2 diabetes. N Engl J Med2008;358:580–59110. Holman RR, Paul SK, Bethel MA, MatthewsDR, Neil HAW. 10-year follow-up of intensive glu-cose control in type 2diabetes. N Engl JMed2008;359:1577–158911. Gerstein HC, Miller ME, Byington RP, et al.;Action to Control Cardiovascular Risk in DiabetesStudyGroup. Effects of intensive glucose loweringin type 2 diabetes. N Engl J Med 2008;358:2545–255912. Patel A, MacMahon S, Chalmers J, et al.;ADVANCE Collaborative Group. Intensive bloodglucose control and vascular outcomes in patientswith type 2 diabetes. N Engl J Med 2008;358:2560–257213. Duckworth W, Abraira C, Moritz T, et al.;VADT Investigators. Glucose control and vascularcomplications in veterans with type 2 diabetes. NEngl J Med 2009;360:129–13914. Vargas RB, Mangione CM, Asch S, et al. Can achronic caremodel collaborative reduceheart dis-ease risk in patients with diabetes? J Gen InternMed 2007;22:215–222
15. Clark CM Jr, Snyder JW, Meek RL, Stutz LM,Parkin CG. A systematic approach to risk stratifi-cation and intervention within a managed careenvironment improves diabetes outcomes andpatient satisfaction. Diabetes Care 2001;24:1079–108616. Yu GC, Beresford R. Implementation of achronic illness model for diabetes care in a familymedicine residency program. J Gen Intern Med2010;25(Suppl. 4):S615–S61917. Lee JD, SaravananP, Patel V. Alphabet strategyfor diabetes care: a multi-professional, evidence-based, outcome-directed approach tomanagement.World J Diabetes 2015;6:874–87918. Hull S, Chowdhury TA, Mathur R, Robson J.Improving outcomes for patients with type 2 di-abetes using general practice networks: a qualityimprovement project in east London. BMJ QualSaf 2014;23:171–17619. Weber V, Bloom F, Pierdon S, Wood C. Em-ploying the electronic health record to improvediabetes care: a multifaceted intervention in anintegrated delivery system. J Gen Intern Med2008;23:379–38220. Stock S, Drabik A, Buscher G, et al. Germandiabetes management programs improve qualityof care and curb costs. Health Aff (Millwood)2010;29:2197–220521. Olivarius NF, Beck-Nielsen H, Andreasen AH,Hørder M, Pedersen PA. Randomised controlledtrial of structured personal care of type 2 diabetesmellitus. BMJ 2001;323:970–97522. Sadur CN, Moline N, Costa M, et al. Diabetesmanagement in a health maintenance organiza-tion. Efficacy of care management using clustervisits. Diabetes Care 1999;22:2011–201723. Gelding SV. Improving cardiovascular risk intype 2 diabetes: time to get personal. Eur Heart JQual Care Clin Outcomes. 2016;2:233–23424. Fung CS, ChinWY, Dai DS, et al. Evaluation ofthe quality of care of a multi-disciplinary Risk fac-tor Assessment and Management Programme(RAMP) for diabetic patients. BMC Fam Pract2012;13:11625. Jiao F, Fung CS, Wan YF, et al. Long-term ef-fects of the multidisciplinary Risk Assessment andManagement Program for Patients with DiabetesMellitus (RAMP-DM): a population-based cohortstudy. Cardiovasc Diabetol 2015;14:10526. Jiao FF, Fung CS,Wong CK, et al. Effects of theMultidisciplinary Risk Assessment and Manage-ment Program for Patients with Diabetes Mellitus(RAMP-DM) on biomedical outcomes, observedcardiovascular events and cardiovascular risks inprimary care: a longitudinal comparative study.Cardiovasc Diabetol 2014;13:12727. Lau IT. A clinical practice guideline to guide asystem approach to diabetes care in Hong Kong.Diabetes Metab J 2017;41:81–8828. Chan J, So W, Ko G, et al. The Joint Asia Di-abetes Evaluation (JADE) Program: a web-basedprogram to translate evidence to clinical practicein type 2 diabetes. Diabet Med 2009;26:693–69929. Department of Health, The Government ofthe Hong Kong Special Administrative Region.Hong Kong reference framework for diabetescare for adults in primary care settings [Internet],2017. Avai lable from http://www.pco.gov.hk/english/resource/professionals_diabetes_pdf.html. Accessed 15 February 201730. Rosenbaum PR. Observational Studies. NewYork, Springer, 2002
31. Rosenbaum PR, Rubin DB. The central role ofthe propensity score in observational studies forcausal effects. Biometrika 1983;70:41–5532. Rubin DB. Estimating causal effects of treat-ments in randomized and nonrandomized stud-ies. J Educ Psychol 1974;66:688–70133. D’Agostino RBJ Jr. Propensity score methodsfor bias reduction in the comparison of a treat-ment to a non-randomized control group. StatMed 1998;17:2265–228134. Leuven E, Sianesi B. PSMATCH2: Statamoduleto perform full Mahalanobis and propensity scorematching, common support graphing, and covariateimbalance testing [Internet], 2012. Available fromhttps://econpapers.repec.org/software/bocbocode/s432001.htm. Accessed 15 February 201735. Royston P. Multiple imputation of missingvalues. Stata J 2004;4:227–24136. Clark TG, AltmanDG.Developing a prognosticmodel in the presence of missing data: an ovariancancer case study. J Clin Epidemiol 2003;56:28–3737. Schafer JL, Graham JW. Missing data: ourview of the state of the art. Psychol Methods2002;7:147–17738. Steyerberg EW, van Veen M. Imputation isbeneficial for handling missing data in predictivemodels. J Clin Epidemiol 2007;60:97939. Moons KG, Donders RA, Stijnen T, Harrell FEJr. Using the outcome for imputation of missingpredictor values was preferred. J Clin Epidemiol2006;59:1092–110140. Rubin DB. Multiple Imputation for Nonre-sponse in Surveys. New York, John Wiley & Sons,200441. Ulm K. A simple method to calculate the con-fidence interval of a standardized mortality ratio(SMR). Am J Epidemiol 1990;131:373–37542. Griffin SJ, Borch-Johnsen K, Davies MJ, et al.Effect of early intensive multifactorial therapy on5-year cardiovascular outcomes in individualswith type 2 diabetes detected by screening(ADDITION-Europe): a cluster-randomised trial.Lancet 2011;378:156–16743. Tricco AC, Ivers NM, Grimshaw JM, et al. Ef-fectiveness of quality improvement strategies onthemanagement of diabetes: a systematic reviewand meta-analysis. Lancet 2012;379:2252–226144. Yu FS, Yip BH, Kung K, et al. The association oftypes of training and practice settings with doc-tors’ empathy and patient enablement among pa-tients with chronic illness in Hong Kong. PLoS One2015;10:e014449245. Steinsbekk A, Rygg LØ, Lisulo M, Rise MB,Fretheim A. Group based diabetes self-managementeducation compared to routine treatment forpeoplewith type 2 diabetesmellitus. A systematicreview with meta-analysis. BMC Health Serv Res2012;12:21346. Norris SL, Lau J, Smith SJ, Schmid CH,Engelgau MM. Self-management education foradults with type 2 diabetes: a meta-analysis ofthe effect on glycemic control. Diabetes Care2002;25:1159–117147. Minet L, Møller S, Vach W, Wagner L,Henriksen JE. Mediating the effect of self-caremanagement intervention in type 2 diabetes: ameta-analysis of 47 randomised controlled trials.Patient Educ Couns 2010;80:29–4148. GlasgowRE,OrleansCT,Wagner EH.Does thechronic care model serve also as a template forimproving prevention? Milbank Q 2001;79:579–612, iv–v
58 Five-Year Effectiveness of RAMP-DM Diabetes Care Volume 41, January 2018

49. Hulscher M, Wensing M, Weijden T, Grol R.Interventions to implement prevention in pri-mary care. Cochrane Databse Syst Rev 1997;1:CD00036250. An LC, Foldes SS, Alesci NL, et al. The impactof smoking-cessation intervention by multiplehealth professionals. Am J Prev Med 2008;34:54–6051. Stitt AW, Curtis TM, Chen M, et al. The prog-ress in understanding and treatment of diabeticretinopathy. Prog Retin Eye Res 2016;51:156–186
52. Wong TY, Mwamburi M, Klein R, et al. Ratesof progression in diabetic retinopathy during dif-ferent time periods: a systematic review andmeta-analysis. Diabetes Care 2009;32:2307–231353. Alberti KGM, Zimmet P, Shaw J. InternationalDiabetes Federation: a consensus on Type 2 di-abetes prevention. Diabet Med 2007;24:451–46354. Domurat ES. Diabetesmanaged care and clin-ical outcomes: the Harbor City, California KaiserPermanente diabetes care system. Am J ManagCare 1999;5:1299–1307
55. Wagner EH, Sandhu N, Newton KM,McCulloch DK, Ramsey SD, Grothaus LC. Effectof improved glycemic control on health care costsand utilization. JAMA 2001;285:182–18956. Benson K, Hartz AJ. A comparison of observa-tional studies and randomized, controlled trials. NEngl J Med 2000;342:1878–188657. Concato J, Shah N, Horwitz RI. Randomized,controlled trials, observational studies, and thehierarchy of research designs. N Engl J Med2000;342:1887–1892
care.diabetesjournals.org Wan and Associates 59