Embed Size (px)
Citation preview
fitin14: A workforce physical activity and wellbeing survey in
Dumfries and Galloway
Jenny Bruce & Chris Topping
Health Intelligence UnitDG Health and WellbeingDumfries and Galloway Council

Background
• “Physical activity includes all forms of activity, such as everyday walking or cycling to get from A to B, active play, work-related activity, active recreation (such as working out in a gym), dancing, gardening or playing active games, as well as organised and competitive sport” (Start Active, Stay Active, 2011).
• Physical activity benefits – the workplace
• Physical activity guidelines

• No local or departmental level data using current physical activity guidelines
• To consult with the local workforce
• Identify gaps and opportunities
• Calculate the cost of workplace physical inactivity
• Produce evidenced based recommendations
Rationale

Outcomes
• Determine:
– levels of physical activity
– the correlation between
physical activity & sedentary behaviors
physical activity and sickness absence
physical activity & mental health and wellbeing

• Working Group established
• Pilot
• Self report survey (limitations)
• Robust sample size (n = 2,596)
Methodology

Methodology Continued
Dumfries and Galloway Council
NHS Dumfries and Galloway
1,989 responses 867 responses
26% of workforce 20% of total workforce
72% female28% male
83% female17% male
43% aged 45-54 years 36% aged 45-54 years

Survey Questions

Results
Dumfries and Galloway Council NHS Dumfries and Galloway
62% met weekly physical activity guidelines
62% met weekly physical activity guidelines
Males more active than females* Males more active than females*
Staff sitting for less time were more likely to meet guidelines
Staff sitting for less time were more likely to meet guidelines
Staff meeting guidelines weekly was highest in those that were not off sick for any days in the preceding year (67%)
Staff meeting guidelines weekly was highest in those that were not off sick for any days in the preceding year (68%)
Wellbeing decline with reduced frequency of meeting guidelines*
Wellbeing decline with reduced frequency of meeting guidelines*
* = Statistically significant finding

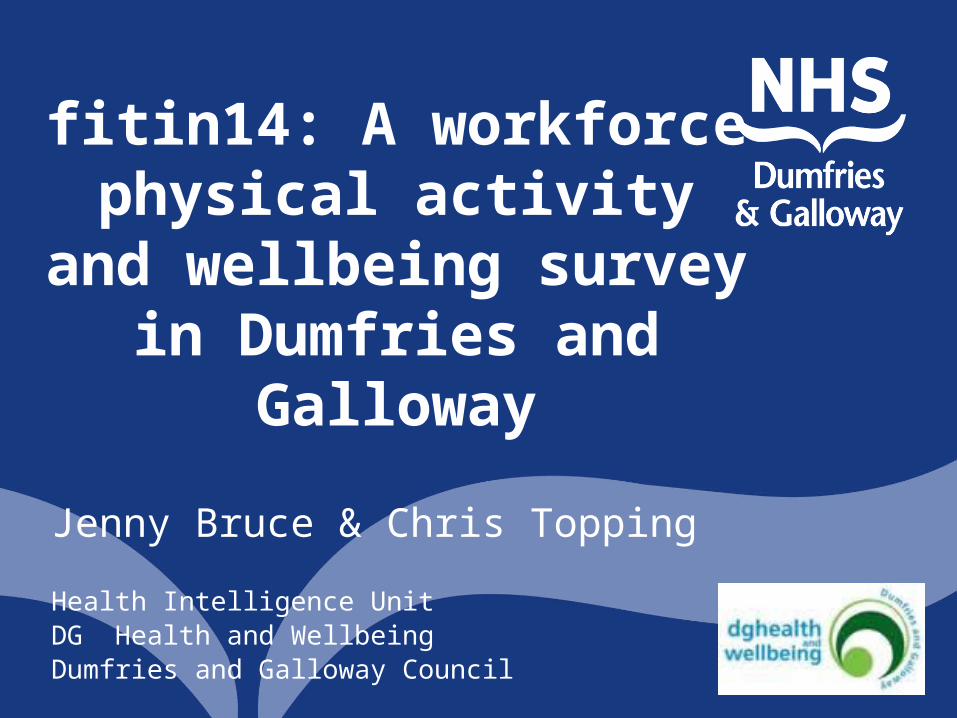
Council Staff Result – Physical Activity Levels by age and gender
65% 67% 62% 60% 60% 64% 58%71%
23% 22%24% 24% 24%
27%26%
18%
12% 11% 14% 16% 16%9%
16% 11%
0%
10%
20%
30%
40%
50%
60%
70%
80%
90%
100%
16-24 25-34 35-44 45-54 55-64 65-74 Female Male
Age Gender
Per
cen
tag
e o
f res
po
nse
s
Frequency of achieving physical activity guidelines by age group and gender - Dumfries & Galloway Council
Weekly More than once a month but not weekly Less than once a month
Staff Physical Activity and Wellbeing Survey 2014Valid repsonses : 1,864 (age), 1,830 (gender)
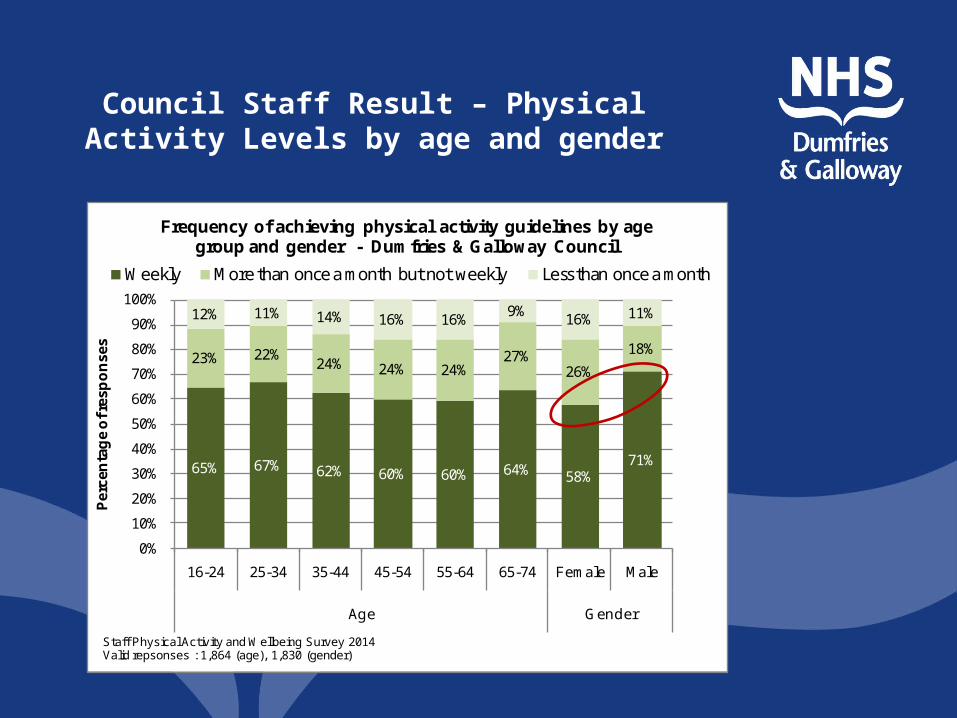

Council Staff Result – Physical Activity Level by time spent sitting
12% 11% 16% 21% 15%21% 24%
25% 22%25%
22%26%
22%23%
64% 66% 59% 57% 58% 57% 53%
0%
10%
20%
30%
40%
50%
60%
70%
80%
90%
100%
<1 hour 1-2 hours 2-3 hours 3-4 hours 4-5 hours 5-6 hours >6 hours
Per
cen
tag
e o
f res
po
nse
s
Hours spent sitting or reclining without interruption
Frequency of achieving physical activity guidelines by average time spent sitting or reclining without interruption
in a typical work day - Dumfries & Galloway Council
Weekly More than once a month but not weekly Less than once a month
Staff Physical Activity and Wellbeing Survey 2014Valid repsonses : 1,832

Council Staff Result – Increased Physical activity
- 79% would like to be more active

Council Staff Result – Increased Physical activity
- 79% would like to be more active

NHS Staff Result – Physical Activity Level by Sickness Absence
12% 15% 19% 18% 23%
7%
22%
20%25%
25% 28%
46%
43%24%
68%60% 56% 54%
31%
50% 53%
0%
10%
20%
30%
40%
50%
60%
70%
80%
90%
100%
0 days 1-2 days 3-5 days 6-10 days 11-15 days 16-20 days 21 days+
Per
cen
tag
e o
f res
po
nse
s
Days absent from work in 2013
Frequency of achieving physical activity guidelines by number of days absent from work in 2013
- NHS Dumfries & Galloway
Weekly More than once a month but not weekly Less than once a month
Staff Physical Activity and Wellbeing Survey 2014Valid repsonses : 789

NHS Staff Result – Physical Activity Level by WEMWBS Score
52.149.2
47.2
0
10
20
30
40
50
60
Weekly More than once a month but not weekly
Less than once a month
Ave
rag
e W
EM
WB
S s
core
Frequency of achieving physical activity guidelines by average WEMWBS score - NHS Dumfries & Galloway
Staff Physical Activity and Wellbeing Survey 2014Valid repsonses : 748

Cost Savings
An 5-10% increase in staff physical activity levels would deliver sickness absence reductions and employee satisfaction and retention with a quantifiable benefit of:
NHS = £479,458 - £587,717
Council = £455,321 - £682,123
NICE (2008)

• Feedback to relevant stakeholders including staff
• Collaborative approach to workforce activity
• Establish recommendations
• Deliver recommendations
• Repeat survey – early 2015
Next steps

1. Physical activity is one of the best things we can do for our health
2. Staff who are more active take less sick days, report better wellbeing and are less sedentary at work.
3. Local results are consistent with national data.
4. Increasing workforce physical activity delivers significant cost savings.
Concluding Thoughts