Embed Size (px)
Citation preview

FISICA Deliverable D3.3 Far Infra-red Space Interferometer Critical Assessment
PU Page 1 Version 1
Grant agreement no. 312818
SPA.2012.2.2-01 : Key technologies enabling observations in and from space
- Collaborative project -
D3.3 Multiple beam combining spectral-spatial
interferometer test-bed
WP 3 - Interferometer Instrument Technology Development Due date of deliverable: month 25 Actual submission date: 15 / 01 / 2015 Start date of project: January 1st 2013 Duration: 36 months Lead beneficiary for this deliverable: CARDIFF UNIVERSITY
Last editor: Professor Peter Ade, Cardiff University
Contributors: Peter Ade, Enzo Pascale
Project co-funded by the European Union’s Seventh Framework Programme for research, technological development and demonstration
Dissemination Level
PU Public
PP Restricted to other programme participants (including the Commission Services)
RE Restricted to a group specified by the consortium (including the Commission Services)
CO Confidential, only for members of the consortium (including the Commission Services)

FISICA Deliverable D3.3 Far Infra-red Space Interferometer Critical Assessment
PU Page 2 Version 1
History table
Version Date Released by Comments
1 15 January 2015 Peter Ade

FISICA Deliverable D3.3 Far Infra-red Space Interferometer Critical Assessment
PU Page 3 Version 1
Table of contents
History table ..................................................................................................................... 2
Table of contents .............................................................................................................. 3
Key word list ..................................................................................................................... 4
Definitions and acronyms ................................................................................................. 4
Acknowledgements .......................................................................................................... 5
Disclaimer ......................................................................................................................... 5
1 Introduction .......................................................................................................... 6
1.1 General context ........................................................................................... 6 1.2 Deliverable objectives ................................................................................ 7
1.3 Test-bed overview ...................................................................................... 7
1.4 Summary of test-bed upgrades ................................................................... 9
1.5 Optical alignment .................................................................................... 11
1.6 FIR alignment .......................................................................................... 12
1.7 Drive electronics and LabVIEW Interface ............................................. 12
2 Single port operation ........................................................................................... 13
3 Dual port operation ............................................................................................. 15
4 Plans for the next phase ...................................................................................... 16
5 Publications resulting from the work described ................................................ 17
6 References ........................................................................................................... 18
7 Bibliographical references ................................... Error! Bookmark not defined.
FISICA Deliverable D3.3 Far Infra-red Space Interferometer Critical Assessment
PU Page 4 Version 1
Key word list
Definitions and acronyms
Acronyms Definitions
FIRI Far-infrared interferometer
FTS Fourier Transform Spectrometer
SoW Statement of work

FISICA Deliverable D3.3 Far Infra-red Space Interferometer Critical Assessment
PU Page 5 Version 1
Acknowledgements
The research leading to this report has received funding from the European Union’s Seventh Framework Programme for research, technological development and demonstration under Grant Agreement no 312818 - FISICA.
Disclaimer
The content of this deliverable does not reflect the official opinion of the European Union. Responsibility for the information and views expressed in the deliverable therein lies entirely with the author(s).

FISICA Deliverable D3.3 Far Infra-red Space Interferometer Critical Assessment
PU Page 6 Version 1
1 Introduction
1.1 General context
A spatial/spectral interferometer test-bed has been setup to test and validate the different beam combining geometries and associated optical components of the double Fourier technique in a spectral band covering the mid- to the far-IR. In task 3.1 the test-bed is used to perform spatial/spectral interferometry using different scene geometries, comparing the measurements with optical modelling, to assess beam efficiency as a function of varying baseline, axis-angle and wavelength. Measurement of calibration scenarios will be subsequently performed in order to assess the level of precision in knowledge retrieval of the instrument optical parameters. Light interference is obtained when the two optical paths are combined at the beam combiner, located at the output of the interferometer test-bed, shown in Figure 1. Using the quasi-optical modelling expertise and manufacturing capabilities at Cardiff University, a beam-combiner efficient for the 35 - 350µm bands has been designed. A prototype covering the 25-120µm band has been manufactured and tested both in transmission and reflection, at 300K and 80K. A full report of the beam-combiner is given in Deliverable 3.2 submitted. In this report we provide a preliminary discussion of the test-bed which is now operational after having been refurbished and optimised.

FISICA Deliverable D3.3 Far Infra-red Space Interferometer Critical Assessment
PU Page 7 Version 1
Figure 1: 1: Schematic of the interferometer. The dash-dot-dot box shows the moving part for the spectral arm, and dash-dot box shows the moving parts for the spatial arm. POL indicates the location of a polarizing grid or additional beam combiner added to turn the dual telescope (port) system into a single port system with the spatial arm removed. Port 1 and Port 2 represent the two complementary output ports of the interferometer; we only use Port 1 (Grainger et al., 2012).
1.2 Deliverable objectives
The main deliverable is a report of the refurbished test-bed (Figure 1) an its performance in obtaining spatial-spectral information from a know source placed in the far-field of the instrument.
1.3 Test-bed overview
The FIRI instrument is designed to operate over a band spanning from 25 to 400 µm, split into 4 channels using dichroic filters (See FIRI deliverable 1.2). Clearly the short-wavelength channel is the most challenging from the point of view of optical and alignment tolerances. The layout of the test-bed is shown in Figure 2. A water-cooled mercury-arc lamp which has an equivalent blackbody-like Raleigh Jeans emission in the FIR is used as a source to mimic an astronomical object located at infinity. The source is collimated using a section of the BLAST telescope (Pascale et al. 2008, SM in the Figure 2 diagram). This is a gold plated 2m spherical mirror with a 2-m focal length. The mirror is made of 6 carbon fibre sections and one of these sections is used as collimator in the test-bed. The plate scale at the collimator focal plane is 1.64 arcmin/mm. The aperture of the source can be adjusted, up to a maximum diameter of 10mm, the diameter of the mercury arc lamp. To create a scene, such as a single slit, a double slits or three
FISICA Deliverable D3.3 Far Infra-red Space Interferometer Critical Assessment
PU Page 8 Version 1
slits, aperture plates can be placed directly at the focus of the collimator, in front the mercury arc lamp. As the maximum interferometer baseline achievable is 400 mm, the maximum achievable spatial resolution is about 8.5 arcmin at 1 mm wavelength or 3 arcmin at 350μm. So a 1mm wide slit (1.72 arcmin source) will not be resolved but two slits 9mm apart will produce fringes at the detector for wavelengths ≤ 1mm. At 25μm the optical resolving power achievable will be 8 times larger – so more complex scenes are possible.
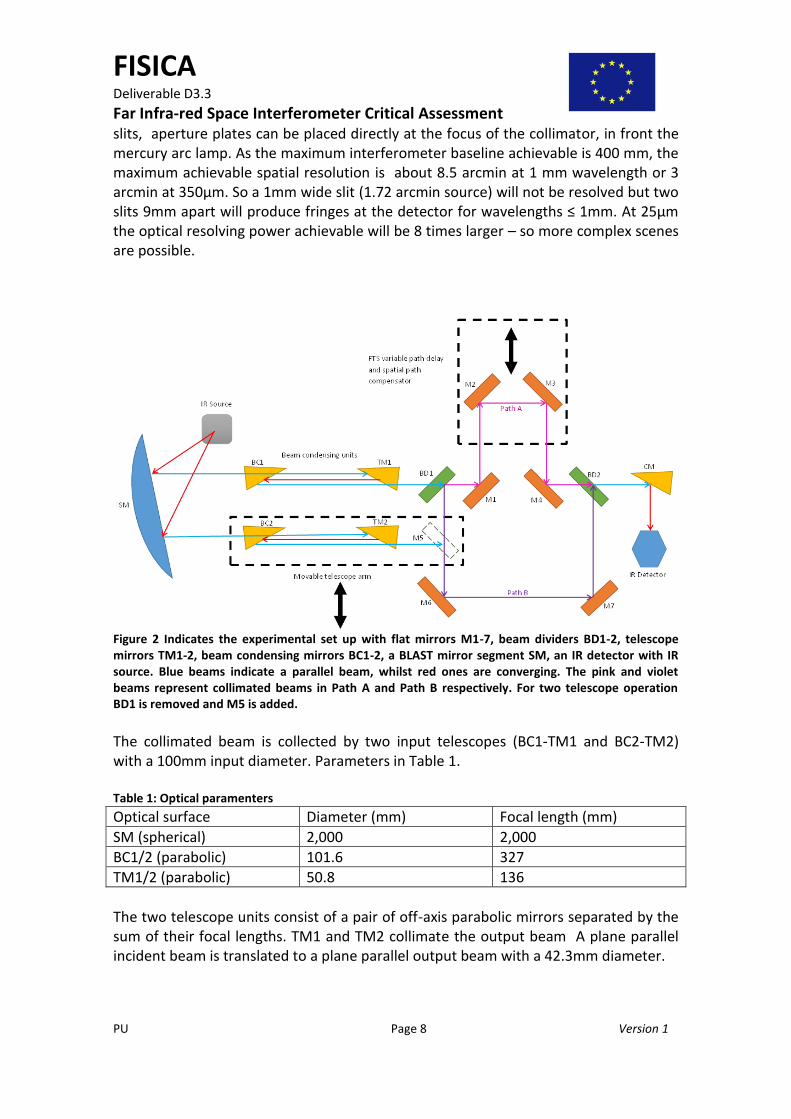
Figure 2 Indicates the experimental set up with flat mirrors M1-7, beam dividers BD1-2, telescope mirrors TM1-2, beam condensing mirrors BC1-2, a BLAST mirror segment SM, an IR detector with IR source. Blue beams indicate a parallel beam, whilst red ones are converging. The pink and violet beams represent collimated beams in Path A and Path B respectively. For two telescope operation BD1 is removed and M5 is added.
The collimated beam is collected by two input telescopes (BC1-TM1 and BC2-TM2) with a 100mm input diameter. Parameters in Table 1. Table 1: Optical paramenters
Optical surface Diameter (mm) Focal length (mm) SM (spherical) 2,000 2,000 BC1/2 (parabolic) 101.6 327 TM1/2 (parabolic) 50.8 136 The two telescope units consist of a pair of off-axis parabolic mirrors separated by the sum of their focal lengths. TM1 and TM2 collimate the output beam A plane parallel incident beam is translated to a plane parallel output beam with a 42.3mm diameter.

FISICA Deliverable D3.3 Far Infra-red Space Interferometer Critical Assessment
PU Page 9 Version 1
One telescope unit is fixed. The other is actuated by a Thorlabs linear stage which provide a maxium travel of 300mm – so that combined with the mirror diameters gives a maximum baseline of 400mm. One beam travels via M1 towards M2 and M3 on the optical delay line actuated by a linear Aerotech stage and then onto the beam divider BD2. The beam from the movable telescope arm is reflected by M5, placed at 45 degrees, and through M6 and M7 is directed toward BD2, where the two beams are combined. The combined collimated beams are then focused onto the detector by a final off-axis parabolic condensing mirror, CM. In the current setup, only one of the two output ports are in use. The second port is used in the FIRI design, but on the test bed is currently terminated onto eccosorb at 300K, and is availble should this be needed. When the system is used as a spectral-spatial interferometer, M5 is in place, but the beam divider BD1 in the diagram is not. By removing M5 and inserting the additional beam divider, BD1, the testbed can be configured to operate as an intensity (non-polarising) single port FTS. This is a useful convenience during the alignment process and for comparing BD efficiencies.
1.4 Summary of test-bed upgrades
The test-bed pre-existed at the start of this funded project and is described by Grainger et al. (2012) where they discuss the principle upon which the test-bed operates and where performance and limitations are reviewed. Three major limitations in the original setup where: 1) the reflective surfaces (M1 to
M7) where under-sized resulting in beam vignetting, efficiency loos, etc.
2) the folding mirror assembly (M2-M3) was a rigid system where the two mirrors were not quite orthogonal to each other (by about 1deg) without the possibility of adjustment
3) the optical delay line was actuated by a slow-moving Thorlabs linear stage preventing rapid scanning which is required for efficient data collection and to enable noise reduction by averaging the acquired data cube.
Figure 3: Picture showing the test bed refurbished. The two input telescopes are mounted on the black holders. All reflective surfaces are adjustable using the three micrometric screws shown in the picture. The output beam combiner is also visible (copper coloured disk).

FISICA Deliverable D3.3 Far Infra-red Space Interferometer Critical Assessment
PU Page 10 Version 1
In the re-furbished system, see Figure 3, we retain the input collimator SM and the two telescope units. However, the mounts of the Telescope units where modified to provide for accurate mechanical adjustment along with new mechanical supports to allow more precise alignment of the units with the interferometer. In addition, a new set of folding mirrors (M1-M7) have been manufactured in-house to provide steerable units which can be secured to the optical bench. The mirror surfaces were made by aluminium deposition on thin 3’’ diameter silicon wafers in the Cardiff clean room. These mirrors were then mounted on the mechanical supports which provide 3 degrees of freedom (tilt, tip and displacement along the optical axis) for alignment. The folding mirror assembly (M2-M3) was also manufactured using a precision machined support. On such support M2 is fixed but the other M3 has the same three degrees of freedom used for the other mirrors. M2 and M4 are mounted rigidly to each other to facilitate alignment. One of the input telescopes is mounted onto a Thorlabs linear stage which is computer controlled. The optical delay line (translation of the fold mirrors M2 and M3) is actuated using an Aerotech linear stage
which provides an equal-space sampling trigger signal (sampling precision 100nm) which is used to trigger the data acquisition systems. A detector system using a silicon bolometer operated at 4K is used as the main receiver (see Figure 4). Band selection filters are used in the cryostat in order to define the spectral region of operation and thus to maximise the signal to noise of the signal by eliminating radiation at frequencies out of the optical band of interest. For THz observations a 33cm-1 low pass edge is located at the mouth of the Winston horn feeding the bolometric detector. The half power point of the low pass edge is measured to be 34.5cm-1. An additional 58cm-1 low pass edge filter is also used to reduce higher frequency leaks.
Figure 4: The transmission of the 33cm-1 and 58cm-1 low pass edge filters within the receiver units is shown on the left. The silicon bolometer detector assembly at the cryostat cold plate is show in the right panel, where the feed horn and detector block are visible.

FISICA Deliverable D3.3 Far Infra-red Space Interferometer Critical Assessment
PU Page 11 Version 1
Figure 5: Measured transmission and reflection for the beam divider covering the 5 – 33cm-1 region
For the initial 0 – 1 THz (0 – 33cm-1) measurements we designed and constructed a beam divider for this region. The measured data for this are shown in Figure 5.
1.5 Optical alignment
Starting with the configuration in Figure 1, the cryostat was exchanged for a Helium-Neon laser. To operate with this source working in the visible region of the spectrum, the FIR beam dividers (BD1 and BD2) were replaced by optical versions comprising of 0.9um Mylar stretched films. The condensing mirror, CM, at the cryostat was switched to a flat 45 degree mirror for convenience. Alignment required the beam to be running parallel to the bench and for it to be incident at the centre of every optical component that the beam encounters. The pair of fold mirrors on the FTS drive must have an angle of exactly 90 degrees between them to avoid beam walk off as the stage moves. Once aligned, any beam travelling up the moving arm will be returned parallel to the incident beam. Tools to complete this high level of alignment included an iris set at the correct optical beam height of 160mm, and a metal ruler to ensure beams were running parallel to one another.
Figure 6 Fringes created by He interfering laser beams
Since a helium neon laser is being used, we have a coherence length of order ~1m. Therefore, without knowing exactly where zero path difference for the interferometer occurs, interference fringes in the optical are expected and after careful alignment were clearly visible - as shown in Figure 6. By taking even greater care about the parallelism of alignment, fringes were observed over the full path delay of 450mm.
0
0.1
0.2
0.3
0.4
0.5
0.6
0.7
0.8
0.9
1
0 2 4 6 8 10 12 14 16 18 20 22 24 26 28 30 32 34 36 38 40
Tra
nsm
issi
on
Frequency (cm-1)

FISICA Deliverable D3.3 Far Infra-red Space Interferometer Critical Assessment
PU Page 12 Version 1
For the second port of the interferometer, a similar alignment procedure was also used, with the additional criteria that the two emerging beams from the twin telescopes must now be in the same plane, whilst maintaining the same separation all the way to the large spherical mirror. It was also possible to observe the two beams coming to a focus after the mirror at ~2m which is the focal length of the BLAST mirror (SM). This was a very valuable step in alignment, as it allowed the source to be placed at the focus of the mirror which is necessary to maximise the input signal.
1.6 FIR alignment
As the optical beam dividers are mounted in exactly the same way as the FIR beam dividers, to a first approximation they can be swapped without loss of alignment. This was born out when the IR detector was placed back on to the test bed, and the flat mirror was switched back to the condensing mirror, CM as shown in Figure 1. Immediately by pushing the FTS stage manually, an interferogram was visible on the oscilloscope screen. After a final tweak in the alignment, to compensate for the slight difference in the optical and infrared beam dividers position, the interference visibility was maximised. This adjustment used a controlled motion of the FTS stage to move it back and forth through the ZPD position to monitor the modulation depth. The drive control also allowed a digitised signal from the detector to be displayed in real time on a computer screen through LabVIEW and recorded.
1.7 Drive electronics and LabVIEW Interface
An Aerotech linear stage is used to control the path difference motion of the FTS and to compensate for baseline changes of the second telescope unit. Control of this linear table is achieved through the use of a magnetic strip encoder buried in the stage which can output pulses every 10nm – which is more than sufficient for encoding the measurements of FIR radiation. This outgoing pulse chain is used to servo the velocity and determines the absolute position with respect to a central fiducial mark along the drive. Upon start up the controller takes control of the stage and drives it between the end stops, locates the single fiducial marker and thus determines its location and its direction of motion.

FISICA Deliverable D3.3 Far Infra-red Space Interferometer Critical Assessment
PU Page 13 Version 1
Figure 7: Graphical User Interface (GUI) for FIRI system
Routines have been written in LabVIEW allowing the following motions to be controlled:
locating the central maxima
a calibration routine
scanning mode.
Figure 7 shows the central GUI for the FIRI system. To locate the ZPD, the routine measures where the peak infrared signal from the detector occurs. In calibration mode the drive scans a small distance through the peak, which is useful for adjusting the alignment of the mirrors and beam dividers or the detector bias voltage. When in scanning mode, two full length single sided interferograms are recorded. All of the scan data taken in this mode are stored with a header file containing the measured forward and backward interferograms separately. Figure 7 also shows the baseline scan control module labelled X-Motor. This drive is linked in to the data taking scan so that we can automate the baseline changes between the FTS scans. This enables very long data sets (12 hours or more) to be taken without any operator intervention. The LabVIEW interface has several inputs including optical path difference, sampling interval, scan speed, number of scans at each baseline and baseline intervals. By controlling these parameters, FIRI can be optimised for the required data set over the electromagnetic region of interest.
2 Single port operation The FIRI test bed is located in a heavy traffic area of the lab. Disturbances because of this will upset the system, and increase the level of noise that is measured. Fortunately a de-glitch algorithm has been written into the LabView code which discards scans that are significantly at variance with previous scans.
FISICA Deliverable D3.3 Far Infra-red Space Interferometer Critical Assessment
PU Page 14 Version 1
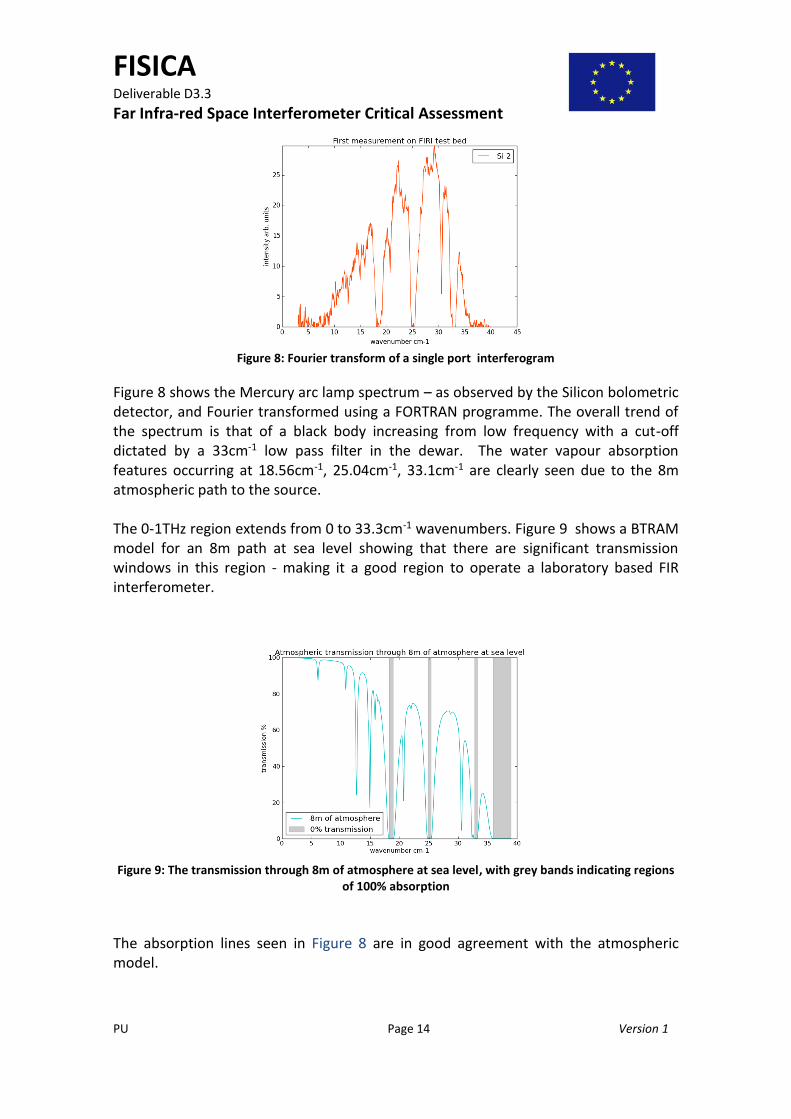
Figure 8: Fourier transform of a single port interferogram
Figure 8 shows the Mercury arc lamp spectrum – as observed by the Silicon bolometric detector, and Fourier transformed using a FORTRAN programme. The overall trend of the spectrum is that of a black body increasing from low frequency with a cut-off dictated by a 33cm-1 low pass filter in the dewar. The water vapour absorption features occurring at 18.56cm-1, 25.04cm-1, 33.1cm-1 are clearly seen due to the 8m atmospheric path to the source. The 0-1THz region extends from 0 to 33.3cm-1 wavenumbers. Figure 9 shows a BTRAM model for an 8m path at sea level showing that there are significant transmission windows in this region - making it a good region to operate a laboratory based FIR interferometer.
Figure 9: The transmission through 8m of atmosphere at sea level, with grey bands indicating regions
of 100% absorption
The absorption lines seen in Figure 8 are in good agreement with the atmospheric model.

FISICA Deliverable D3.3 Far Infra-red Space Interferometer Critical Assessment
PU Page 15 Version 1
3 Dual port operation A double slit is placed at the focal plane of the collimator, in front of the mercury arc lamp source. Each slit is 1.5mm wide, separated by 6mm one from the other. The signal is unresolved by a single antenna. Data are taken by rapid scanning the optical delay line at each position of the moving antenna, and interferograms are averaged. The baseline is varied over a distance of 300mm, in steps of 20mm. Therefore 16 baselines are obtained. In a preliminary analysis, each interferogram is Fourier transformed resulting in the data cube shown in Figure 10. The figure shows the source spectrum for the different baselines acquired. As the baseline changes, the spectrum is modulated by the complex degree of coehrence of the source.
Figure 10: Double slit measurement. Spectra obtained at different antennae separations are shown in the top panel, and as an image in the bottom panel. The deep features in absorption are caused by water. The modulation observed in the spatial direction is consistent with that expected from a double slit separated by 6mm in the focal plane of the collimator.
The amplitude of the degree of coeherce is given by (Grainger et al., 2012)
𝛾 = |𝑠𝑖𝑛𝑐(𝑣)cos(𝑣𝑑)|
Where 𝑣𝑑 =𝜋𝑏𝜃𝑠
𝜆, b is the separation between the two antennas and θs is the angular
separation between the two slits. The parameter 𝑣 is related to the degree of coeherence of each slit, and varies slowly compared to 𝑣𝑑 which imposes a modulation with a period of about 120mm at a wavanumber of 30cm-1, consistent with the modulation shown in the spatial direction in Figure 10.

FISICA Deliverable D3.3 Far Infra-red Space Interferometer Critical Assessment
PU Page 16 Version 1
A measure of the walk-off seen in Figure 11 as the optical delay line is extended by scanning the FTS to its full extent for a given baseline. This measurement was made by mechanically modulating the source and demodulating the signal with a lock-in amplifier before sampling with LabView at a slow drive speed. The walk-off is seen to be ~30% of the signal level and is a significant improvement on the prototype FIRI system. This measurement sets a baseline for the Maynooth study of powered optics to minimise walk-off.
Figure 11: FTS scan to maximum path in homodyne mode to estimate beam walk-off
This preliminary experiment and analysis indicates that the testbed is working as expected.
4 Plans for the next phase We have currently obtained datasets using a single slit, two sets with double slits of different separations, and a triple slit. Data analysis is undergoing to understand the testbed performance. More data will be obtained during the coming period with more complicated scenes generated using the UCL scene generator. In addition we plan to operate at higher frequencies which will enable more complex scenes and better resolving power (x8) to
see more detail. Atmospheric modelling has shown that a band near 25m will allow good transmission over our 8m path – see Figure 12. This switch requires a change of aperture and filter in the bolometric system and a switch to the higher frequency beam divider developed under the parallel study programme “D3 - Broadband FIR beam dividers”.

FISICA Deliverable D3.3 Far Infra-red Space Interferometer Critical Assessment
PU Page 17 Version 1
Figure 12: Transmission over an 8m path at sea level in the 25m (400cm-1) region.
Figure 13 shows the measured performance over the high frequency beam divider available for this work.
Figure 13: Measure data for the higher frequency beam divider developed for working in the 25m region.
5 Publications resulting from the work described
0
0.1
0.2
0.3
0.4
0.5
0.6
0.7
0.8
0.9
1
350 375 400 425 450 475 500 525 550
Tra
nsm
issi
on
Wavenumbers [cm-1]
0
0.1
0.2
0.3
0.4
0.5
0.6
0.7
0.8
0.9
1
0 50 100 150 200 250 300 350 400 450 500 550 600
Tra
nsm
issi
on
Wavenumber [cm-1]
FISICA Deliverable D3.3 Far Infra-red Space Interferometer Critical Assessment
PU Page 18 Version 1
None as yet.
6 References Grainger et al.,2012. A Demonstration of Spectral and Spatial Interferometry at THz. Applied Optics. Pascale et al., 2008. The Balloon-borne Large Aperture Submillimeter Telescope: BLAST. Astrophysics Journal, Volume 681, pp. 400-414.