Embed Size (px)
Citation preview

Fishing impact and environmental status in European seas: adiagnosis from stock assessments and ecosystem indicators
Didier Gascuel1, Marta Coll2, Clive Fox3, Sylvie Gu�enette4, J�erome Guitton1, Andrew Kenny5, Leyla Knittweis6,
J Rasmus Nielsen7, Gerjan Piet8, Tiit Raid9, Morgane Travers-Trolet10 & Samuel Shephard11
1Universit�e Europ�eenne de Bretagne, Agrocampus Ouest, UMR985 Ecologie et sant�e des �ecosyst�emes, 65 route de Saint
Brieuc, CS 84215, 35042, Rennes Cedex, France; 2UMR 212 Ecosyst�emes Marins Exploit�es (IRD/IFREMER/UM2),
Avenue Jean Monnet, BP 171, 34203, S�ete, France; 3Scottish Association for Marine Science, Scottish Marine Institute,
Oban, PA371QA, UK; 4Fisheries and Oceans Canada, 531 Brandy Cove, St Andrews, NB, Canada, E5B 2L9; 5CEFAS
Lowestoft Laboratory, Pakefield Road, Lowestoft, Suffolk, NR33 0HT, UK; 6Department of Biology, University of Malta,
Msida, MSD2080, Malta; 7National Institute of Aquatic Resources, Technical University of Denmark, Charlottenlund
Castle, Jaegersborg All�e 1, DK-2900, Charlottenlund, Denmark; 8IMARES, Haringkade 1, 1970, AB, Ijmuiden, The
Netherlands; 9Estonian Marine Institute, University of Tartu, M€aealuse 14, Tallinn, EE-12618, Estonia; 10IFREMER,
French Res Inst Exploitat Sea, Laboratory Fishery Resources, 150 quai Gambetta, BP699, 62321, Boulogne sur Mer,
France; 11School of Biological Sciences, Queen’s University Belfast, 97 Lisburn Road, Belfast, BT9 7BL, UK
AbstractStock-based and ecosystem-based indicators are used to provide a new diagnosis of
the fishing impact and environmental status of European seas. In the seven Euro-
pean marine ecosystems covering the Baltic and the North-east Atlantic, (i) trends
in landings since 1950 were examined; (ii) syntheses of the status and trends in
fish stocks were consolidated at the ecosystem level; and (iii) trends in ecosystem
indicators based on landings and surveys were analysed. We show that yields
began to decrease everywhere (except in the Baltic) from the mid-1970s, as a
result of the over-exploitation of some major stocks. Fishermen adapted by increas-
ing fishing effort and exploiting a wider part of the ecosystems. This was insuffi-
cient to compensate for the decrease in abundance of many stocks, and total
landings have halved over the last 30 years. The highest fishing impact took place
in the late 1990s, with a clear decrease in stock-based and ecosystem indicators.
In particular, trophic-based indicators exhibited a continuous decreasing trend in
almost all ecosystems. Over the past decade, a decrease in fishing pressure has been
observed, the mean fishing mortality rate of assessed stocks being almost halved in
all the considered ecosystems, but no clear recovery in the biomass and ecosystem
indicators is yet apparent. In addition, the mean recruitment index was shown to
decrease by around 50% in all ecosystems (except the Baltic). We conclude that
building this kind of diagnosis is a key step on the path to implementing an ecosys-
tem approach to fisheries management.
Keywords Ecosystem approach to fisheries management, ecosystem indicators,
good environmental status, Marine Strategy Framework Directive, stock assessment,
trophic level
Correspondence:
Didier Gascuel,
Agrocampus Ouest,
65 route de Saint
Brieuc, CS 84215,
35042 Rennes
Cedex, France
Tel.: +33 223 48 55
34
Fax: +33 223 48 55
35
E-mail: Didier.
Gascuel@
agrocampus-ouest.fr
Received 25 Feb
2014
Accepted 2 Jul 2014
© 2014 John Wiley & Sons Ltd DOI: 10.1111/faf.12090 1
F I SH and F I SHER I E S

Introduction 2
Material and methods 3
Marine ecosystems considered and data used 3
Landings and stock-based indicators 4
Ecosystem indicators calculated 5
Results 6
Long-term trends in landings 6
Stock-based indicators 9
Mean stock status and trajectories 10
Ecosystem indicators 11
Synthesis on trends over the last decade 15
Discussion 16
Building ecosystems diagnoses in support of a science-based EAFM 16
Using landing-based indicators 16
Using stock-based indicators and management targets 17
Using ecological indicators 18
Implementing an effective ecosystem approach to fisheries management 18
A global diagnosis on fishing impact in European seas 19
Conclusion 22
Acknowledgements 22
References 22
Supporting Information 25
Introduction
Since the publication of the Code of Conduct for
Responsible Fisheries (FAO 1995), the ecosystem
approach to fisheries management (EAFM) has
progressively been recognized as a necessity world-
wide. The concept aims at assessing the global
impact of fisheries on ecosystem functioning, while
taking into account the fact that fisheries are
embedded into the environment and cannot be
managed in isolation (Garcia et al. 2003; Pikitch
et al. 2004; Jennings and Rice 2011; Rice 2011).
More generally, the ecosystem approach to fisher-
ies management is the application of sustainable
development principles to the fishing sector, com-
bining ecological sustainability of stocks and eco-
systems, economic viability of the fishing industry,
and social viability and fairness for local commu-
nities as well as the broader society (Garcia and
Cochrane 2005; Gascuel et al. 2011a).
In the European Union, efforts to implement
the ecosystem approach to fisheries management
led to the definition of a reference list of nine eco-
system indicators (STECF 2006, 2007; European
Commission 2008a), with the objective of assess-
ing the fisheries impact not only on targeted
stocks, but also on fish communities, biodiversity,
seafloor integrity, population genetics, discarded
species and fishery fuel consumption. In recent
years, several authors and working groups under
the auspices of the International Council for
Exploration of the Sea (ICES) have used or devel-
oped these ecosystem indicators (Greenstreet et al.
2011, 2012; Shephard et al. 2011; Fung et al.
2012). Nevertheless, analyses of ecosystem
impacts of fisheries remained partial, covering
only some ecosystems with no associated stan-
dard monitoring in place at the pan-European
level.
Things have started to change recently with the
implementation of the Marine Strategy Framework
Directive (MSFD; European Commission 2008b) by
the European Commission. The overarching goal
of this directive is achieving good environmental
status across all European marine waters by
2020, based on 11 qualitative descriptors (Euro-
pean Commission 2010) and a set of associated
indicators that is still under development. While
the ecosystem approach first emerged in the con-
text of fisheries management, the MSFD now
requires its implementation in the wider context of
integrated management involving multiple sectors
beyond fisheries. The indicators initially proposed
for ecosystem approach to fisheries management
2 © 2014 John Wiley & Sons Ltd, F ISH and F ISHER IES
Fishing impact in European seas D Gascuel et al.

are now finding their way into the MSFD as both
share common sustainability goals.
Several working groups have been set up by
ICES and the European Commission to work on
this. In particular, the European Scientific Techni-
cal and Economic Committee for Fisheries (STECF)
has set up an expert working group on the ‘Devel-
opment of the Ecosystem Approach to Fisheries
Management in European Seas’, with the overall
objective of developing a feasibility approach to
provide useful advice on ecosystem status in sup-
port of the Common Fisheries Policy. In line with
the MSFD implementation, one of the main objec-
tives of this working group was to assess the
health of European ecosystems, using currently
available data.
This study presents the main 2013 results
from this working group. Our aim is to show
that stock-based and ecosystem-based indicators
can provide a complementary diagnosis on the
fishing impact and environmental status of Euro-
pean seas. Seven ecosystems covering the Baltic
and Atlantic European marine waters (West
Scotland and Ireland, Irish Sea, North Sea, Celtic
Sea, Bay of Biscay, Iberian Coast) were used as
case-studies. For each of them, (i) trends in
landings since 1950 were examined with the
objective of providing a comprehensive overview
of the dynamics of the whole fishery; (ii) inte-
grated syntheses of the status and trends in fish
stocks, derived from ICES assessments, were con-
solidated at the ecosystem level; and (iii) trends
in ecosystem indicators were analysed based on
available time series of landings and scientific
survey data.
Material and methods
Marine ecosystems considered and data used
This study considered seven European ecosystems
covering the Baltic and Atlantic waters of the
European seas (Fig. 1). These ecosystems refer to
the reference list of marine ecosystems defined
by the European Scientific Technical and Eco-
nomic Committee for Fisheries (STECF 2011)
which have to be considered as the functional
and assessment units used for the operational
implementation of the ecosystem approach to
fisheries management in European waters. These
STECF marine ecosystems are comparable with
the MSFD (sub)regions, but, according to the
marine eco-regions defined by ICES (2004), eco-
systems boundaries have been defined in order to
Figure 1 Study area and boundaries of the seven marine ecosystems considered as case-studies, according to STECF
2012.
© 2014 John Wiley & Sons Ltd, F I SH and F I SHER IES 3
Fishing impact in European seas D Gascuel et al.

match the divisions or subdivisions used for fish-
eries statistics and stock assessments.
A specific database was set up to compile the
various tables required for the current analysis:
1. The ICES Statlant database (www.ices.dk,
accessed April 2013) was used to analyse
trends in landings from 1950 to 2010. This
international database of fisheries landings is
coordinated by ICES and includes landings of
fish and shellfish from 20 countries, at the
spatial resolution of ICES divisions and subdivi-
sions. Landings were aggregated by ecosystem
according to the boundaries of the ecosystems
analysed. Until 1982, some landings were
reported for a pool of several ICES subdivisions
(referring to ICES areas VII, VIII or VIIde the
English Channel). These landings were distrib-
uted among ecosystems proportionally to the
mean landings of the two most recent decades.
This allocation has negligible effects on catch,
except in the Bay of Biscay. Therefore, land-
ing-based indicators were not calculated prior
to 1983 in the Bay of Biscay.
2. Data related to all stocks assessed by ICES
were used in order to build stock-based aggre-
gated indicators at the ecosystem level.
Catches, spawning stock biomass (SSB), fishing
mortality rate (F), recruitment (R), and refer-
ence values for F and SSB were extracted for
the 2012 single stock assessments from the
ICES website (www.ices.dk; accessed 30 April
2013). Until 2010, ICES used reference values
for fishing mortality and spawning stock bio-
mass based on the ‘precautionary approach’
as thresholds for sustainable exploitation (i.e.
Fpa and Bpa, to determine whether a stock is
within ‘safe biological limits’, thus avoiding
recruitment overfishing). According to the
commitments of the 2002 World Summit of
Sustainable Development (WSSD 2002, Johan-
nesburg), the MSFD, as well as the revised
Common Fisheries Policy, now aims for a sus-
tainable exploitation and new reference values
for fishing mortality, FMSY (i.e. the fishing
mortality assumed to produce the maximum
sustainable yield, thus avoiding growth overf-
ishing), were adopted. More precisely, the fish-
ing mortality of overexploited stocks should be
reduced to FMSY by 2015 ‘where possible’ and
for all stocks by 2020. As the previous refer-
ence value for fishing mortality (Fpa) was, in
practice, often treated as a target value (Piet
and Rice 2004) while the current and mark-
edly lower FMSY should be treated as a limit,
this should lead to a significant decrease in
fishing mortality and a subsequent increase in
SSB for almost all stocks. Therefore, the man-
agement of European fisheries is currently fol-
lowing a transition scheme, using the three
reference values Bpa, Fpa and FMSY. These val-
ues were extracted, when available, from the
ICES website and used in the current analysis.
For stocks not assessed in 2012, the last avail-
able assessment (from 2005 to 2011) was
considered. A total of fifty-seven assessed
stocks were included in the analyses (see the
list in the Supporting information). When a
stock occurred in several ecosystems, biomass
estimated from the assessment were allocated
in each ecosystem in the same proportions as
the mean 2000–2010 ratio of landings per
ecosystem.
3. Trawl survey data were extracted from ICES
DATRAS database (online DAtabase of TRAwl
Surveys, datras.ices.dk; accessed 30 March
2013) to calculate ecosystem indicators along
the longest standardized time series possible.
For consistency, demersal trawl surveys with a
similar protocol were selected for each ecosys-
tem (for instance, the time series selected for
the North Sea starts in 1983, the year in
which all areas of the ICES International
Bottom Trawl Survey were conducted with a
standardized GOV trawl gear). Only surveys
covering the larger part of the ecosystem were
considered (i.e. local coastal surveys were
excluded), using the stations located within
the studied ecosystem (see details on surveys
selection and data extraction in the Supporting
information). In the Celtic Sea, two surveys
occurred each year (France-Evho�e and UK-
WCGFS), using distinct sampling design, gears
and vessels. In this case, two different esti-
mates were calculated for each indicator.
Landings and stock-based indicators
ICES Statlant statistics were used to analyse
long-term trends in total landings of the seven
ecosystems. Times series of two indices of the
landed species diversity were calculated for each
ecosystem, based on the following:
1. The number of exploited species whose land-
ings were significant, that is, higher than a
4 © 2014 John Wiley & Sons Ltd, F ISH and F ISHER IES
Fishing impact in European seas D Gascuel et al.

minimum level, conventionally set equal to
0.5% of the mean annual total landings of the
last 10 years (i.e. 2001–10);
2. The Shannon’s diversity index (Shannon
1948): H0 = Σs [Ps�log2 (Ps)], where Ps is the
proportion in mass of species s in the yearly
total landings.
The proportion of exploited species covered by
stock assessments was computed for the 1950–
2010 period. It reflects current assessment-based
knowledge about the fishable fraction of the eco-
system. Then, for all stocks subjected to a stock
assessment, three indicators were estimated to pro-
duce a synthesis of multiple stock trajectories at
the ecosystem level: the total spawning stock bio-
mass, the mean fishing mortality and the mean
recruitment index. Recruitment indices were com-
puted per stock as the ratio of recruitment in year
y divided by the average recruitment of that stock
over the period where data for all species were
available. The mean fishing mortality and the
mean recruitment index were then averaged over
the number of species using a geometric mean.
For many ecosystems, there was only a rela-
tively short period during which data were avail-
able for all assessed stocks. By restricting the
number of stocks included in indicator calcula-
tions, longer (but less representative) time series
may be built. Therefore, within each ecosystem
and for all ecosystems combined, two indicators
were considered. The first one is related to all the
currently assessed stocks. The second one is based
on a subset of stocks, choosing a minimum of
60% of the assessed stocks allowing for the calcu-
lation of the longest possible but still sufficiently
representative, time series. Sensitivity analyses to
various subsets of the stocks considered are
included in the Supporting information.
The current status of assessed stocks and their
overall mean trajectory over time was summarized
within each ecosystem on a common graph in ref-
erence to what are considered the main aspects
of stock status, fishing mortality (F) and reproduc-
tive capacity (SSB). Two reference values were
considered for the fishing mortality: the point at
maximum sustainable yield (FMSY) and the precau-
tionary reference point (Fpa, which is in fact usu-
ally higher and thus less precautionary than
FMSY). For SSB, only the precautionary biomass
was used (Bpa) because BMSY is currently not con-
sidered as a threshold for stock management in
European waters and values are not available. For
all stocks for which FMSY, Fpa and Bpa limits were
estimated by ICES, the comparison of the assess-
ments (current F and SSB estimates) with associ-
ated reference points was presented following a
modified version of the synoptic method developed
by Garcia and De Leiva (2005). Thus, the current
F is compared to reference points (here FMSY and
Fpa) by estimating a normalized index of fishing
mortality as: F* = (Fcurrent�FMSY)/(Fpa�FMSY). It
should be stressed here that the resulting normal-
ized fishing mortality index F* is no longer propor-
tional to realized F, but rather it increases with
F. F* is conventionally set equal to 0 and 1, for
Fcurrent = FMSY and Fcurrent = Fpa, respectively.
Thus, it allows us to simultaneously assess stock
status in reference to both the ‘old’ Fpa and the
‘new’ FMSY reference values. The normalized bio-
mass only refers to Bpa and thus is expressed as
B* = (Bcurrent)/(Bpa). Trajectories in overall stock
status were obtained calculating the mean F* and
B* for each year (replacing Fcurrent by Fyear in pre-
vious equations) and for all assessed stocks (for
which target limits are known). These indicators
F* and B* allow for the representation of the cur-
rent status and the mean trajectory of assessed
stocks in a single graph (e.g. Figs 5 and 6).
Ecosystem indicators calculated
Four ecosystem indicators were calculated from
the survey data:
1. The large fish indicator (LFI) reflects the size
structure of the fish assemblage, which is
assumed to be primarily affected by size-selec-
tive exploitation but is mediated by species
composition (Shephard et al. 2012) as well as
the fishing-induced reduction of life expectancy
of each exploited species. This indicator was
calculated as: LFI = W>40 cm/Wtotal, where
W>40 cm is the weight of fish >40 cm in
length and Wtotal is the total weight of all
fish in the survey (Greenstreet et al. 2011;
see details on calculations in the Supporting
information).
2. The mean maximum length of fish (MML)
reflects the species composition of a fish
assemblage, where fishing is expected to
cause a decrease in the proportion of species
with large asymptotic body size, slow growth
rate, late age and large size at maturation
(Shin et al. 2005). This indicator was calcu-
lated according to ICES (2009) based on the
© 2014 John Wiley & Sons Ltd, F I SH and F I SHER IES 5
Fishing impact in European seas D Gascuel et al.

asymptotic total length of each species (L1s
from Fishbase; Froese and Pauly 2012; www.
fishbase.org; accessed 30 March 2013) as:
MML ¼ PðWs:L1sÞ=P
Ws, where Ws is the
total weight of species s caught during the
survey.
3. The mean trophic level (MTL) of all fish
caught during the survey indicates the effect
of fishing on the food web (Jiming 1982;
Pauly et al. 1998). It was calculated as:
MTL = Σ (TLs.Ws)/Σ Ws, where TLs is the
mean trophic level of species s (from Fishbase)
and Ws is the total weight of species s caught
during the survey.
4. The marine trophic index (MTI) reflects the
trophic structure of the fish assemblage where
fishing is expected to affect mostly the upper
part of the food web, that is, predatory fish. It
is defined as the mean trophic level of preda-
tory fish caught during each survey, taking
into account only species whose trophic level
is higher than or equal to 3.25 (Pauly and
Watson 2005).
As such, we refer to the large fish indicator
(LFI) and mean maximum length (MML) as
length-based indicators, while the mean trophic
level (MTL) and marine trophic index (MTI) are
trophic indicators even though strictly speaking
only the LFI captures changes in size structure
while the three others reflect only changes in spe-
cies composition, weighted by the species asymp-
totic total length (MML) or mean trophic level
(MTL and MTI).
To highlight trends rather than the short-term
variability, all indicators were smoothed using a
3-year moving average. For the Celtic Sea, mean
indicators were calculated by averaging estimates
from the two available surveys (Evhoe and UK
WCGFS). Mean indicators were also calculated for
all ecosystems together except the Iberian coast,
due to the very short time series available.
Because the surveys selected in the various ecosys-
tems did not cover the same time period, such a
calculation required a preliminary standardization
of each time series. This standardization was
obtained by rescaling the indicator series for each
given ecosystem to the mean value of this indica-
tor for all ecosystems over the 1997–2008 period,
which is common to all the selected surveys.
Ecosystem indicators were also calculated from
commercial fishery landings using the same equa-
tions (except LFI, because length frequencies were
not available for landings). In this case, the mean
trophic level (MTL) and the marine trophic index
(MTI) were calculated for all species landed,
including finfish and invertebrates. Trophic levels
of invertebrates were extracted from SeaLifeBase
(www.sealifebase.org; accessed 30 March 2013)
or, when not available, conventionally assumed
equal to 2.6 (Gu�enette and Gascuel 2012).
Trophic-based indicators were shown to be sen-
sitive to the value of the trophic levels used for the
top-level species (Branch et al. 2010). Thus, sensi-
tivity analyses were conducted, either changing
the TL of cod (according to Branch 2012) or using
TLs from local Ecopath models. Detailed results of
these analyses are presented in the Supporting
information and briefly summarized below. It
should also be stressed that landing-based indica-
tors are supposed to reflect ecosystem structure
but may be biased by changes in fishing activities,
involving gear selectivity (e.g. by technical creep
or substitution of gear) or spatial distribution
caused by the availability of quota. Thus, from a
theoretical point of view, indicators based on sur-
veys are preferred for unbiased analysis of fishing-
induced changes in ecosystem health. However,
because in practice surveys only consider a subset
of the fish community (i.e. often demersal finfish)
and cover a relatively short period, complementary
indicators based on landings can be applied to put
the survey-based information in a longer-term and
broader perspective.
Results
Long-term trends in landings
Total landings in European seas increased from
3 million tonnes in the early 1950s to more than
7.2 million in the mid-1970s (Fig. 2). Since that
period, landings have been decreasing, slowly until
the mid-1990s but accelerating during the last
period, falling to 4.3 million tonnes in 2010. In
the North Sea, which is by far the most important
fishing area in Europe, yield declined by >50%over this period, from almost 4 million tonnes in
the turn of the 1970s to around 1.7 million ton-
nes during the most recent years. The same trends
were observed in almost all the considered Euro-
pean ecosystems, with landings peaking during
the 1970s and strongly declining afterwards: from
160 000 to 60 000 tonnes in the Irish sea, from
780 000 to 450 000 tonnes in the Celtic Sea,
6 © 2014 John Wiley & Sons Ltd, F ISH and F ISHER IES
Fishing impact in European seas D Gascuel et al.

from 350 000 to 130 000 tonnes in the Bay of
Biscay and from 740 000 to <400 000 in the
Iberian coast marine ecosystem.
Only two ecosystems exhibited a different pat-
tern. In the Baltic Sea, landings were close to
1 million tonnes during the 1970s, peaked above
this value in the mid-1990s, before slightly
decreasing to <0.8 million during the last
10 years. In the West of Scotland and Ireland,
landings increased over almost the entire period,
reaching a maximum of 1.4 million tonnes in
2006, before being halved in the most recent
years. This particular trend was due to a single
species, the blue whiting (Micromesistius poutassou,
Gadidae), whose exploitation started in deeper
waters in 1975, increased in the 1990s, reached
1.1 million tonnes in 2006 and subsequently
declined. In this ecosystem, the total landings of
other species followed a more common pattern
with a maximum in the 1980s (around 700 000
tonnes) decreasing to about 50% at present.
The EU is by far the dominant fishing operator
within European seas. In the considered ecosys-
tems, more than 80% of the total landings were
caught by EU Member States, landings by non-EU
countries being significant only in the North Sea
(mainly due to Norway), the West Scotland and
Ireland (mainly due to Iceland), and the Baltic Sea
Land
ings
(103 t
onne
s)
0
2000
4000
6000
8000All ecosystems
0
200
400
600
800
1000
1200Baltic Sea
0
1000
2000
3000
4000North Sea
0
400
800
1200
West Scotland/Ireland
0
40
80
120
160Irish Sea
0
200
400
600
800Celtic Sea
0
100
200
300
Bay of Biscay
0
200
400
600
800
1950 1960 1970 1980 1990 2000 2010 1950 1960 1970 1980 1990 2000 2010
Iberian Coast
year
Figure 2 Trends in annual landings (thousand tonnes) in 1950–2010 from European (in light grey) vs. non-European
(dark grey) countries and catch time series (black line) derived from stock assessments in the seven marine ecosystems
and for all ecosystems considered together.
© 2014 John Wiley & Sons Ltd, F I SH and F I SHER IES 7
Fishing impact in European seas D Gascuel et al.

prior to 1990 (mainly due to the former Soviet
Union and Poland).
The share of landings from stocks assessed by
ICES increased over the studied period, reaching
approximately 90% of the total landings since the
1980s, in the three northern ecosystems: the Bal-
tic Sea, the North Sea, and the West of Scotland
and Ireland (note that, in certain years, catches
used by ICES scientists were even greater than offi-
cial catches from the ICES Statlant database and
that most ICES assessments consider discards and
potential unreported landings as well as potential
reallocation of landings between areas or between
species). In contrast, stock assessments cover a
smaller part of the total landings in the four
southern ecosystems further decreasing over the
most recent years, from about 60% in the 1980s
or 1990s to around 40% today.
The decrease in catch observed in almost all the
studied ecosystems over the last three or four
decades occurred while new species started to
be exploited intensively. This was especially the
case for sandeels (Ammodytes marinus, Ammodyti-
dae, more than 1 million tonnes in the North Sea),
Norway pout (Trisopterus esmarkii, Gadidae), mack-
erel (Scomber scombrus, Scombridae), horse mackerel
(Trachurus trachurus, Carangidae) and for some crus-
taceans and molluscs. More generally, the landings
diversity indices show that a progressively greater
proportion of each ecosystem was exploited over the
period (Fig. 3). The number of species significantly
exploited within each ecosystem peaked in the
1980s for the Irish Sea and West Scotland/Ireland
ecosystems, in the 1990s for the Celtic Sea and the
Iberian Coast ecosystems, and in the 2000s for the
North Sea and the Bay of Biscay ecosystems. On
average, the number of species significantly
exploited jumped from 8 in 1950 to almost 24 in
the late 1990s. At the same time, the Shannon’s
diversity index (H) increased from 2.8 to 3.7. In
other words, the increase in catch observed in the
1950s and 1960s progressively included more
exploited species, and landings became more diverse.
This process continued until the mid- or late 1990s,
while catches declined, suggesting fishermen tried to
compensate for their losses by the exploitation of
new resources. In the most recent years, the H
diversity index remained high, while the number of
exploited species slightly decreased, with landings of
some species declining below the minimum level
0
10
20
30
40
Num
ber
of e
xplo
ited
spe
cies
Baltic
North Sea
West Sco/Ir.
Irish Sea
Celtic Sea
Biscay
Iberian C.
MEAN
1.0
2.0
3.0
4.0
5.0
Shan
non
dive
rsit
y in
dex
1950 1960 1970 1980 1990 2000 2010 1950 1960 1970 1980 1990 2000 2010
year
(a) (b)
(c) (d)
Figure 3 Trends in the indices of landings diversity. (a) and (b): number of exploited species (for which landings are
higher than 0.5% of the mean 2001–10 yearly total landing). (c) and (d): Shannon’s diversity index (H).
8 © 2014 John Wiley & Sons Ltd, F ISH and F ISHER IES
Fishing impact in European seas D Gascuel et al.

considered in the index calculation. The general pat-
tern of an increasing diversity of catch until the
1990s is observed in all ecosystems, with the excep-
tion of the Baltic Sea, and to a lesser extent of the
West of Scotland and Ireland. In the first case, diver-
sity remained very low and decreased slightly since
the early 1970s, while in the second case, the
predominance of the blue whiting starting in the
1980s reduced the diversity of landings.
Stock-based indicators
In the seven ecosystems considered, the fishing mor-
tality index, reflecting mean fishing pressure on the
assessed stocks, exhibited high values in the 1990s
and a clear decreasing trend over the last 12 years.
On average, for all the 57 available assessed stocks
together, fishing mortality increased from 0.45 in
the mid-1980s to almost 0.55 in 1998 and then
decreased to approximately 0.30 by 2010 (Fig. 4,
left column). Results appeared very consistent for all
time series (i.e. either for short time series with all
stocks or for longer time series based on fewer
stocks). The same decreasing trend in fishing mor-
tality was observed in all the studied ecosystems,
with lower values around 0.25 at the end of the
time series in the North Sea, the Celtic Sea and the
Iberian coast. In the Baltic Sea, moderate fishing
Fishing mortality Stock Spawning Biomass Recruitment index
All
stoc
ksB
altic
Sea
Nor
th S
eaW
.Sco
t./Ir.
Irish
Sea
Cel
tic S
eaB
isca
yIb
eria
n c.
0
5000
10000
15000
0
1000
2000
3000
0
2000
4000
6000
0
2000
4000
0
20
40
60
0
500
1000
1500
2000
0
200
400
0
500
1000
year
0.3
0.4
0.5
0.3
0.4
0.5
0.2
0.3
0.4
0.5
0.6
0.2
0.3
0.4
0.5
0.2
0.4
0.6
0.8
0.3
0.4
0.5
0.1
0.2
0.3
0.4
0.5
0.1
0.2
0.3
0.4
0.5
1.0
0.5
1.0
1.5
0.5
1.0
1.5
0.5
1.0
1.5
1
2
1.0
1.5
0.5
1.0
1.5
19701970 1980 1990 2000 20101970 1980 1990 2000 2010 1980 1990 2000 2010
0.5
1.0
1.5
(a) (b) (c)
Figure 4 Trends in stock-based indicators: mean fishing mortality F (column a, in year�1), total spawning stock biomass
SSB (column b, in thousand tonnes) and the mean recruitment index R (column c, relative value to the 1990–2000
average), for all the 57 stocks assessed by ICES in European seas (first line) and by ecosystem. (The red line refers to all
stocks assessed in 2012, while the blue line is the longest available time series including at least 60% of assessed stocks).
© 2014 John Wiley & Sons Ltd, F I SH and F I SHER IES 9
Fishing impact in European seas D Gascuel et al.

mortalities around 0.35 were already observed in
the 1980s and the recent decrease is a return to
this rather moderate level following a high fishing
mortality period in the late 1990s. In all other eco-
systems, fishing mortalities were lowest in the most
recent years of the available time series. Note that
in the Bay of Biscay, several important stocks (cod
Gadus morhua, Gadidae, anglerfish Lophius spp.,
Lophiidae) were not assessed for the most recent
years, thereby leading to reduced knowledge over
this period for this ecosystem.
Trends in stock abundances, based on spawning
stock biomass time series (SSB), fluctuated between
10 and 14 million tonnes over the period, decreas-
ing from the late 1980s to the mid-1990s, increas-
ing until the mid-2000s and decreasing again in
the most recent years (Fig. 4, middle column). This
index was driven by a small number of large
stocks, with contrasting trends between ecosys-
tems. Blue whiting is the main stock driving
changes observed in the West Scotland/Ireland
ecosystem, with an SSB peaking in the mid-2000s
before declining. Horse mackerel was especially
abundant in the late 1980s, inducing an increase
in the overall assessed SSB for the Celtic Sea and
the Bay of Biscay. In the last 10 years, when the
fishing pressure was decreasing, an overall increase
in SSB was only observed in the North Sea, essen-
tially due to the recovery of plaice and herring.
The Irish Sea, the Celtic Sea and the Bay of Biscay
exhibited an increasing trend in SSB while remain-
ing at low levels compared to earlier periods. On
the Iberian coast, SSB continued to decline reach-
ing its lowest values at the end of the period.
In contrast, recruitment indices exhibited a con-
sistently decreasing trend. On average for all
assessed stocks together the mean recruitment has
approximately halved since the mid-1980s (Fig. 4,
right column). The same trend was observed with
the same order of magnitude in all the studied eco-
systems, with the only exception being the Baltic
Sea, where recruitment fluctuated with no clear
trends. In the North Sea, the West of Scotland and
Ireland, and the Irish Sea the decrease occurred
over a long period, apparently starting from the
1980s. In the Celtic Sea and the Bay of Biscay, the
decline was only observed during the last decade.
Mean stock status and trajectories
ICES has estimated single stock-based reference
levels for 21 European assessed stocks (represent-
ing 34% of the total 2010 landings). Among
these, nine stocks met the current ICES manage-
ment targets, with biomass above Bpa and a fish-
ing mortality below the FMSY level (Fig. 5). This is
the case for plaice (Pleuronectes platessa, Pleuro-
nectidae) in the North Sea and the Irish Sea, had-
dock (Melanogrammus aeglefinus, Gadidae) in the
North Sea and Western waters (Rockall), saithe
(Pollachius virens Gadidae) in the North Sea, Baltic
herring (sub-div.30) (Clupea harengus, Clupeidae),
and cod and sole (Solea vulgaris, Soleidae) in the
Celtic sea. In contrast, eleven stocks failed to meet
the requirements of the ‘past’ precautionary
approach, with biomass lower than Bpa and/or
fishing mortalities higher than Fpa. This especially
applies for four strongly depleted stocks (i.e. bio-
mass lower than 0.5 9 Bpa): sole in the Irish Sea,
and cod in the North Sea, Irish Sea, and West
Scotland and Ireland. The criterion for reproduc-
tive capacity Bpa was not met by three additional
stocks (West of Scotland haddock, and the North
Sea and Skagerrak stocks of sole), while four oth-
ers exhibited fishing mortalities higher than Fpa[the Baltic cod (sub-div.22–24) and herring (riga),
and the Biscay and the East Channel stocks of
sole]. Finally, one stock (West Channel plaice) met
the requirements of the precautionary approach
(Fpa and Bpa) but not the FMSY criterion. It can
also be noted that among the 21 assessed stocks,
a majority exhibited low biomass with seven
stocks below the precautionary level Bpa and seven
additional stocks close to that level (between 1.0
and 1.3 Bpa).
The trajectory of average fishing mortality of
these assessed stocks confirmed that fishing mor-
talities were very high in the 1980s and 1990s,
with mean values above Fpa (Fig. 6). Starting in
the early 2000s, fishing mortality decreased and
the mean value has been between Fpa and FMSY
since 2008 and very close to FMSY in 2011 (but
based on only 16 stock assessments). In spite of
this, no increase was observed in the mean spawn-
ing biomass of these stocks which remains at a
low level, close to Bpa and thus far below BMSY. A
similar trajectory was observed in the North Sea,
with a current mean fishing mortality between Fpaand FMSY and biomass decreasing over the most
recent years and currently very close to Bpa. In
the West of Scotland and Ireland and in the Celtic
Sea, the FMSY target was reached in 2011 (mean F
below FMSY), but the mean spawning biomass of
assessed stocks remained very low, still decreasing
10 © 2014 John Wiley & Sons Ltd, F ISH and F ISHER IES
Fishing impact in European seas D Gascuel et al.

and below Bpa in the former, slightly increasing
and above Bpa in the latter. The three Irish Sea
stocks showed mean fishing mortality fluctuating
above Fpa, while the mean SSB decreased to below
Bpa from the late 1990s onwards and was still
very close to that level in 2011. Once again, the
Baltic Sea exhibited a different pattern, with mean
fishing mortality fluctuating markedly, with mod-
erate values occurring in the early 1990s, higher
levels in the 2000s and current mean fishing
mortality between Fpa and FMSY.
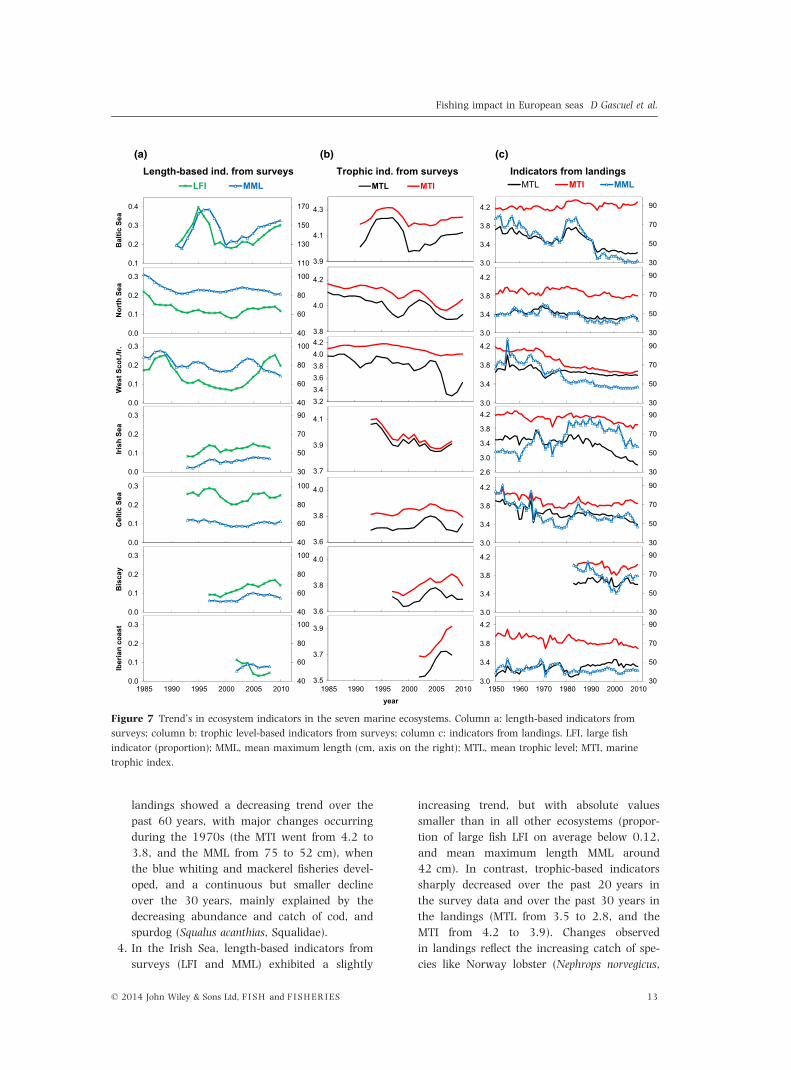
Ecosystem indicators
Ecosystem indicators exhibited contrasting trends
among ecosystems (Fig. 7).
1. In the Baltic Sea, where the biodiversity is
lower (Narayanaswamy et al. 2013), indica-
tors based on demersal surveys were mainly
driven by cod abundance. Thus, higher values
observed for all indices between 1990 and
1996 may be attributed to a temporary
increase in cod recruitment after the 1993
inflow event, while the increase occurring
from about 2006 can be attributed to a recent
overall increase in cod recruitment. Landing-
based indicators provide a broader picture tak-
ing into account demersal and pelagic species
and a longer period starting in 1950. A clear
and strong decreasing trend is observed over
the whole period in the mean trophic level
index (MTL went from 3.7 to 3.2) and in the
mean maximum length (MML went from more
than 70 cm to around 30 cm). This trend is
mostly driven by a decrease in cod landings
(representing almost 50% of total landings in
the 1950s and <10% in the 2000s) and by
the huge increase in sprat landings (from <5%
to more than 50% of total landings). An
increase in landings was also observed for
some other low trophic level species, such as
bivalves (e.g. mussel Mytilus edulis, Mytilidae,
and common roach Rutilus rutilus, Cyprini-
dae), while landings of whiting (Merlangius
merlangus, Gadidae) – a high TL species –
decreased over the period. Note that the high
cod recruitment occurring in the early 1980s
temporarily interrupted the long-term decrease
of the two indices, which accelerates in the
following years. In this ecosystem, landings
cod-2224
cod-347d
cod-7ek
cod-iriscod-scow
had-34
had-rock
had-scow
her-30
her-riga
ple-echw
ple-iris
ple-nsea
sai-3a46sol-bisc
sol-celt
sol-eche
sol-iris
sol-kasksol-nsea
whb-comb
Fmsy Fpa
Bpa
2*Bpa
0
Increasing fishing mortality F
Incr
easi
ng S
tock
bio
mas
s SS
B
Standardized fishing mortality F*
Stan
dard
ized
sto
ck b
iom
ass
B*
Figure 5 Current status of all assessed stocks, in relation to fisheries advice and management targets Bpa, Fpa and
FMSY. Note that only 21 stocks having associated target limits were considered here. On these graphs, the horizontal
line labelled ‘Bpa’ refers to B* equal to 1 (B* = Bcurrent/Bpa), while the vertical lines labelled ‘FMSY’ and ‘Fpa’ refer to F*
equal to 0 and 1, respectively [F* = (Fcurrent�FMSY)/(Fpa�FMSY)]. The white sector relates to situations where the ‘new’
FMSY management targets are met, the dark grey indicates stocks that do not follow the former ‘precautionary
approach’, and light grey indicates stocks falling between the ‘old’ Fpa and the ‘new’ FMSY targets.
© 2014 John Wiley & Sons Ltd, F I SH and F I SHER IES 11
Fishing impact in European seas D Gascuel et al.

having high TL comprise almost exclusively
cod, explaining why the marine trophic index
MTI was remarkably stable over the whole
period.
2. In the North Sea, length-based indicators from
surveys (LFI and MML) decreased between
1985 and 1993 and have remained at a low
level over the last twenty years, suggesting
that the ecosystem is now dominated by small
fish and other small species. The mean trophic
level estimated from surveys decreased over
the whole period (the MTL went from 4.1 to
3.9), but with a large year-to-year variability
masking the trend over the most recent years.
Indicator values based on landings decreased
slightly during the 1970s and 1980s (the
mean trophic level MTL went from 3.4 to 3.3,
and the mean maximum length MML from 50
to 40 cm), at a time when a larger part of the
ecosystem started to be exploited with an
increasing catch of sandeel, mackerel and
sprat (Sprattus sprattus, Clupeidae). The marine
trophic index fluctuated at about 3.9 from
1950 to the mid-1980s with lower values at
3.8 for the last 20 years. Such a change can
be explained by decreasing abundance and
landings of cod, but also of other high trophic
level species such as whiting and anglerfish.
3. The West Scotland and Ireland ecosystem is
the only one where the large fish indicator LFI
exhibited a clear increase over the most recent
period. This indicator was largely driven by
the stock status of saithe, which collapsed in
the early 1990 before recovering. This survey
also moved into deeper water in more recent
years, possibly introducing a bias towards lar-
ger fish. In contrast, other indicators based on
surveys exhibited a consistent decline since the
1980s accelerating in recent years (mean
maximum length MML from 90 to 70 cm, and
the mean trophic level MTL from 4.0 to 3.4),
while the marine trophic index only slightly
decreased over the last decade (MTI from
almost 4.2 to 4.0). This trend reflects the
decreasing abundance of large fish predators
such as cod and whiting. Indicators based on
1984 1986
19891998
2001
20032004
2006
2010
North Sea (8 stocks, 29.9 %)
1991
1995199920002001
200320042006
20102009
2011
Fmsy Fpa
Bpa
2*Bpa
0
West Scot./Irel. (5 stocks, 74.6 %)
19701972
19781980
19851987
1989
19901992
199720001999
20032009
Fmsy Fpa
Irish Sea (3 stocks, 3.1 %)
82 86 1990
1995
1998
20032004
20092010
2011
Fmsy Fpa
Cel c Sea (4 stocks, 13.1 %)
1991
19992000
200220032004
2006200820092010
2011
Bpa
2*Bpa
0
All stocks
19771978
19841985
198719891990
1993
1994
1997
19982001
20072008
2009
Bal c Sea (3 stocks, 40.8 %)
Stan
dard
ized
bio
mas
s B
*
Standardized fishing mortality F*
Figure 6 Mean temporal trajectories of assessed stocks within each of the studied ecosystems and for all European seas.
The white sector relates to situations where the FMSY management targets are met, the dark grey indicates stocks that
do not follow the former ‘precautionary approach’, and light grey indicates stocks falling between FMSY and Fpa targets.
Only stocks for which target limits are known are considered (the Bay of Biscay and Iberian coast are not displayed
because targets were only known for one stock); the percentage indicated for each ecosystem refers to the part of the
ecosystem landings due to stocks considered on the graph.
12 © 2014 John Wiley & Sons Ltd, F ISH and F ISHER IES
Fishing impact in European seas D Gascuel et al.
landings showed a decreasing trend over the
past 60 years, with major changes occurring
during the 1970s (the MTI went from 4.2 to
3.8, and the MML from 75 to 52 cm), when
the blue whiting and mackerel fisheries devel-
oped, and a continuous but smaller decline
over the 30 years, mainly explained by the
decreasing abundance and catch of cod, and
spurdog (Squalus acanthias, Squalidae).
4. In the Irish Sea, length-based indicators from
surveys (LFI and MML) exhibited a slightly
increasing trend, but with absolute values
smaller than in all other ecosystems (propor-
tion of large fish LFI on average below 0.12,
and mean maximum length MML around
42 cm). In contrast, trophic-based indicators
sharply decreased over the past 20 years in
the survey data and over the past 30 years in
the landings (MTL from 3.5 to 2.8, and the
MTI from 4.2 to 3.9). Changes observed
in landings reflect the increasing catch of spe-
cies like Norway lobster (Nephrops norvegicus,
Length-based ind. from surveysLFI MML
Trophic ind. from surveysMTL MTI
Indicators from landingsMTL MTI MML
Bal
tic S
ea
110
130
150
170
0.1
0.2
0.3
0.4
3.9
4.1
4.3
30
50
70
90
3.0
3.4
3.8
4.2
Nor
th S
ea
40
60
80
100
0.0
0.1
0.2
0.3
3.8
4.0
4.2
30
50
70
90
3.0
3.4
3.8
4.2
Wes
t Sco
t./Ir.
40
60
80
100
0.0
0.1
0.2
0.3
3.23.43.63.84.04.2
30
50
70
90
3.0
3.4
3.8
4.2
Irish
Sea
30
50
70
90
0.0
0.1
0.2
0.3
3.7
3.9
4.1
30
50
70
90
2.6
3.0
3.4
3.8
4.2
Cel
tic S
ea
40
60
80
100
0.0
0.1
0.2
0.3
3.6
3.8
4.0
30
50
70
90
3.0
3.4
3.8
4.2
Bis
cay
40
60
80
100
0.0
0.1
0.2
0.3
3.6
3.8
4.0
30
50
70
90
3.0
3.4
3.8
4.2
Iber
ian
coas
t
40
60
80
100
0.0
0.1
0.2
0.3
3.5
3.7
3.9
30
50
70
90
3.0
3.4
3.8
4.2
1985 1990 1995 2000 2005 2010 1985 1990 1995 2000 2005 2010 1950 1960 1970 1980 1990 2000 2010year
(a) (b) (c)
Figure 7 Trend’s in ecosystem indicators in the seven marine ecosystems. Column a: length-based indicators from
surveys; column b: trophic level-based indicators from surveys; column c: indicators from landings. LFI, large fish
indicator (proportion); MML, mean maximum length (cm, axis on the right); MTL, mean trophic level; MTI, marine
trophic index.
© 2014 John Wiley & Sons Ltd, F I SH and F I SHER IES 13
Fishing impact in European seas D Gascuel et al.

Nephropidae) but also the decreasing trend in
abundance and catch of cod, whiting, saithe
or hake (Merluccius merluccius, Gadidae). The
mean maximum length MML from landings
increased around 1980 mainly due to the
collapse of herring.
5. In the Celtic Sea, the large fish indicator LFI
seemed to slightly increase over the last dec-
ade (in contrast to the results of Shephard
et al. (2013), which were based only on the
UK WCGFS survey). All other ecosystem indi-
cators based on surveys remained stable over
the study period (1993–2010), showing no
clear sign of recovery that may be attributed
to the observed decrease in fishing pressure.
This relative stability is put in perspective by
complementary landing-based indicators, sug-
gesting that major changes already occurred
in this ecosystem before the beginning of sci-
entific surveys, with very strong decreases
from 1950 to the late 1970s (the mean tro-
phic level MTL went from 3.9 to 3.6, and the
mean maximum length MML from 85 to
45 cm) and subsequently stabilizing at low
levels.
6. In the Bay of Biscay, indicators were only
available for a relatively short period (1997–
2010). A slight increase was observed in
length-based indicators from surveys (the
LFI went from 0.09 to 0.15, and the MML
from 52 to 56 cm), while trophic indicators
remained stable. Time series of indicators
based on landings was also shorter compared
to other ecosystems. Since the mid-1980s,
mean trophic levels appeared to be stable,
while the marine trophic index and the mean
maximum length of landed fish decreased
around 2000, mainly driven by increased
catches of horse mackerel.
7. On the Iberian coast, available time series of
surveys was even shorter (from 2002 to
2008), and hence, it is difficult to draw con-
clusions on indicator trends. In contrast, indi-
cators from landings were available since the
1950s. Mean trophic level and mean maxi-
mum length remained rather constant over
the whole period, exhibiting the lowest values
(about 3.4 and 43 cm, respectively) of all eco-
systems analysed in this study. The marine
trophic index decreased (from 4.0 to 3.7)
reflecting changes in landing composition,
with hake landings in particular decreasing
due to over-exploitation, and more blue
whiting or mackerel caught over time.
In summary, despite of the difference in
magnitude between ecosystems, a long-term over-
all decline in the landing-based indicators was
observed across all assessed European seas (Fig. 8).
Thus, since 1950, the mean trophic level of land-
ings has declined from 3.7 to 3.3, while the mar-
ine trophic index decreased on average from more
than 4.0 to about 3.8. This trend is not modified
when indicators are calculated using values of tro-
phic levels from local Ecopath models, instead of
the standard values from Fishbase (see detailed
results of the sensitivity analyses in the Supporting
information). Over the same period, the overall
index of mean maximum length decreased from
68 to 49 cm. In other words, landings from Euro-
pean Seas progressively became dominated by
smaller species and lower trophic levels.
Even if calculated over a shorter period, indica-
tors based on surveys showed that the decrease in
landings was not only related to putative changes
in fishing strategy, but also to observed ecosystem
change. The global trophic-based indicators con-
firmed a deterioration of the community structure
of the ecosystems from 1985 to 2010 (MTL
decreased from 4.05 to 3.80 and MTI dropped
from almost 4.1 to <4.0). This decrease had an
impact on all the five ecosystems where time series
started before 1995, with the only exception being
the Baltic Sea. Length-based indicators from sur-
veys exhibited some similarities in their trends
over the period. From the start of the time series,
both showed an initial strong decline (MML 90 to
74 cm, LFI 0.27 to 0.12) reaching a minimum in
the early 1990s (MML) or early 2000s (LFI) after
which the MML fluctuated below 80 cm while the
LFI increased to 0.20 in 2010. This improving
trend of the large fish indicator LFI over the last
decade was clearly observed in the Bay of Biscay,
but also to a lesser extent in the North Sea, the
Irish Sea and the Celtic Sea.
It should be stressed that survey-based ecosystem
indicators calculated for all ecosystems together are
highly correlated with landing-based indicators
(r = 0.77, 0.92 and 0.80 for MML, MTL and MTI,
respectively). At the ecosystem level, a positive
correlation was observed in nine of 21 cases
(P < 0.05; see Table S4 in the Supporting informa-
tion). Importantly, the recent declines in fishing
mortality may only have resulted in an overall
recovery of the fish community size structure,
14 © 2014 John Wiley & Sons Ltd, F ISH and F ISHER IES
Fishing impact in European seas D Gascuel et al.

while all other ecosystem indicators continue to
decline.
Synthesis on trends over the last decade
The global picture of recent indicator trends
(Fig. 9) highlighted several points:
1. The decrease in mean fishing mortality rates
was significant in the seven European ecosys-
tems considered in the study. The same trend
was observed for nominal fishing effort when
data were available; in particular fishing effort
in terms of kw*fishing day approximately
halved between 2002 and 2010 for the North
Sea, the Irish Sea, and the West of Scotland
and Ireland (data from STECF 2012). Landings
also decreased in all ecosystems.
2. With the exception of the Baltic Sea, the
decrease in the mean recruitment index was
significant in all ecosystems.
3. The spawning biomass of assessed stocks
increased in several ecosystems, but remained
at low levels (especially in the North Sea, the
Irish Sea, and the West Scotland and Ireland),
and is still decreasing on the Iberian coast. On
the other hand, the large fish indicator (LFI)
seemed to improve in several ecosystems, sug-
gesting that the size structure of exploited stocks
has started to recover. The observed decrease in
recruitment may have counterbalanced the
benefit expected from the release of the fishing
pressure, leading to almost stable total biomass.
4. Even when the total biomass of assessed stocks
was increasing, several ecosystem indicators
60
70
80
90
0.0
0.1
0.2
0.3
Mea
n m
ax. l
engh
t
Larg
e fis
h in
dica
tor
LFI MML
3.7
3.9
4.1
1985 1990 1995 2000 2005 2010
Trop
hic
leve
l
MTL MTI
30
40
50
60
70
80
3.2
3.4
3.6
3.8
4.0
1950 1960 1970 1980 1990 2000 2010M
ean
max
. len
ght
Trop
hic
leve
l
MTL MTI MML
year
(a)
(b)
(c)
Figure 8 Mean trends in ecosystem indicators: (a) length-based indicators from surveys, (b) trophic level-based
indicators from surveys, (c) indicators from commercial fishery landings. LFI, large fish indicator (proportion); MML,
mean maximum length (cm); MTL, mean trophic level; MTI, marine trophic index. (Dot lines in graph c relate to the
sensitivity analysis, using trophic levels from local Ecopath models in place of standard values from Fishbase; see
Supporting information).
© 2014 John Wiley & Sons Ltd, F I SH and F I SHER IES 15
Fishing impact in European seas D Gascuel et al.

still declined suggesting ongoing degradation
in ecosystem health. This suggests that the
observed decrease in fishing pressure has not
been sufficient or is still too recent to allow
recovery of ecosystems from a depleted state,
especially in terms of species composition and
trophic biodiversity.
5. Some contrasts do exist within ecosystems. In
particular, based on the available indicators,
the Bay of Biscay ecosystem seems in better
shape or showed stronger improvement than
others. In contrast, many indicators exhibited
deteriorating trends in the West of Scotland
and Ireland ecosystem. However, due to the
relatively limited availability of data in the Bay
of Biscay and the Iberian Sea compared with
the northern areas, this conclusion is cautious.
6. More data and/or longer time series are avail-
able in the northern European seas (in the
Baltic Sea, North Sea, and West Scotland and
Ireland). In particular, indicators based on
stock assessments (i.e. fishing mortality F,
spawning stock biomass SSB, recruitment R
and sustainable fishing mortality index F*) can
be considered representative of the whole fished
fraction of ecosystems. In contrast, most land-
ings in other ecosystems are related to non-
assessed stocks and are thus not included in
some of our analyses due to data availability.
Discussion
Building ecosystems diagnoses in support of a
science-based EAFM
Using landing-based indicators
To implement an Ecosystem Approach to Fisheries
Management (EAFM), an assessment of the status
of marine ecosystems and of temporal change is
required. In order to draw valid conclusions, the
longest time series available should be considered
(Gu�enette and Gascuel 2012). In the European
seas, it emerged that surveys alone are not suffi-
cient to build diagnoses on ecosystem health, as
they only describe a relatively short period before
which the system was already impacted and major
changes had occurred. Catch or landing statistics
are available over a longer period, but using such
data to infer information about stock abundance
or ecosystems health has been strongly debated
among fisheries scientists (Branch et al. 2011; Car-
ruthers et al. 2012; Pauly et al. 2013). Some of
the observed changes since World War II reflect
adaptations by the industry, either to ecological
change (including that induced by fishing), con-
sumer habits or markets. Changes also reflect
developments in gear technology, which have
allowed the emergence of new fisheries, for
instance in deeper waters. Also, management and
Figure 9 Summary of trends over the last 10 years in the main indicators of ecosystem health in the seven ecosystems
considered: total landings Y, fishing effort E, mean fishing mortality rate F, total stock spawning biomass SSB, mean
recruitment index R, index of mean sustainable fishing mortality F*, survey large fish indicator LFI, mean maximum
length MML from surveys or from landings, mean trophic level MTL from surveys or from landings, % of landings due
to assessed stocks. Green and red symbols refer to positive and negative trends, respectively (i.e. improving or
deteriorating stocks status), while black arrows refer to uninterpretable changes in trend (landings might for instance
decrease either because F or B decreases).
16 © 2014 John Wiley & Sons Ltd, F ISH and F ISHER IES
Fishing impact in European seas D Gascuel et al.

regulations as well as discarding practices have a
significant impact on landings. Such changes
may have a substantial impact on catch rates
(Marchal et al. 2006) and can thus cause bias in
any landing-based indicator. In other words,
some caution is required when interpreting catch
or landing reconstructions and inferring changes
over time since the latter may be influenced by
both the species and the fleet segments included
in the analysis (Essington et al. 2006; Thurstan
and Roberts 2010; Heath and Speirs 2011).
Nevertheless, landings reconstruction provides a
long-term perspective on exploitation history,
which has to be kept in mind when attempting to
assess ecosystem health in a more recent period
of time. In European seas, landings showed that
major changes took place from the 1950s to
the 1970s, before contemporary scientific surveys
started.
Using stock-based indicators and management targets
Examining aggregated metrics based on formal
stock assessment results was another important step
in our approach towards an ecosystem approach
to fisheries management. Using the results of sin-
gle-species stock assessments may not be perceived
as the most obvious contribution to an ecosystem
approach, but has also been recently applied in
the North Sea and Celtic Seas (Gascuel et al.
2012, Shephard et al. 2014). The current analysis
shows that such an approach allows the compila-
tion of stock-based indicators at the ecosystem
level, using the best available estimates regarding
the status of all the assessed stocks, and thus pro-
vides a useful diagnosis of state in the fished and
assessed part of the ecosystem. The synthesis was
based on Fpa, Bpa and FMSY so that the status of
each stock and their mean trajectories were
defined with reference to both the ‘old’
precautionary reference values and the ‘new’
MSY-based reference values. According to the
commitments of the 2002 Johannesburg world
summit, the MSY-based objectives (implicitly
defined based on the BMSY target) should be
reached, wherever possible, by 2015. The transi-
tion scheme, currently in force within ICES work-
ing groups, aims at the enforcement of this
objective, but only considering FMSY and not BMSY
as the new threshold (except for a few short-lived
species such as Norway pout), while maintaining
Bpa as the SSB threshold even if Bpa is far below
BMSY for most stocks.
In addition, the chance of the European Union
to achieve the MSY objective by 2015 for all
stocks seems highly unlikely (Froese and Proelß
2010; Villasante 2010). The Aichi Targets, defined
at the Nagoya Convention on Biological Diversity
(CBD 2010), set 2020 as the deadline to achieve
MSY for all stocks worldwide, while the 2008
Marine Strategy Framework Directive (MSFD)
implements the same 2020 deadline to achieve
good environmental status across all European
waters, including for the MSFD Descriptor 3 which
specifically addresses commercial fish and shellfish
(European Commission 2008b, 2010). Thus, at
present, both the MSFD and the newly revised
Common Fishery Policy have adopted MSY as the
reference level that should be reached by 2020
and applied this to the two indicators used to
assess stock status: fishing mortality (F) and
spawning stock biomass (SSB). Therefore, it will be
especially interesting to monitor stocks trajectories
(for each individual assessed stock or as a whole)
in the coming years.
A limitation of our method is that reference
points were not available for all stocks assessed by
ICES, because they have not yet been estimated.
The reference point F0.1 derived from yield per
recruit analyses could be used as a proxy of FMSY,
where no direct estimate of FMSY is available
(STECF 2011). Nevertheless, this proxy is not often
specified by ICES working groups, and thus in
some instances, only certain stocks could be
considered in our calculations of mean stock
trajectories. This was especially the case in the
southern ecosystems we studied, where in general
only a relatively small part of the catch comprised
assessed stocks. However, an assessment based
on the largest proportion of exploited resources
should be considered an important requirement
for achieving an ecosystem approach (including
reference point estimates) and thus for the MSFD,
specifically Descriptor 3 (on commercial fish and
shellfish), but could also have relevance for the
descriptors 1 (biodiversity), 4 (food web) and 6
(seafloor integrity). Such assessments would not
necessarily be required on an annual basis and
using the same full set of age-based methods. In
particular for non-target species, where complete
coverage is not realistic, a risk-based approach
could be defined in order to assess key vulnerable
species, and to determine the number of stocks
necessary to provide a representative overall
assessment of species exploited in each ecosystem.
© 2014 John Wiley & Sons Ltd, F I SH and F I SHER IES 17
Fishing impact in European seas D Gascuel et al.

There are, however, some issues to consider
when attempting to apply these MSY-based
reference points as part of an ecosystem approach
because biological interactions may prevent
achieving current single-species-based BMSY thresh-
olds simultaneously for all stocks (Piet and Rice
2004). Also as FMSY is considered a limit reference
value, it may imply that some of the stocks caught
in a multispecies fishery will need to be caught at
levels below FMSY. In addition, changing the size
selectivity of the fishery will affect the values of
the management threshold and have consequence
for ecosystem health leading to a smaller impact
on marine resources (Froese et al. 2008; Brunel
and Piet 2013). In other words, new targets
will have to be defined, using multispecies and
ecosystem models where the biological interactions
(e.g. predation) and other ecosystem aspects of
integrated stock sustainability are taken into
consideration.
Using ecological indicators
Ecological indicators are not routinely calculated
for European ecosystems in any ICES or European
working group or scientific programme. The
application of the MSFD indicators of good envi-
ronmental status to support integrated marine
resource management is currently in a state of
flux (Greenstreet et al. 2012; Lassen et al. 2013),
which is nicely reflected by the indicators we con-
sidered which seem to capture relevant aspects of
the fish community and probably also the wider
ecosystem, and appear sensitive to the effects of
fishing. In particular, trophic-based indicators
appeared useful, highlighting a clear and continu-
ous decreasing trend in several ecosystems as
well as for the aggregated indicators. In addition,
and in contrast to other studies (e.g. Branch et al.
2010; Branch 2012), trophic indicators based on
landings appeared little sensitive to the uncer-
tainty that exists regarding values of trophic levels
per species. A decrease is also observed until the
early 1990s for the mean maximum length indica-
tors (MML). It reflects changes that have occurred
in the species composition of demersal communi-
ties. In contrast, the LFI suggests the first signs of
recovery from about 2000 onwards. If, indeed, the
fishing pressure is decreasing as Fig. 4 shows, it
suggests that the size structure of fish stocks is
more sensitive than the species composition of fish
communities during the start of the recovery
phase.
Finally, this study showed that the landing-
based indicators (MTL, MTI and MML) appeared to
be highly correlated with survey-based indicators
for most ecosystems, which contrasts with the
results of Branch et al. (2010). Using a worldwide
approach, these authors observed some negative
correlations between landing-based and survey-
based indicators and concluded that the mean tro-
phic level from landings is an unreliable indicator
of ecosystem health, potentially biased by changes
occurring in fishing strategies. In European seas,
we found that the decrease observed in the trophic
indicators from landings may be partially due to
changes which occurred in fishing strategies, with
fishermen progressively targeting a wider part of
ecosystems and landing more prey fishes. This
reflects a ‘fishing through the food web’ process
(Essington et al. 2006), which is confirmed by the
observed increase in the index of landings diver-
sity. However, the declining trend in mean trophic
level was also observed in survey-based indicators,
corresponding to a decrease in predator abun-
dance. This reveals that a ‘fishing down the
marine food web’ process has happened simulta-
neously, which also affects the mean trophic level
of landings. Such a result reflects the global higher
sensitivity to fishing of high trophic level species,
due to their typically lower rates of turnover
(Pauly et al. 1998; Gascuel et al. 2008, 2011b).
Analysing correlations between life-history traits
and the occurrence of fish stock collapses, Pinsky
et al. (2011) showed that stocks of low trophic
level species (e.g. small pelagics) may be more lia-
ble to collapse. This reflects their small number of
age classes, but also frequently very high exploita-
tion rates. In Europe, bottom trawl fisheries target-
ing large higher trophic level demersal species
have been historically dominant. It is thus not sur-
prising that many such species are currently very
depleted and that a fishing down process can be
observed. More generally, the strong decrease in
large demersal fish abundance and in the mean
maximum length of survey data is a global pattern
(Worm et al. 2009).
Implementing an effective ecosystem approach to
fisheries management
More research on ecosystem indicators is still
needed and several research initiatives aimed at
developing operational ecosystem indicators exist,
such as IndiSeas (Shin et al. 2012), several ICES
working groups or regional sea conventions such
18 © 2014 John Wiley & Sons Ltd, F ISH and F ISHER IES
Fishing impact in European seas D Gascuel et al.

as OSPAR or HELCOM. Once the selection process
of appropriate indicators begins to converge, the
use of these indicators, as part of an ecosystem-
based resources management towards the achieve-
ment of good environmental status, needs to be
(further) developed and routinely enforced. It
should be stressed that the objective of reaching
the good environmental status is required but will
not be sufficient. As such, ecosystem approach to
fisheries management goes beyond ‘just’ ensuring
good environmental status. It aims to take into
account not only ecological sustainability, but also
economic profitability and social fairness (Garcia
and Cochrane 2005; Gascuel et al. 2011a; Bundy
et al. 2012). In other words, its major objective
(its specific value-added) is to analyse trade-offs
between ecology, economy and social aspects, the
three pillars of the sustainable development of fish-
eries (STECF 2010; Gascuel et al. 2012). In addi-
tion, according to several European directives
where responsibility has been delegated by Mem-
ber States to the EU, fisheries management in
European Seas is an integrated policy. Therefore,
the ecosystem approach to fisheries management
could (or should) be implemented at the European
level, while environmental policy and therefore
enforcement of the MSFD have to be conducted at
the national level.
Finally, this study shows that the large ecosys-
tems considered in the present analyses, according
to the reference list defined by STECF (2012), rep-
resent a good compromise in terms of size and the
appropriate scale to synthesize stock status and
analyse trends in the ecosystem indicators and
can be easily aligned to MSFD subregions. These
ecosystems are similar to eco-regions used by ICES
except that two of the large ICES eco-regions (i.e.
‘Celtic Sea and West of Scotland’, and the ‘Bay of
Biscay and Iberian Seas’) have each been subdi-
vided into two ecosystems. The availability of the
data we used, as well as the results we obtained,
seems to validate these four subsystems, with
notably contrasted trends and diagnoses from one
ecosystem to the other. The seven ecosystems we
considered also appear to be appropriate for the
study of ecological impacts and economic perfor-
mances of fleet segments, and to analyse trade-offs
between economy and ecology in order to develop
fleet-based management of fisheries in the frame of
an operational ecosystem approach to fisheries
management (STECF 2010, 2012; Gascuel et al.
2012). They also should be the basis to develop
ecosystem models devoted to scientific advice
on both ecology and economics, and to define
long-term management plans in support of the
Common Fisheries Policy. Finally, they form ‘terri-
tories’ where dialogue should be improved and
stakeholders involved in participative management
of fisheries, in line with the strengthening of the
role of the Regional Advisory Councils (RACs)
established by the European Commission. There-
fore, such ecosystems should be the basis for the
collection and availability of data required for the
further development and application of the ecosys-
tem approach, which is still a major concern in
areas including the Mediterranean and Black Sea
(Coll et al. 2013).
A global diagnosis on fishing impact in European
seas
European seas have been exploited for millennia
(Lotze et al. 2006), and fishing has been identified
as a major human impact in these systems (Naray-
anaswamy et al. 2013). Motorized boats as well as
large bottom trawls have been used since the end
of the 19th century (Herubel 1912), but until
World War II, catches remained relatively low.
Only about 1.4 million tonnes were landed in
1938 from the North Sea, by far the most produc-
tive area within European Seas (Christensen et al.
2003). Trends in fishing effort and fishing mortal-
ity rates strongly increased from the 1950s until
the 1990s. For instance, the overall French nomi-
nal fishing effort increased from 164 thousand KW
in 1950 to 500 thousand in 1970, and to 750
thousand in the late 1990s (Gu�enette and Gascuel
2012). In the North Sea, fishing mortality of her-
ring (the most important species in term of land-
ings) jumped from 0.2 in 1950 to more than 0.9
in 1970, while it increased for cod from 0.48 in
1963 (the first available year in assessments) to
0.8 in the mid-1970s and to around 1.0 during
the 1980s and 1990s (ICES 2013). In the North
Sea, where some ICES assessments started early,
overexploitation had occurred by 1953 for herring
and sole, 1957 for plaice, 1963 for cod, haddock
and whiting, and 1967 for saithe (ibid.). Due to
limitations in data availability at the ecosystem
scale, our analyses did not provide results on trends
in stock abundance before the 1980s, but several
studies show that fish stocks had already declined
in Europe before that period. Using a CPUE index
for the Celtic Sea and the Bay of Biscay, Gu�enette
© 2014 John Wiley & Sons Ltd, F I SH and F I SHER IES 19
Fishing impact in European seas D Gascuel et al.

and Gascuel (2012) estimated that the overall
abundance of exploited species declined by around
80% between 1950 and the late 1970s. Based on
stock assessment results for the 1970s, a very
strong decrease in the mean spawning biomass
was also recorded by Garcia and De Leiva (2005)
for a selection of 14 large European stocks, by
Sparholt et al. (2007) for 27 demersal European
stocks and by Froese and Proelß (2010) for 54 fish
stocks of the Northeast Atlantic, and by Sparholt
et al. (2007) for demersal stocks.
Until the 1970s, total landings increased reach-
ing more than 7.2 million tonnes for the seven
considered ecosystems, of which 3.4 million ton-
nes came from the North Sea. It should be noted
that the data available for this period are likely to
underestimate total catches due to discarding prac-
tices and unreported landings (e.g. Pitcher et al.
2002; Zeller et al. 2011). The number of species
exploited at that time was relatively low, with fish-
ermen mainly targeting the most abundant stocks,
often consisting of large predatory species (espe-
cially cod, but also whiting, saithe, hake and
tunas). In the North Sea, an increase in gadoid
recruitment occurred in the late 1960s (the
‘gadoid outburst’, Cushing 1980), leading to an
increase in biomass and catch. This increase
occurred as the various herring stocks were in
decline, probably under the stress of heavy fishing
(ibid.). It temporarily masked or postponed the
decline of fisheries for herring and other species,
which may have commenced by the late 1960s.
From the mid-1970s, yields began to decrease
everywhere (the Baltic Sea being an exception) as
a result of the overexploitation of some major
stocks. In order to compensate for their losses,
fishermen adapted by increasing fishing effort and
targeting a wider range of species and thus
exploiting a wider part of ecosystems. In particu-
lar, small pelagic species, but also invertebrates,
and since the late 1980s deep-water species, have
increasingly been targeted. Thus, the diversity of
landings increased, and this trend persisted until
the late 1990s. Nevertheless, this was insufficient
to compensate for the decrease in abundance of
many stocks, and total landings have continuously
declined in all the NE Atlantic ecosystems studied.
Both the landing-based and survey-based indica-
tors revealed a trend of increasingly deteriorating
ecosystems, at least until the late 1990s. It is likely
that significant fishing-induced changes in the spe-
cies assemblages have occurred, with increasingly
lower abundances of vulnerable species, especially
large predators. According to the ‘fishing down mar-
ine food web’ process, higher trophic levels were the
most affected by overfishing, while prey species (at
least some of them) might have benefited from the
release of predation. This release from predation pres-
sure, but also the impact of trawlers on the seafloor,
may partly explain, in some areas such as the west
of Scotland, the dramatic shift from whitefish domi-
nated fisheries to fisheries dominated by Norway lob-
ster and scallops (Thurstan and Roberts 2010).
The highest fishing impact on the environmental
status of European seas seems to have taken place
in the late 1990s, with high fishing mortality rates
and a clear decrease in stock-based and ecosystem
indicators. In 1998, the EU formally adopted the
‘precautionary approach’, using Bpa and Fpa as
threshold to calculate total allowable catch and
quotas. Scientific advice based on those thresholds
was not always followed. Piet et al. (2010) showed
that for only 8% of the 125 stocks for which ICES
provided advice over the period 1987–2006, the
official total quotas equalled scientific advice, while
the official quotas overshot scientific advice by
>50%. Nevertheless, in the short term, this
approach led to more restrictive quotas and may
have contributed to the decrease in fishing mortal-
ity rates observed in the following years. This
decrease is expected to continue now that the more
precautionary thresholds based on MSY are
adopted and the uptake of scientific advice appears
to have improved. In addition, other restrictions
like fishing gear limitations or fishing effort quotas
were enforced at that time as part of the implemen-
tation of long-term management plans. Decommis-
sioning schemes within the EU have also had some
success in reducing fleet capacity. However, the
level of reductions varies between ecosystems, and
the rate of reduction has been criticized as being
too slow to counter other technological advances
(European Commission 2012, 2013). It should also
be stressed that BMSY is still not used as a target for
fisheries management in Europe, assuming that as
long as the reproductive capacity of stock is not
compromised (i.e. B ≥ Bpa) and fishing mortality is
at a sustainable level (i.e. F ≤ FMSY) stocks should
ultimately recover to their ecosystem-based MSY
level. However, Bpa is the edge of safe biological
limits and a stock at that size can be considered as
probably safe but not as in good condition.
Overall, the mean fishing mortality rate of
assessed stocks has almost halved over the last
20 © 2014 John Wiley & Sons Ltd, F ISH and F ISHER IES
Fishing impact in European seas D Gascuel et al.

decade. This may have contributed to the acceler-
ated decrease in landings observed in the recent
years, notably in the North Sea. In spite of this
dramatic decrease in fishing pressure, a large
number of stocks still failed to meet the require-
ment of the ‘past’ Bpa or Fpa targets (11 stocks
among 21, in our analysis based on 2013 assess-
ments). No clear recovery in the biomass is cur-
rently apparent, and the total biomass remains
close to Bpa, a level far below BMSY. Several recent
meta-analyses (Cardinale et al. 2013; Fernandes
and Cook 2013), and oral presentations made by
ICES experts under the auspice of the European
commission (Fernandez 2013), confirmed the
strong reduction in mean fishing mortality of NE
Atlantic fish stocks over the last decade. Neverthe-
less, these analyses also suggested a significant
increase in the mean biomass of these stocks,
while we observed no clear positive trend. In fact,
these apparent contradictions are linked to differ-
ences in methods. On the one hand, we only con-
sidered stocks in European seas, while the ICES
conclusions were based on stocks of the whole
Northeast Atlantic, including Norwegian waters
and Barents sea where several large stocks are
currently recovering very rapidly (especially the
Barents sea cod stock). On the other hand, ICES
used as an index the average of standardized bio-
masses, while we considered the total biomass.
Thus, results indicate that several small stocks do
exhibit positive trends in biomass, while some
large stocks would still be in decline.
Regarding ecosystem indicators, the large fish
indicator LFI is the only one showing a positive
trend, suggesting that the age and size structure
has started to recover for some exploited stocks.
But at the same time, other indicators of commu-
nity structure (MML, MTL and MTI) continued to
deteriorate or remained at low levels. This result
suggests that the decrease in the fishing pressure
has not yet been sufficient, or is still too recent, to
allow for the recovery of ecosystem health from
such a depleted state. Synergic effects between
stock size, age structure, recruitment and ecosys-
tem indicators may explain the observed delay or
lack of rebuilding. Other factors, especially related
to environmental and global change, might also
intervene and counterbalance or delay the benefit
expected from the release of the fishing pressure.
In this context, the observed decrease in our
overall recruitment index was an unexpected
result which requires particular attention. In some
cases, where fishing patterns change over time,
recruitment estimates based on cohort analyses
can be biased (e.g. Fonteneau et al. 1998). How-
ever, it is very unlikely that such biases would
affect all or even most of the ICES assessments,
and the decrease in recruitment appeared as a
consistent pattern observed over a long period
(more than 20 years) in all the European ecosys-
tems we considered across many stocks (except for
the Baltic Sea). Many stocks were close or below
Bpa for a long time and their age structure is such
that experienced, large, fecund females with high-
quality eggs have disappeared due to overfishing
and fishing of juveniles. Thus, recruitment overf-
ishing may explain, at least partially, the decrease
in recruitment. Several ecological mechanisms,
potentially synergistic, should also be considered
as additional hypotheses able to explain this trend,
in particular: the impact of climate change on eco-
systems productivity and food web; anthropogenic
impacts on essential habitats (especially on coastal
nursery grounds); fishing impact on seafloor and
benthic productivity (Hiddink et al. 2006); unex-
pected ecosystem effects due to changes in species
assemblages; and the loss in the genetic biodiver-
sity for some severely overexploited species (Heath
et al. 2013).
In all cases, such a decrease in the mean recruit-
ment index for a large set of assessed European
stocks is of great concern for fisheries and may
explain, at least partially, why the biomass of
exploited stocks has not yet recovered, despite
declining fishing pressure and possible recovery in
the length-based LFI. In the coming years, poor
recruitment may lead to reduced catches and higher
fishing mortalities (for a given quota) than expected
from stock assessments, therefore compromising the
effectiveness and the social acceptance of fisheries
management. It would be difficult to follow the
transition scheme and to reach the new MSY target
in such a context and thus to achieve good environ-
mental status under the EU MSFD by 2020. In the
medium term, if the trend continues, it could also
lead to a decrease in absolute landings, with obvi-
ous potential impacts on fisheries profitability. In
addition, it should be stressed that in many
instances, targets set for ecological indicators are
established on the basis of historical indicator val-
ues. If physical and hydrographical conditions are
now very different from those prevailing in the early
1980s, such that recruitment indices have all
declined markedly right across European waters,
© 2014 John Wiley & Sons Ltd, F I SH and F I SHER IES 21
Fishing impact in European seas D Gascuel et al.
then the validity of such targets as representing the
good environmental status of ecosystems must
surely be called into question.
Finally, the consistency of diagnoses that we
established in the various European Seas has to be
underlined. Trends and global status appeared
quite similar and only small contrasts have been
identified between ecosystems, with for instance
more favourable trends in the recent period in the
Bay of Biscay compared with the West of Scotland
and Ireland. The Baltic Sea is an exception, with
several indicators exhibiting contrasting trends
compared with other ecosystems. In this ecosys-
tem, total landings only slightly decreased over
the last decade, and the mean recruitment index
fluctuated with no clear trend over the whole per-
iod. The specifics of the Baltic Sea can at least
partly be explained by the synergic effect of a low
number of main fish species in the ecosystem (only
three), and low predation rate due to unfavourable
reproduction conditions of cod, effectively contrib-
uting to the high numbers of sprat stock since
1990s. Increased eutrophication can also have a
role in elevated numbers at lower trophic levels.
Conclusion
The working group on the Ecosystem Approach to
Fisheries Management (STECF 2012) noted three
key element that constitute the work that has to
be performed on a regular basis to evaluate and
implement a scientific-based ecosystem approach
to fisheries management in European Seas (and
probably everywhere):
1. Diagnoses of ecosystem health such as the one
we present in this study have to be defined
and regularly updated for each ecosystem, in
close cooperation with MSFD implementation;
2. Both environmental impacts and socio-eco-
nomic performance of the various fleets
operating within each ecosystem have to be
assessed and monitored (Gascuel et al. 2012).
Results of such analyses could and probably
should be considered by stakeholders (includ-
ing the European Commission) in the defini-
tion of management options and especially in
the frame of long-term management plans
(which should evolve from a stock-based to an
ecosystem-based approach);
3. One or a limited set of ecosystem and bio-eco-
nomic models should be set up and used on a
regular basis for advice-oriented purposes. In a
manner similar to the way assessment and
forecast models are used for stock-based advice
and management (and quotas or fishing effort
regulation), ecosystem and bio-economic mod-
els should be regularly updated. This would
constitute a key step in assessing the ecosys-
tem impacts of fisheries, to simulate various
management options and to analyse their
potential effects on fisheries socio-economic
performance as well as ecosystem impacts.
Overall, it can be concluded that building eco-
system state diagnoses is a key first step on the
path to evaluating and implementing an EAFM.
We presented here the first diagnosis for seven of
fourteen European marine ecosystems that have
to be considered in the context of EAFM imple-
mentation in European seas. The present work
should be considered as a starting point for more
complete approaches, covering more ecosystems
and the implementation of subsequent monitoring
programmes.
Acknowledgements
This study was initially conducted during the
2012 meeting of the Experts working group on
the ‘Development of the Ecosystem Approach to
Fisheries Management in European Seas’ set up
by the Scientific Technical and Economic Commit-
tee for Fisheries (STECF), and funded by the Euro-
pean Commission. MC was funded by the
European Commission through the Marie Curie
CIG grant and the Spanish Research Program
Ramon y Cajal. We sincerely thank Trevor
Branch and anonymous referees for their useful
comments and suggestions on an earlier version
of the manuscript.
References
Branch, T.A. (2012) FAO’s State of Fisheries and Aqua-
culture: correcting some misrepresentations by Pauly
and Froese. Marine Policy 36, 1191–1192.
Branch, T.A., Watson, R., Fulton, E.A. et al. (2010) The
trophic fingerprint of marine fisheries. Nature 468,
431–435.
Branch, T.A., Jensen, O.P., Ricard, D., Ye, Y. and Hil-
born, R. (2011) Contrasting global trends in marine
fishery status obtained from catches and from stock
assessments. Conservation Biology 25, 777–786.
Brunel, T. and Piet, G.J. (2013) Is age structure a rele-
vant criterion for the health of fish stocks? ICES Journal
of Marine Science 70, 270–283.
22 © 2014 John Wiley & Sons Ltd, F ISH and F ISHER IES
Fishing impact in European seas D Gascuel et al.

Bundy, A., Coll, M., Shannon, L.J. and Shin, Y.-J. (2012)
Global assessments of marine exploited ecosystems and
their management: what more is needed? Current Opin-
ion in Environmental Sustainability 4, 292–299.
Cardinale, M., D€orner, H., Abella, A. et al. (2013)
Rebuilding EU fish stocks and fisheries, a process under
way? Marine Policy 39, 43–52.
Carruthers, T.R., Walters, C.J. and McAllister, M.K.
(2012) Evaluating methods that classify fisheries stock
status using only fisheries catch data. Fisheries
Research 119–120, 66–79.
CBD (2010) Decision Adopted by the Conference of the Par-
ties to the Convention on Biological Diversity at its Tenth
Meeting, Decision X/2. The Strategic Plan for Biodiver-
sity 2011-2020 and the Aichi Biodiversity Targets.
Secretariat for the Convention on Biological Diversity,
Nagoya, Japan.
Christensen, V., Gu�enette, S., Heymans, J. et al. (2003)
Hundred-year decline of North Atlantic predatory
fishes. Fish and Fisheries 4, 1–24.
Coll, M., Cury, P., Azzurro, E. et al. (2013) The scientific
strategy needed to promote a regional ecosystem-based
approach to fisheries in the Mediterranean and Black
Seas. Reviews in Fish Biology and Fisheries 23, 415–
434.
Cushing, D.H. (1980) The decline of the herring stocks
and the gadoid outburst. Journal du Conseil International
pour l’Exploration de la Mer 39, 70–81.
Essington, T.E., Beaudreau, A.H. and Wiedenmann, J.
(2006) Fishing through marine food webs. Proceedings
of the National Academy of Sciences of the United States
of America 103, 3171–3175.
European Commission (2008a) The role of the CFP in
implementing an ecosystem approach to marine manage-
ment. Communication from the Commission to the
Council and the European Parliament -. COM/2008/
0187 final.
European Commission (2008b) Directive 2008/56/EC of
the European Parliament and of the Council of 17 June
2008 establishing a framework for community action in
the field of marine environmental policy (Marine Strategy
Framework Directive).
European Commission (2010) Commission Decision of 1
September 2010 on criteria and methodological standards
on good environmental status of marine waters (2010/
477/EU).
European Commission (2012) Facts and Figures on the
Common Fisheries Policy. Basic statistical data, 52 pp.
European Commission (2013) Report from the Commission
to the European Parliament and the Council on Members
Efforts during 2011 to achieve a sustainable balance
between fishing capacity and fishing opportunities, COM
(2013) 85 Final, 15 pp.
FAO (Food and Agriculture Organization) (1995) Code of
Conduct for Responsible Fisheries. FAO, Rome, Italie, 41
pp.
Fernandez, C. (2013) Overview of Northeast Atlantic
Stocks. Oral presentation to the seminar “State of Fish
Stocks and Fisheries in European Waters”, Brussels,
Belgium, 17 September 2013. http://ec.europa.eu/fish-
eries/news_and_events/events/20130917/documents/
fernandez-carmen_en.pdf (accessed 30 January 2014).
Fernandes, P.G. and Cook, R.M. (2013) Reversal of fish
stock decline in the Northeast Atlantic. Current Biology
23, 1432–1437.
Fonteneau, A., Gascuel, D. and Pallares Soubrier, P.
(1998) Vingt cinq ans d’�evaluation des ressources thon-
i�eres dans l’Atlantique: quelques r�eflexions m�ethodologi-
ques. Tuna Symposium, Les Ac�ores, Juin 1996. Recueil
des documents scientifiques ICCAT (International Com-
mission for the Conservation of Atlantic Tunas), Collec-
tion Volume of Scientific Papers 50: 523–562.
Froese, R. and Pauly, D. (2012) FishBase. World Wide
Web Electronic Publication. www.fishbase.org, version
(06/2012) (accessed 30 March 2013).
Froese, R. and Proelß, A. (2010) Rebuilding fish stocks
no later than 2015: will Europe meet the deadline?
Fish and Fisheries 11, 117–232.
Froese, R., Stern-Pirlot, A., Winker, H. and Gascuel, D.
(2008) Size matters: how precautionary single-species
management can contribute to ecosystem-based fisher-
ies management. Fisheries Research 92, 231–241.
Fung, T., Farnsworth, K.D., Reid, D.G. and Rossberg,
A.G. (2012) Recent data suggest no further recovery
in North Sea Large Fish Indicator. ICES Journal of
Marine Science 69, 235–239.
Garcia, S.M. and Cochrane, K.L. (2005) Ecosystem
approach to fisheries: a review of implementation
guidelines. ICES Journal of Marine Science 62, 311–318.
Garcia, S.M. and De Leiva, M. (2005) Evolution of the
state of fish stocks in the Northeast Atlantic within a
precautionary framework, 1970-2003: a synoptic eval-
uation. ICES Journal of Marine Science 62, 1603–1608.
Garcia, S.M., Zerbi, A., Aliaume, C. et al. (2003) The Eco-
system Approach to Fisheries, FAO Fisheries Technical
Paper, Vol. 443. FAO, Rome, Italie, 71 pp.
Gascuel, D., Morissette, L., Palomares, D. and Christen-
sen, V. (2008) Trophic flow kinetics in marine ecosys-
tems: toward a theoretical approach to ecosystem
functioning. Ecological Modelling 217, 33–47.
Gascuel, D., Bez, N., Forest, A. et al. (2011a) A future for
marine fisheries in Europe (Manifesto of the Associa-
tion Franc�aise d’Halieum�etrie). Fisheries Research 109,
1–6.
Gascuel, D., Gu�enette, S. and Pauly, D. (2011b) The tro-
phic-level based ecosystem modelling approach: theo-
retical overview and practical uses. ICES Journal of
Marine Science 68, 1403–1416.
Gascuel, D., Merino, G., Do€ering, R. et al. (2012)
Towards the implementation of an integrated ecosys-
tem fleet-based management of European fisheries.
Marine Policy 36, 1022–1032.
© 2014 John Wiley & Sons Ltd, F I SH and F I SHER IES 23
Fishing impact in European seas D Gascuel et al.

Greenstreet, S.P.R., Rogers, S.I., Rice, J.C. et al. (2011)
Development of the EcoQO for the North Sea fish com-
munity. ICES Journal of Marine Science 68, 1–11.
Greenstreet, S.P.R., Rossberg, A.G., Fox, C.J. et al. (2012)
Demersal fish biodiversity: species-level indicators and
trends based targets for the Marine Strategy Frame-
work Directive. ICES Journal of Marine Science 69,
1789–1801.
Gu�enette, S. and Gascuel, D. (2012) Shifting baselines in
European fisheries: the case of the Celtic Sea and Bay
of Biscay. Ocean and Coastal Management 70, 10–21.
Heath, M.R. and Speirs, D.C. (2011) Changes in species
diversity and size composition in the Firth of Clyde
demersal fish community (1927–2009). Proceedings of
the Royal Society B: Biological Sciences 279, 543–552.
Heath, M.R., Culling, M.A., Crozier, W.W. et al. (2013)
Combination of genetics and spatial modelling high-
lights the sensitivity of cod (Gadus morhua) population
diversity in the North Sea to distributions of fishing.
ICES Journal of Marine Science 71, 794–807.
Herubel, M. (1912) Sea Fisheries. Their Treasures and Toil-
ers. T. Fisher Unwin, London, 366 pp.
Hiddink, J., Jennings, S., Kaiser, M., Queir�os, A., Dupli-
sea, D. and Piet, G. (2006) Cumulative impacts of sea-
bed trawl disturbance on benthic biomass, production,
and species richness in different habitats. Canadian
Journal of Fisheries and Aquatic Sciences 63, 721–736.
ICES (2004) Report of the ICES Advisory Committee on
Fishery Management and Advisory Committee on Ecosys-
tems, Vol. 1. ICES, Copenhagen.
ICES (2009) Report of the Working Group on the Ecosystem
Effects of Fishing Activities. ICES, Copenhagen.
ICES (2013) ICES Advice 2013, Book 6. ICES, Copenha-
gen.
Jennings, S. and Rice, J.C. (2011) Towards an ecosystem
approach to fisheries in Europe: a perspective on exist-
ing progress and future directions. Fish and Fisheries
12, 125–137.
Jiming, Y. (1982) A tentative analysis of the trophic lev-
els of North Sea fish. Marine Ecology Progress Series 7,
247–252.
Lassen, H., Pedersen, S.A., Frost, H. and Hoff, A. (2013)
Fishery management advice with ecosystem consider-
ations. ICES Journal of Marine Science 70, 471–479.
Lotze, H.K., Lenihan, H.S., Bourque, B.J. et al. (2006)
Depletion, degradation, and recovery potential of estu-
aries and coastal seas. Science 312, 1806–1809.
Marchal, P., Andersen, B., Bromley, D. et al. (2006)
Improving the definition of fishing effort for important
European fleets by accounting for the skipper effect.
Journal Canadien des Sciences Halieutiques et Aquatiques
63, 510–533.
Narayanaswamy, B.E., Coll, M., Danovaro, R., Davidson,
K., Ojaveer, H. and Renaud, P. (2013) Synthesis of
knowledge on marine biodiversity in European Seas: from
census to sustainable management. PLoS One 8, e58909.
Pauly, D. and Watson, R. (2005) Background and inter-
pretation of the ‘Marine Trophic Index’ as a measure
of biodiversity. Philosophical Transactions of the Royal
Society B: Biological Sciences 360, 415–423.
Pauly, D., Christensen, V., Dalsgaard, J., Froese, R. and
Torres, F.J. (1998) Fishing down the food web. Science
279, 860–863.
Pauly, D., Hilborn, R. and Branch, T.A. (2013) Does
catch reflect abundance? Nature 494, 303–306.
Piet, G.J. and Rice, J.C. (2004) Performance of precau-
tionary reference points in providing management
advice on North Sea fish stocks. ICES Journal of Marine
Science 61, 1305–1312.
Piet, G.J., van Overzee, H.M.J. and Pastoors, M.A. (2010)
The necessity for response indicators in fisheries man-
agement. ICES Journal of Marine Science 67, 559–566.
Pikitch, E.K., Santora, C., Babcock, E.A. et al. (2004)
Ecosystem-based fishery management. Science 305,
346–347.
Pinsky, M.L., Jensen, O.P., Ricard, D. and Palumbi, S.R.
(2011) Unexpected patterns of fisheries collapse in the
world’s oceans. Proceedings of the National Academy of
Sciences of the United States of America 108, 8317–8322.
Pitcher, T.J., Watson, R., Forrest, R., Valt�ysson, H.Þ. and
Gu�enette, S. (2002) Estimating illegal and unreported
catches from marine ecosystems: a basis for change.
Fish and Fisheries 3, 317–339.
Rice, J.C. (2011) Managing fisheries well: delivering the
promises of an ecosystem approach. Fish and Fisheries
12, 209–231.
Shannon, C.E. (1948) A mathematical theory for com-
munications. Bell System Technical Journal 27, 379–
423 & 623–656.
Shephard, S., Reid, D.G. and Greenstreet, S.P.R. (2011)
Interpreting the large fish indicator for the Celtic Sea.
ICES Journal of Marine Science 68, 1963–1972.
Shephard, S., Fung, T., Houle, J.E., Farnsworth, K.D.,
Reid, D.G. and Rossberg, A.G. (2012) Size-selective
fishing drives species composition in the Celtic Sea.
ICES Journal of Marine Science 69, 223–234.
Shephard, S., Fung, T., Rossberg, A.G., Reid, D.G., Green-
street, S.P.R. and Warnes, S. (2013) Modelling recov-
ery of Celtic Sea demersal fish community size-
structure. Fisheries Research 140, 91–95.
Shephard, S., Rindorf, A., Dickey-Collas, M., Hintzen,
N.T., Farnsworth, K.D. and Reid, D.G. (2014) Assess-
ing the state of pelagic fish communities within an
ecosystem approach and the European Marine Strategy
Framework Directive. ICES Journal of Marine Science.
Avalaible on line. doi: 10.1093/icesjms/fsu005
(accessed 1 April 2014).
Shin, Y.-J., Rochet, M.-J., Jennings, S. et al. (2005) Using
size-based indicators to evaluate the ecosystem effects
of fishing. ICES Journal of Marine Science 62, 384–396.
Shin, Y.-J., Bundy, A., Shannon, L.J. et al. (2012) Global
in scope and regionally rich: an IndiSeas workshop
24 © 2014 John Wiley & Sons Ltd, F ISH and F ISHER IES
Fishing impact in European seas D Gascuel et al.

helps shape the future of marine ecosystem indicators.
Reviews in Fish Biology and Fisheries 22, 621–636.
Sparholt, H., Bertelsen, M. and Lassen, H. (2007) A
meta-analysis of the status of ICES fish stocks during
the past half century. ICES Journal of Marine Science
64, 707–713.
STECF (2006) Revision of the Data Collection Regulation to
take into account the ecosystem approach. STECF/SGRN-
06-01 report, Office for Official Publications of the
European Communities, Luxembourg. EUR – Scientific
and Technical Research series.
STECF (2007) Report of the 26th STECF plenary meeting of
the Scientific, Technical and Economic Committee for Fish-
eries (PLEN-07-02), November 2007, Ispra (Italie).
Office for Official Publications of the European Commu-
nities, Luxembourg. EUR – Scientific and Technical
Research series, ISSN 1831-9424 (online), ISSN 1018-
5593 (print), 215 pp.
STECF (2010) Development of the Ecosystem Approach to
Fisheries Management (EAFM) in European Seas. STECF/
SGMOS-10-03 Working Group report, Office for Official
Publications of the European Communities, Luxembourg.
EUR – Scientific and Technical Research series, ISSN
1831-9424 (online), ISSN 1018-5593 (print), 144 pp.
STECF (2011) Report of the 37th plenary meeting of the
Scientific, Technical and Economic Committee for Fisheries
(PLEN-11-02), July 2011, Copenhagen (DK). Office for
Official Publications of the European Communities,
Luxembourg. EUR – Scientific and Technical Research
series, ISSN 1831-9424 (online), ISSN 1018-5593
(print), 89 pp.
STECF (2012) Scientific, Technical and Economic Committee
for Fisheries. Development of the Ecosystem Approach to
Fisheries Management (EAFM) in European seas (STECF-
11-13), Publications Office of the European Union,
Luxembourg. EUR – Scientific and Technical Research
series, ISSN 1831-9424 (online), ISSN 1018-5593
(print), 178 pp.
Thurstan, R.H. and Roberts, C.M. (2010) Ecological melt-
down in the Firth of Clyde, Scotland: two centuries of
change in a coastal marine ecosystem. PLoS One 5,
e11767.
Villasante, S. (2010) Global assessment of the European
Union fishing fleet: an update. Marine Policy 34, 663–
670.
Worm, B., Hilborn, R., Baum, J.K. et al. (2009) Rebuild-
ing global fisheries. Science 325, 578–585.
Zeller, D., Rossing, P., Harper, S., Persson, L., Booth, S.
and Pauly, D. (2011) The Baltic Sea: estimates of total
fisheries removals 1950-2007. Fisheries Research 108,
356–363.
Supporting Information
Additional Supporting Information may be found
in the online version of this article:
Appendix S1. Stocks considered for the calcula-
tion of stock-based indicators.
Appendix S2. Calculation of the ecosystem
indicators from survey data.
Appendix S3. Sensitivity of stock-based indica-
tors to the selection of time series used.
Appendix S4. Stock-based indicators comple-
mentary graph.
Appendix S5. Sensitivity of Trophic-based indi-
cators to the values of trophic level.
Appendix S6. Correlation between landings-
based and survey-based ecosystem indicators.
© 2014 John Wiley & Sons Ltd, F I SH and F I SHER IES 25
Fishing impact in European seas D Gascuel et al.


