Embed Size (px)
Citation preview

FISHER ENGINEERING LTD.
40 Fairfield Road Lower Coverdale, New Brunswick E1J 0A2 Phone: 506. 863. 1991 January 5th, 2021 File: DE154 Mr. David Maguire Director Project Assessment Branch Department of Environment 20 McGloin Street PO Box 6000 Fredericton, NB E3B 5H1 Attention: Mr. Maguire: Re: Proposed Apartment Complex Cap Bimet, NB Enclosed is an electronic copy of the registration document for the above noted undertaking. Once an EIA file number is assigned, the fee will be paid on line. If you have any questions or require further details, please do not hesitate to contact the undersigned. ___________________________ Michael Fisher, P. Eng. MJF Enclosures cc: Mr. Trevor Ritchie, Brinkley Investments Inc.

FISHER ENGINEERING LTD. Brinkley Investments Inc. EIA Registration File # DE154, Jan. 2021
TABLE OF CONTENTS
Page
1 THE PROPONENT ................................................................................................................ 1
2 THE UNDERTAKING ............................................................................................................ 1
3 DESCRIPTION OF THE EXISTING ENVIRONMENT ........................................................... 4
4 SUMMARY OF ENVIRONMENTAL IMPACTS ..................................................................... 5
5 SUMMARY OF PROPOSED MITIGATION ........................................................................... 5
6 PUBLIC INVOLVEMENT ....................................................................................................... 7
7 APPROVAL OF THE UNDERTAKING .................................................................................. 7
8 FUNDING .............................................................................................................................. 7
9 SIGNATURE .......................................................................................................................... 7
APPENDIX
A FIGURES B ADDITIONAL DOCUMENTATION
C WSSA APPLICATION
EIA Registration Brinkley Investments Inc.

FISHER ENGINEERING LTD. Brinkley Investments Inc. EIA Registration File # DE154, Jan. 2021
Pursuant to Section 5(2) of The Environmental Impact Assessment Regulation 87-83 Clean Environment Act 1 The Proponent Name: Brinkley Investments Inc. Address: 19 Plaza Blvd. Moncton, NB E1C 0E8 Primary Contact Executive Officer: Trevor Ritchie, (506) 587-0400
Principal Contact Person for Purposes of EIA: Trevor Ritchie, (506) 857-0400 and Michael Fisher, Fisher Engineering Ltd. (506) 863-1991.
Property Ownership: Same as Proponent 2 The Undertaking Name: The Brinkley
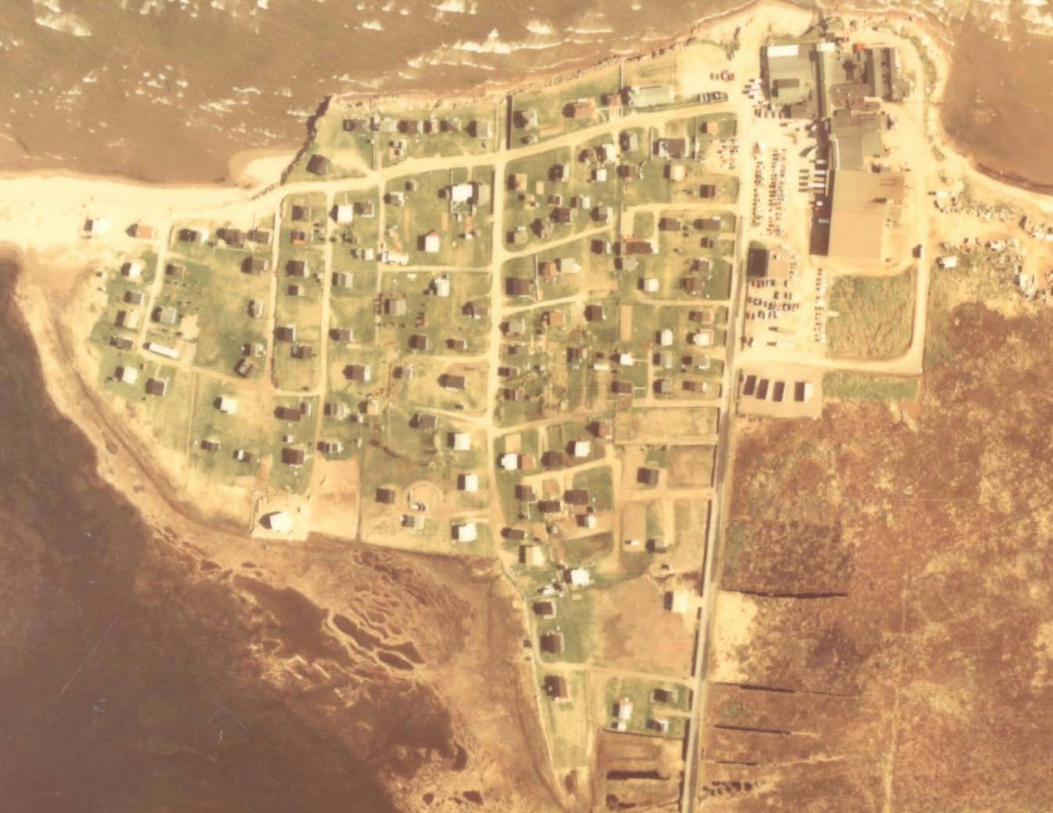
Project Overview: The proposed project is the construction of a 92 unit apartment building complete with both underground and above ground parking. Currently the majority of the property is grass landscaped with a portion covered with an asphalt parking lot, pool, and a few outdoor gazebos. The grounds are currently used by the adjacent condominium building located on the adjacent property to the south. Purpose/Rationale/Need: The subject property was purchased by the proponent in
August 2020. The proponent is a developer and intends to develop the property in general conformance to what the overall development vision was that was originally started back in 2008. At that time the previous owners (Denaco Group) had an overall proposal for a development called Le Rivage; which was to have a combined estimated occupancy of 338 persons in four buildings. Three new buildings were proposed along with the conversion of one existing building.
In 2008/2009 a new 66-unit condominium building was constructed on a portion of the
original fish plant site. Since the development of the 66-unit condo, one of the original fish plant buildings was subdivided off (PID 70645247), sold and converted into a 2-bedroom rental apartment. Beyond that, the remaining two proposed buildings where never constructed and the land where they were supposed to be constructed has been vacant with the exception of the construction of two swimming pools and a couple
EIA Registration Brinkley Investments Inc.

FISHER ENGINEERING LTD. Brinkley Investments Inc. EIA Registration File # DE154, Jan. 2021
2
gazebos. This is evident in the attached aerial photos from 2001 (pre development) and 2011 (post condo development).
Project Location: The subject property is located at the end of Cap Bimet Road in Cap
Bimet, New Brunswick, see attached Figure 1. The subject property is identified by Service New Brunswick as PID 70497763 and is located within the Beaubassin-est Rural Community planning area. The subject property covers an approximate area of 1.36ha. Siting Considerations: The project location was chosen because of the previous
owners’ original plans for the overall development of the former Paturals fish processing site.
The land is currently zoned, ID- Integrated Development. Within the Beaubassin-est
Rural Community Rural Plan, section 9.1(1) states: Inside an integrated development zone, all land must be used and all buildings must be installed, erected, altered, or used solely in compliance with a specific proposal outlined in a resolution passed or an agreement entered into under section 39 of the Act. A copy of this ID is attached.
The site is easily accessible via the existing driveway off Cap Bitmet Road and there is a
portion of the existing asphalt parking for the adjacent condo building that will be shared with the proposed new building on the subject property already.
The proposed development area on the project site does not fall within 30m of a costal
marsh or provincially significant wetland, refer to attached GeoNB figures in appendix A. There is an adjacent regulated wetland located to the southeast; however, there is no proposed work within 30m of this wetland. The project site is located within 30m of the Northumberland Straight, which will require the proponent to obtain a watercourse alteration permit for the proposed soil disturbance. The area is considered Zone B as part of the NB coastal area protection policy. Within the policy, permissible activities within Zone B include:
•Soil disturbance associated with the construction of a new or rebuilt structure if it meets
the following conditions: -avoidance of impacts is considered and the soil disturbance is as far away as possible
from the coastal feature. The proposed location of the apartment building takes into consideration this along with
the existing structures on the site and the recommendations in the environmental site closure documents/record of site condition for this property.
-in the case of new or rebuilt structures, the habitable portion of the structure is at least 2
metres above the HHWLT (Higher High Water Large Tide) elevation or an elevation determined by the Local Government or Regional Service Commission.
Since the creation of this policy, Beaubassin-est Rural Community has adapted a new by-law requiring all habitable portions of a structure to be above geodetic elevation of 4.3m. This proposed new apartment building is required to comply with the minimum 4.3m habitable portion.
Physical Components and Dimensions of the Project: The proposed site plan is
attached. Currently the development area is flat and landscaped with grass. A portion of the property is covered with an asphalt parking lot that is being used by the adjacent

FISHER ENGINEERING LTD. Brinkley Investments Inc. EIA Registration File # DE154, Jan. 2021
3
condominium and also a pool. Pictures of the site are attached. There is also a well on the site (referred to as the shed well by others) that was one of two wells that historically were used by the former processing plant.
Construction Details: The proponent would like to start construction in the spring/summer of 2021 on the
building with the goal to open for tenants late in 2022. Site work (excavation, backfilling, parking lot construction) would be completed in 2021 with the remaining time spent on the building envelope.
The potential sources of pollutants generated during the construction are discussed in
Section 4. Operation and Maintenance Details: Since the proponent will be requiring work within
30m of the Northumberland straight, a watercourse alteration permit will be required. In addition, the proposed apartment building will require a daily groundwater withdrawal rate that exceeds 50m3/day.
A hydrogeological evaluation of the existing production well was identified by NBDELG as being required for this project. There is an existing well (shed well) that was historically used by the fish processing plant and was scheduled to be used by the former owners for the previously approved residential development.
The existing well (Shed Well) coordinates: E: 2657489.544 N: 7472835.485 The hydrogeological program will follow the NBDELG Water Supply Assessment
Guideline. The program will consist of performing a 72 hr pump test on the existing shed well. The pumping test data will be analyzed to determine the long-term sustainability of the aquifer. Pumping test will be conducted as outlined in the guideline and will be performed during February of 2021 when groundwater recharge is minimal. The proposed daily water demand for the proposed apartment building is 82.8m3/day (57.5l/min), which is based on an average of 92, 2-bedroom residential units and each residential unit requiring 900l/day (2 person@ 450l/day). A WSSA application to complete the hydrogeological assessment for this development is attached is Appendix C.
Project Related Documents: The proponent provided the previous hydrogeological
assessment that was completed in 2008 by others. In 2008, pump tests were completed on the two former production wells for the fish plant (Plant well and Shed well). The plant well is located on the adjacent property (PID 70497755) which is currently occupied by the 66-unit condo building. The plant well is in use with the Shed well being located on the subject property and currently capped. A copy of the report is attached.
The findings of the hydrogeological study completed in 2008 were based on a proposed development of 338 persons. This is larger than what the overall development will be once this proposed apartment building is completed. Based on the current 66 unit condo, 2 bedroom apartment and proposed 92 unit

FISHER ENGINEERING LTD. Brinkley Investments Inc. EIA Registration File # DE154, Jan. 2021
4
apartment, the over development will have an estimated 318 persons (66+92+1) x 2 persons/unit.
The report recommended that the maximum pumping rate for the shed well be 672L/min, which is well above the daily average water demand for this apartment building of 57.5l/day. For an apartment building, typically peak water consumption is spread out more over the day than a single family dwelling. If we assume that peak demand occurs over 180minutes of the day, the peak water demand equates to 460l/min. This is still almost less than 2/3 of the recommended maximum pumping rate of the shed well.
3 Description of the Existing Environment Physical and Natural Features:
Based on a topographic survey of the site, surface elevation across the site is approximately 4 metres above mean sea level.
The subject property is located along the banks of the Northumberland Straight. Surface water drainage across the site is expected to drain north and westerly toward the Straight.
Shallow groundwater flow across the property is expected to follow the local topography, which slopes towards the adjacent Northumberland Straight. Deeper groundwater likely flows in a similar direction toward the Northumberland Straight. The area to the south and east that could potentially contribute groundwater to the study area is occupied by the adjacent condominium development and a large wetland.
The regional bedrock geology is mapped as late Carboniferous stratified rock belonging to the Pictou Group, which is a subbasin of the Maritimes Carboniferous Basin. Mapping indicates that within the Pictou Group, the site may fall within the Richibucto Formation, which consists mainly of grey sandstone (Rivard et al. 2003).
The Richibucto Formation has been described as one of the more productive sandstone formations in the province and has been described as a good aquifer throughout the Moncton basin. The majority of the domestic wells drilled in this formation generally yield 20+ igpm (Carr, 1959).
Surficial geological mapping indicates that the area is underlain by late Wisconsinan age morainal sediments consisting of blankets and plains of Marine sediments, sand, silt, some gravel and clay generally 0.5m to 3m thick.
There are no municipal wells, municipal wellfields, or protected watersheds within 500 metres of the subject site. Surrounding properties rely on private wells to supply potable water. Within 500 metres of the subject site there are approximately 125 seasonal/permanent residents.
One regulated wetland was identified on the GEONB mapping near the southwest corner of the property boundary. A copy of the GeoNB mapping is attached (Figure 3). There is no work planned within the existing 30m setback of the wetland.
The NBDELG species at Risk database identified no records on the subject site.

FISHER ENGINEERING LTD. Brinkley Investments Inc. EIA Registration File # DE154, Jan. 2021
5
The following are some of the references and personnel that were contacted and used in order to gather information regarding the physical and natural features of the subject and surrounding properties.
1. Environment Canada Species at Risk website - http://www.sararegistry.gc.ca 2. Canadian Species at Risk. Committee on the Status of Endangered Wildlife in
Canada. Web site: http://www.cosewic.gc.ca 3. Canadian Wildlife Service website - http://www.naturecanada.ca 4. Department of Environment Government website – designated wellfields -
http://www.gnb.ca/0009/0371/0001/0003.html, and protected watersheds - http://www.gnb.ca/0009/0371/0004/0003.html.
Cultural Features: None observed or reported on the subject site or adjacent properties
Existing and Historic Land Uses: Historical information was obtained through a review of historical aerial photos (1945 through 2011). The site along with several adjacent parcels were once the site of Paturel’s fish plant that operated between the early 1950’s until the mid 2000’s when the plant burnt down.
In 2008/2009 a 66-unit condominium building was constructed on a portion of the original fish plant site. Since the development of the 66-unit condo, there was one of the original fish plant buildings subdivided off (PID 70645247), sold and converted into a 2-bedroom rental apartment. Beyond that, there has been no further development of the original development with the exception of the swimming pools a couple gazebos and landscaping of the subject property with grass. The proposed apartment building will house 92 units with an average occupancy of 184 persons. Combining the existing condo building, rental building and the proposed apartment building, the overall development has a proposed occupancy of 318. This is less than the previously approved Le Rivage development at 338 person occupancy.
4 Summary of Environmental Impacts The activities for this project involve the construction of a five storey apartment building
complete with underground parking. Potential Environmental Impacts associated with the construction of the apartment building is soil disturbance, heavy equipment being used on the site for site preparation. There could be an accidental release of hazardous materials such as fuels and lubricants during the construction along with sediment laden runoff.
There is no work to occur within 15m of the existing stabilized shoreline bank along the Northumberland Straight.
5 Summary of Proposed Mitigation The potential environmental impacts listed in Section 4 are discussed further below along
with any proposed mitigation.

FISHER ENGINEERING LTD. Brinkley Investments Inc. EIA Registration File # DE154, Jan. 2021
6
1. Accidental release of hazardous materials: In order to minimize the risk of a release of
hazardous materials the following best management practices will be employed during the drilling. Refuelling of equipment, if required, will take place in designated areas where an
impermeable surface will be prepared so that a release of fuel or oil does not enter the surface water. The refuelling areas will be located on level terrain and a minimum of 30 metres from any surface water.
Any required maintenance work would be performed offsite.
The latest CSA standard for emergency response planning will be reviewed prior to construction. The following standard emergency spill response measures will be followed. During construction activities, absorbent material will be kept on-site at all times for
immediate response in the event of a spill. In the event of a spill, all work will be stopped and a supervisor notified immediately. A record of the incident will be taken which will include the personnel and machinery
involved, spill containment measures employed, quantity and type of material spilled, date and time of occurrence, and agencies notified.
All necessary actions will be taken to stop the spread of spilled material. Actions may involve ditching, blocking drainage pathways, and using absorbent materials. Any spills or leaks, such as those from machinery or fuel storage tanks, will be promptly contained and cleaned up. Actions may involve ditching, blocking drainage pathways, and using absorbent materials. In addition, any spills or leaks will be reported to the 24-hour environmental emergencies reporting system (1-800-565-1633) and to the NBDELG Regional Office in Moncton (506-856-2374).
In addition to the above noted mitigation measures, the following standard NBDTI EMM Mitigative measures will be followed throughout the life of the project:
5.3 – Clearing 5.6 – Dust Control
5.7 – Erosion and Sediment Management 5.8.1 – Excavation
5.10 – Fire Prevention and Contingency 5.11 – Grubbing
5.12 – Spill Management 5.13 – Storage & handling of Petroleum Products
5.14 - Storage and Handling of other Dangerous Materials 5.23 – Working Near Environmentally Sensitive Areas.
The proponent will regularly consult Environment Canada’s local forecast at http://www.weatberoffice.ec.gc.ca/ so that construction-related activities can be scheduled accordingly.

FISHER ENGINEERING LTD. Brinkley Investments Inc. EIA Registration File # DE154, Jan. 2021
7
6 Public Involvement
The following stakeholders will be contacted directly via a letter in order to obtain input on the project:
o Elected officials, the local service district, Southeast Regional Planning Commission, Residents located off Cap Bimet Road and First Nations representatives.
The letter will outline the scope of the project and will include a schematic of the development. Contact information for any comments will also be provided. The public will be given thirty days to provide comments. Once the comments have been received, a report will be prepared regarding the public’s input. The report will be submitted within sixty days of project registration.
7 Approval of the Undertaking Approvals will be required from the following authorities: New Brunswick Department of
Environment prior to being able to withdrawal more than 50m3/day from the existing onsite well.
8 Funding
No applications for a grant or loan of capital funds from a government agency have or will be submitted. Brinkley Investments Inc. will be funding the project.
9 Signature Jan 5th/2021 Michael Fisher, P.Eng Date DE154/EIA registration.doc

APPENDIX A
FIGURES


GeoNB Map Viewer
Government of New Brunswick / Gouvernement du Nouveau-Brunswick
parcels
Property Assessment
2018 Flood Extents – Lower Saint John River
2008 Flood Extents – Lower Saint John River
2008 Flood Extents – Upper Saint John River
1973 Flood Extents – Fredericton to Gagetown
Flood Hazard Areas
1 in 20 Year Flood
1 in 100 Year Flood
12/31/2020, 9:21:58 AM0 0.15 0.30.07 mi
0 0.25 0.50.13 km
1:10,000
GeoNBThis map is a graphical representation which approximates the size, configuration and location of features. This map is not intended to be used for legal descriptions or to calculate exact dimensions or area.


APPENDIX B
ADDITIONAL DOCUMENTATION


Geotechnical and Materials Engineering • Hydrogeology • Materials Testing and Inspection Environmental Engineering • Solid Waste Management • Transportation Engineering
191 Doak Road Fredericton, NB E3C 2E6
TEL: (506) 453-1025 FAX: (506) 453-9470
Certified Testing Lab
February 20, 2008 File: 5742.07
Revised Final
VIA EMAIL: [email protected]
Denaco Group Ltd. 97 Silverwood Crescent Moncton, NB E1A 0M4 Attention: Mr. Denis Arsenault RE: GROUNDWATER SERVICES- PUMPING TESTS AND WATER QUALITY TESTING PATUREL’S TOWNHOUSE / CONDO DEVELOPMENT, CAP BIMET ROAD Introduction GEMTEC Limited was retained by Denaco Group Ltd. to assist in evaluating the use of groundwater as a potable water supply for the proposed Paturel’s Townhouse / Condo development located at Cap Bimet (former Paturel’s fish plant). Two wells are located at the site (Figure 1) and a preliminary review of the water supply situation indicated that only a small portion of the total water used by the former fish plant would be required for the proposed development (GEMTEC letter dated January 8, 2008). Since our initial assessment the water requirements for the development have been revised and groundwater pumping tests were completed on the two existing wells on the property, the Plant well and the Shed well. This letter updates the basic water consumption or demand for the development and compares this demand to the calculated yield (available supply) of the site wells. Groundwater samples were taken during the two pump tests and the data are compared to drinking water guidelines. Water Demand for Project Based on sewage flow data provided by the Terrain Group Inc., the total occupancy for the development (all four phases) is 338 persons. The development will include condominiums, town houses, a spa, and swimming pools. The Beaubassin Rural Planning District Commission provides guidance for subdivision serviced by individual private wells as follows:
The per-person requirement shall be 450 litres per day. Peak demand occurs for a period of 120 minutes each day. This is equivalent to a peak demand rate of 3.75 litres/minute for each person. The basic minimum pumping test rate is this rate multiplied by the “likely number of persons per well” which, for a single-family residence, shall be the number of bedrooms plus one.
2
Based on the above, the water demand can be calculated as follows:
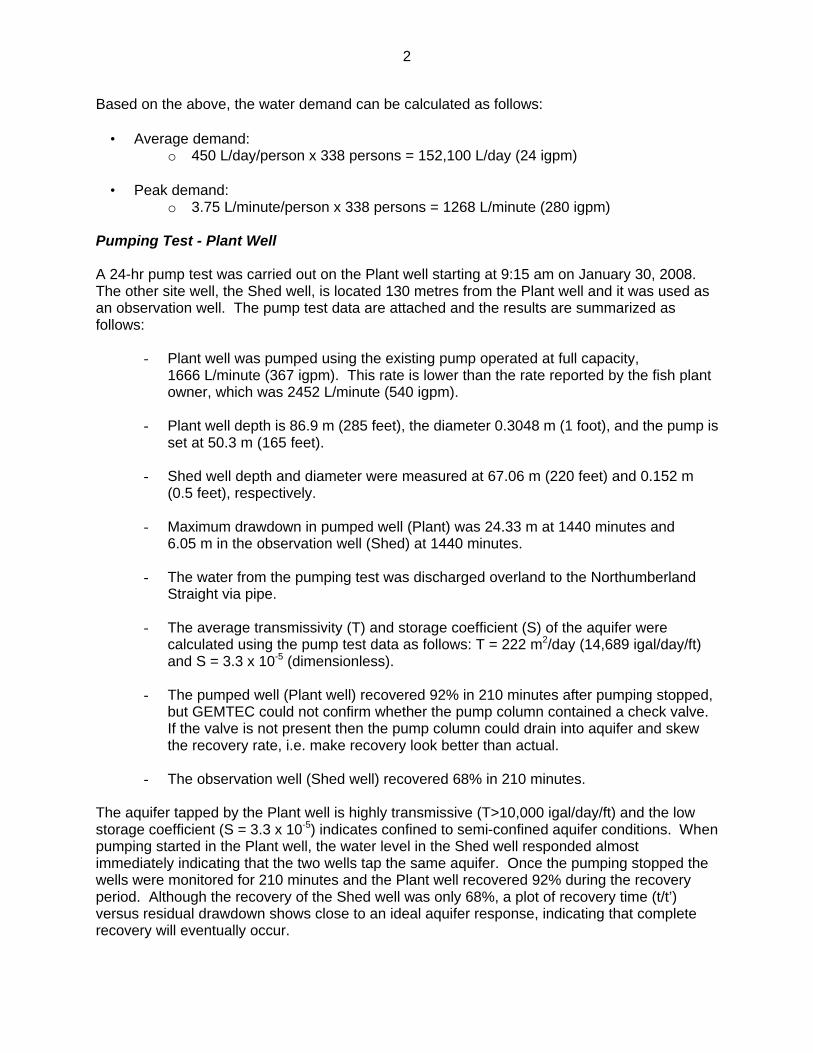
• Average demand: o 450 L/day/person x 338 persons = 152,100 L/day (24 igpm)
• Peak demand:
o 3.75 L/minute/person x 338 persons = 1268 L/minute (280 igpm) Pumping Test - Plant Well A 24-hr pump test was carried out on the Plant well starting at 9:15 am on January 30, 2008. The other site well, the Shed well, is located 130 metres from the Plant well and it was used as an observation well. The pump test data are attached and the results are summarized as follows:
- Plant well was pumped using the existing pump operated at full capacity, 1666 L/minute (367 igpm). This rate is lower than the rate reported by the fish plant owner, which was 2452 L/minute (540 igpm).
- Plant well depth is 86.9 m (285 feet), the diameter 0.3048 m (1 foot), and the pump is
set at 50.3 m (165 feet). - Shed well depth and diameter were measured at 67.06 m (220 feet) and 0.152 m
(0.5 feet), respectively. - Maximum drawdown in pumped well (Plant) was 24.33 m at 1440 minutes and
6.05 m in the observation well (Shed) at 1440 minutes. - The water from the pumping test was discharged overland to the Northumberland
Straight via pipe. - The average transmissivity (T) and storage coefficient (S) of the aquifer were
calculated using the pump test data as follows: T = 222 m2/day (14,689 igal/day/ft) and S = 3.3 x 10⁻⁵ (dimensionless).
- The pumped well (Plant well) recovered 92% in 210 minutes after pumping stopped,
but GEMTEC could not confirm whether the pump column contained a check valve. If the valve is not present then the pump column could drain into aquifer and skew the recovery rate, i.e. make recovery look better than actual.
- The observation well (Shed well) recovered 68% in 210 minutes.
The aquifer tapped by the Plant well is highly transmissive (T>10,000 igal/day/ft) and the low storage coefficient (S = 3.3 x 10⁻⁵) indicates confined to semi-confined aquifer conditions. When pumping started in the Plant well, the water level in the Shed well responded almost immediately indicating that the two wells tap the same aquifer. Once the pumping stopped the wells were monitored for 210 minutes and the Plant well recovered 92% during the recovery period. Although the recovery of the Shed well was only 68%, a plot of recovery time (t/t’) versus residual drawdown shows close to an ideal aquifer response, indicating that complete recovery will eventually occur.

3
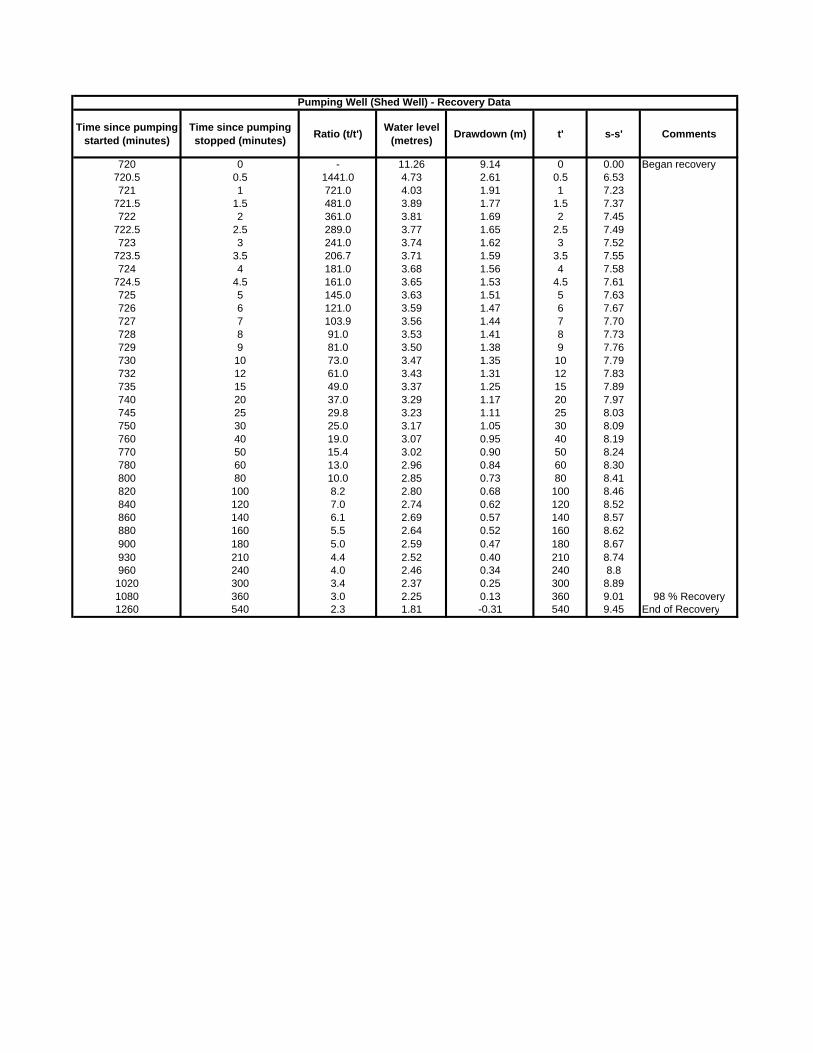
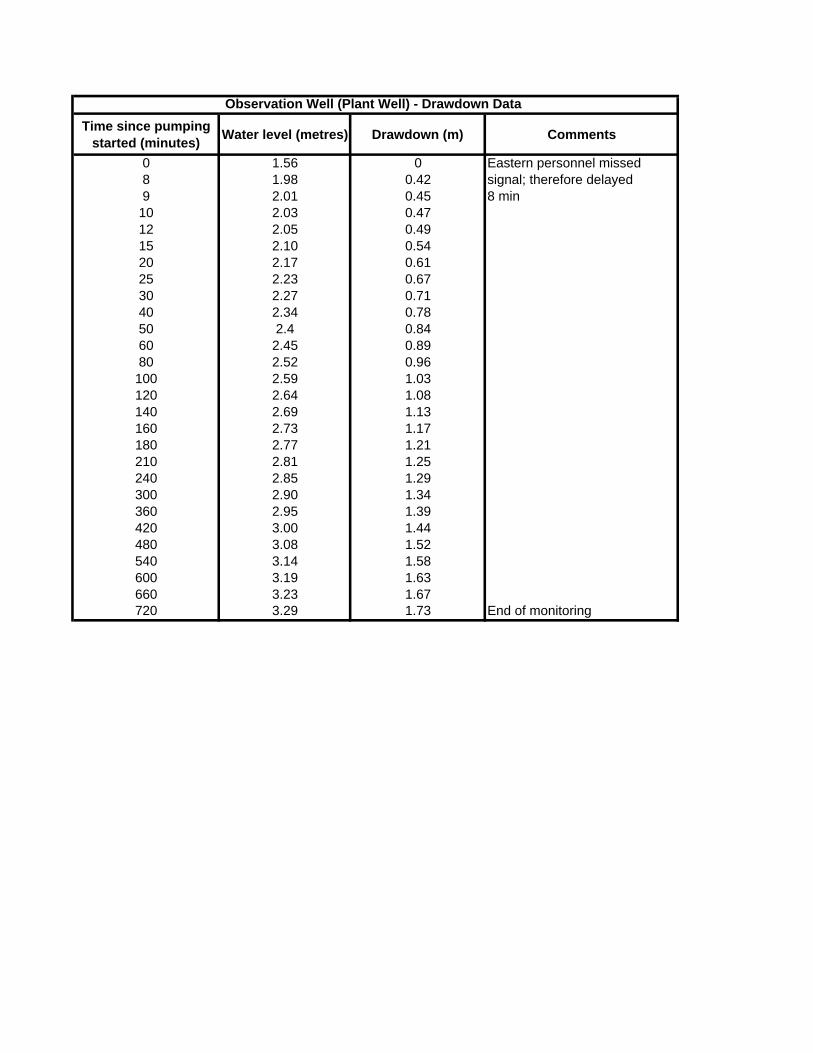
The available drawdown in a confined well is generally taken as the top of the aquifer. In this case there is no information regarding the geometry of the aquifer system or the main water bearing zones. Based on the reported historic pumping of the well, the available drawdown was assumed conservatively to be 33.5 m (110 feet). In calculating the long-term capacity of the well, the method outlined by the British Columbia Ministry of Environment (Ground Water Section) was followed. The long-term well capacity is normally estimated by multiplying the well's specific capacity after 100 days of pumping by 70% of the available drawdown in the well. Using this approach the well capacity is 1323 L/minute (290 igpm). This rate is approximately 70% of the pump test rate. The peak pumping rate (peak water demand) of 1268 L/minute (280 igpm) does not exceed the long-term capacity of the well, 1323 L/minute (290 igpm). Also, the actual long-term average pumping rate is only 109 L/minute (24 igpm), which is less than 10% of the capacity of the Plant well. Under these conditions the long term calculated drawdown in the Plant well is approximately 2 metres. Pumping Test - Shed Well A 12-hr pump test was carried out on the Shed well starting at 10:35 am on February 1, 2008. The Plant well was used as an observation well. The pump test data are attached and the results are summarized as follows:
- The Shed well was pumped at 672 L/minute (148 igpm). - The maximum drawdown in pumped well (Shed) and observation well (Plant) were
9.14 m and 1.73 m, respectively. Both occurred at 540 minutes into the test. - The average transmissivity (T) and storage coefficient (S) of the aquifer were
calculated using the pump test data as follows: T = 212 m2/day (14,219 igal/day/ft) and S = 3.4 x 10⁻⁵ (dimensionless).
- Both wells recovered above their initial static water levels within 540 minutes after
pumping stopped. The pump test on the Shed well indicates that the two site wells intersect the same confined to semi-confined aquifer. The capacity of the Shed well is likely higher than pump test rate of 672 L/minute (148 igpm), however, we do not recommend pumping above this rate without additional pump testing. At the recommended rate, the Shed well can meet the average water demand of the development. It is important to note that coastal aquifers may be susceptible to salt water intrusion under pumping conditions and the exact conditions leading to such problems are difficult to predict by theoretical means. Given the water demands of the proposed development, salt-water intrusion issues are not anticipated, based on the history of the site (continuous pumping at much higher rates without salt water issues) and based on discussions with local well drillers.
4
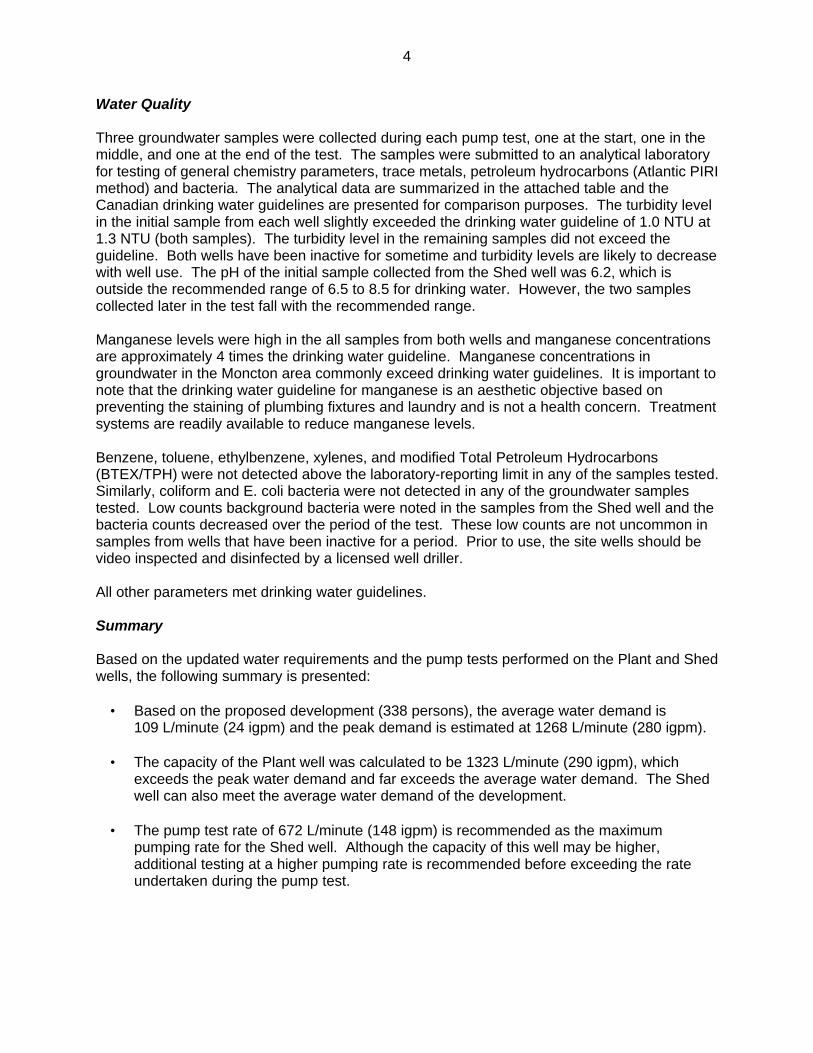
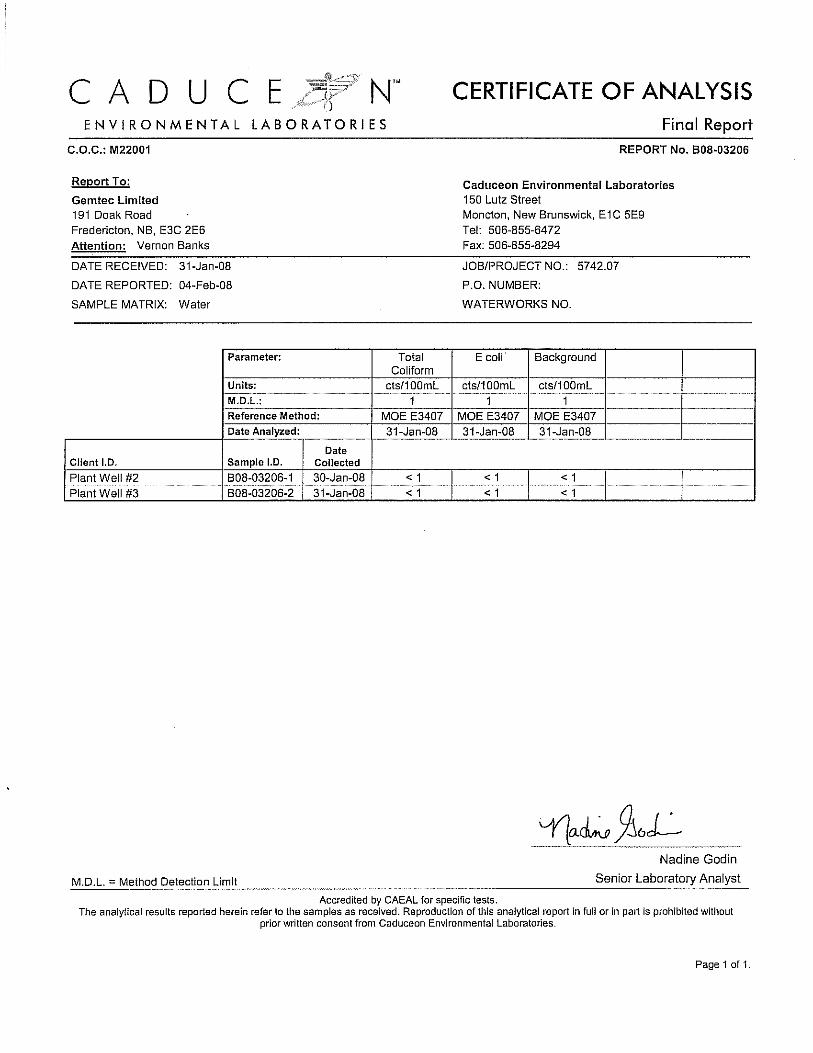
Water Quality Three groundwater samples were collected during each pump test, one at the start, one in the middle, and one at the end of the test. The samples were submitted to an analytical laboratory for testing of general chemistry parameters, trace metals, petroleum hydrocarbons (Atlantic PIRI method) and bacteria. The analytical data are summarized in the attached table and the Canadian drinking water guidelines are presented for comparison purposes. The turbidity level in the initial sample from each well slightly exceeded the drinking water guideline of 1.0 NTU at 1.3 NTU (both samples). The turbidity level in the remaining samples did not exceed the guideline. Both wells have been inactive for sometime and turbidity levels are likely to decrease with well use. The pH of the initial sample collected from the Shed well was 6.2, which is outside the recommended range of 6.5 to 8.5 for drinking water. However, the two samples collected later in the test fall with the recommended range. Manganese levels were high in the all samples from both wells and manganese concentrations are approximately 4 times the drinking water guideline. Manganese concentrations in groundwater in the Moncton area commonly exceed drinking water guidelines. It is important to note that the drinking water guideline for manganese is an aesthetic objective based on preventing the staining of plumbing fixtures and laundry and is not a health concern. Treatment systems are readily available to reduce manganese levels. Benzene, toluene, ethylbenzene, xylenes, and modified Total Petroleum Hydrocarbons (BTEX/TPH) were not detected above the laboratory-reporting limit in any of the samples tested. Similarly, coliform and E. coli bacteria were not detected in any of the groundwater samples tested. Low counts background bacteria were noted in the samples from the Shed well and the bacteria counts decreased over the period of the test. These low counts are not uncommon in samples from wells that have been inactive for a period. Prior to use, the site wells should be video inspected and disinfected by a licensed well driller. All other parameters met drinking water guidelines. Summary Based on the updated water requirements and the pump tests performed on the Plant and Shed wells, the following summary is presented:
• Based on the proposed development (338 persons), the average water demand is 109 L/minute (24 igpm) and the peak demand is estimated at 1268 L/minute (280 igpm).
• The capacity of the Plant well was calculated to be 1323 L/minute (290 igpm), which
exceeds the peak water demand and far exceeds the average water demand. The Shed well can also meet the average water demand of the development.
• The pump test rate of 672 L/minute (148 igpm) is recommended as the maximum
pumping rate for the Shed well. Although the capacity of this well may be higher, additional testing at a higher pumping rate is recommended before exceeding the rate undertaken during the pump test.

5
• The proposed development will consume less than 15 percent of the groundwater that was reportedly used by the fish plant. The inclusion of a spa and swimming pools as part of the development will not significantly affect this percentage.
• Other than manganese and minor exceedances of pH and turbidity in initial samples, all
groundwater parameters tested (major ions, petroleum, and bacteria) met drinking water guidelines. The guideline for manganese is an aesthetic objective based on preventing the staining of plumbing fixtures and laundry and is not a health concern. Treatment systems are readily available to reduce manganese levels.
• Prior to use, the site wells should be video inspected and disinfected by a licensed well
driller.
• Salt water intrusion is not anticipated given the current size of the proposed development, however, GEMTEC recommends that if the future water demands increase by more than 25% of proposed average demand (above 136 L/minute or 30 igpm) then additional evaluation should be undertaken, i.e., close monitoring of the water chemistry, water level measurements, and possibly groundwater modeling.
As noted in previous correspondence our assessment did not include potential requirements for fire protection. Sincerely, _____________________ Shaun Pelkey, P. Eng. SGP/pb Attachments cc: Mr. Danny Stymiest, Engineer, NB Department of Environment, Marysville Place (Via Email: [email protected]) Mr. Sylvain Losier (Via Email: [email protected]) Mr. Sebastien Doirion (Via Email: [email protected]) 5742.07/2008sgp0220l1(Revised Final).doc

SHED WELL
PLANT WELL
57420702 FIGURE 1File No.
Drawing
Drawing No.
Project
AGSDDrawn By Date
FEB, 2008 0Revision No.
GROUNDWATER SERVICES LOCATION PLAN
0 40 80
1:2000
120m

Transmissivitym2/day (igpd/ft)
drawdown 195 (13079) -residual drawdown 220 (14756) -calculated recovery 227 (15226) -
drawdown 219 (17627) 3.0 x 10⁻⁵
residual drawdown 231 (15493) -calculated recovery 238 (15963) 3.6 x10⁻⁵
222 (14689) 3.3 x 10⁻⁵
1. Cooper Jacob straight-line method used for analysis of drawdown and recovery.
OBSERVATION WELL
(Shed Well)
TABLE 1: SUMMARY OF PLANT WELL PUMP TEST RESULTS
Average
Well Method of analysis1 Coefficient of Storage
PLANT WELL (Pumped Well)

Time vs. DrawdownPlant (Plant Well) and Observation (Shed Well)
0
5
10
15
20
25
30
0 200 400 600 800 1000 1200 1400 1600 1800
Elapsed time (minutes)
Dra
wdo
wn
(met
res) Pumped Well
Observation Well

Log Time vs. DrawdownPumped (Plant Well) and Observation (Shed Well)
0
5
10
15
20
25
30
0.1 1 10 100 1000 10000
Elapsed time (minutes)
Dra
wdo
wn
(met
res) Pumped Well
Observation Well
Pumped Well Drawdown: Delta s = 2.25 m
Observation Well Drawdown: Delta s = 2.00 mto = 1.5 minutes
Casing storage negligible after 10 minutes

Calculated Recovery (t' vs. s-s')Pumped (Plant Well) and Observation (Shed Well)
0
5
10
15
20
25
0.1 1 10 100 1000
Time since pumping stopped t' (minutes)
s-s'
(met
res)
Pumped WellObservation Well
Pumped Well Recovery: Delta s-s' = 1.94 m
Observation Well Recovery: Delta s-s' = 1.85 mto = 1.65 minutes

Time since pumping started (minutes) Water level (metres) Drawdown (m) Comments
0 1.19 0.000.5 9.81 8.62 13" Orifice = 367 igpm1 13.07 11.88
1.5 15.10 13.912 16.45 15.26
2.5 17.64 16.453 18.08 16.89
3.5 18.57 17.384 18.95 17.76
4.5 19.28 18.095 19.53 18.346 19.94 18.757 20.23 19.048 20.43 19.249 20.61 19.4210 20.76 19.57 13" Orifice = 367 igpm12 21.00 19.8114 21.18 19.9916 21.33 20.1418 21.46 20.2720 21.58 20.392530 21.95 20.763540 22.28 21.094550 22.48 21.295560 22.65 21.4680 22.96 21.77
100 23.20 22.01120 23.32 22.13140 23.45 22.26160 23.58 22.39180 23.67 22.48210 23.78 22.59240 23.93 22.74300 24.13 22.94360 24.29 23.10420 24.50 23.31480 24.66 23.47540 24.83 23.64600 24.97 23.78 13" Orifice = 367 igpm660 25.08 23.89720 25.15 23.96780 25.27 24.08840 25.30 24.11900 25.35 24.16960 25.41 24.221020 25.43 24.241080 25.47 24.281140 25.47 24.281200 25.47 24.281260 25.47 24.281320 25.47 24.281380 25.49 24.30 13" Orifice = 367 igpm1440 25.52 24.33 13" Orifice = 367 igpm
Pumping Well (Plant Well) - Drawdown Data

Time since pumping started
(minutes)
Time since pumping stopped (minutes) Ratio (t/t') Water level
(metres) Drawdown (m) t' s-s' Comments
1440 0 0.00 25.52 24.33 0 0.001440.5 0.5 2881.00 16.17 14.98 1 9.351441 1 1441.00 11.38 10.19 1 14.14
1441.5 1.5 961.00 - - - -1442 2 721.00 7.50 6.31 2 18.02
1442.5 2.5 577.00 - - - -1443 3 481.00 6.83 5.64 3 18.69
1443.5 3.5 412.43 - - - -1444 4 361.00 6.49 5.30 4 19.03
1444.5 4.5 321.00 - - - -1445 5 289.00 6.26 5.07 5 19.261446 6 241.00 6.08 4.89 6 19.441447 7 206.71 5.94 4.75 7 19.581448 8 181.00 5.82 4.63 8 19.701449 9 161.00 5.71 4.52 9 19.811450 10 145.00 5.62 4.43 10 19.901452 12 121.00 5.46 4.27 12 20.061455 15 97.00 5.26 4.07 15 20.261460 20 73.00 5.02 3.83 20 20.501465 25 58.60 4.83 3.64 25 20.691470 30 49.00 4.67 3.48 30 20.851480 40 37.00 4.43 3.24 40 21.091490 50 29.80 4.25 3.06 50 21.271500 60 25.00 4.10 2.91 60 21.421520 80 19.00 3.86 2.67 80 21.661540 100 15.40 3.68 2.49 100 21.841560 120 13.00 3.52 2.33 120 22.001580 140 11.29 3.39 2.20 140 22.131600 160 10.00 3.27 2.08 160 22.251620 180 9.00 3.20 2.01 180 22.321650 210 7.86 3.08 1.89 210 22.44
Pumping Well (Plant Well) - Recovery Data
Time since pumping started
(minutes)
Time since pumping stopped
(minutes)Ratio (t/t')
Water level
(metres)Drawdown (m) t' s-s' Comments
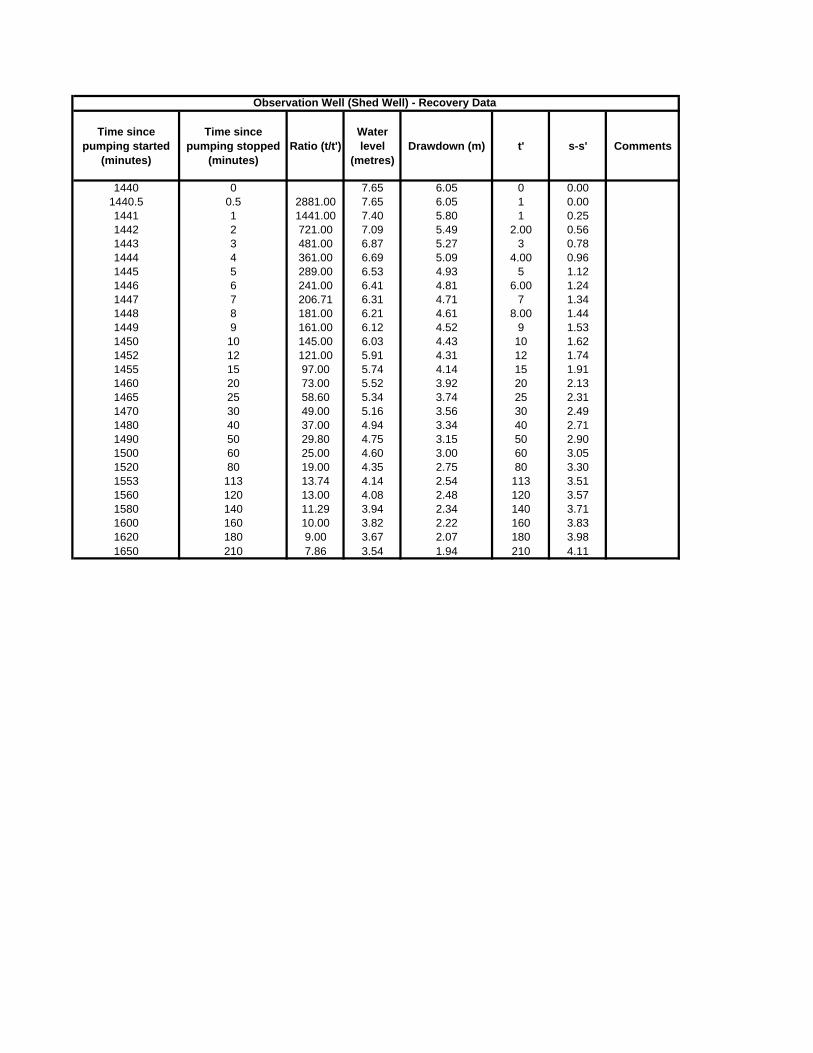
1440 0 7.65 6.05 0 0.001440.5 0.5 2881.00 7.65 6.05 1 0.001441 1 1441.00 7.40 5.80 1 0.251442 2 721.00 7.09 5.49 2.00 0.561443 3 481.00 6.87 5.27 3 0.781444 4 361.00 6.69 5.09 4.00 0.961445 5 289.00 6.53 4.93 5 1.121446 6 241.00 6.41 4.81 6.00 1.241447 7 206.71 6.31 4.71 7 1.341448 8 181.00 6.21 4.61 8.00 1.441449 9 161.00 6.12 4.52 9 1.531450 10 145.00 6.03 4.43 10 1.621452 12 121.00 5.91 4.31 12 1.741455 15 97.00 5.74 4.14 15 1.911460 20 73.00 5.52 3.92 20 2.131465 25 58.60 5.34 3.74 25 2.311470 30 49.00 5.16 3.56 30 2.491480 40 37.00 4.94 3.34 40 2.711490 50 29.80 4.75 3.15 50 2.901500 60 25.00 4.60 3.00 60 3.051520 80 19.00 4.35 2.75 80 3.301553 113 13.74 4.14 2.54 113 3.511560 120 13.00 4.08 2.48 120 3.571580 140 11.29 3.94 2.34 140 3.711600 160 10.00 3.82 2.22 160 3.831620 180 9.00 3.67 2.07 180 3.981650 210 7.86 3.54 1.94 210 4.11
Observation Well (Shed Well) - Recovery Data

Time since pumping started (minutes) Water level (metres) Drawdown (m) Comments
0 1.600 0.000.5 1.640 0.041 1.70 0.10
1.5 -2 2.07 0.47
2.5 -3 2.26 0.66
3.5 -4 2.41 0.81
4.5 -5 2.55 0.956 2.66 1.067 2.77 1.178 2.86 1.269 2.94 1.3410 3.03 1.4312 3.17 1.5714 3.35 1.7516 -18 -20 3.59 1.9925 3.78 2.1830 3.94 2.3435 -40 4.20 2.6045 -50 4.39 2.7955 -60 4.55 2.9580 4.82 3.22
100 5.03 3.43120 5.21 3.61140 5.36 3.76160 5.49 3.89180 5.61 4.01210 5.75 4.15240 5.87 4.27300 6.07 4.47360 6.24 4.64420 6.42 4.82480 6.60 5.00540 6.79 5.19600 6.98 5.38660 7.10 5.50720 7.20 5.60780 7.31 5.71840 7.39 5.79900 7.48 5.88960 7.54 5.941020 7.55 5.951080 7.57 5.971140 7.58 5.981200 7.59 5.991260 7.59 5.991320 7.59 5.991380 7.59 5.991440 7.65 6.05
Observation Well (Shed Well) - Drawdown Data

Transmissivity m2/day (igpd/ft)
drawdown 209 (14018) -residual drawdown 187 (12542) -calculated recovery 237 (15896) -
drawdown 197 (13213) 3.6 x 10⁻⁵
residual drawdown 222 (14890) -
calculated recovery 222 (14890) 3.1 x10⁻⁵
212 (14219) 3.4 x 10⁻⁵
1. Cooper Jacob straight-line method used for analysis of drawdown and recovery.
OBSERVATION WELL (Plant Well)
TABLE 2: SUMMARY OF SHED WELL PUMP TEST RESULTS
Average
Well Method of analysis1 Coefficient of Storage
SHED WELL (Pumped Well)
Pumptest2AData.xls - Summary Table2/8/2008 10:04 AM

Time vs. DrawdownPlant (Shed Well) and Observation (Plant Well)
-2
0
2
4
6
8
10
0 200 400 600 800 1000 1200 1400
Elapsed time (minutes)
Dra
wdo
wn
(met
res) Pumped Well
Observation Well

Log Time vs. DrawdownPumped (Shed Well) and Observation (Plant Well)
0
1
2
3
4
5
6
7
8
9
10
0.1 1 10 100 1000
Elapsed time (minutes)
Dra
wdo
wn
(met
res) Pumped Well
Observation WellPumped Well Drawdown: Delta s = 0.85 m
Observation Well Drawdown: Delta s = 0.90 mto = 2.0 minutes
Casing storage negligible after 3.5 minutes

Calculated Recovery (t' vs. s-s')Pumped (Shed Well) and Observation (Plant Well)
0
1
2
3
4
5
6
7
8
9
10
0.1 1 10 100 1000
Time since pumping stopped t' (minutes)
s-s'
(met
res)
Pumped WellObservation Well
Pumped Well Recovery: Delta s-s' = 0.95 m
Observation Well Recovery: Delta s-s' = 0.80 mto = 1.5 minutes

Residual Drawdown (ratio t/t' vs. s')Pumped (Shed Well) and Observation (Plant Well)
-0.50
0.00
0.50
1.00
1.50
2.00
2.50
3.00
1 10 100 1000 10000
Ratio t/t'
s' (m
etre
s)
Pumped WellObservation Well
Pumped Well Recovery: Delta s' = 0.75 m
Observation Well Recovery: Delta s' = 0.80 m

Time since pumping started (minutes)
Water level (metres) Drawdown (m) Comments
0 2.12 0 18" Orifice = 148 igpm0.5 6.37 4.251 7.38 5.26
1.5 7.89 5.772 8.22 6.1
2.5 8.38 6.263 8.45 6.33
3.5 8.53 6.414 8.61 6.49
4.5 8.65 6.535 8.68 6.566 8.86 6.747 8.97 6.858 9.01 6.899 9.04 6.9210 9.07 6.9512 9.15 7.0315 9.22 7.120 9.27 7.1525 9.33 7.2130 9.38 7.2640 9.41 7.2950 9.48 7.3660 9.48 7.3680 9.52 7.4
100 9.84 7.72120 9.95 7.83140 10.04 7.92160 10.04 7.92180 10.10 7.98210 10.13 8.01240 10.14 8.02300 10.19 8.07360 10.24 8.12420 10.3 8.18480 10.36 8.24540 10.45 8.33600 10.51 8.39660 10.32 8.2 Adjust flow to 148 igpm720 11.26 9.14 End of pump test
Pumping Well (Shed Well) - Drawdown Data
Time since pumping started (minutes)
Time since pumping stopped (minutes) Ratio (t/t') Water level
(metres) Drawdown (m) t' s-s' Comments
720 0 - 11.26 9.14 0 0.00 Began recovery720.5 0.5 1441.0 4.73 2.61 0.5 6.53721 1 721.0 4.03 1.91 1 7.23
721.5 1.5 481.0 3.89 1.77 1.5 7.37722 2 361.0 3.81 1.69 2 7.45
722.5 2.5 289.0 3.77 1.65 2.5 7.49723 3 241.0 3.74 1.62 3 7.52
723.5 3.5 206.7 3.71 1.59 3.5 7.55724 4 181.0 3.68 1.56 4 7.58
724.5 4.5 161.0 3.65 1.53 4.5 7.61725 5 145.0 3.63 1.51 5 7.63726 6 121.0 3.59 1.47 6 7.67727 7 103.9 3.56 1.44 7 7.70728 8 91.0 3.53 1.41 8 7.73729 9 81.0 3.50 1.38 9 7.76730 10 73.0 3.47 1.35 10 7.79732 12 61.0 3.43 1.31 12 7.83735 15 49.0 3.37 1.25 15 7.89740 20 37.0 3.29 1.17 20 7.97745 25 29.8 3.23 1.11 25 8.03750 30 25.0 3.17 1.05 30 8.09760 40 19.0 3.07 0.95 40 8.19770 50 15.4 3.02 0.90 50 8.24780 60 13.0 2.96 0.84 60 8.30800 80 10.0 2.85 0.73 80 8.41820 100 8.2 2.80 0.68 100 8.46840 120 7.0 2.74 0.62 120 8.52860 140 6.1 2.69 0.57 140 8.57880 160 5.5 2.64 0.52 160 8.62900 180 5.0 2.59 0.47 180 8.67930 210 4.4 2.52 0.40 210 8.74960 240 4.0 2.46 0.34 240 8.81020 300 3.4 2.37 0.25 300 8.891080 360 3.0 2.25 0.13 360 9.01 98 % Recovery1260 540 2.3 1.81 -0.31 540 9.45 End of Recovery
Pumping Well (Shed Well) - Recovery Data
Time since pumping started (minutes) Water level (metres) Drawdown (m) Comments
0 1.56 0 Eastern personnel missed 8 1.98 0.42 signal; therefore delayed9 2.01 0.45 8 min
10 2.03 0.4712 2.05 0.4915 2.10 0.5420 2.17 0.6125 2.23 0.6730 2.27 0.7140 2.34 0.7850 2.4 0.8460 2.45 0.8980 2.52 0.96100 2.59 1.03120 2.64 1.08140 2.69 1.13160 2.73 1.17180 2.77 1.21210 2.81 1.25240 2.85 1.29300 2.90 1.34360 2.95 1.39420 3.00 1.44480 3.08 1.52540 3.14 1.58600 3.19 1.63660 3.23 1.67720 3.29 1.73 End of monitoring
Observation Well (Plant Well) - Drawdown Data

Time since pumping started (minutes)
Time since pumping stopped (minutes) Ratio (t/t') Water level
(metres) Drawdown (m) t' s-s' Comments
720 0 - 3.29 1.73 0 0.00721 1 721.0 3.29 1.73 1 0.00722 2 361.0 3.18 1.62 2 0.11723 3 241.0 3.13 1.57 3 0.16724 4 181.0 3.06 1.50 4 0.23725 5 145.0 3.01 1.45 5 0.28726 6 121.0 2.94 1.38 6 0.35727 7 103.9 2.90 1.34 7 0.39728 8 91.0 2.88 1.32 8 0.41729 9 81.0 2.87 1.31 9 0.42730 10 73.0 2.82 1.26 10 0.47732 12 61.0 2.77 1.21 12 0.52735 15 49.0 2.72 1.16 15 0.57740 20 37.0 2.64 1.08 20 0.65745 25 29.8 2.60 1.04 25 0.69750 30 25.0 2.53 0.97 30 0.76760 40 19.0 2.46 0.90 40 0.83770 50 15.4 2.39 0.83 50 0.90780 60 13.0 2.34 0.78 60 0.95800 80 10.0 2.26 0.70 80 1.03820 100 8.2 2.19 0.63 100 1.10840 120 7.0 2.14 0.58 120 1.15860 140 6.1 2.09 0.53 140 1.20880 160 5.5 2.05 0.49 160 1.24900 180 5.0 2.00 0.44 180 1.29930 210 4.4 1.94 0.38 210 1.35960 240 4.0 1.88 0.32 240 1.411020 300 3.4 1.8 0.24 300 1.491080 360 3.0 1.71 0.15 360 1.58 91 % Recovery1260 540 2.3 1.39 -0.17 540 1.9 End of monitoring
Observation Well (Plant Well) - Recovery Data

Well ID Units CDWQG
Date Sample #1 1 hour
Sample #2 12 hour
Sample #3 24 hour
Sample #1 1 hour
Sample #2 6 hour
Sample #3 12 hour
Sodium mg/L 200 32.6 33.3 34.2 22.9 29.7 31.2Potassium mg/L n.g. 2.14 2.18 2.23 1.78 2.01 2.05Calcium mg/L n.g. 39.2 42.1 43.5 33.7 37.5 38.2Magnesium mg/L n.g. 8.17 8.68 8.91 6.58 7.58 7.79Iron mg/L 0.3 0.04 0.04 0.05 0.04 0.04 0.05Manganese mg/L 0.05 0.210 0.223 0.229 0.189 0.194 0.197Copper mg/L 1 < 0.001 < 0.001 < 0.001 < 0.001 < 0.001 < 0.001Zinc mg/L 5 0.002 0.001 0.004 0.002 0.001 0.002Ammonia mg/L n.g. < 0.05 < 0.05 < 0.05 < 0.05 < 0.05 < 0.05pH 6.5-8.5 7.6 7.8 7.9 6.2 6.8 7.1Alkalinity mg/L n.g. 99 106 108 113 108 112Chloride mg/L 250 64.0 73.6 79.5 28.1 49.1 53.4Fluoride mg/L 1.5 0.25 0.25 0.25 0.23 0.23 0.22Sulfate mg/L 500 13 14 15 10 13 13Nitrate + Nitrite (as N) mg/L n.g. < 0.05 < 0.05 < 0.05 < 0.05 < 0.05 < 0.05o-Phosphate mg/L n.g. 0.01 < 0.01 < 0.01 < 0.01 0.03 < 0.01r-Silica mg/L n.g. 13.4 13.3 13.3 13.9 13.7 13.8Total Organic Carbon mg/L n.g. 0.9 0.9 1.0 0.8 0.8 0.9Turbidity NTU 1 1.3 0.3 0.3 1.3 0.3 0.5Conductivity uS/cm n.g. 435 465 480 285 345 363
Calculated ParametersBicarbonate mg/L n.g. 98.6 105 107 113 108 112Carbonate mg/L n.g. 0.369 0.625 0.800 0.017 0.064 0.132Hydroxide mg/L n.g. 0.020 0.032 0.040 0.001 0.003 0.006Cation sum meq/L n.g. 4.11 4.33 4.46 3.27 3.85 3.97Anion sum meq/L n.g. 4.05 4.49 4.71 3.26 3.82 4.02% difference % n.g. 0.69 -1.77 -2.76 0.23 0.42 -0.60Theoretical Conductivity uS/L n.g. 407 439 458 312 375 391Hardness mg/L n.g. 132 141 145 111 125 127Ion Sum mg/L n.g. 233 252 263 172 205 214Saturation pH Units n.g. 8.0 8.0 8.0 8.0 8.0 8.0Langelier -0.44 -0.18 -0.06 -1.83 -1.21 -0.89
Aluminum ug/L 100 2 2 12 1 2 5Antimony ug/L 6 0.1 < 0.1 < 0.1 < 0.1 < 0.1 < 0.1Arsenic ug/L 10 2 2 2 1 1 1Barium ug/L 1000 205 219 228 198 224 227Beryllium ug/L n.g. < 0.1 < 0.1 < 0.1 < 0.1 < 0.1 < 0.1Bismuth ug/L n.g. < 1 < 1 < 1 < 1 < 1 < 1Boron ug/L 5000 16 15 15 14 15 15Cadmium ug/L 5 < 0.1 < 0.1 < 0.1 < 0.1 < 0.1 < 0.1Calcium ug/L n.g. 39200 42100 43500 33700 37500 38200Chromium ug/L 50 1 1 1 1 1 1Cobalt ug/L n.g. 0.1 0.1 0.1 < 0.1 < 0.1 < 0.1Copper ug/L 1000 < 1 < 1 < 1 < 1 < 1 < 1Iron ug/L 300 40 40 50 40 40 50Lead ug/L 10 < 0.1 < 0.1 < 0.1 < 0.1 < 0.1 < 0.1Lithium ug/L n.g. 6.3 6.4 6.5 5.6 6.3 6.4Magnesium ug/L n.g. 8170 8680 8910 6580 7580 7790Manganese ug/L 50 210 223 229 189 194 197Molybdenum ug/L n.g. 0.3 0.2 0.2 0.2 0.2 0.2Nickel ug/L n.g. < 1 < 1 < 1 < 1 < 1 < 1Potassium ug/L n.g. 2140 2180 2230 1780 2010 2050Rubidium ug/L n.g. 0.5 0.5 0.6 0.4 0.5 0.5Selenium ug/L 10 < 1 < 1 < 1 < 1 < 1 < 1Silver ug/L n.g. < 0.1 < 0.1 < 0.1 < 0.1 < 0.1 < 0.1Sodium ug/L 200000 32600 33300 34200 22900 29700 31200Strontium ug/L n.g. 463 494 506 490 576 592Tellurium ug/L n.g. < 0.1 < 0.1 < 0.1 < 0.1 < 0.1 < 0.1Thallium ug/L n.g. < 0.1 < 0.1 < 0.1 < 0.1 < 0.1 < 0.1Tin ug/L n.g. < 0.1 < 0.1 < 0.1 < 0.1 < 0.1 < 0.1Uranium ug/L 20 0.3 0.4 0.4 < 0.1 0.1 0.1Vanadium ug/L n.g. < 1 < 1 < 1 < 1 < 1 < 1Zinc ug/L 5000 2 1 4 2 1 2n.g. = no guidelineResult Above CDWQG (2007)
Table 1 Water quality data from pump test - Plant Well and Shed WellPlant Well Shed Well
CDWQG - Canadian Council of Ministers of the Environment. 2007. Guidelines for Canadian drinking water quality: Summary table. Updated September, 2007. In: Canadian environmental quality guidelines, 1999, Canadian Council of Ministers of the Environment.
5742.07/2/8/2008.xls

Gemtec Limited191 Doak Road
Fredericton, NB E3C 2E6
Report ID: 77524-OASReport Date: 05-Feb-08Date Received: 01-Feb-08
Attention: Vernon BanksFax: [email protected]
Hydrocarbon Analysis in Water (Atlantic MUST)RPC Sample ID: 77524-1 77524-2 77524-3Client Sample ID: Plant Well #1 Plant Well #2 Plant Well #3
Date Sampled: 30-Jan-08 30-Jan-08 31-Jan-08Matrix: water water waterAnalytes Units RLBenzene mg/L 0.001 < 0.001 < 0.001 < 0.001Toluene mg/L 0.001 < 0.001 < 0.001 < 0.001Ethylbenzene mg/L 0.001 < 0.001 < 0.001 < 0.001Xylenes mg/L 0.001 < 0.001 < 0.001 < 0.001VPH C6-C10 (Less BTEX) mg/L 0.01 < 0.01 < 0.01 < 0.01EPH >C10-C21 mg/L 0.01 < 0.01 < 0.01 < 0.01EPH >C21-C32 mg/L 0.01 < 0.01 < 0.01 < 0.01Modified TPH Tier 1 mg/L 0.02 < 0.02 < 0.02 < 0.02VPH Surrogate (IBB) % 106 106 105EPH Surrogate (IBB) % 122 82 90EPH Surrogate (C32) % 131 117 107Resemblance ND ND NDThis report relates only to the sample(s) and information provided to the laboratory.RL = Reporting Limit
Project #: 5742.07
Bruce PhillipsSection ManagerOrganic Analytical Services
Angela ColfordLab Supervisor
Organic Analytical ServicesATL.MUST WATER LEVEL 1
Page 1 of 3

Gemtec Limited191 Doak Road
Fredericton, NB E3C 2E6
Report ID: 77524-OASReport Date: 05-Feb-08Date Received: 01-Feb-08
Method Summary
Resemblance LegendResemblance Code Resemblance Resemblance Code ResemblanceAG Aviation Gasoline PAH Possible PAHs DetectedCOMMENT See General Report Comments PG Possible Gasoline FractionFO Fuel Oil Fraction PLO Possible Lube Oil FractionFO.LO Fuel Oil and Lube Oil Fraction PWFO Possible Weathered Fuel Oil FractionG Gasoline Fraction PWG Possible Weathered Gasoline FractionLO Lube Oil Fraction TO Tranformer OilND Not Detected UP Unknown PeaksNR No Resemblance (not-petrogenic in origin) WFO Weathered Fuel Oil FractionNRLR No Resemblance in the lube oil range (>C21-C32). WG Weathered Gasoline FractionOP One Product (unidentified)
General Report Comments
CommentsPage 2 of 3

Gemtec Limited191 Doak Road
Fredericton, NB E3C 2E6
Report ID: 77524-OASReport Date: 05-Feb-08Date Received: 01-Feb-08
QA/QC ReportRPC Sample ID: BLANK8865 BLANK8867 SPIKE8410 SPIKE8412Type: VPH EPH VPH EPHMatrix: water water water waterAnalytes Units RL % Recovery % RecoveryBenzene mg/L 0.001 < 0.001 - 103% -Toluene mg/L 0.001 < 0.001 - 100% -Ethylbenzene mg/L 0.001 < 0.001 - 99% -Xylenes mg/L 0.001 < 0.001 - 102% -VPH C6-C10 (Less BTEX) mg/L 0.01 < 0.01 - 98% -EPH >C10-C21 mg/L 0.01 - < 0.01 - -EPH >C21-C32 mg/L 0.01 - < 0.01 - -EPH >C10-C32 mg/L - - - 97%MTBE mg/L 0.001 < 0.001 - 105% -
RL = Reporting Limit
Project #: 5742.07
ATL.MUST WATER LEVEL 1 - QAPage 3 of 3

Gemtec Limited191 Doak Road
Fredericton, NB E3C 2E6
Report ID: 77624-OASReport Date: 07-Feb-08Date Received: 05-Feb-08
Attention: Vernon BanksFax: [email protected]
Hydrocarbon Analysis in Water (Atlantic MUST)RPC Sample ID: 77624-1 77624-2 77624-3Client Sample ID: Shed Well #1 Shed Well #2 Shed Well #3
Date Sampled: 1-Feb-08 1-Feb-08 1-Feb-08Matrix: water water waterAnalytes Units RLBenzene mg/L 0.001 < 0.001 < 0.001 < 0.001Toluene mg/L 0.001 0.001 < 0.001 < 0.001Ethylbenzene mg/L 0.001 < 0.001 < 0.001 < 0.001Xylenes mg/L 0.001 < 0.001 < 0.001 < 0.001VPH C6-C10 (Less BTEX) mg/L 0.01 < 0.01 < 0.01 < 0.01EPH >C10-C21 mg/L 0.01 < 0.01 < 0.01 < 0.01EPH >C21-C32 mg/L 0.01 < 0.01 < 0.01 < 0.01Modified TPH Tier 1 mg/L 0.02 < 0.02 < 0.02 < 0.02VPH Surrogate (IBB) % 100 99 96EPH Surrogate (IBB) % 91 112 111EPH Surrogate (C32) % 98 118 116Resemblance ND ND NDThis report relates only to the sample(s) and information provided to the laboratory.RL = Reporting Limit
Project #: 5742.07
Angela ColfordLab SupervisorOrganic Analytical Services
Troy SmithChemist
Organic Analytical ServicesATL.MUST WATER LEVEL 1
Page 1 of 3

Gemtec Limited191 Doak Road
Fredericton, NB E3C 2E6
Report ID: 77624-OASReport Date: 07-Feb-08Date Received: 05-Feb-08
Method Summary
Resemblance LegendResemblance Code Resemblance Resemblance Code ResemblanceAG Aviation Gasoline PAH Possible PAHs DetectedCOMMENT See General Report Comments PG Possible Gasoline FractionFO Fuel Oil Fraction PLO Possible Lube Oil FractionFO.LO Fuel Oil and Lube Oil Fraction PWFO Possible Weathered Fuel Oil FractionG Gasoline Fraction PWG Possible Weathered Gasoline FractionLO Lube Oil Fraction TO Tranformer OilND Not Detected UP Unknown PeaksNR No Resemblance (not-petrogenic in origin) WFO Weathered Fuel Oil FractionNRLR No Resemblance in the lube oil range (>C21-C32). WG Weathered Gasoline FractionOP One Product (unidentified)
General Report Comments
CommentsPage 2 of 3

Gemtec Limited191 Doak Road
Fredericton, NB E3C 2E6
Report ID: 77624-OASReport Date: 07-Feb-08Date Received: 05-Feb-08
QA/QC ReportRPC Sample ID: BLANK8878 BLANK8882 SPIKE8423 SPIKE8427Type: VPH EPH VPH EPHMatrix: water water water waterAnalytes Units RL % Recovery % RecoveryBenzene mg/L 0.001 < 0.001 - 104% -Toluene mg/L 0.001 < 0.001 - 100% -Ethylbenzene mg/L 0.001 < 0.001 - 104% -Xylenes mg/L 0.001 < 0.001 - 105% -VPH C6-C10 (Less BTEX) mg/L 0.01 < 0.01 - 97% -EPH >C10-C21 mg/L 0.01 - < 0.01 - -EPH >C21-C32 mg/L 0.01 - < 0.01 - -EPH >C10-C32 mg/L - - - 89%MTBE mg/L 0.001 < 0.001 - 107% -
RL = Reporting Limit
Project #: 5742.07
ATL.MUST WATER LEVEL 1 - QAPage 3 of 3


Environment and Local Government/ L'Environnement et Gouvernements Locaux P.O. Box 6000, Fredericton, NB E3B 5H1/ CP 6000, Fredericton, N.-B. E3B 5H1
November 26, 2020 File No.: 100-05-R3 Fisher Engineering Ltd. 40 Fairfield Rd. Lower Coverdale, NB E1J 0A2 Attention: Michael Fisher RE: PID#: 70497763 In response to your request for property-based environmental information regarding the above noted property, please be advised that a search of related departmental electronic databases has been conducted with the information provided, and the following information was found.
There is no record of Ministerial Orders or Remediation Orders related to this PID number, using our current search process. Petroleum storage tank information related to PID# 70497763 is attached. These tanks have been registered with the Department, under the Petroleum Product Storage and Handling Regulation. Our records indicate that there has been contamination found at: 1.) 69 Cap Bimet Rd., Shediac, Paturel Seafood Ltd. (PID# 70497763). See attached
information report. 2.) 69 Cap Bimet Rd., Grand Barachois, Barry Group Inc. (PID# 70497763). See
attached information report, and Record of Site Condition. This PID number is not registered with the Department as a PCB Storage site. We have no records of landfill sites or former dumpsites located near this PID number.
The absence of departmental records in this search does not necessarily indicate that the sites have not been subject to environmental incidents. The information is accurate in that it provides a factual reflection of what is contained in departmental databases. The files themselves may or may not be complete. As an example, in the case of underground petroleum storage tanks, the files accurately reflect all those that were registered with the program; there may be underground storage tanks that were not registered and of which the Department has no knowledge.

2
Likewise, there may be incidents of spills of which the Department was not informed or which pre-date Departmental records. "Remediation Site Management System" was established in the early 2000's and does not contain a complete history of past spills or remediation efforts. Furthermore, if the properties have been recently altered, the PID#’s provided may not correspond with those contained in departmental files and thus on the databases. Any persons intending to purchase or occupy the property should make their own independent determination of the environmental condition of the property and the extent of responsibility and liability, if any, that may arise from taking ownership or occupancy. Authorizations Branch Enclosures: 4 /lr

SIRS Search Result Petroleum Storage (PID 70497763)
PID #: 70497763 Site #: 2248 Address: BARRY GROUP NB INC 69 CAP BIMET ROAD GRAND BARACHOIS
Tank Information
Current Status Removed
Date Out of Service 1990-06-15
Installation Date 1951
Tank Size 2270 L
Location Under Ground
Constructed Of Single Wall Steel
Substance Stored Furnace Oil
Current Status Removed
Date Out of Service 1990-11-22
Installation Date 1975
Tank Size 4540 L
Location Under Ground
Constructed Of Single Wall Steel
Substance Stored Gasoline
Current Status Removed
Date Out of Service 1990-11-22
Installation Date 1975
Tank Size 9080 L
Location Under Ground
Constructed Of Single Wall Steel
Substance Stored Diesel
Current Status Removed
Date Out of Service 1990-06-15
Installation Date 1950
Tank Size 4540 L
Location Under Ground
Constructed Of Single Wall Steel
Substance Stored Furnace Oil

Current Status Removed
Date Out of Service 1990-06-15
Installation Date 1956
Tank Size 13620 L
Location Under Ground
Constructed Of Single Wall Steel
Substance Stored Bunker
Current Status Removed
Date Out of Service 1997-07-03
Installation Date 1983
Tank Size 13650 L
Location Under Ground
Constructed Of Single Wall Steel
Substance Stored Diesel
Current Status Removed
Date Out of Service 1997-07-03
Installation Date 1983
Tank Size 9080 L
Location Under Ground
Constructed Of Single Wall Steel
Substance Stored Gasoline
Current Status Removed
Date Out of Service 1993-01-01
Installation Date 1980
Tank Size 908 L
Location Above Ground
Constructed Of Single Wall Steel
Substance Stored Diesel
Current Status Removed
Date Out of Service 2000-08-30
Installation Date 1970
Tank Size 29500 L
Location Above Ground
Constructed Of Single Wall Steel
Substance Stored Bunker

Current Status Removed
Date Out of Service 2005-01-01
Installation Date 1986
Tank Size 908 L
Location Above Ground
Constructed Of Steel
Substance Stored Furnace Oil
Current Status Removed
Date Out of Service 2006-01-01
Installation Date 1993
Tank Size 2250 L
Location Above Ground
Constructed Of Single Wall Steel
Substance Stored Diesel
Current Status Removed
Date Out of Service 1994-07-26
Installation Date Unknown
Tank Size 45400 L
Location Above Ground
Constructed Of Single Wall Steel
Substance Stored Bunker
Current Status Removed
Date Out of Service 1994-07-26
Installation Date Unknown
Tank Size 45400 L
Location Above Ground
Constructed Of Single Wall Steel
Substance Stored Bunker
Current Status Removed
Date Out of Service 2006-01-01
Installation Date 1997
Tank Size 2270 L
Location Above Ground
Constructed Of Double Wall Steel
Substance Stored Regular

Current Status Inactive
Date Out of Service 2007-06-01
Installation Date 2000
Tank Size 53500 L
Location Above Ground
Constructed Of Secondary Containment Steel
Substance Stored Bunker

Remediation Management (PID 70497763)
FILE 6515-3-0156
PID 70497763
SITENAME Paturel Seafood Ltd.
CIVIC ADDRESS 69 Cap Bimet Rd., Shediac
FILE OPENED 7/22/2000
FILE STATUS Closed 1999 Limited remedial action taken - no further action necessary.
CONTAMINATION TYPE Petroleum
PARTY RESPONSIBLE Property Owner
CONSULTANT none
ORDERS ISSUED No
RESULT TYPE Source PID

Remediation Management (PID 70497763)
FILE 6515-3-1253
PID 70497763
SITENAME Barry Group Inc.
CIVIC ADDRESS 69 Cap Bimet Rd., Grand Barachois
FILE OPENED 11/26/2007
FILE STATUS Closed 2003 - RBCA Tier 2 Site Specific Remedial Criteria achieved - Conditional closure.
CONTAMINATION TYPE Petroleum
PARTY RESPONSIBLE Cap Bimet Developments Limited
CONSULTANT GEMTEC Limited
ORDERS ISSUED No
RESULT TYPE Source PID


APPENDIX C
WASA APPLICATION

FISHER ENGINEERING LTD. Brinkley Investments Inc. Apartment Complex File # DE154, Dec. 2020
Pursuant to Section 3(5) of The Water Quality Regulation 82-126 Clean Environment Act Please answer the following questions: 1) Name of proponent: Brinkley Investments Inc. 2) The proposed water supply is to be used for what purpose? Existing well (former Patural Processing Plant 1950-2005) to be used for proposed new 92-
unit apartment building. Well identified by others as Shed Well. 3) Required water quantity (in m3/day): The estimated water requirement for the proposed apartment building is 82.8 m3/day
(12.7igpm), which was based on an average of 2 occupants / unit @ 450L/day/person. 4) List alternate water supply sources in area (including municipal systems): The surrounding areas rely on individual wells to provide groundwater for their potable
water supply. The nearest municipal system (Town of Shediac) infrastructure ends approximately 4km from the site. There are no plans to extend the infrastructure to the area.
5) Outline proposed work schedule: If conditions permit (i.e. minimal recharge conditions) a 72 hr pump test will be performed in
the winter of 2021 on the existing well. The intent is to pump the existing well and monitor the response in three surrounding existing wells. Based on a previous pump test performed the proposed pumping rate for the 72 hr test will be 76-100igpm, which is approximately ½ -2/3 of the previous rate. This proposed pumping rate will meet the required peak flow for the apartment building. Reporting will be completed once the pumping test is performed.
A map showing the existing well locations is attached.
Water Supply Source Assessment Step One Application
Brinkley Investments Inc Apartment Building, Cap Bimet, NB

FISHER ENGINEERING LTD. Brinkley Investments Inc. Apartment Complex File # DE154, Jan. 2021
2
6) Discuss area hydrogeology as it relates to the project requirements:
The regional bedrock geology is mapped as late Carboniferous stratified rock belonging to the Pictou Group, which is a subbasin of the Maritimes Carboniferous Basin. Mapping indicates that within the Pictou Group, the site falls within the Richibucto Formation, which consists mainly of grey multistoried sandstone interstratified with red-mudrock dominated sequences (Rivard et al. 2003).
The Richibucto Formation has been described as one of the more productive sandstone
formations in the province and is the best aquifer within Moncton Map-Area (Carr, 1959). The majority of the domestic wells drilled in this formation generally yield 20+ igpm (Carr, 1959).
Available domestic well logs received from the NBDELG database within a 500m radius of
the site are summarized in the attached Table 1. Well yields range from 33.1 to 654 m3/day with a median yield of 108 m3/day. Well depths range from 12.2 to 48.8 m.
Details of the two existing wells for the former fish plant (Plant well and shed well) were reported as being 86.9m and 67m deep respectively with reported usages during production of 3530m3/day.
Mr. Jacques Leblanc from Eastern Well Drillers stated that they have drilled numerous wells
in the Cap Bimet area with wells typically 120-140’ range, especially in an around the subject property are high yielding wells (20igpm +). Mr. Leblanc was also involved with the pumping test activities performed in 2008 and has provided well maintenance to the condo property well (former Plant well). Mr. Leblanc stated that the original submersible well in the Plant well is still located in the well and was not removed due to its size. This pump had the reported capacity of between 500-700igpm is not in use as the current building has its own pump in the well with a reported capacity of 75-80igpm.
As part of the development in 2008, there was a hydraulic evaluation completed by others on the two existing wells that were formally the fish plants production wells (Plant well and Shed Well). Results of that study showed that the proposed development in 2008 was estimated to consume less than 15% of the groundwater reportedly consumed by the fish plant. Both existing wells were found to have more than sufficient capacity to meet the water demand for the originally proposed development (338 persons).
7) Identify any existing pollution or contamination hazards within a (minimum) 500 m
radius of the proposed drill targets. If groundwater use problems (quantity or quality) have occurred in the past, then these should be identified. Historical land use that might pose a contamination hazard (i.e. tannery, industrial, disposal, etc.) should also be flagged:
Approximately 125 residential properties (mixed seasonal/permanent) are located within a
500 m radius of the subject property. These properties are all located within 500m of the existing well for this development (Shed Well) and former fish processing plant well (Plant well). The former fish plant property was registered as a contaminated site with remedial work completed in 2008 prior to the existing residential condominium building being constructed. The site was approved for residential land use with conditions on future building placement. The proposed building location for this project adheres to the conditions.

FISHER ENGINEERING LTD. Brinkley Investments Inc. Apartment Complex File # DE154, Jan. 2021
3
Water quality in the area overall is generally good. Elevated levels of iron, manganese and Turbidity have been encountered at concentrations above their Health Canada drinking water guidelines in groundwater wells within 500m of the subject property. Results of a water samples collected from the well on the subject property and adjacent condo property were provided from the original hydrogeological study. All of the results meet the applicable water guidelines with the exception of manganese. Groundwater samples will be collected during the pumping test and analyzed for the potable water package as recommended in the WSSA guideline. In addition to the potable water package, samples will be collected for petroleum hydrocarbons as well.
The potential for salt water intrusion and reduction of freshwater head will be evaluated as
part of the hydraulic testing. 8) Identify any watercourse(s) (stream, brook, river, wetland, etc.) within 30 m of the
proposed drill targets. There are no watercourses or mapped wetlands within 30 m of the existing well location.
GeoNB mapping was used to assist in locating the adjacent identified wetlands and the 30metre buffer.
9) Identify site supervisory personnel involved in the source development (municipal
officials, consultants and drillers): The source development consultant is FISHER ENGINEERING LTD. It is not anticipated that a new well will require drilling as the existing well (Shed Well) will be tested and if all works out used as the domestic supply for the proposed apartment. 10) Attach a 1:10000 map and/or recent air photo clearly identifying the following:
- proposed drill targets (existing well) - domestic or production wells within a 500 m radius from the existing well to be
tested. - any potential hazards identified in question 7
Refer to the attached Figure.
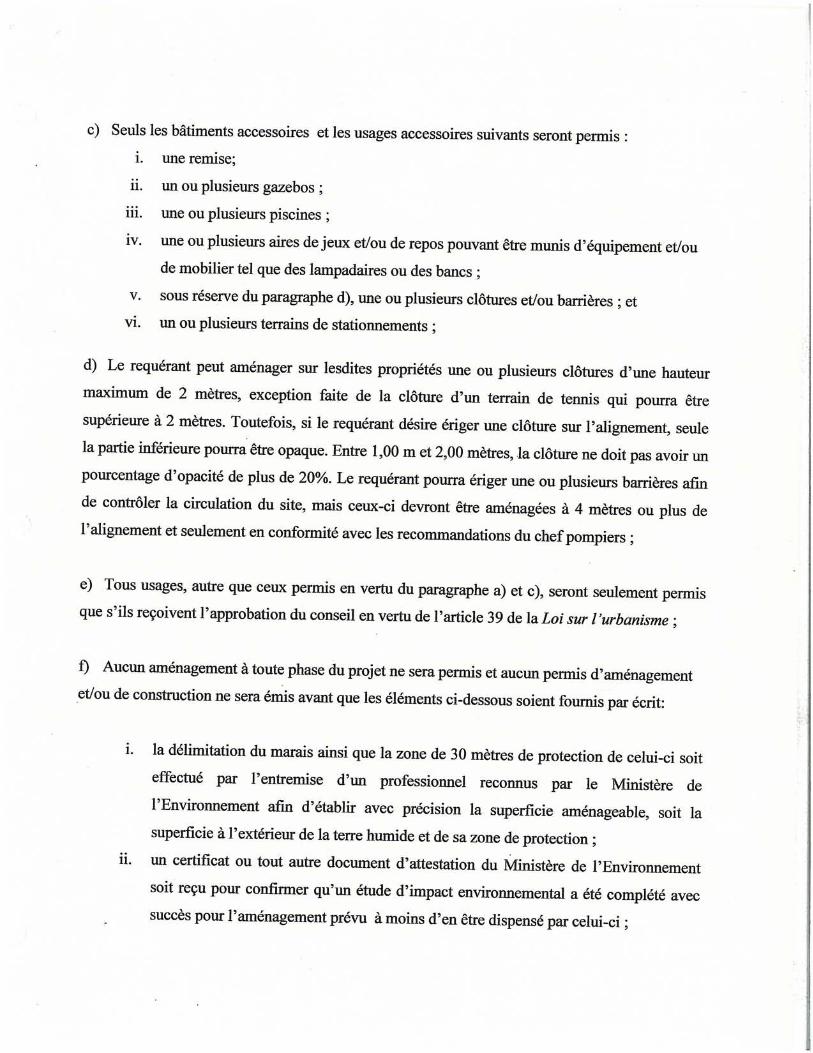
11) Attach a land use / zoning map of the area (if any). Superimpose drill targets on this
map. The proposed development falls within the Beaubassin West Planning Area within the
Southeast Regional Service Commission Planning Area. The subject property is zoned integrated development (ID) with adjacent land to the south also included within the ID zone and the majority of the remining area currently zoned Costal Residential (Zone CR). The ID zone allows for this proposed apartment as it allows for up to a total of 167 residential units.
12) Contingency plan for open loop earth energy systems No open loop earth energy systems are proposed for this development, not applicable. Enclosures DE154/Water Supply Source Assessment Application.doc


ZONESRR-Résidentielle rurale / RR-Rural ResidentialRC-Résidentielle côtière / CR-Coastal ResidentialCG-Commerce général / GC-General CommercialCC-Centre communautaire / CC-Community Centre
I-Industrie / I-Industry
E-Préservation de l'environnement / E-Environment ConservationDR-Développement des ressources / RD-Resource DevelopmentEIR-Exploitation intensive des ressources /IRE-Intensive Ressource Exploitation Zone
AI-Aménagement intégré / ID-Integrated Development Zone
P-Portuaire / P-Harbour
B-2 Carte de zonage de la Communauté rurale de Beaubassin-est /B-2 Carte de zonage de la Communauté rurale de Beaubassin-est /B-2 Beaubassin East Rural Community Zoning MapB-2 Beaubassin East Rural Community Zoning Map
C:\Julien\Annee13\ArcView_Dbase\Planning\CRBe\ZonageBBErAvril13B2.mxdRevision: 04 avril 2013, (FORMAT26x34) Echelle / Scale: 1:15000
Détroit de Northumberland Strait
30m30m
NOTE
: Secteur assujetie au Règlement sur la modification des cours d'eau et des terres humides-Loi sur l'assainissement de l'eau. 2003-16Area subject to the Watercourse and Wetland Alteration Regulation- Clean Water Act. 2003-16
Carte prépareé par: / Map Prepared by: Date / Date: Le 13 octobre 2007 / October 13, 2007
Carte préparée par:
J. Couturier. Date: janvier 2011 / January, 2011
Print le: 04 avril 2013 / April 04, 2013Update: septembre 2014 / September 2014
CARTE / MAP B-2Carte de zonage
de la Communauté rurale de Beaubassin-est /
Beaubassin East Rural Community Zoning Map
Buffer
Marais / Marsh
Ville de /Town of Shediac
Beaubassin WestPlanning
Area
Route 15
Route 133
Lac des Boudreau Lake
Route
933
Riviè
reAb
oujag
ane R
iver
Ch. K
innear
Rd
Route 15
Ch. Phil Rd
¬«C Rezonage Soumis avec Conditions /Subject Rezoning with Conditions
ENM - Élévation du niveau de la merSLR - Sea Level Rise
¬«C
¬«C¬«C
¬«C¬«C
¬«C
¬«C
¬«C
¬«C
¬«C
¬«C
¬«C¬«C
¬«C
¬«C
¬«C
¬«C
¬«C
¬«C
¬«C
¬«C¬«C
¬«C
¬«C
¬«C
¬«C
¬«C
¬«C
¬«C
¬«C
¬«C
¬«C ¬«C
¬«C
¬«C
¬«C
¬«C
¬«C
¬«C
¬«C
¬«C
¬«C
¬«C
¬«C
¬«C
¬«C¬«C
¬«C¬«C
")10
")9
")1
")2
")3
")6
")7C
")8
")12
")12
")13
0 350 700 1,050 1,400175mètre / metre
1:15,000
/
c
c
c

Report # Well Casing Rock Yield Rock Typel/min
1674 36.9 23.2 3.0 91 Sandstone1675 36.9 22.9 3.0 91 Sandstone6791 27.7 18.3 2.1 68 Sandstone6795 27.7 18.3 15.2 272 Sandstone6809 27.7 15.5 0.6 454 Sandstone12027 36.9 21.3 1.2 50 Conglomerate/Sandstone13861 26.5 6.1 4.6 23 Sandstone14331 36.6 20.1 1.2 82 Sandstone15208 42.7 30.5 7.0 318 Sandstone17589 36.6 24.4 3.7 91 Sandstone17972 42.7 29.3 0.9 318 Conglomerate/Sandstone19194 15.8 6.1 0.0 45 Sandstone24825 25.3 6.1 5.2 23 Sandstone25394 24.4 15.5 0.9 272 Sandstone25653 39.6 22.9 3.0 68 Sandstone25663 48.8 25.0 10.4 68 Sandstone25705 30.5 18.3 16.8 182 Sandstone27190 12.2 6.1 2.1 68 Sandstone28235 33.5 18.3 7.9 91 Sandstone29047 32.9 8.5 7.0 45 sand/gravel30161 19.8 6.1 4.9 68 Sandstone30185 15.8 6.1 2.4 91 Sandstone30914 36.6 24.4 3.0 54 Sandstone33169 22.9 18.3 1.5 68 Sandstone34793 13.7 6.1 5.5 23 Sandstone35382 18.3 7.0 1.5 27 Sandstone36501 15.2 7.3 3.0 68 Sandstone36507 18.3 7.0 0.0 54 Sandstone36538 30.5 18.3 2.1 136 Sandstone36636 36.6 24.4 4.9 182 Sandstone37040 30.5 18.3 4.6 227 Sandstone37197 42.7 21.3 0.0 136 Sandstone38598 19.8 13.1 12.2 68 Sandstone38993 21.3 12.2 5.8 272 Sandstone39481 33.5 18.3 2.1 227 Sandstone
90169100 33.8 12.2 11.9 68 Sandstone90210900 39.6 12.8 12.8 68 Sandstone90211000 14.3 6.1 3.0 68 Sandstone90386700 19.5 6.1 2.1 227 Sandstone90598300 38.4 16.5 4.3 45 Sandstone90818200 22.6 12.5 4.6 68 Sandstone91474700 30.5 16.5 14.0 114 Sandstone91731800 30.5 18.3 14.6 114 Sandstone91965200 30.5 24.4 1.5 454 Sandstone92006700 36.6 18.3 1.2 54 Sandstone92010700 24.4 16.2 11.9 114 Sandstone
Max 48.8 30.5 16.8 454Min 12.2 6.1 0.0 23Average 29.1 15.8 5.0 126Median 30.5 17.4 3.0 75
Table 1 Well Log Summary 500m Radius PID 70497763
Depths (m)

Parameter DWQG unitAluminum mg/L <0.025 <0.025 <0.025 <0.025 <0.025 <0.025 <0.025 <0.025 <0.025 <0.025 <0.025 <0.025 <0.025 <0.025 <0.025 <0.025 <0.025 <0.025 <0.025 0.055 0.002 0.001 0.08 <0.025 <0.025 <0.025 <0.025 <0.025 <0.025
Alkanity mg/L 110 99.6 104 109 106 114 79 87.9 97.5 96.7 109 99 70.4 87.5 86.1 59.1 97.2 93.6 102 130 94 87 95.57 99.9 92.1 99.8 66.6 99.5 95.8
Arsenic 10 µg/L <1.5 <1.5 <1.5 <1.5 <1.5 3.4 2.2 <1.5 2.3 4.5 1.6 7.4 <1.5 2.5 <1.5 <1.5 3.1 1.9 <1.5 3 <1.5 <1.5 0.2 3 1.88 1.6 <1.5 <1.5 <1.5
Boron 5 mg/L 0.017 0.015 0.016 0.034 0.01 0.012 0.01 0.02 0.016 0.015 0.018 0.017 0.024 0.015 0.055 0.028 0.013 0.015 0.021 0.049 0.052 0.013 0.04 0.2 0.02 0.019 0.01 0.01 0.01
Barium 1 mg/L 0.226 0.172 0.218 0.288 0.211 0.225 1.3 0.623 0.113 0.167 0.259 0.18 0.131 0.356 0.322 0.178 0.196 0.222 0.287 0.199 0.216 0.19 0.204 0.219 0.283 0.195 0.128 0.16 0.137
Bromine 10 mg/L 0.1 0.1 0.135 0.217 0.101 0.105 2.24 0.977 1.36 0.158 0.211 0.173 0.1 1.44 0.271 0.1 0.1 0.28 1.07 0.1 0.588 2.92 0.211 0.208 0.1
Calcium mg/L 34.7 30.3 31.9 45.3 31.5 36 217 67.5 77.7 22.5 40.8 34.5 32.7 77 68.6 37.7 30.4 34.7 40.5 40.7 38.7 27.5 18.34 38.1 49.4 74.3 23.9 26.2 26.6
Cadmium 5 µg/L <0.5 <0.5 <0.5 <0.5 <0.5 <0.5 <0.5 <0.5 <0.5 <0.5 <0.5 <0.5 <0.5 <0.5 <0.5 <0.5 <0.5 <0.5 <0.5 0.01 <0.01 <0.01 0.2 <0.5 <0.5 <0.5 <0.5 <0.5 <0.5
Chloride 250 mg/L 37.1 55.1 42.8 48.4 32.9 33.4 597 192 183 283 54 61.1 39 229 95.4 40.4 116 41 56.4 73.4 43.6 23.3 55.9 81.7 140 255 191 33.3 41.1
Conductivity 340 378 358 423 339 343 2050 809 881 1130 433 429 303 945 550 308 591 362 412 499 374 255 368 481 729 1080 780 324 345
Chromium 50 µg/L 11 <10 <10 <10 <10 <10 11 <10 <10 <10 <10 <10 <10 <10 <10 <10 <10 <10 <10 <1 3 <1 1.5 <10 <10 <10 <10 <10 <10
Copper 1000 µg/L <10 <10 <10 <10 20 <10 <10 <10 <10 <10 11 <10 <10 <10 <10 <10 <10 <10 <10 3 14 1 5 <10 <10 <10 <10 <10 41
E-coli Ab Ab Ab Ab Ab Ab Ab Ab Ab Ab Ab Ab Ab Ab Ab Ab Ab Ab Ab Ab Ab Ab Ab Ab Ab Ab Ab
Floride 1.5 mg/L 0.103 <0.1 <0.1 <0.1 <0.1 0.119 <0.1 <0.1 <0.1 0.131 <0.1 0.116 <0.1 <0.1 <0.1 <0.1 <0.1 <0.1 <0.1 0.05 0.11 0.13 0.11 0.108 <0.1 0.104 0.113 0.114 0.124
Iron 0.3 mg/L 0.235 0.372 0.66 0.097 1.95 0.147 1.21 0.163 0.065 0.54 0.579 0.429 0.036 0.332 0.099 0.414 0.977 0.283 0.013 0.1 0.07 0.72 0.158 <0.05 0.506 0.132 0.946 0.441 0.228
Hardness mg/L 121 111 115 136 112 115 710 254 266 85.3 143 120 94.4 291 193 105 113 124 135 115 105 94.8 62.5 137.5 182 283 88.7 93.4 85.7
Potassium mg/L 1.31 1.24 1.3 1.7 2.3 1.7 4.7 2.7 3 2.2 2.2 1.9 1.1 3.6 1.5 1.1 2.2 1.6 1.6 1.21 1.02 1.87 1.58 1.97 2.54 3.06 1.99 1.52 1.81
Magnesium mg/L 8.23 8.51 8.68 5.51 8.21 6.1 40.8 20.7 17.4 7.09 10.1 8.2 3.11 24 5.23 2.66 8.95 8.92 8.11 3.24 2.13 6.35 4.05 10.3 14.2 23.7 7.06 7.74 4.68
Mangnesium 0.05 mg/L 0.066 0.096 0.087 0.015 0.16 0.27 1 0.16 0.21 0.049 0.13 0.074 <0.005 0.22 0.007 0.015 0.16 0.072 0.049 0.019 0.002 0.15 0.041 0.124 0.146 0.275 0.214 0.087 0.074
Sodium 200 mg/L 23.8 40 22.6 31.2 24.2 24.2 108 49.6 62.5 183 29.9 37.2 21.7 59.8 32.1 19.7 67.8 23.7 30.7 53.7 32.3 12.4 55.51 36.7 47.8 73.2 113 23.1 33
Nitrite mg/L <0.05 <0.05 <0.05 <0.05 <0.05 <0.05 <0.05 <0.05 <0.05 <0.05 <0.05 <0.05 <0.05 <0.05 <0.05 <0.05 <0.05 <0.05 <0.05 0.06 <0.05 <0.05 <0.05 <0.05 <0.05 <0.05
Nitrate mg/L <0.05 <0.05 <0.05 2.4 <0.05 <0.05 <0.05 <0.05 <0.05 <0.05 <0.05 <0.05 0.41 0.05 6 3.1 <0.05 <0.05 <0.05 0.44 <0.05 <0.05 <0.05 <0.05 <0.05 <0.05
Nitrite + Nitrate 10 mg/L <0.05 <0.05 <0.05 2.5 <0.05 <0.05 <0.05 <0.05 <0.05 <0.05 <0.05 <0.05 0.46 <0.05 6 3.1 <0.05 <0.05 <0.05 0.35 2.6 <0.05 0.5 <0.05 <0.05 <0.05 <0.05 <0.05 <0.05
Lead 10 µg/L <1 1.8 <1 <1 17 1.4 1.7 2.3 <1 3.2 1.6 <1 <1 1.3 <1 <1 1.8 <1 <1 0.1 0.2 <1 3.6 <1 8.53 <1 <1 <1 5.26
pH 6.5-9.0 7.98 8.11 8.09 7.7 8.16 7.95 7.72 8 8.22 8.58 8.22 8.17 8.1 8.11 7.78 7.98 8.27 8.12 8.19 7.9 8.1 8 8.27 7.51 8.15 7.95 8.48 8.19 8.3
Antimony 6 µg/L <1 <1 <1 <1 <1 <1 <1 <1 <1 <1 <1 <1 <1 <1 <1 <1 <1 <1 <1 0.1 0.2 0.1 0.3 <1 <1 <1 <1 <1 <1
Selenium 10 µg/L <1.5 <1.5 <1.5 3.3 <1.5 <1.5 6 <1.5 <1.5 <1.5 <1.5 <1.5 <1.5 <1.5 <1.5 <1.5 <1.5 <1.5 <1.5 <1 <1 <1 1.3 2.75 3.3 <1.5 <1.5 <1.5
Sulphate 500 mg/L 9.47 12 10.6 11.5 13.3 12.1 17 7.54 22.8 13.7 12.3 13.6 12.2 12 15 8.44 13.1 13.7 12 21 13 16 12.03 15.7 18 26.3 12.4 13.9 15.4
TDS 500 mg/L 181 208 182 221 179 183 1036.7 394 427 570.66 216 217 154 460 297 160 298 181 212 274 200 141 328 516.22 391 166 181
Titanium µg/L <1 <1 <1 <1 <1 <1 <1 <1 <1 <1 <1 <1 <1 <1 <1 <1 <1 <1 <1 <1 <1 <1 <1 <1 <1 <1 <1 <1 <1
Turbidity 1 µg/L 1.71 14.9 3.8 1.6 31 1.6 5.6 1.2 0.37 1.8 0.89 1.8 0.57 2.7 1 3.8 6.6 1.4 0.2 2 0.5 7.8 1.7 0.2 0.9 1.08 8.6 3.1 4.1
Uranium 20 µg/L <0.5 <0.5 <0.5 <0.5 <0.5 <0.5 <0.5 <0.5 <0.5 0.7 <0.5 0.9 0.6 <0.5 <0.5 <0.5 <0.5 <0.5 0.6 0.8 0.3 <0.5 0.966 <0.5 <0.5 <0.5 <0.5
Zinc 5000 µg/L <5 10 <5 <5 53 11 12 9 <5 10 6 <5 <5 12 10 7 17 <5 <5 11 10 3 4 45 18 10 23 5.1 27
DWQG - Canadian Council of Ministers of the Environment Drinking Water Quality Guidelines.
Value does not meet applicable guideline
SampleTable 2 Water Quality Results, 500m Radius of PID 70497763