Embed Size (px)
Citation preview
1
Fish Habitat Management System
for Yukon Placer Mining
Aquatic Health Report (2016)
Prepared by
The Yukon Placer Secretariat
2017

2
Contents 1 Introduction .......................................................................................................................................... 3 2 Methods ................................................................................................................................................ 4
2.1 Aquatic Health Monitoring Protocol ............................................................................................. 4
2.2 CABIN ............................................................................................................................................ 4
2.3 Reference Condition Approach ..................................................................................................... 4
2.3.1 RCA Model............................................................................................................................. 4 2.4 CABIN Outputs .............................................................................................................................. 6
2.4.1 Group Assignment................................................................................................................. 6 2.4.2 Ordination ............................................................................................................................. 7 2.4.3 RIVPACS ................................................................................................................................. 8 2.4.4 Additional Metrics ................................................................................................................. 8
2.5 Annual Aquatic Health Monitoring ............................................................................................... 8
2.5.1 Study Area ............................................................................................................................. 8 2.5.2 Site Selection ......................................................................................................................... 8 2.5.3 Field Sampling ....................................................................................................................... 9 2.5.4 Invertebrate Classification .................................................................................................... 9 2.5.5 Placer Mining Activity Assessment ..................................................................................... 10
3 Results – 2016 Aquatic Health Monitoring ......................................................................................... 11 3.1 Study Area ................................................................................................................................... 11
3.2 Sample Sites ................................................................................................................................ 11
3.3 2016 Site Assessments ................................................................................................................ 12
3.4 Site Assessment Results and Trend Discussion ........................................................................... 13
3.4.1 Alsek River Watershed ........................................................................................................ 14 3.4.2 Big Creek Watershed ........................................................................................................... 16 3.4.3 Indian River Watershed ...................................................................................................... 18 3.4.4 McQuesten River Watershed .............................................................................................. 20 3.4.5 Forty Mile River Watershed ................................................................................................ 21 3.4.6 Klondike River Watershed ................................................................................................... 22 3.4.7 Mayo River Watershed ....................................................................................................... 24 3.4.8 Sixty Mile River Watershed ................................................................................................. 25 3.4.9 White River Watershed ....................................................................................................... 26 3.4.10 Yukon River South Watershed ............................................................................................ 28
4 Next Steps ........................................................................................................................................... 30 4.2 Additional Tasks and Future Monitoring .................................................................................... 30
Appendix 1 - CABIN Summary Reports for 2016 Test Site Assessments .................................................... 31 Appendix 2 - 75% Ellipse Plots for 2016 Test Sites Assessed in Band One in CABIN Online Assessment ... 32 Appendix 3 - CABIN Raw Site Data Outputs, 2016 Sample Sites ................................................................ 33
3
1 Introduction The Fish Habitat Management System for Yukon Placer Mining (FHMS) is intended to balance the objectives of a sustainable Yukon placer mining industry with the conservation and protection of fish and fish habitat supporting fisheries. Within the FHMS there are three effects-monitoring programs and associated protocols including Aquatic Health, Water Quality Objectives and Economic Health. All three programs help to verify the effectiveness of the FHMS in meeting its objectives. The Aquatic Health Monitoring program was designed to assess how effective the FHMS is at maintaining aquatic health for fish and fish habitat, information that will then be used to make changes to the program, if necessary, through adaptive management. The annual AHM program is jointly delivered by Fisheries and Oceans Canada (DFO) and the Yukon Government Department of Environment (YG). The Yukon Placer Secretariat was established to coordinate the implementation of the Fish Habitat Management System for Yukon Placer Mining and as such is responsible for producing this report. This report provides cursory background information to the AHM program and presents the results of 2016 monitoring efforts.

4
2 Methods
2.1 Aquatic Health Monitoring Protocol The Aquatic Health Monitoring (AHM) program is governed by the Aquatic Health Monitoring Protocol (http://www.yukonplacersecretariat.ca/infocentre.html). The AHM Protocol describes the objectives and key questions to be addressed in monitoring, and guides sampling design (locations, timing, frequency and methods employed), as well as the methods used to analyze data.
2.2 CABIN Data gathered under the AHM program is housed, managed, and analyzed online through the Canadian Aquatic Biomonitoring Network (CABIN), a website administered and maintained by Environment and Climate Change Canada (ECCC) to support the collection, assessment, reporting and distribution of biological monitoring information across Canada. CABIN is an aquatic biomonitoring network for assessing the health of freshwater ecosystems in Canada. CABIN is based on the network of networks approach that promotes inter-agency collaboration and data-sharing to achieve consistent and comparable reporting on freshwater quality and aquatic ecosystem conditions in Canada. CABIN allows for a formalized scientific assessment using nationally comparable standards overseen by a National Science Team. A training program for the application of CABIN protocols is provided by ECCC in partnership with the Canadian Rivers Institute (CRI) at the University of New Brunswick (UNB). Training ensures that practitioners of CABIN fieldwork, laboratory analysis and data entry and interpretation are operating under a nationally standardized methodology. Certified personnel can then reduce the work required in building their own biomonitoring program, benefit from the collective research efforts by practitioners across Canada and contribute consistent data to the national database. In turn, this data can be shared for building more accurate and up-to-date assessment models.
2.3 Reference Condition Approach Under the AHM program and CABIN, the Reference Condition Approach (RCA) is used to assess the health of freshwater aquatic ecosystems. The RCA uses the condition of the benthic invertebrate community assemblage as a surrogate for stream health. A Yukon and placer mining specific RCA empirical model has been developed to assist in this assessment. This model uses the habitat characteristics found at a site to predict the benthic macroinvertebrate community (at the family level) that should be expected at that site.
2.3.1 RCA Model
The development of the Yukon placer mining RCA model involved the collection of environmental descriptors and biological data from a wide variety of stream sites throughout the Yukon Territory that were considered to be “In Reference”, or unaffected by stressors that may impact the aquatic health of the stream. These Reference Sites were put through two steps. The first was to classify the sites based on their biological characteristics (the benthic macroinvertebrate community present). This requires defining a number of community types based on the taxonomic composition. The second step was to determine a subset of habitat attributes that are associated with those community types. After these steps are completed the process can be reversed to predict the number and type of organisms expected to occur at any given site based on the habitat attributes of the site.

5
RCA Model Versions An RCA model was first adopted for assessing watershed health under the FHMS for Yukon placer mining in 2007. In January 2008, this model was re-calibrated incorporating data collected in 2007. Further development of the model was undertaken in 2010 using new data collected in 2008 and 2009. In 2013, site data collected in 2010-2012 was incorporated into the model and additional data collected in 2007 and 2008 resulted in the expansion of the geographic range of the model. Current analyses and this report rely on a recalibrated 2013 Yukon model developed from a suite of 286 Reference Sites gathered from across the Yukon Territory by Fisheries and Oceans Canada, the Yukon Government and the University of Western Ontario from 2006 to 2012 (https://www.researchgate.net/publication/281067514_Revision_of_the_Yukon_CABIN_Invertebrate_Bioassessment_Model_using_2004-12_Reference_Site_Data). The 286 Reference Sites are separated into five Reference Groups based on their benthic invertebrate communities. Table 1 shows the 14 habitat variables that statistically best define each Group. Table 1. Habitat variables used in determining Reference Groups as well as placing Test Sites into Reference Groups. Standard deviations are given for each metric.
Model Group 1 2 3 4 5
Average SD Average SD Average SD Average SD Average SD Altitude (ft) 1973.87 1104.18 2134.49 899.68 2756.11 719.61 2296.81 838.01 2727.00 914.30 Depth Avg (cm) 36.46 24.31 31.44 19.67 32.11 15.81 29.80 14.62 24.00 13.45 Longitude -138.27 2.10 -136.93 2.75 -135.66 3.18 -137.45 2.65 -137.47 2.24 Broadleaf Open (%) 0.20 0.41 0.14 0.34 0.68 1.62 0.38 1.31 0.11 0.31 Bryoids (%) 0.17 0.42 0.31 0.61 0.37 0.84 0.54 1.04 1.01 2.53 Mixed Wood Open (%) 2.46 5.01 0.75 1.44 0.96 1.72 0.77 2.87 0.14 0.32 Wetland herbaceous (%) 0.22 0.64 0.11 0.31 0.03 0.10 0.14 0.46 0.03 0.08 Precip. February (mm) 27.74 9.11 28.51 7.47 36.14 23.93 29.34 11.79 23.65 9.87 Precip. March (mm) 25.55 9.72 26.48 7.73 33.13 21.04 27.46 11.91 21.43 10.29 Precip. June (mm) 49.78 15.10 57.14 13.59 64.67 18.69 53.49 18.49 42.71 20.01 Precip. July (mm) 63.45 19.77 73.01 17.74 78.30 20.81 65.85 22.37 53.48 23.83 Rainfall June (mm) 45.78 13.48 49.32 11.37 52.72 13.46 48.44 16.06 39.59 18.11 April Max Temp (°C) -0.26 3.57 0.93 4.20 1.38 3.74 -0.98 3.38 -1.99 4.49 Velocity Avg (m/s) 0.42 0.29 0.43 0.26 0.58 0.29 0.52 0.32 0.69 0.41
The five main Reference Groups are discrete, and represent a gradient of increasing benthic invertebrate abundance (total number of individuals) and family richness (number of different families). The invertebrate families characteristic of each group are given in Table 2. Table. 2. Invertebrate families characteristic of Reference Groups 1 through 5. Group 1 Group 2 Group 3 Group 4 Group 5 Chironomidae Chironomidae Chironomidae Chironomidae Chironomidae Naididae Heptageniidae Heptageniidae Heptageniidae Baetidae Lumbriculidae Baetidae Baetidae Baetidae Simuliidae Nemouridae Nemouridae Nemouridae Chloroperlidae Chloroperlidae Simuliidae Simuliidae Simuliidae
6
The following is a summary of the general characteristics of each Reference Group: Group 1. Sites have very low abundance and richness, with a community dominated by Chironomids (34%) which represent over a third of the community with Lumbriculidae and Naidid as the other main characteristic families (4%). However this is a quite variable community. These sites tend to be the lowest altitude and have larger drainage basins. The channels are deeper, velocity slower and have the finest substrate. Group 2. Also has low abundance but higher taxonomic richness, this is again a community where Chironomids are dominant (39.7%) but Baetid and Heptaegiid mayflies also have high relative abundance (20%). Six families representing the Diptera, Ephemeroptera and Plecoptera characterise this community type. These are streams in the eastern Yukon but tend to be intermediate with regard to their habitat characteristics. Group 3. These sites have reasonable abundance and have the highest family richness (> 15 families per site). The dominant families are mayflies (Heptageniidae) and stoneflies (Nemouridae) which together comprise almost 50% of the community, Chironomids are less abundant (15%) but occur at all sites. The same six families as Community 2 characterise this assemblage. These are higher altitude sites in the eastern portion of the study area and with smaller drainage areas, with the highest spring precipitation and also warmer spring temperatures and the largest substrate. Group 4. This is a more abundant community with 10 times more organisms per sample than communities 1 and 2. The community also has the high taxonomic richness. Chironomids are again the most common family (44%), however the Baetidae are also common (11% relative abundance) and found at more than 80% of the sites. This is the most frequently occurring assemblage (38% of Reference Sites) and also the most variable in terms of habitat attributes. Group 5. This is a small community representing less than 5% of the Reference Sites. This community has the greatest number of organisms and is again dominated by Chironomids (56%) but also Baetid mayflies (22%) and Dimulids (black flies) are also abundant (8%). These are shallow streams with high stream velocity. They also have the coolest spring and summer temperatures and the least amount of spring precipitation. These sites are located in the northern part of the study area.
2.4 CABIN Outputs
2.4.1 Group Assignment
Site assessment is conducted by comparing a Test Site (a site known to have been exposed to placer mining) to the groups of Reference Sites (sites not exposed to placer mining or other known stressors) to determine which Group it is most similar to. The RCA model uses the habitat predictors (Table 1) of a Test Site to develop a probability of assignment to each group of Reference Sites. This Test site is compared with the Reference Group to which it has the highest probability of assignment. There are certain circumstances where a Test Site is found to have a similar probability of belonging to two Reference Groups. When this occurs further analysis is required in order to determine which Reference Group is most representative of the Test Site. This analysis is based on similarity of the predictor variables to a particular Reference Group.
7
2.4.2 Ordination
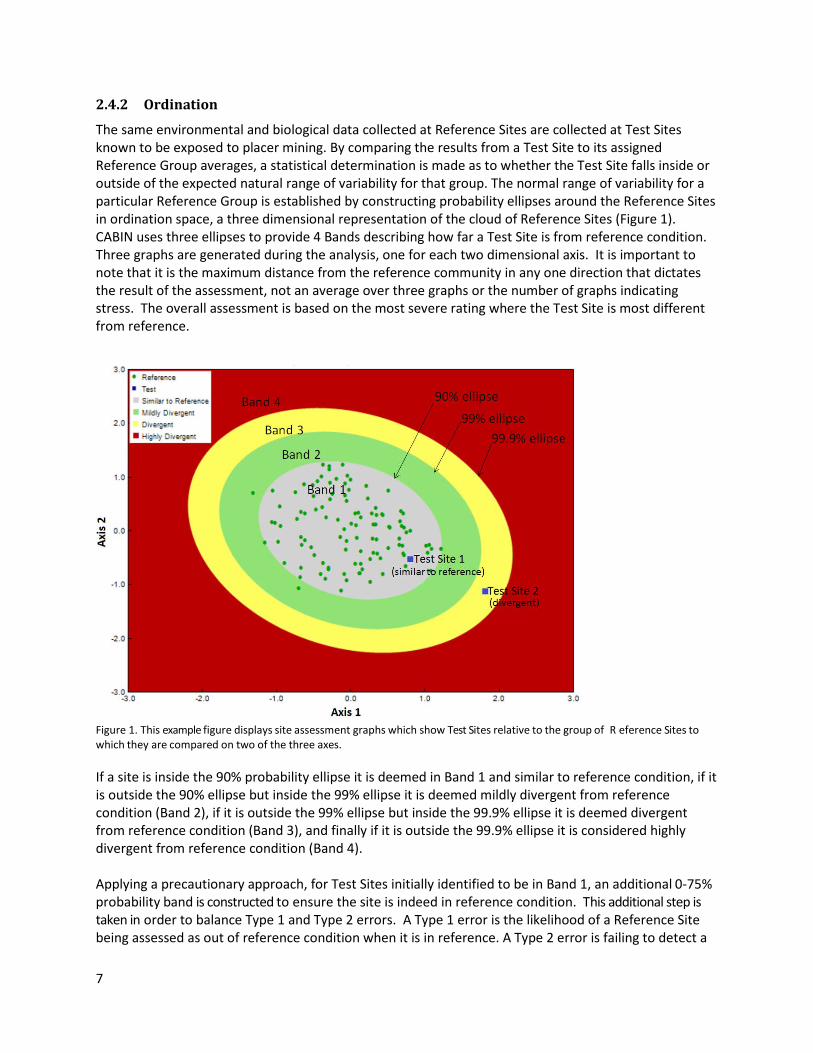
The same environmental and biological data collected at Reference Sites are collected at Test Sites known to be exposed to placer mining. By comparing the results from a Test Site to its assigned Reference Group averages, a statistical determination is made as to whether the Test Site falls inside or outside of the expected natural range of variability for that group. The normal range of variability for a particular Reference Group is established by constructing probability ellipses around the Reference Sites in ordination space, a three dimensional representation of the cloud of Reference Sites (Figure 1). CABIN uses three ellipses to provide 4 Bands describing how far a Test Site is from reference condition. Three graphs are generated during the analysis, one for each two dimensional axis. It is important to note that it is the maximum distance from the reference community in any one direction that dictates the result of the assessment, not an average over three graphs or the number of graphs indicating stress. The overall assessment is based on the most severe rating where the Test Site is most different from reference.
Figure 1. This example figure displays site assessment graphs which show Test Sites relative to the group of R eference Sites to which they are compared on two of the three axes. If a site is inside the 90% probability ellipse it is deemed in Band 1 and similar to reference condition, if it is outside the 90% ellipse but inside the 99% ellipse it is deemed mildly divergent from reference condition (Band 2), if it is outside the 99% ellipse but inside the 99.9% ellipse it is deemed divergent from reference condition (Band 3), and finally if it is outside the 99.9% ellipse it is considered highly divergent from reference condition (Band 4). Applying a precautionary approach, for Test Sites initially identified to be in Band 1, an additional 0-75% probability band is constructed to ensure the site is indeed in reference condition. This additional step is taken in order to balance Type 1 and Type 2 errors. A Type 1 error is the likelihood of a Reference Site being assessed as out of reference condition when it is in reference. A Type 2 error is failing to detect a
8
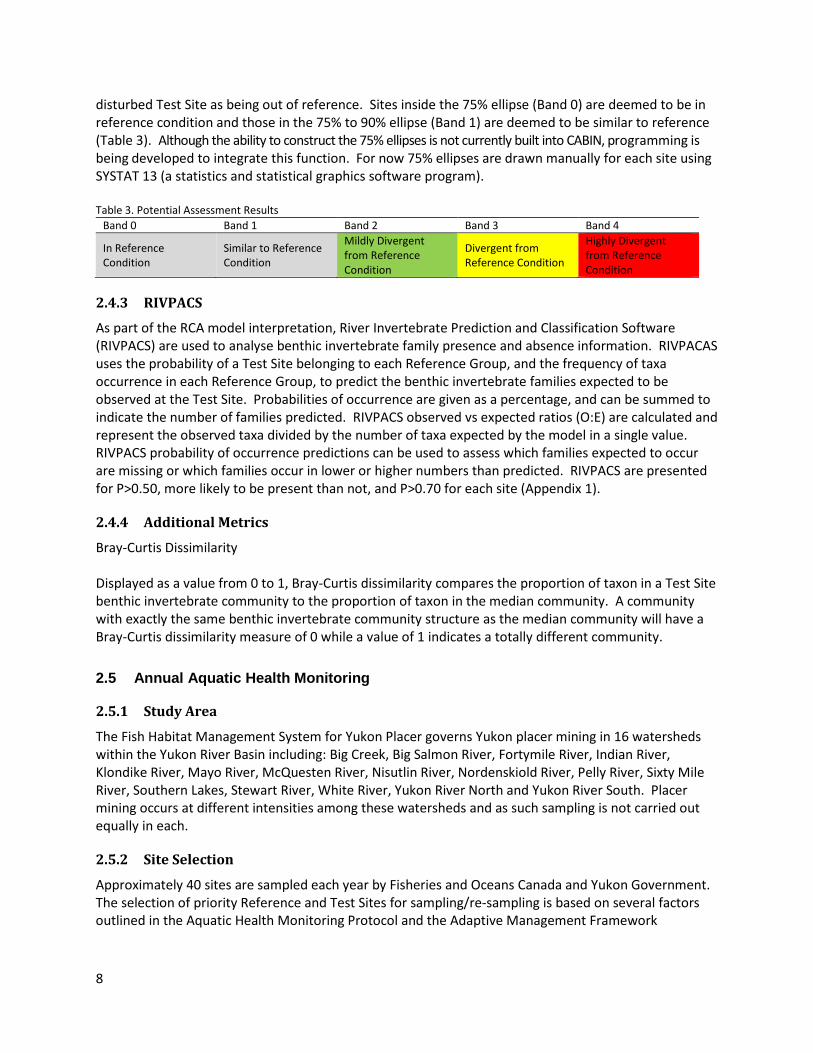
disturbed Test Site as being out of reference. Sites inside the 75% ellipse (Band 0) are deemed to be in reference condition and those in the 75% to 90% ellipse (Band 1) are deemed to be similar to reference (Table 3). Although the ability to construct the 75% ellipses is not currently built into CABIN, programming is being developed to integrate this function. For now 75% ellipses are drawn manually for each site using SYSTAT 13 (a statistics and statistical graphics software program). Table 3. Potential Assessment Results
Band 0 Band 1 Band 2 Band 3 Band 4
In Reference Condition
Similar to Reference Condition
Mildly Divergent from Reference Condition
Divergent from Reference Condition
Highly Divergent from Reference Condition
2.4.3 RIVPACS
As part of the RCA model interpretation, River Invertebrate Prediction and Classification Software (RIVPACS) are used to analyse benthic invertebrate family presence and absence information. RIVPACAS uses the probability of a Test Site belonging to each Reference Group, and the frequency of taxa occurrence in each Reference Group, to predict the benthic invertebrate families expected to be observed at the Test Site. Probabilities of occurrence are given as a percentage, and can be summed to indicate the number of families predicted. RIVPACS observed vs expected ratios (O:E) are calculated and represent the observed taxa divided by the number of taxa expected by the model in a single value. RIVPACS probability of occurrence predictions can be used to assess which families expected to occur are missing or which families occur in lower or higher numbers than predicted. RIVPACS are presented for P>0.50, more likely to be present than not, and P>0.70 for each site (Appendix 1).
2.4.4 Additional Metrics
Bray-Curtis Dissimilarity Displayed as a value from 0 to 1, Bray-Curtis dissimilarity compares the proportion of taxon in a Test Site benthic invertebrate community to the proportion of taxon in the median community. A community with exactly the same benthic invertebrate community structure as the median community will have a Bray-Curtis dissimilarity measure of 0 while a value of 1 indicates a totally different community.
2.5 Annual Aquatic Health Monitoring
2.5.1 Study Area
The Fish Habitat Management System for Yukon Placer governs Yukon placer mining in 16 watersheds within the Yukon River Basin including: Big Creek, Big Salmon River, Fortymile River, Indian River, Klondike River, Mayo River, McQuesten River, Nisutlin River, Nordenskiold River, Pelly River, Sixty Mile River, Southern Lakes, Stewart River, White River, Yukon River North and Yukon River South. Placer mining occurs at different intensities among these watersheds and as such sampling is not carried out equally in each.
2.5.2 Site Selection
Approximately 40 sites are sampled each year by Fisheries and Oceans Canada and Yukon Government. The selection of priority Reference and Test Sites for sampling/re-sampling is based on several factors outlined in the Aquatic Health Monitoring Protocol and the Adaptive Management Framework
9
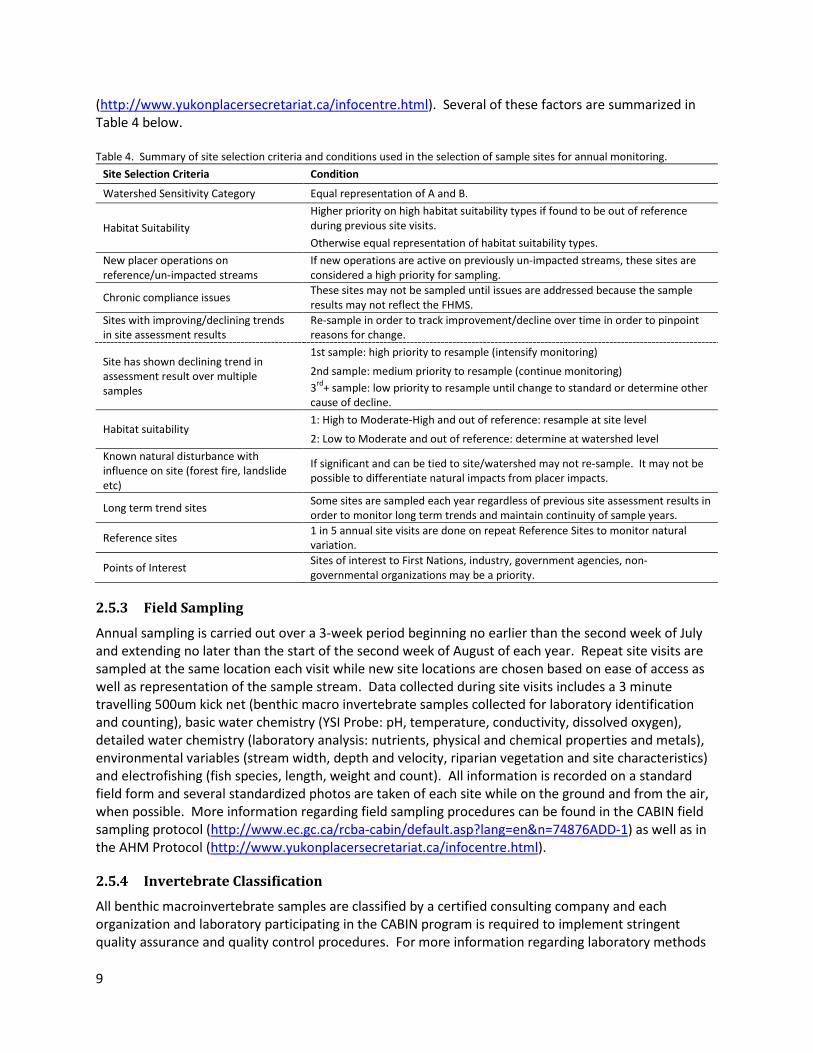
(http://www.yukonplacersecretariat.ca/infocentre.html). Several of these factors are summarized in Table 4 below. Table 4. Summary of site selection criteria and conditions used in the selection of sample sites for annual monitoring.
Site Selection Criteria Condition
Watershed Sensitivity Category Equal representation of A and B.
Habitat Suitability Higher priority on high habitat suitability types if found to be out of reference during previous site visits. Otherwise equal representation of habitat suitability types.
New placer operations on reference/un-impacted streams
If new operations are active on previously un-impacted streams, these sites are considered a high priority for sampling.
Chronic compliance issues These sites may not be sampled until issues are addressed because the sample results may not reflect the FHMS.
Sites with improving/declining trends in site assessment results
Re-sample in order to track improvement/decline over time in order to pinpoint reasons for change.
Site has shown declining trend in assessment result over multiple samples
1st sample: high priority to resample (intensify monitoring)
2nd sample: medium priority to resample (continue monitoring) 3rd+ sample: low priority to resample until change to standard or determine other cause of decline.
Habitat suitability 1: High to Moderate-High and out of reference: resample at site level
2: Low to Moderate and out of reference: determine at watershed level Known natural disturbance with influence on site (forest fire, landslide etc)
If significant and can be tied to site/watershed may not re-sample. It may not be possible to differentiate natural impacts from placer impacts.
Long term trend sites Some sites are sampled each year regardless of previous site assessment results in order to monitor long term trends and maintain continuity of sample years.
Reference sites 1 in 5 annual site visits are done on repeat Reference Sites to monitor natural variation.
Points of Interest Sites of interest to First Nations, industry, government agencies, non-governmental organizations may be a priority.
2.5.3 Field Sampling
Annual sampling is carried out over a 3-week period beginning no earlier than the second week of July and extending no later than the start of the second week of August of each year. Repeat site visits are sampled at the same location each visit while new site locations are chosen based on ease of access as well as representation of the sample stream. Data collected during site visits includes a 3 minute travelling 500um kick net (benthic macro invertebrate samples collected for laboratory identification and counting), basic water chemistry (YSI Probe: pH, temperature, conductivity, dissolved oxygen), detailed water chemistry (laboratory analysis: nutrients, physical and chemical properties and metals), environmental variables (stream width, depth and velocity, riparian vegetation and site characteristics) and electrofishing (fish species, length, weight and count). All information is recorded on a standard field form and several standardized photos are taken of each site while on the ground and from the air, when possible. More information regarding field sampling procedures can be found in the CABIN field sampling protocol (http://www.ec.gc.ca/rcba-cabin/default.asp?lang=en&n=74876ADD-1) as well as in the AHM Protocol (http://www.yukonplacersecretariat.ca/infocentre.html).
2.5.4 Invertebrate Classification
All benthic macroinvertebrate samples are classified by a certified consulting company and each organization and laboratory participating in the CABIN program is required to implement stringent quality assurance and quality control procedures. For more information regarding laboratory methods

10
see documentation on the CABIN website (http://www.ec.gc.ca/rcba-cabin/default.asp?lang=en&n=74876ADD-1).
2.5.5 Placer Mining Activity Assessment
In order to assess the influence of current and historic placer mining activity on a Test Site, these activities need to be quantified for each stream. Information related to placer mining activity provided in this report is limited to direct observations made while conducting site visits or through conversation with knowledgeable personnel. A formalized placer mining activity assessment process is currently under development; please see Next Steps in this report for more information.
11
3 Results – 2016 Aquatic Health Monitoring
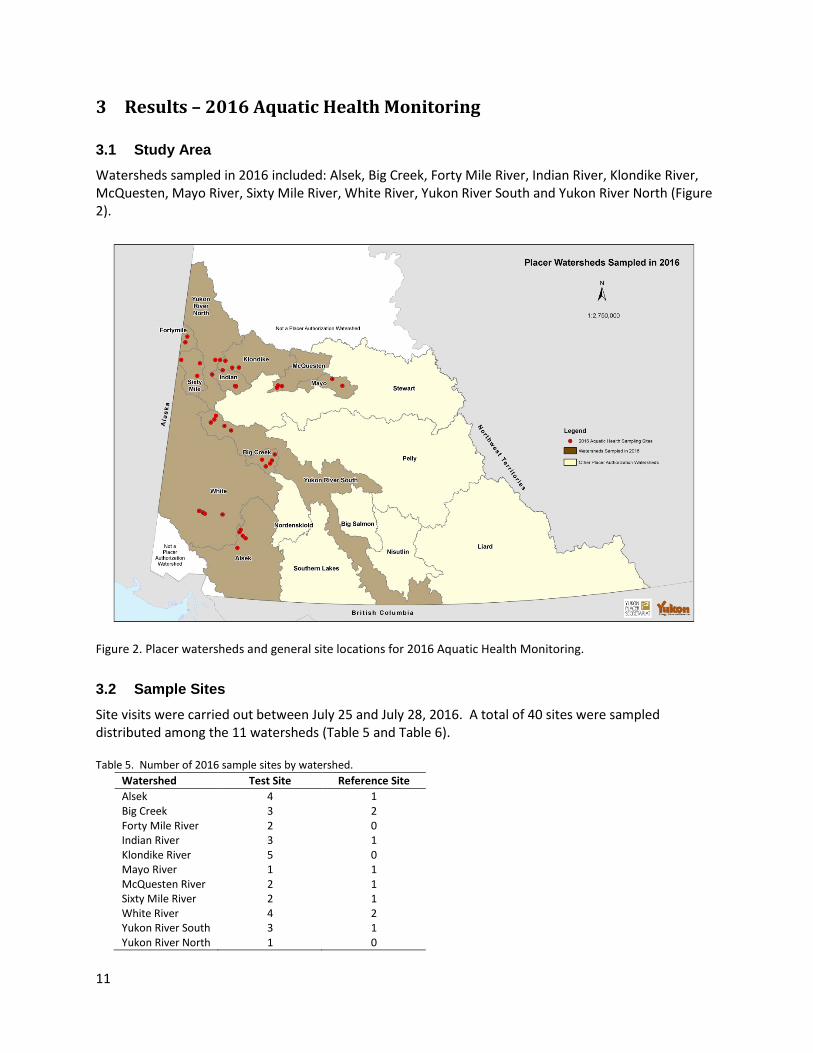
3.1 Study Area Watersheds sampled in 2016 included: Alsek, Big Creek, Forty Mile River, Indian River, Klondike River, McQuesten, Mayo River, Sixty Mile River, White River, Yukon River South and Yukon River North (Figure 2).
Figure 2. Placer watersheds and general site locations for 2016 Aquatic Health Monitoring.
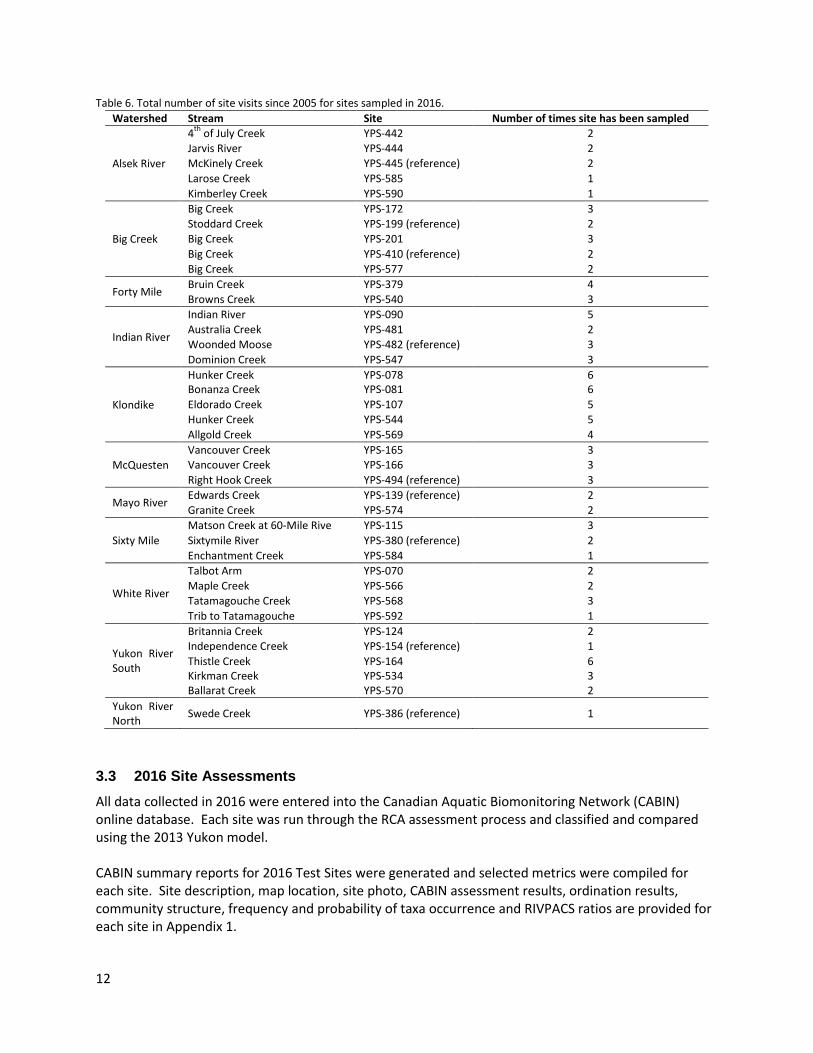
3.2 Sample Sites Site visits were carried out between July 25 and July 28, 2016. A total of 40 sites were sampled distributed among the 11 watersheds (Table 5 and Table 6). Table 5. Number of 2016 sample sites by watershed.
Watershed Test Site Reference Site Alsek 4 1 Big Creek 3 2 Forty Mile River 2 0 Indian River 3 1 Klondike River 5 0 Mayo River 1 1 McQuesten River 2 1 Sixty Mile River 2 1 White River 4 2 Yukon River South 3 1 Yukon River North 1 0
12
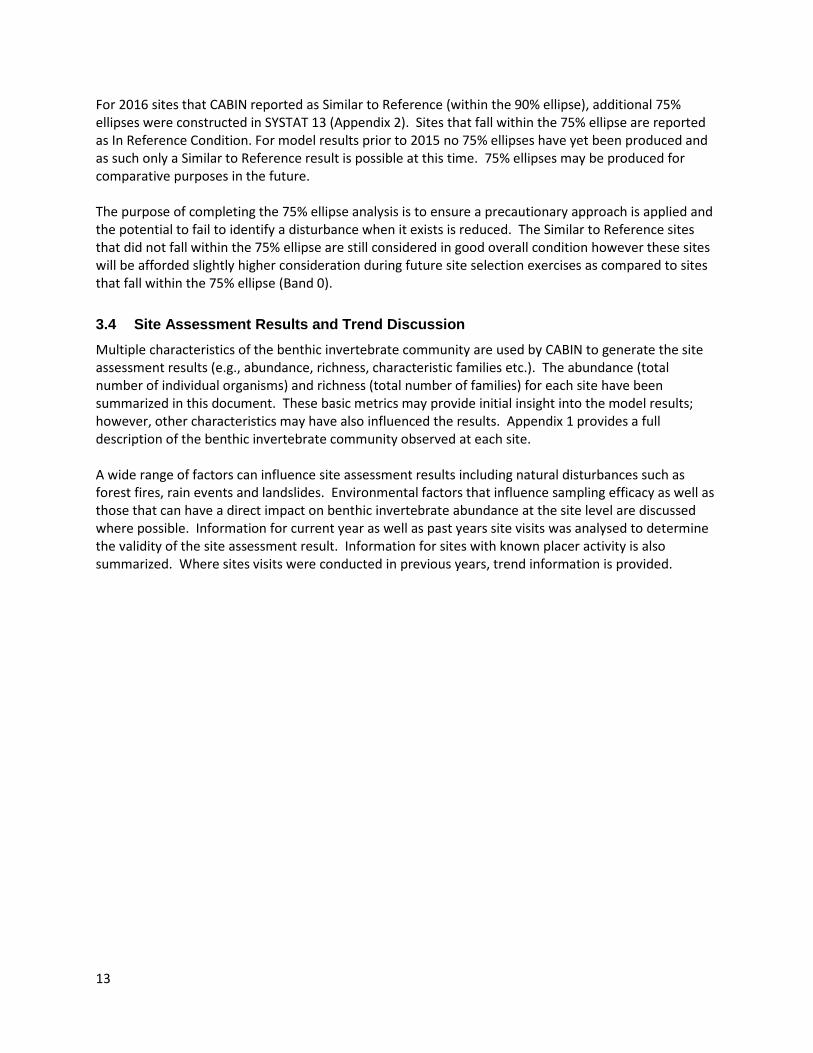
Table 6. Total number of site visits since 2005 for sites sampled in 2016. Watershed Stream Site Number of times site has been sampled
Alsek River
4th of July Creek YPS-442 2 Jarvis River YPS-444 2 McKinely Creek YPS-445 (reference) 2 Larose Creek YPS-585 1 Kimberley Creek YPS-590 1
Big Creek
Big Creek YPS-172 3 Stoddard Creek YPS-199 (reference) 2 Big Creek YPS-201 3 Big Creek YPS-410 (reference) 2 Big Creek YPS-577 2
Forty Mile Bruin Creek YPS-379 4 Browns Creek YPS-540 3
Indian River
Indian River YPS-090 5 Australia Creek YPS-481 2 Woonded Moose YPS-482 (reference) 3 Dominion Creek YPS-547 3
Klondike
Hunker Creek YPS-078 6 Bonanza Creek YPS-081 6 Eldorado Creek YPS-107 5 Hunker Creek YPS-544 5 Allgold Creek YPS-569 4
McQuesten Vancouver Creek YPS-165 3 Vancouver Creek YPS-166 3 Right Hook Creek YPS-494 (reference) 3
Mayo River Edwards Creek YPS-139 (reference) 2 Granite Creek YPS-574 2
Sixty Mile Matson Creek at 60-Mile Rive YPS-115 3 Sixtymile River YPS-380 (reference) 2 Enchantment Creek YPS-584 1
White River
Talbot Arm YPS-070 2 Maple Creek YPS-566 2 Tatamagouche Creek YPS-568 3 Trib to Tatamagouche YPS-592 1
Yukon River South
Britannia Creek YPS-124 2 Independence Creek YPS-154 (reference) 1 Thistle Creek YPS-164 6 Kirkman Creek YPS-534 3 Ballarat Creek YPS-570 2
Yukon River North Swede Creek YPS-386 (reference) 1
3.3 2016 Site Assessments All data collected in 2016 were entered into the Canadian Aquatic Biomonitoring Network (CABIN) online database. Each site was run through the RCA assessment process and classified and compared using the 2013 Yukon model. CABIN summary reports for 2016 Test Sites were generated and selected metrics were compiled for each site. Site description, map location, site photo, CABIN assessment results, ordination results, community structure, frequency and probability of taxa occurrence and RIVPACS ratios are provided for each site in Appendix 1.
13
For 2016 sites that CABIN reported as Similar to Reference (within the 90% ellipse), additional 75% ellipses were constructed in SYSTAT 13 (Appendix 2). Sites that fall within the 75% ellipse are reported as In Reference Condition. For model results prior to 2015 no 75% ellipses have yet been produced and as such only a Similar to Reference result is possible at this time. 75% ellipses may be produced for comparative purposes in the future. The purpose of completing the 75% ellipse analysis is to ensure a precautionary approach is applied and the potential to fail to identify a disturbance when it exists is reduced. The Similar to Reference sites that did not fall within the 75% ellipse are still considered in good overall condition however these sites will be afforded slightly higher consideration during future site selection exercises as compared to sites that fall within the 75% ellipse (Band 0).
3.4 Site Assessment Results and Trend Discussion Multiple characteristics of the benthic invertebrate community are used by CABIN to generate the site assessment results (e.g., abundance, richness, characteristic families etc.). The abundance (total number of individual organisms) and richness (total number of families) for each site have been summarized in this document. These basic metrics may provide initial insight into the model results; however, other characteristics may have also influenced the results. Appendix 1 provides a full description of the benthic invertebrate community observed at each site. A wide range of factors can influence site assessment results including natural disturbances such as forest fires, rain events and landslides. Environmental factors that influence sampling efficacy as well as those that can have a direct impact on benthic invertebrate abundance at the site level are discussed where possible. Information for current year as well as past years site visits was analysed to determine the validity of the site assessment result. Information for sites with known placer activity is also summarized. Where sites visits were conducted in previous years, trend information is provided.
14
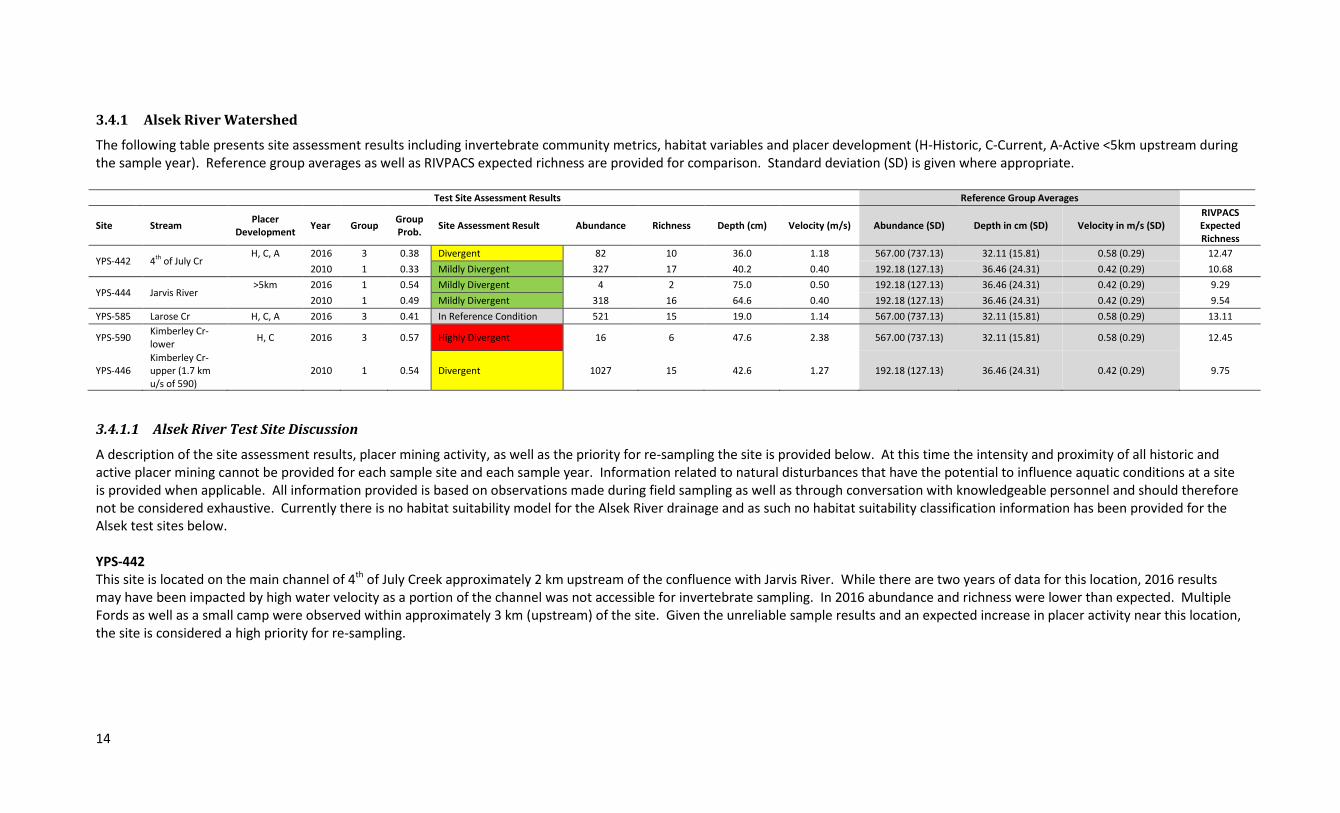
3.4.1 Alsek River Watershed
The following table presents site assessment results including invertebrate community metrics, habitat variables and placer development (H-Historic, C-Current, A-Active <5km upstream during the sample year). Reference group averages as well as RIVPACS expected richness are provided for comparison. Standard deviation (SD) is given where appropriate.
Test Site Assessment Results Reference Group Averages
Site Stream Placer Development Year Group Group
Prob. Site Assessment Result Abundance Richness Depth (cm) Velocity (m/s) Abundance (SD) Depth in cm (SD) Velocity in m/s (SD) RIVPACS Expected Richness
YPS-442 4th of July Cr H, C, A 2016 3 0.38 Divergent 82 10 36.0 1.18 567.00 (737.13) 32.11 (15.81) 0.58 (0.29) 12.47
2010 1 0.33 Mildly Divergent 327 17 40.2 0.40 192.18 (127.13) 36.46 (24.31) 0.42 (0.29) 10.68
YPS-444 Jarvis River >5km 2016 1 0.54 Mildly Divergent 4 2 75.0 0.50 192.18 (127.13) 36.46 (24.31) 0.42 (0.29) 9.29
2010 1 0.49 Mildly Divergent 318 16 64.6 0.40 192.18 (127.13) 36.46 (24.31) 0.42 (0.29) 9.54 YPS-585 Larose Cr H, C, A 2016 3 0.41 In Reference Condition 521 15 19.0 1.14 567.00 (737.13) 32.11 (15.81) 0.58 (0.29) 13.11
YPS-590 Kimberley Cr-lower H, C 2016 3 0.57 Highly Divergent 16 6 47.6 2.38 567.00 (737.13) 32.11 (15.81) 0.58 (0.29) 12.45
YPS-446 Kimberley Cr-upper (1.7 km u/s of 590)
2010 1 0.54 Divergent 1027 15 42.6 1.27 192.18 (127.13) 36.46 (24.31) 0.42 (0.29) 9.75
3.4.1.1 Alsek River Test Site Discussion
A description of the site assessment results, placer mining activity, as well as the priority for re-sampling the site is provided below. At this time the intensity and proximity of all historic and active placer mining cannot be provided for each sample site and each sample year. Information related to natural disturbances that have the potential to influence aquatic conditions at a site is provided when applicable. All information provided is based on observations made during field sampling as well as through conversation with knowledgeable personnel and should therefore not be considered exhaustive. Currently there is no habitat suitability model for the Alsek River drainage and as such no habitat suitability classification information has been provided for the Alsek test sites below. YPS-442 This site is located on the main channel of 4th of July Creek approximately 2 km upstream of the confluence with Jarvis River. While there are two years of data for this location, 2016 results may have been impacted by high water velocity as a portion of the channel was not accessible for invertebrate sampling. In 2016 abundance and richness were lower than expected. Multiple Fords as well as a small camp were observed within approximately 3 km (upstream) of the site. Given the unreliable sample results and an expected increase in placer activity near this location, the site is considered a high priority for re-sampling.
15
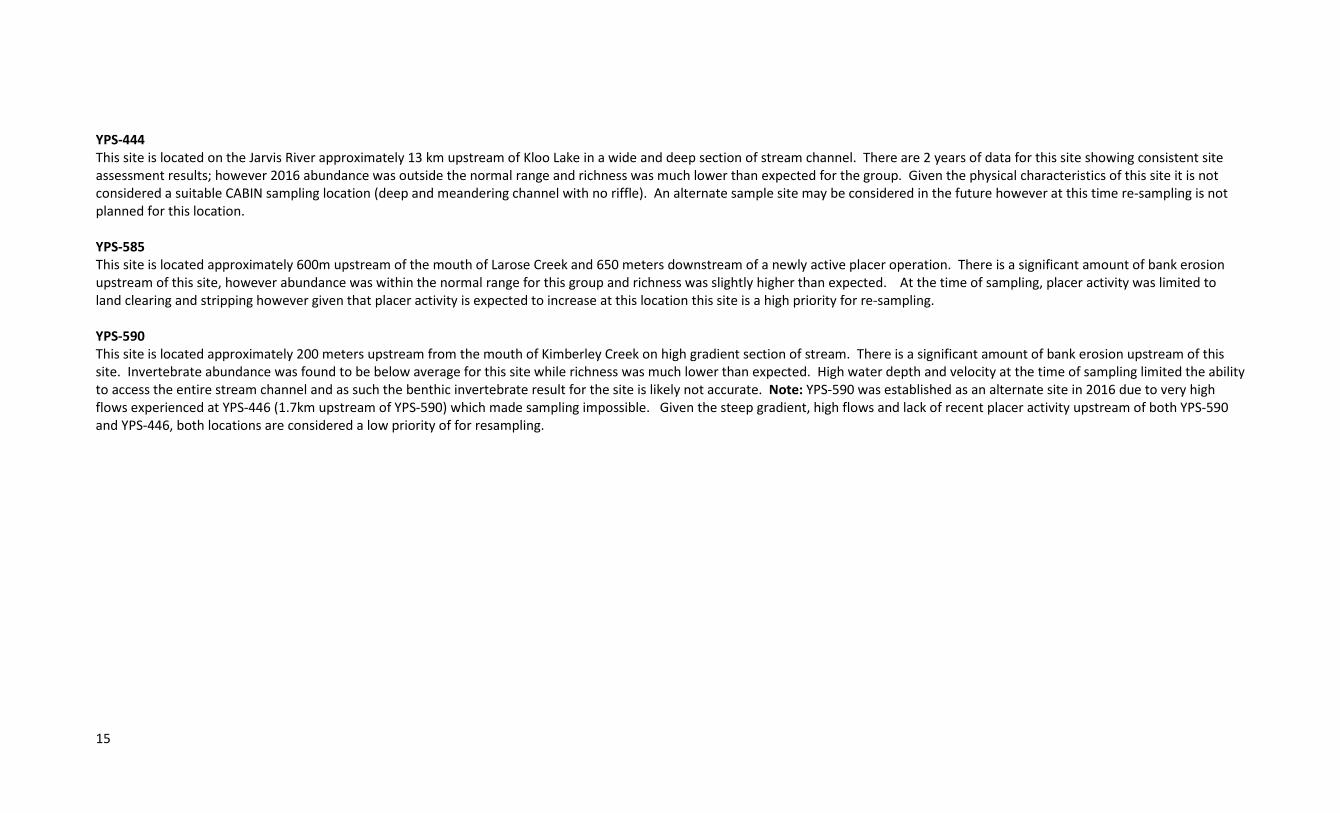
YPS-444 This site is located on the Jarvis River approximately 13 km upstream of Kloo Lake in a wide and deep section of stream channel. There are 2 years of data for this site showing consistent site assessment results; however 2016 abundance was outside the normal range and richness was much lower than expected for the group. Given the physical characteristics of this site it is not considered a suitable CABIN sampling location (deep and meandering channel with no riffle). An alternate sample site may be considered in the future however at this time re-sampling is not planned for this location. YPS-585 This site is located approximately 600m upstream of the mouth of Larose Creek and 650 meters downstream of a newly active placer operation. There is a significant amount of bank erosion upstream of this site, however abundance was within the normal range for this group and richness was slightly higher than expected. At the time of sampling, placer activity was limited to land clearing and stripping however given that placer activity is expected to increase at this location this site is a high priority for re-sampling. YPS-590 This site is located approximately 200 meters upstream from the mouth of Kimberley Creek on high gradient section of stream. There is a significant amount of bank erosion upstream of this site. Invertebrate abundance was found to be below average for this site while richness was much lower than expected. High water depth and velocity at the time of sampling limited the ability to access the entire stream channel and as such the benthic invertebrate result for the site is likely not accurate. Note: YPS-590 was established as an alternate site in 2016 due to very high flows experienced at YPS-446 (1.7km upstream of YPS-590) which made sampling impossible. Given the steep gradient, high flows and lack of recent placer activity upstream of both YPS-590 and YPS-446, both locations are considered a low priority of for resampling.
16
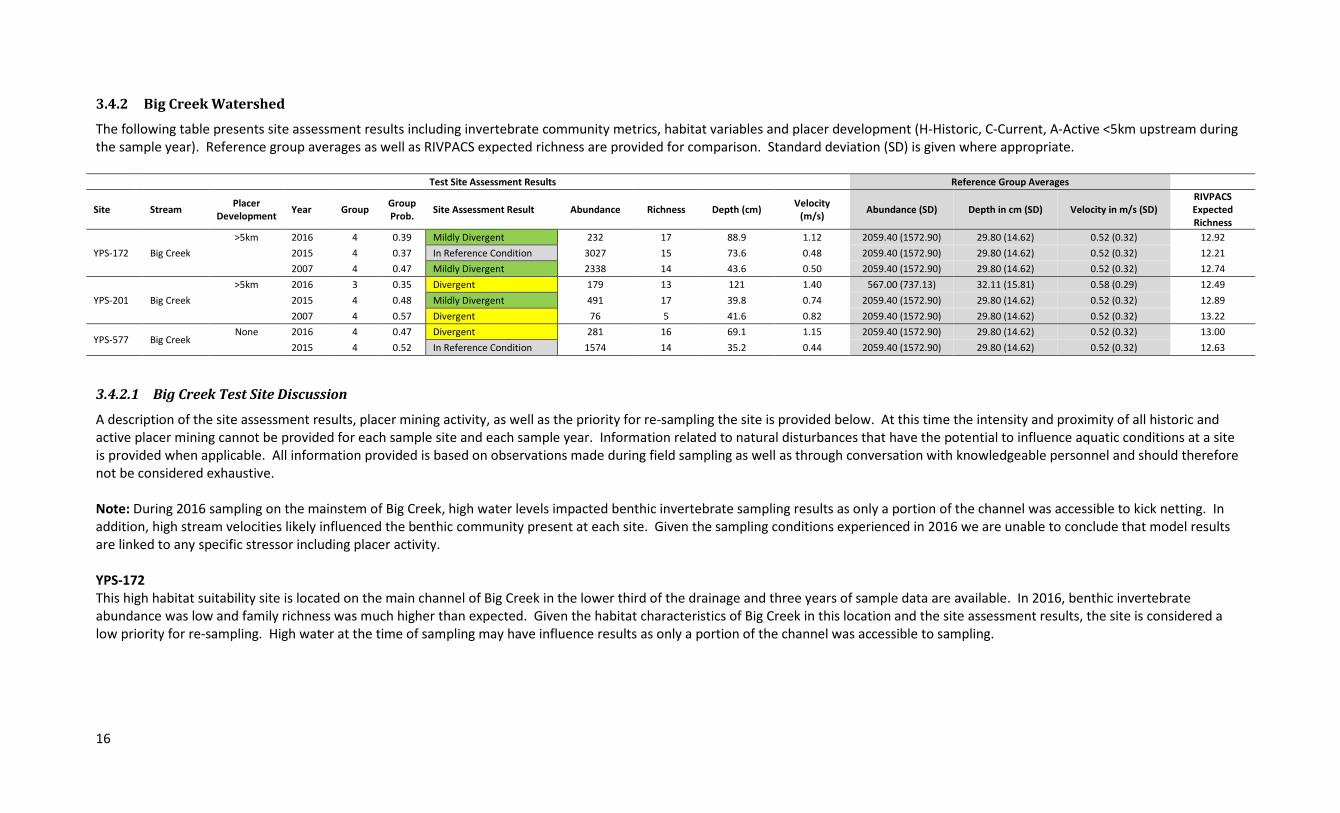
3.4.2 Big Creek Watershed
The following table presents site assessment results including invertebrate community metrics, habitat variables and placer development (H-Historic, C-Current, A-Active <5km upstream during the sample year). Reference group averages as well as RIVPACS expected richness are provided for comparison. Standard deviation (SD) is given where appropriate.
Test Site Assessment Results Reference Group Averages
Site Stream Placer Development Year Group Group
Prob. Site Assessment Result Abundance Richness Depth (cm) Velocity (m/s) Abundance (SD) Depth in cm (SD) Velocity in m/s (SD)
RIVPACS Expected Richness
YPS-172 Big Creek >5km 2016 4 0.39 Mildly Divergent 232 17 88.9 1.12 2059.40 (1572.90) 29.80 (14.62) 0.52 (0.32) 12.92
2015 4 0.37 In Reference Condition 3027 15 73.6 0.48 2059.40 (1572.90) 29.80 (14.62) 0.52 (0.32) 12.21 2007 4 0.47 Mildly Divergent 2338 14 43.6 0.50 2059.40 (1572.90) 29.80 (14.62) 0.52 (0.32) 12.74
YPS-201 Big Creek >5km 2016 3 0.35 Divergent 179 13 121 1.40 567.00 (737.13) 32.11 (15.81) 0.58 (0.29) 12.49
2015 4 0.48 Mildly Divergent 491 17 39.8 0.74 2059.40 (1572.90) 29.80 (14.62) 0.52 (0.32) 12.89 2007 4 0.57 Divergent 76 5 41.6 0.82 2059.40 (1572.90) 29.80 (14.62) 0.52 (0.32) 13.22
YPS-577 Big Creek None 2016 4 0.47 Divergent 281 16 69.1 1.15 2059.40 (1572.90) 29.80 (14.62) 0.52 (0.32) 13.00
2015 4 0.52 In Reference Condition 1574 14 35.2 0.44 2059.40 (1572.90) 29.80 (14.62) 0.52 (0.32) 12.63
3.4.2.1 Big Creek Test Site Discussion
A description of the site assessment results, placer mining activity, as well as the priority for re-sampling the site is provided below. At this time the intensity and proximity of all historic and active placer mining cannot be provided for each sample site and each sample year. Information related to natural disturbances that have the potential to influence aquatic conditions at a site is provided when applicable. All information provided is based on observations made during field sampling as well as through conversation with knowledgeable personnel and should therefore not be considered exhaustive. Note: During 2016 sampling on the mainstem of Big Creek, high water levels impacted benthic invertebrate sampling results as only a portion of the channel was accessible to kick netting. In addition, high stream velocities likely influenced the benthic community present at each site. Given the sampling conditions experienced in 2016 we are unable to conclude that model results are linked to any specific stressor including placer activity. YPS-172 This high habitat suitability site is located on the main channel of Big Creek in the lower third of the drainage and three years of sample data are available. In 2016, benthic invertebrate abundance was low and family richness was much higher than expected. Given the habitat characteristics of Big Creek in this location and the site assessment results, the site is considered a low priority for re-sampling. High water at the time of sampling may have influence results as only a portion of the channel was accessible to sampling.

17
YPS-201 This high habitat suitability site is located on the main channel of Big Creek in the lower part of the drainage and has three years of sample data. In 2016, benthic invertebrate abundance was below average and family richness was as expected. High water velocity recorded for this site resulted in a change to the reference group which may be responsible for the impaired site assessment result. Given the habitat suitability of Big Creek at this location as well as the site assessment results and the proximity to known placer mining activity upstream, the site is considered a high priority for re-sampling. YPS-577 This moderate-low habitat suitability site is located on the main channel of Big Creek in the upper third of the drainage and is above all known placer activity in this watershed. In 2016, benthic invertebrate abundance was below the normal range and family richness was higher than expected. This site was established to verify the site assessment results that were being observed at YPS-201 which is downstream from this site and also downstream from placer mining activity. This is the second year sampling this site and the 2016 result is not as expected given there is no placer mining upstream that could have impacted the site. Given the high water velocity which may have impacted invertebrate sampling ability this site is considered a high priority for re-sample.
18
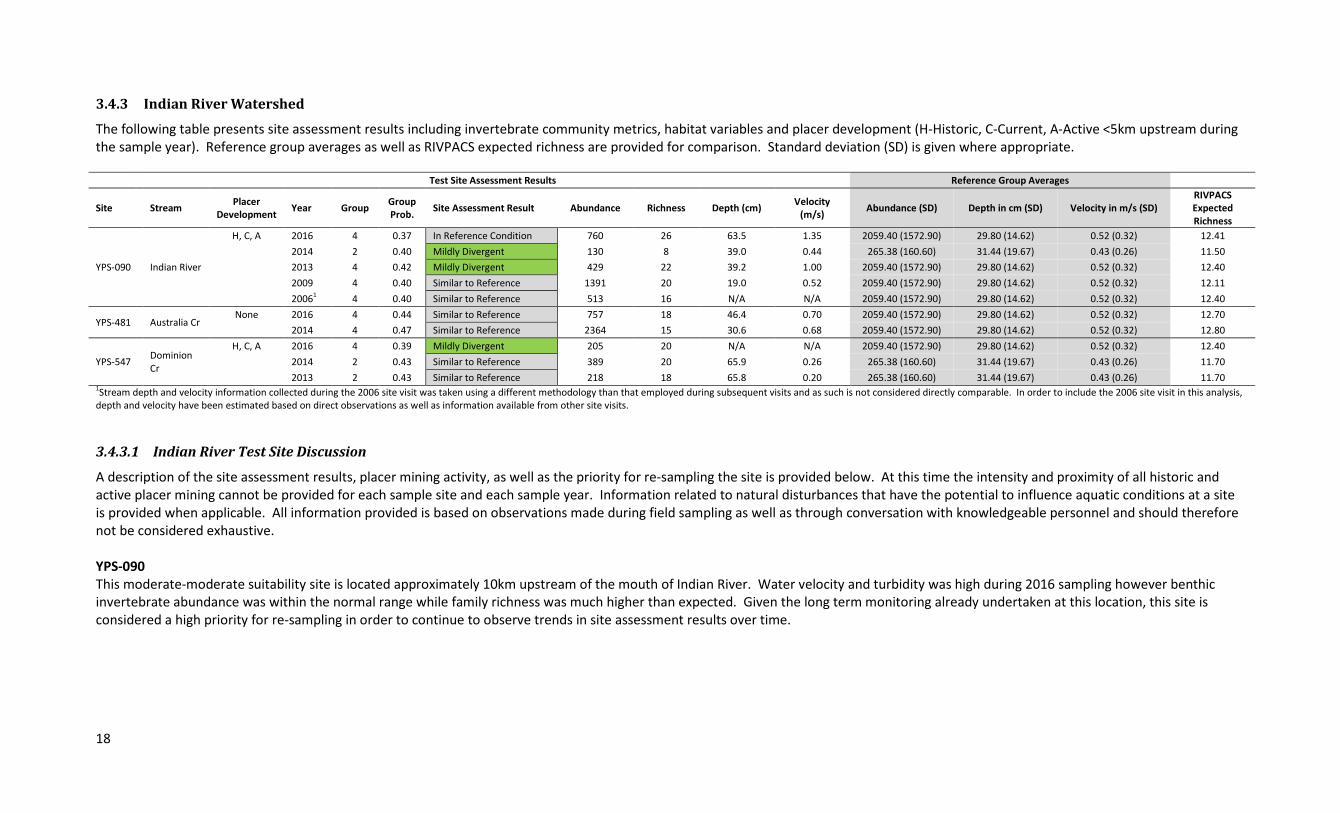
3.4.3 Indian River Watershed
The following table presents site assessment results including invertebrate community metrics, habitat variables and placer development (H-Historic, C-Current, A-Active <5km upstream during the sample year). Reference group averages as well as RIVPACS expected richness are provided for comparison. Standard deviation (SD) is given where appropriate.
Test Site Assessment Results Reference Group Averages
Site Stream Placer Development Year Group Group
Prob. Site Assessment Result Abundance Richness Depth (cm) Velocity (m/s) Abundance (SD) Depth in cm (SD) Velocity in m/s (SD)
RIVPACS Expected Richness
YPS-090 Indian River
H, C, A 2016 4 0.37 In Reference Condition 760 26 63.5 1.35 2059.40 (1572.90) 29.80 (14.62) 0.52 (0.32) 12.41 2014 2 0.40 Mildly Divergent 130 8 39.0 0.44 265.38 (160.60) 31.44 (19.67) 0.43 (0.26) 11.50 2013 4 0.42 Mildly Divergent 429 22 39.2 1.00 2059.40 (1572.90) 29.80 (14.62) 0.52 (0.32) 12.40 2009 4 0.40 Similar to Reference 1391 20 19.0 0.52 2059.40 (1572.90) 29.80 (14.62) 0.52 (0.32) 12.11 20061 4 0.40 Similar to Reference 513 16 N/A N/A 2059.40 (1572.90) 29.80 (14.62) 0.52 (0.32) 12.40
YPS-481 Australia Cr None 2016 4 0.44 Similar to Reference 757 18 46.4 0.70 2059.40 (1572.90) 29.80 (14.62) 0.52 (0.32) 12.70
2014 4 0.47 Similar to Reference 2364 15 30.6 0.68 2059.40 (1572.90) 29.80 (14.62) 0.52 (0.32) 12.80
YPS-547 Dominion Cr
H, C, A 2016 4 0.39 Mildly Divergent 205 20 N/A N/A 2059.40 (1572.90) 29.80 (14.62) 0.52 (0.32) 12.40 2014 2 0.43 Similar to Reference 389 20 65.9 0.26 265.38 (160.60) 31.44 (19.67) 0.43 (0.26) 11.70 2013 2 0.43 Similar to Reference 218 18 65.8 0.20 265.38 (160.60) 31.44 (19.67) 0.43 (0.26) 11.70
1Stream depth and velocity information collected during the 2006 site visit was taken using a different methodology than that employed during subsequent visits and as such is not considered directly comparable. In order to include the 2006 site visit in this analysis, depth and velocity have been estimated based on direct observations as well as information available from other site visits.
3.4.3.1 Indian River Test Site Discussion
A description of the site assessment results, placer mining activity, as well as the priority for re-sampling the site is provided below. At this time the intensity and proximity of all historic and active placer mining cannot be provided for each sample site and each sample year. Information related to natural disturbances that have the potential to influence aquatic conditions at a site is provided when applicable. All information provided is based on observations made during field sampling as well as through conversation with knowledgeable personnel and should therefore not be considered exhaustive. YPS-090 This moderate-moderate suitability site is located approximately 10km upstream of the mouth of Indian River. Water velocity and turbidity was high during 2016 sampling however benthic invertebrate abundance was within the normal range while family richness was much higher than expected. Given the long term monitoring already undertaken at this location, this site is considered a high priority for re-sampling in order to continue to observe trends in site assessment results over time.

19
YPS-481 This low habitat suitability site is located within the lower third of the Australia Creek drainage. This is the second year of sampling for this site and in 2016 benthic invertebrate abundance was found to be within the normal range while abundance was much higher than expected. Given the sample results for this site, it is considered a low priority for resampling in 2017; however due to proposed development upstream of the site this location may be a higher priority in the future. YPS-547 This low habitat suitability site is located in the lower part Dominion Creek. Three years of sampling indicates consistent benthic invertebrate abundance and much higher than expected richness. Unfortunately due to high water levels in 2016 accurate depth and velocity measurements could not be taken during sampling, therefore depth and velocity used to calculate the site assessment were estimated based on observations and therefore should be considered approximate. However given that this was a higher water year the site assessment result is considered appropriate and given the three years of relatively consistent sample results for this site it is considered a low priority for re-sampling.
20
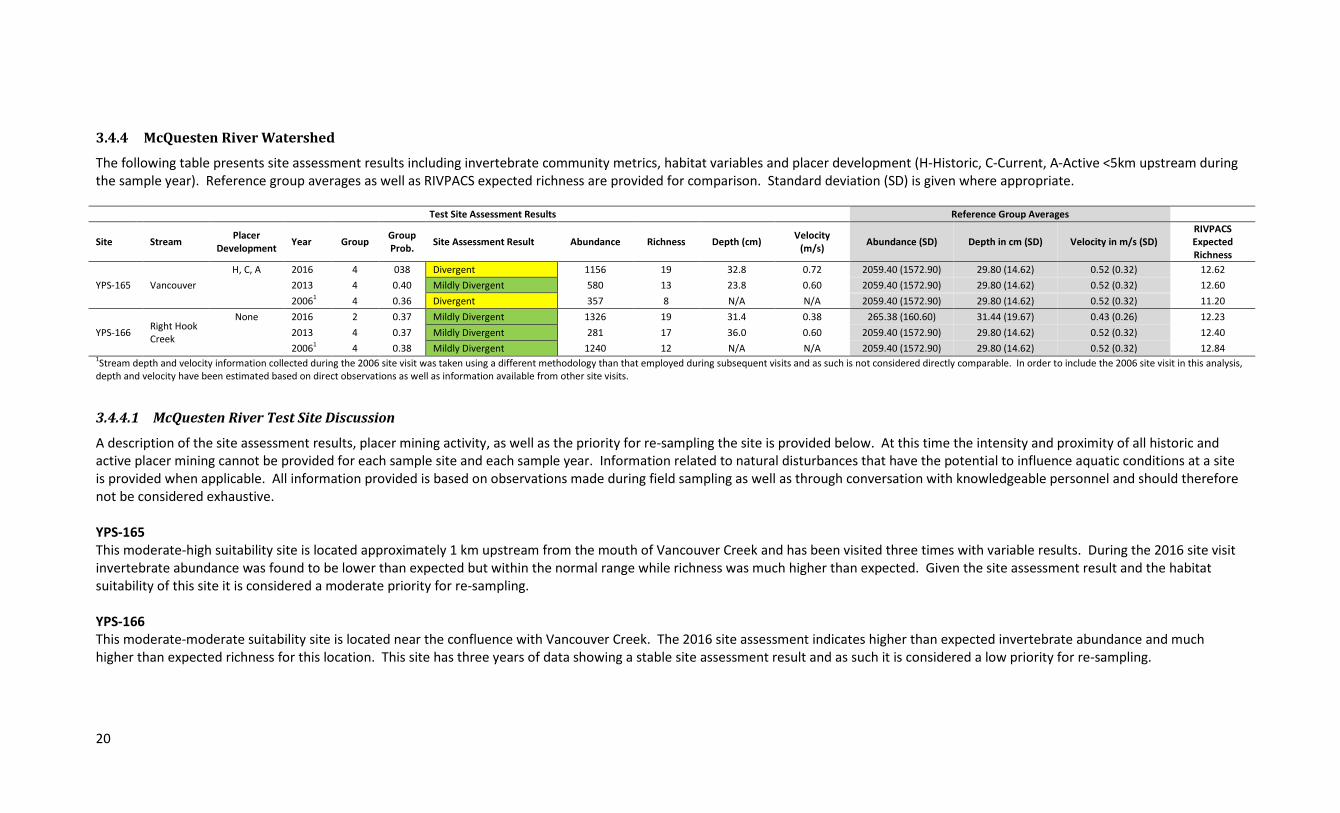
3.4.4 McQuesten River Watershed
The following table presents site assessment results including invertebrate community metrics, habitat variables and placer development (H-Historic, C-Current, A-Active <5km upstream during the sample year). Reference group averages as well as RIVPACS expected richness are provided for comparison. Standard deviation (SD) is given where appropriate.
Test Site Assessment Results Reference Group Averages
Site Stream Placer Development Year Group Group
Prob. Site Assessment Result Abundance Richness Depth (cm) Velocity (m/s) Abundance (SD) Depth in cm (SD) Velocity in m/s (SD)
RIVPACS Expected Richness
YPS-165 Vancouver H, C, A 2016 4 038 Divergent 1156 19 32.8 0.72 2059.40 (1572.90) 29.80 (14.62) 0.52 (0.32) 12.62
2013 4 0.40 Mildly Divergent 580 13 23.8 0.60 2059.40 (1572.90) 29.80 (14.62) 0.52 (0.32) 12.60 20061 4 0.36 Divergent 357 8 N/A N/A 2059.40 (1572.90) 29.80 (14.62) 0.52 (0.32) 11.20
YPS-166 Right Hook Creek
None 2016 2 0.37 Mildly Divergent 1326 19 31.4 0.38 265.38 (160.60) 31.44 (19.67) 0.43 (0.26) 12.23 2013 4 0.37 Mildly Divergent 281 17 36.0 0.60 2059.40 (1572.90) 29.80 (14.62) 0.52 (0.32) 12.40 20061 4 0.38 Mildly Divergent 1240 12 N/A N/A 2059.40 (1572.90) 29.80 (14.62) 0.52 (0.32) 12.84
1Stream depth and velocity information collected during the 2006 site visit was taken using a different methodology than that employed during subsequent visits and as such is not considered directly comparable. In order to include the 2006 site visit in this analysis, depth and velocity have been estimated based on direct observations as well as information available from other site visits.
3.4.4.1 McQuesten River Test Site Discussion
A description of the site assessment results, placer mining activity, as well as the priority for re-sampling the site is provided below. At this time the intensity and proximity of all historic and active placer mining cannot be provided for each sample site and each sample year. Information related to natural disturbances that have the potential to influence aquatic conditions at a site is provided when applicable. All information provided is based on observations made during field sampling as well as through conversation with knowledgeable personnel and should therefore not be considered exhaustive. YPS-165 This moderate-high suitability site is located approximately 1 km upstream from the mouth of Vancouver Creek and has been visited three times with variable results. During the 2016 site visit invertebrate abundance was found to be lower than expected but within the normal range while richness was much higher than expected. Given the site assessment result and the habitat suitability of this site it is considered a moderate priority for re-sampling. YPS-166 This moderate-moderate suitability site is located near the confluence with Vancouver Creek. The 2016 site assessment indicates higher than expected invertebrate abundance and much higher than expected richness for this location. This site has three years of data showing a stable site assessment result and as such it is considered a low priority for re-sampling.
21
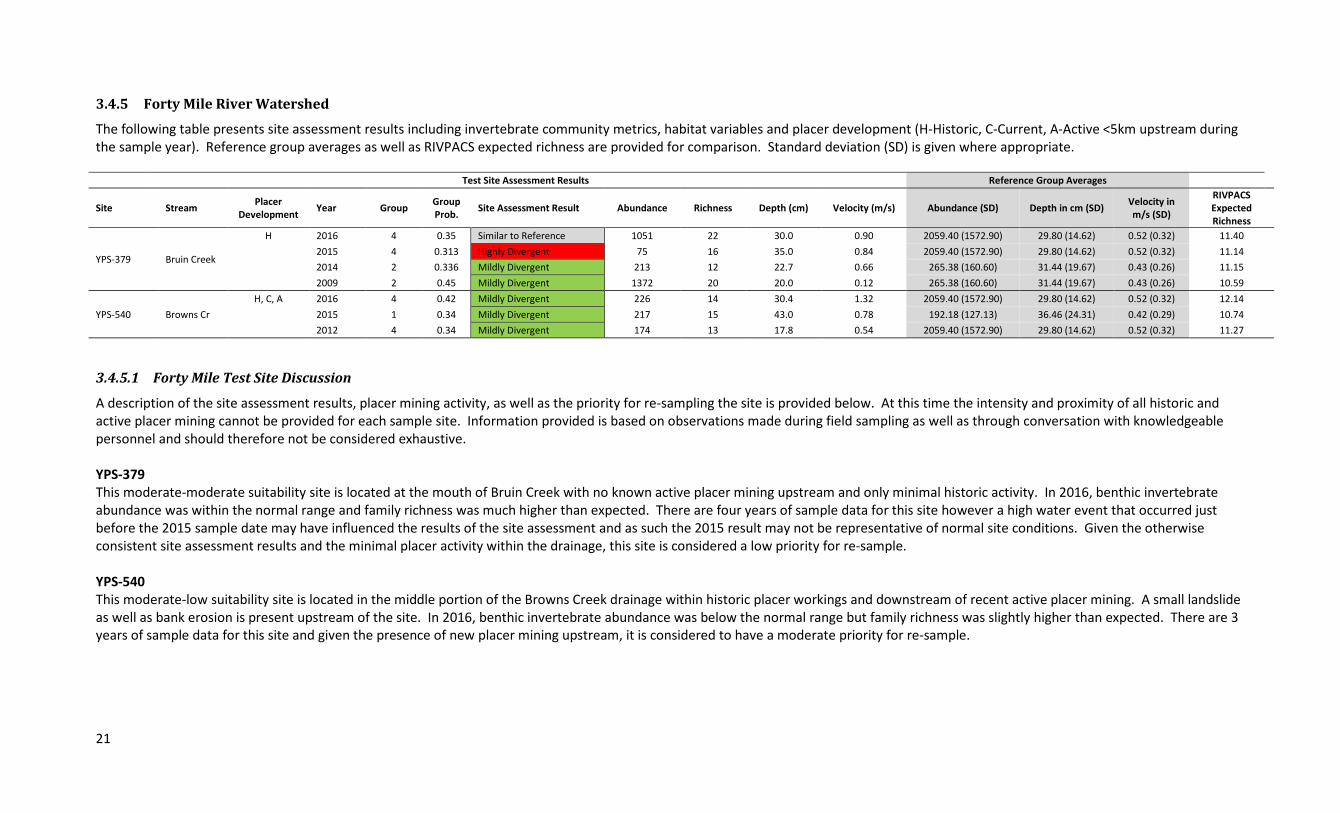
3.4.5 Forty Mile River Watershed
The following table presents site assessment results including invertebrate community metrics, habitat variables and placer development (H-Historic, C-Current, A-Active <5km upstream during the sample year). Reference group averages as well as RIVPACS expected richness are provided for comparison. Standard deviation (SD) is given where appropriate.
Test Site Assessment Results Reference Group Averages
Site Stream Placer Development Year Group Group
Prob. Site Assessment Result Abundance Richness Depth (cm) Velocity (m/s) Abundance (SD) Depth in cm (SD) Velocity in m/s (SD)
RIVPACS Expected Richness
YPS-379 Bruin Creek
H 2016 4 0.35 Similar to Reference 1051 22 30.0 0.90 2059.40 (1572.90) 29.80 (14.62) 0.52 (0.32) 11.40 2015 4 0.313 Highly Divergent 75 16 35.0 0.84 2059.40 (1572.90) 29.80 (14.62) 0.52 (0.32) 11.14 2014 2 0.336 Mildly Divergent 213 12 22.7 0.66 265.38 (160.60) 31.44 (19.67) 0.43 (0.26) 11.15 2009 2 0.45 Mildly Divergent 1372 20 20.0 0.12 265.38 (160.60) 31.44 (19.67) 0.43 (0.26) 10.59
YPS-540 Browns Cr H, C, A 2016 4 0.42 Mildly Divergent 226 14 30.4 1.32 2059.40 (1572.90) 29.80 (14.62) 0.52 (0.32) 12.14
2015 1 0.34 Mildly Divergent 217 15 43.0 0.78 192.18 (127.13) 36.46 (24.31) 0.42 (0.29) 10.74 2012 4 0.34 Mildly Divergent 174 13 17.8 0.54 2059.40 (1572.90) 29.80 (14.62) 0.52 (0.32) 11.27
3.4.5.1 Forty Mile Test Site Discussion
A description of the site assessment results, placer mining activity, as well as the priority for re-sampling the site is provided below. At this time the intensity and proximity of all historic and active placer mining cannot be provided for each sample site. Information provided is based on observations made during field sampling as well as through conversation with knowledgeable personnel and should therefore not be considered exhaustive. YPS-379 This moderate-moderate suitability site is located at the mouth of Bruin Creek with no known active placer mining upstream and only minimal historic activity. In 2016, benthic invertebrate abundance was within the normal range and family richness was much higher than expected. There are four years of sample data for this site however a high water event that occurred just before the 2015 sample date may have influenced the results of the site assessment and as such the 2015 result may not be representative of normal site conditions. Given the otherwise consistent site assessment results and the minimal placer activity within the drainage, this site is considered a low priority for re-sample. YPS-540 This moderate-low suitability site is located in the middle portion of the Browns Creek drainage within historic placer workings and downstream of recent active placer mining. A small landslide as well as bank erosion is present upstream of the site. In 2016, benthic invertebrate abundance was below the normal range but family richness was slightly higher than expected. There are 3 years of sample data for this site and given the presence of new placer mining upstream, it is considered to have a moderate priority for re-sample.
22
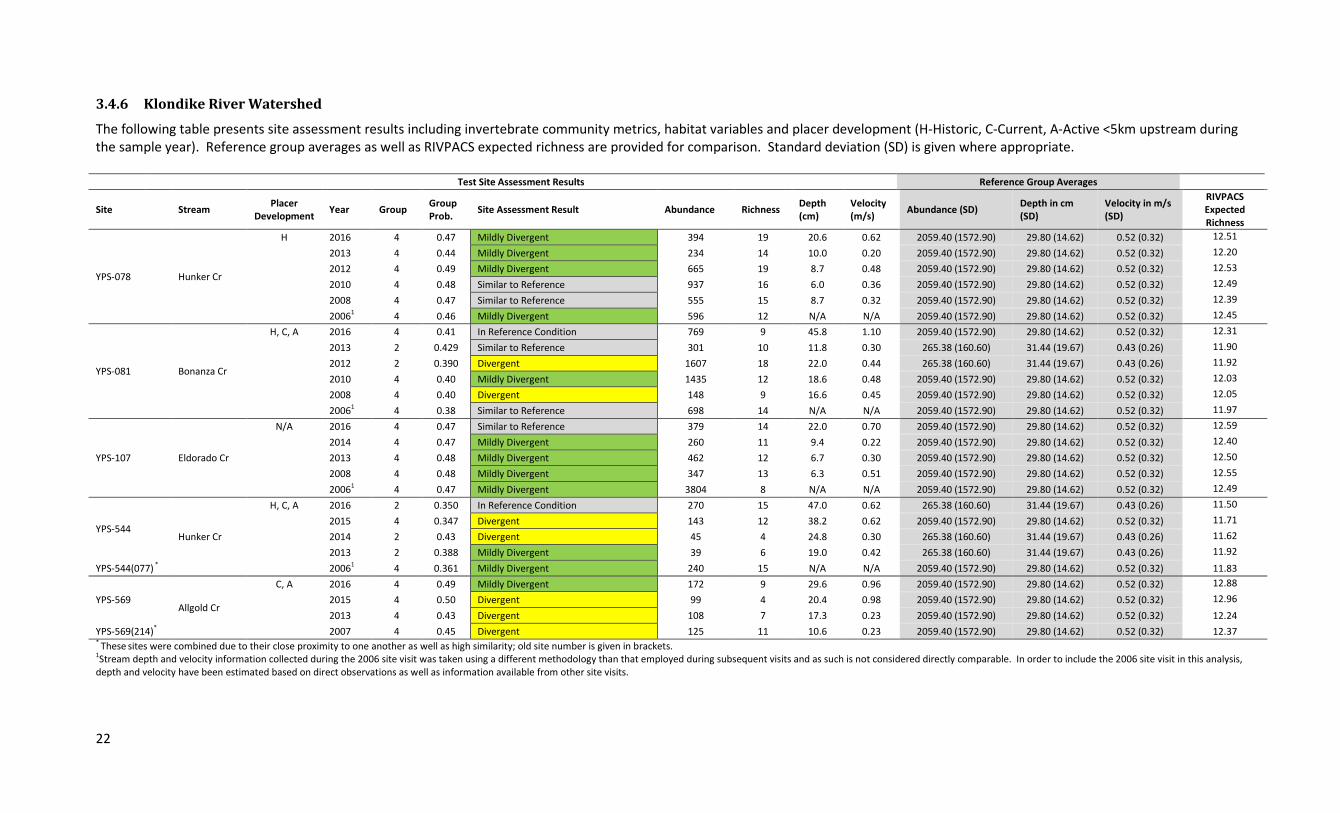
3.4.6 Klondike River Watershed
The following table presents site assessment results including invertebrate community metrics, habitat variables and placer development (H-Historic, C-Current, A-Active <5km upstream during the sample year). Reference group averages as well as RIVPACS expected richness are provided for comparison. Standard deviation (SD) is given where appropriate.
Test Site Assessment Results Reference Group Averages
Site Stream Placer Development Year Group Group
Prob. Site Assessment Result Abundance Richness Depth (cm)
Velocity (m/s) Abundance (SD) Depth in cm
(SD) Velocity in m/s (SD)
RIVPACS Expected Richness
YPS-078 Hunker Cr
H 2016 4 0.47 Mildly Divergent 394 19 20.6 0.62 2059.40 (1572.90) 29.80 (14.62) 0.52 (0.32) 12.51
2013 4 0.44 Mildly Divergent 234 14 10.0 0.20 2059.40 (1572.90) 29.80 (14.62) 0.52 (0.32) 12.20 2012 4 0.49 Mildly Divergent 665 19 8.7 0.48 2059.40 (1572.90) 29.80 (14.62) 0.52 (0.32) 12.53 2010 4 0.48 Similar to Reference 937 16 6.0 0.36 2059.40 (1572.90) 29.80 (14.62) 0.52 (0.32) 12.49 2008 4 0.47 Similar to Reference 555 15 8.7 0.32 2059.40 (1572.90) 29.80 (14.62) 0.52 (0.32) 12.39
20061 4 0.46 Mildly Divergent 596 12 N/A N/A 2059.40 (1572.90) 29.80 (14.62) 0.52 (0.32) 12.45
YPS-081 Bonanza Cr
H, C, A 2016 4 0.41 In Reference Condition 769 9 45.8 1.10 2059.40 (1572.90) 29.80 (14.62) 0.52 (0.32) 12.31 2013 2 0.429 Similar to Reference 301 10 11.8 0.30 265.38 (160.60) 31.44 (19.67) 0.43 (0.26) 11.90 2012 2 0.390 Divergent 1607 18 22.0 0.44 265.38 (160.60) 31.44 (19.67) 0.43 (0.26) 11.92
2010 4 0.40 Mildly Divergent 1435 12 18.6 0.48 2059.40 (1572.90) 29.80 (14.62) 0.52 (0.32) 12.03 2008 4 0.40 Divergent 148 9 16.6 0.45 2059.40 (1572.90) 29.80 (14.62) 0.52 (0.32) 12.05 20061 4 0.38 Similar to Reference 698 14 N/A N/A 2059.40 (1572.90) 29.80 (14.62) 0.52 (0.32) 11.97
YPS-107 Eldorado Cr
N/A 2016 4 0.47 Similar to Reference 379 14 22.0 0.70 2059.40 (1572.90) 29.80 (14.62) 0.52 (0.32) 12.59
2014 4 0.47 Mildly Divergent 260 11 9.4 0.22 2059.40 (1572.90) 29.80 (14.62) 0.52 (0.32) 12.40 2013 4 0.48 Mildly Divergent 462 12 6.7 0.30 2059.40 (1572.90) 29.80 (14.62) 0.52 (0.32) 12.50 2008 4 0.48 Mildly Divergent 347 13 6.3 0.51 2059.40 (1572.90) 29.80 (14.62) 0.52 (0.32) 12.55 20061 4 0.47 Mildly Divergent 3804 8 N/A N/A 2059.40 (1572.90) 29.80 (14.62) 0.52 (0.32) 12.49
YPS-544 Hunker Cr
H, C, A 2016 2 0.350 In Reference Condition 270 15 47.0 0.62 265.38 (160.60) 31.44 (19.67) 0.43 (0.26) 11.50
2015 4 0.347 Divergent 143 12 38.2 0.62 2059.40 (1572.90) 29.80 (14.62) 0.52 (0.32) 11.71 2014 2 0.43 Divergent 45 4 24.8 0.30 265.38 (160.60) 31.44 (19.67) 0.43 (0.26) 11.62 2013 2 0.388 Mildly Divergent 39 6 19.0 0.42 265.38 (160.60) 31.44 (19.67) 0.43 (0.26) 11.92
YPS-544(077) * 20061 4 0.361 Mildly Divergent 240 15 N/A N/A 2059.40 (1572.90) 29.80 (14.62) 0.52 (0.32) 11.83
YPS-569 Allgold Cr
C, A 2016 4 0.49 Mildly Divergent 172 9 29.6 0.96 2059.40 (1572.90) 29.80 (14.62) 0.52 (0.32) 12.88 2015 4 0.50 Divergent 99 4 20.4 0.98 2059.40 (1572.90) 29.80 (14.62) 0.52 (0.32) 12.96 2013 4 0.43 Divergent 108 7 17.3 0.23 2059.40 (1572.90) 29.80 (14.62) 0.52 (0.32) 12.24
YPS-569(214)* 2007 4 0.45 Divergent 125 11 10.6 0.23 2059.40 (1572.90) 29.80 (14.62) 0.52 (0.32) 12.37 * These sites were combined due to their close proximity to one another as well as high similarity; old site number is given in brackets. 1Stream depth and velocity information collected during the 2006 site visit was taken using a different methodology than that employed during subsequent visits and as such is not considered directly comparable. In order to include the 2006 site visit in this analysis, depth and velocity have been estimated based on direct observations as well as information available from other site visits.
23
3.4.6.1 Klondike River Test Site Discussion
A description of the site assessment results, placer mining activity, as well as the priority for re-sampling the site is provided below. At this time the intensity and proximity of all historic and active placer mining cannot be provided for each sample site and each sample year. Information related to natural disturbances that have the potential to influence aquatic conditions at a site is provided when applicable. All information provided is based on observations made during field sampling as well as through conversation with knowledgeable personnel and should therefore not be considered exhaustive. YPS-078 This moderate-low suitability site is located in the upper third of the drainage and has 6 years of sample data. In 2016 benthic invertebrate abundance was within lower than normal while richness was much higher than expected. Given the long term monitoring already undertaken at this location, this site it is considered a moderate priority for re-sampling in order to continue to observe trends in site assessment results over time. YPS-081 This moderate-high suitability site is located in the lower third of the drainage and has 6 years of sample data. In 2016 benthic invertebrate abundance was low but within the normal range while richness lower than expected. Given the long term monitoring already undertaken at this location, combined with the variable site assessment results, this site it is considered a high priority for re-sampling in order to continue to observe trends in site assessment results over time. YPS-107 This moderate-low suitability site is located in the upper third of the drainage and has 5 years of sample data. In 2016 benthic invertebrate abundance was below the normal range while family richness was slightly higher than expected. Given the long term monitoring already undertaken at this location, this site it is considered a moderate priority for re-sampling in order to continue to observe trends in site assessment results over time. YPS-544 This moderate-high suitability site is located near the mouth of Hunker Creek and has 5 years of sample data. There is active and historical placer mining upstream and in close proximity to this site. In 2016, benthic invertebrate abundance was near average for the group and family richness was much higher than expected. In 2015 this site was predicted to be in group 2 (0.346) and group 4 (0.347) with very similar probabilities. Had the site been assigned to group 4 it would have come back as similar to reference. Given the long term monitoring already undertaken at this location, this site it is considered a high priority for re-sampling in order to continue to observe trends in site assessment results over time. YPS-569 This moderate-high suitability site is located in the lower reaches of Allgold Creek, has four years of sample data and is located within historic and active placer workings and downstream of active placer mining. In 2016, benthic invertebrate abundance was below the normal range and family richness was much lower than expected. This site is considered a moderate priority for re-sampling.
24
3.4.7 Mayo River Watershed
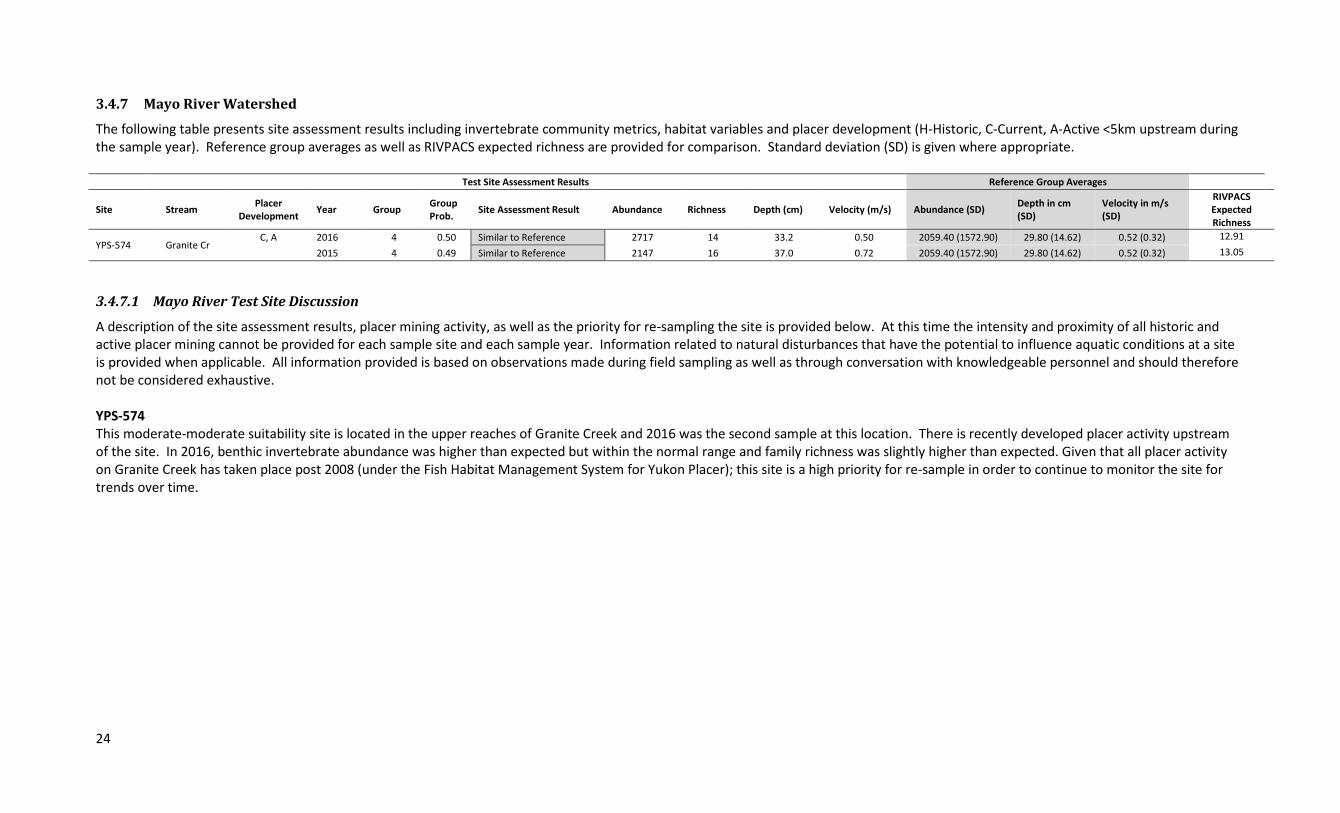
The following table presents site assessment results including invertebrate community metrics, habitat variables and placer development (H-Historic, C-Current, A-Active <5km upstream during the sample year). Reference group averages as well as RIVPACS expected richness are provided for comparison. Standard deviation (SD) is given where appropriate.
Test Site Assessment Results Reference Group Averages
Site Stream Placer Development Year Group Group
Prob. Site Assessment Result Abundance Richness Depth (cm) Velocity (m/s) Abundance (SD) Depth in cm (SD)
Velocity in m/s (SD)
RIVPACS Expected Richness
YPS-574 Granite Cr C, A 2016 4 0.50 Similar to Reference 2717 14 33.2 0.50 2059.40 (1572.90) 29.80 (14.62) 0.52 (0.32) 12.91
2015 4 0.49 Similar to Reference 2147 16 37.0 0.72 2059.40 (1572.90) 29.80 (14.62) 0.52 (0.32) 13.05
3.4.7.1 Mayo River Test Site Discussion
A description of the site assessment results, placer mining activity, as well as the priority for re-sampling the site is provided below. At this time the intensity and proximity of all historic and active placer mining cannot be provided for each sample site and each sample year. Information related to natural disturbances that have the potential to influence aquatic conditions at a site is provided when applicable. All information provided is based on observations made during field sampling as well as through conversation with knowledgeable personnel and should therefore not be considered exhaustive. YPS-574 This moderate-moderate suitability site is located in the upper reaches of Granite Creek and 2016 was the second sample at this location. There is recently developed placer activity upstream of the site. In 2016, benthic invertebrate abundance was higher than expected but within the normal range and family richness was slightly higher than expected. Given that all placer activity on Granite Creek has taken place post 2008 (under the Fish Habitat Management System for Yukon Placer); this site is a high priority for re-sample in order to continue to monitor the site for trends over time.
25
3.4.8 Sixty Mile River Watershed
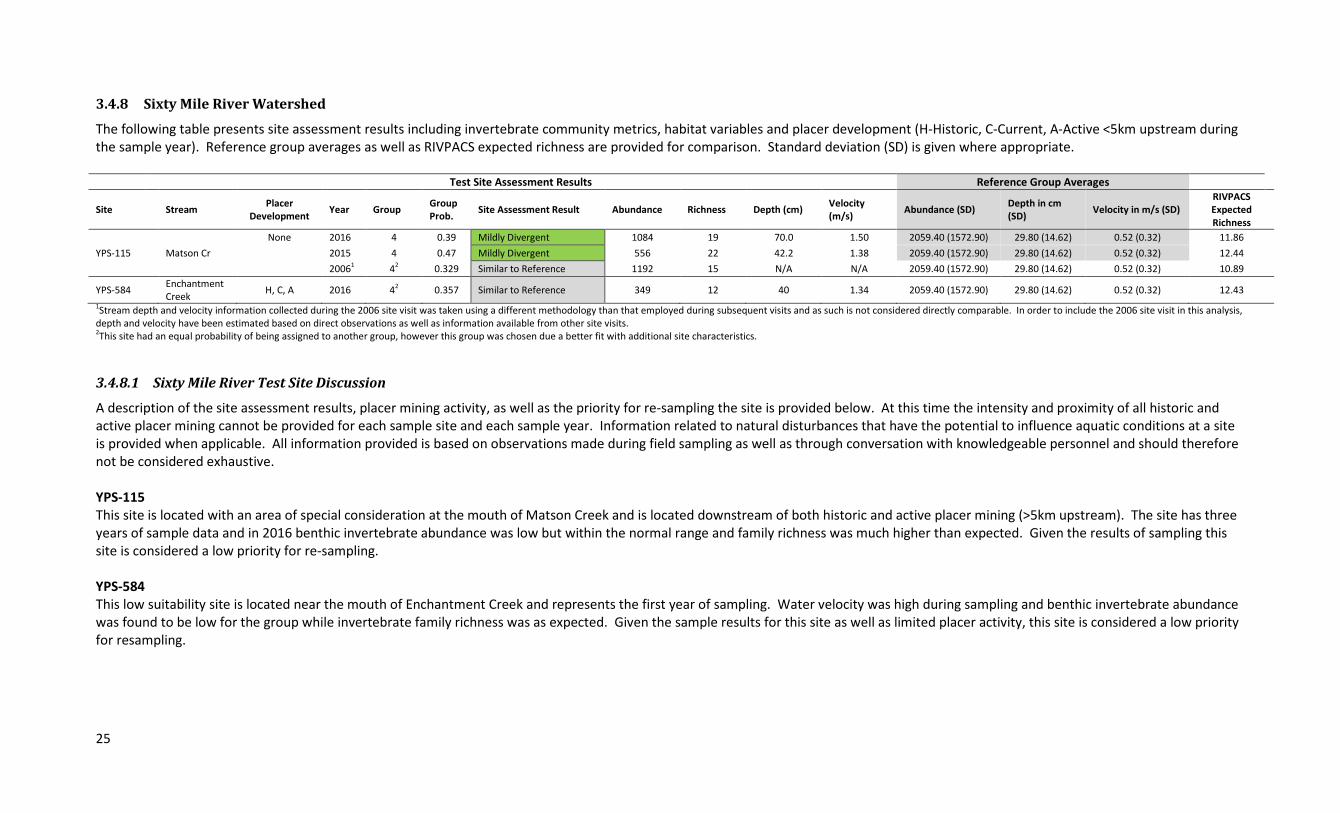
The following table presents site assessment results including invertebrate community metrics, habitat variables and placer development (H-Historic, C-Current, A-Active <5km upstream during the sample year). Reference group averages as well as RIVPACS expected richness are provided for comparison. Standard deviation (SD) is given where appropriate.
Test Site Assessment Results Reference Group Averages
Site Stream Placer Development Year Group Group
Prob. Site Assessment Result Abundance Richness Depth (cm) Velocity (m/s) Abundance (SD) Depth in cm
(SD) Velocity in m/s (SD) RIVPACS Expected Richness
YPS-115 Matson Cr None 2016 4 0.39 Mildly Divergent 1084 19 70.0 1.50 2059.40 (1572.90) 29.80 (14.62) 0.52 (0.32) 11.86
2015 4 0.47 Mildly Divergent 556 22 42.2 1.38 2059.40 (1572.90) 29.80 (14.62) 0.52 (0.32) 12.44 20061 42 0.329 Similar to Reference 1192 15 N/A N/A 2059.40 (1572.90) 29.80 (14.62) 0.52 (0.32) 10.89
YPS-584 Enchantment Creek H, C, A 2016 42 0.357 Similar to Reference 349 12 40 1.34 2059.40 (1572.90) 29.80 (14.62) 0.52 (0.32) 12.43
1Stream depth and velocity information collected during the 2006 site visit was taken using a different methodology than that employed during subsequent visits and as such is not considered directly comparable. In order to include the 2006 site visit in this analysis, depth and velocity have been estimated based on direct observations as well as information available from other site visits. 2This site had an equal probability of being assigned to another group, however this group was chosen due a better fit with additional site characteristics.
3.4.8.1 Sixty Mile River Test Site Discussion
A description of the site assessment results, placer mining activity, as well as the priority for re-sampling the site is provided below. At this time the intensity and proximity of all historic and active placer mining cannot be provided for each sample site and each sample year. Information related to natural disturbances that have the potential to influence aquatic conditions at a site is provided when applicable. All information provided is based on observations made during field sampling as well as through conversation with knowledgeable personnel and should therefore not be considered exhaustive. YPS-115 This site is located with an area of special consideration at the mouth of Matson Creek and is located downstream of both historic and active placer mining (>5km upstream). The site has three years of sample data and in 2016 benthic invertebrate abundance was low but within the normal range and family richness was much higher than expected. Given the results of sampling this site is considered a low priority for re-sampling. YPS-584 This low suitability site is located near the mouth of Enchantment Creek and represents the first year of sampling. Water velocity was high during sampling and benthic invertebrate abundance was found to be low for the group while invertebrate family richness was as expected. Given the sample results for this site as well as limited placer activity, this site is considered a low priority for resampling.
26
3.4.9 White River Watershed
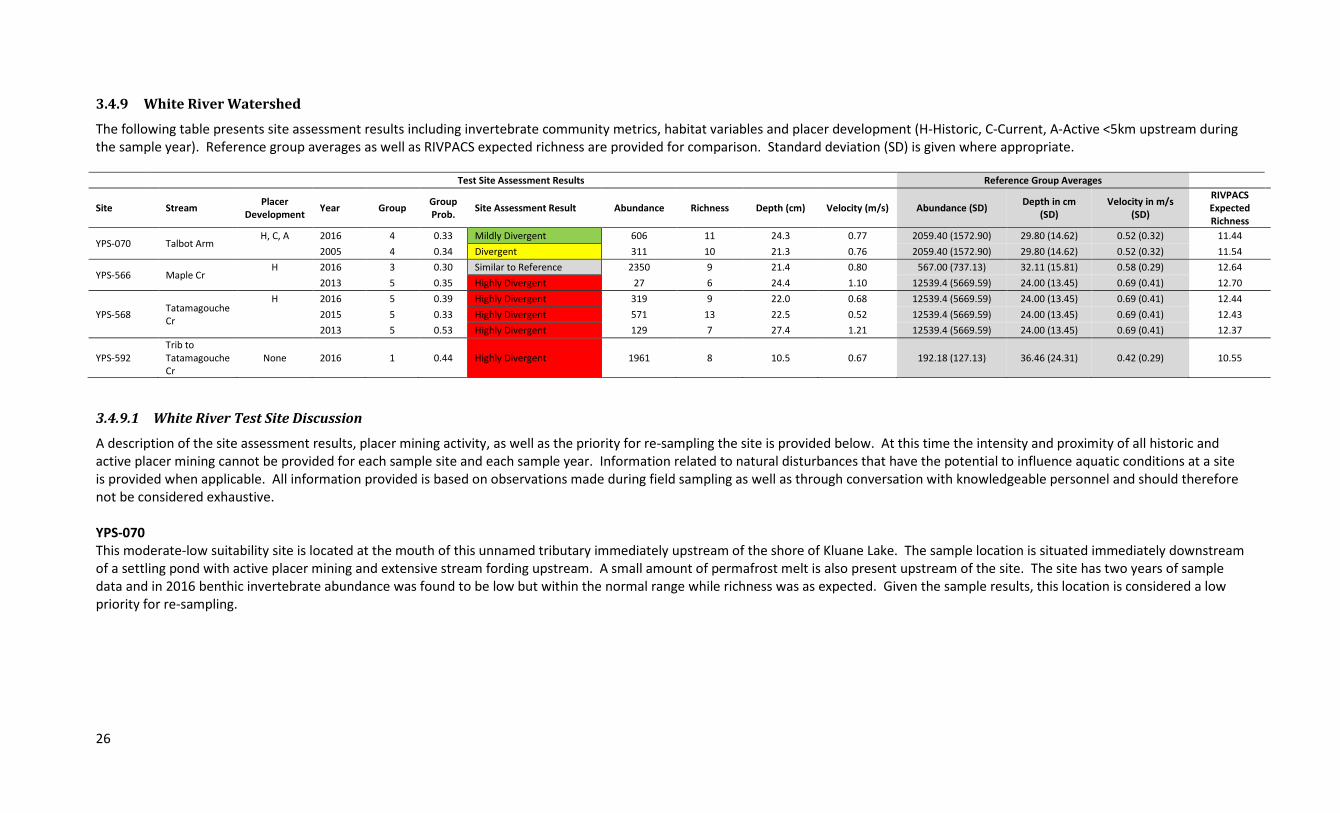
The following table presents site assessment results including invertebrate community metrics, habitat variables and placer development (H-Historic, C-Current, A-Active <5km upstream during the sample year). Reference group averages as well as RIVPACS expected richness are provided for comparison. Standard deviation (SD) is given where appropriate.
Test Site Assessment Results Reference Group Averages
Site Stream Placer Development Year Group Group
Prob. Site Assessment Result Abundance Richness Depth (cm) Velocity (m/s) Abundance (SD) Depth in cm (SD)
Velocity in m/s (SD)
RIVPACS Expected Richness
YPS-070 Talbot Arm H, C, A 2016 4 0.33 Mildly Divergent 606 11 24.3 0.77 2059.40 (1572.90) 29.80 (14.62) 0.52 (0.32) 11.44
2005 4 0.34 Divergent 311 10 21.3 0.76 2059.40 (1572.90) 29.80 (14.62) 0.52 (0.32) 11.54
YPS-566 Maple Cr H 2016 3 0.30 Similar to Reference 2350 9 21.4 0.80 567.00 (737.13) 32.11 (15.81) 0.58 (0.29) 12.64 2013 5 0.35 Highly Divergent 27 6 24.4 1.10 12539.4 (5669.59) 24.00 (13.45) 0.69 (0.41) 12.70
Tatamagouche Cr
H 2016 5 0.39 Highly Divergent 319 9 22.0 0.68 12539.4 (5669.59) 24.00 (13.45) 0.69 (0.41) 12.44 YPS-568 2015 5 0.33 Highly Divergent 571 13 22.5 0.52 12539.4 (5669.59) 24.00 (13.45) 0.69 (0.41) 12.43
2013 5 0.53 Highly Divergent 129 7 27.4 1.21 12539.4 (5669.59) 24.00 (13.45) 0.69 (0.41) 12.37
YPS-592 Trib to Tatamagouche Cr
None 2016 1 0.44 Highly Divergent 1961 8 10.5 0.67 192.18 (127.13) 36.46 (24.31) 0.42 (0.29) 10.55
3.4.9.1 White River Test Site Discussion
A description of the site assessment results, placer mining activity, as well as the priority for re-sampling the site is provided below. At this time the intensity and proximity of all historic and active placer mining cannot be provided for each sample site and each sample year. Information related to natural disturbances that have the potential to influence aquatic conditions at a site is provided when applicable. All information provided is based on observations made during field sampling as well as through conversation with knowledgeable personnel and should therefore not be considered exhaustive. YPS-070 This moderate-low suitability site is located at the mouth of this unnamed tributary immediately upstream of the shore of Kluane Lake. The sample location is situated immediately downstream of a settling pond with active placer mining and extensive stream fording upstream. A small amount of permafrost melt is also present upstream of the site. The site has two years of sample data and in 2016 benthic invertebrate abundance was found to be low but within the normal range while richness was as expected. Given the sample results, this location is considered a low priority for re-sampling.
27
YPS-566 This low suitability site is located in the middle third of the drainage and has 2 years of sample data. In 2016 benthic invertebrate abundance was well above the expected range for the group while richness was much lower than expected. High water velocity during the 2013 sample may have influenced the site assessment result. Based on the variable site assessment results at this location further sampling is necessary in order to determine if a trend exists. YPS-568 This low suitability site is located mid-way up the Tatamagouche Creek drainage with only historic placer mining as well as roads and fords located upstream. In 2016, benthic invertebrate abundance was well below the normal range and family richness was much lower than expected. There are three years of sample data for this site which indicate an impaired aquatic environment, however there may be an issue with the reference group the site is predicted to and as such the site assessment results may not be appropriate. Until such time as this modeling issue is resolved this site is considered a low priority for re-sample. YPS-592 This low suitability site was established to verify that the CABIN assessment model is working as expected as the site is located upstream of all placer activity and is in a location that is considered to be in a natural state with no other potential stressors observed. The site assessment result was not as expected which may be due to a group assignment issue similar to that observed in YPS-568.

28
3.4.10 Yukon River South Watershed
The following table presents site assessment results including invertebrate community metrics, habitat variables and placer development (H-Historic, C-Current, A-Active <5km upstream during the sample year). Reference group averages as well as RIVPACS expected richness are provided for comparison. Standard deviation (SD) is given where appropriate.
Test Site Assessment Results Reference Group Averages
Site Stream Placer Development Year Group Group
Prob. Site Assessment Result Abundance Richness Depth (cm) Velocity (m/s) Abundance (SD) Depth in cm (SD)
Velocity in m/s (SD)
RIVPACS Expected Richness
YPS-124 Britannia Cr H 2016 4 0.47 Mildly Divergent 365 15 24.8 0.74 2059.40 (1572.90) 29.80 (14.62) 0.52 (0.32) 12.66
2006 4 0.50 Highly Divergent 36 7 36.4 0.43 2059.40 (1572.90) 29.80 (14.62) 0.52 (0.32) 12.67
YPS-164 Thistle Creek
H, C 2016 4 0.41 Mildly Divergent 273 14 18.0 0.60 2059.40 (1572.90) 29.80 (14.62) 0.52 (0.32) 11.16 2015 4 0.45 Divergent 303 11 18.7 0.84 2059.40 (1572.90) 29.80 (14.62) 0.52 (0.32) 11.61 2014 1 0.39 Mildly Divergent 517 15 29.8 0.48 192.18 (127.13) 36.46 (24.31) 0.42 (0.29) 10.43
2013 4 0.36 Highly Divergent 55 6 16.2 0.31 2059.40 (1572.90) 29.80 (14.62) 0.52 (0.32) 10.75 2012 4 0.41 Divergent 136 13 18.2 0.61 2059.40 (1572.90) 29.80 (14.62) 0.52 (0.32) 11.21
20061 42 0.36 Mildly Divergent 220 8 N/A N/A 2059.40 (1572.90) 29.80 (14.62) 0.52 (0.32) 10.69
YPS-534 Kirkman Cr H, C, A 2016 4 0.42 Mildly Divergent 505 14 25.0 0.47 2059.40 (1572.90) 29.80 (14.62) 0.52 (0.32) 11.41
2014 4 0.48 Similar to Reference 399 14 27.0 0.87 2059.40 (1572.90) 29.80 (14.62) 0.52 (0.32) 12.00 2012 4 0.50 Mildly Divergent 306 14 11.6 0.66 2059.40 (1572.90) 29.80 (14.62) 0.52 (0.32) 12.09
YPS-570 Ballarat Cr H, C, A 2016 4 0.46 Mildly Divergent 351 13 17.3 0.57 2059.40 (1572.90) 29.80 (14.62) 0.52 (0.32) 11.94
2014 4 0.41 Mildly Divergent 229 12 21.7 0.43 2059.40 (1572.90) 29.80 (14.62) 0.52 (0.32) 11.60 1Stream depth and velocity information collected during the 2006 site visit was taken using a different methodology than that employed during subsequent visits and as such is not considered directly comparable. In order to include the 2006 site visit in this analysis, depth and velocity have been estimated based on direct observations as well as information available from other site visits. 2This site had an equal probability of being assigned to another group, however this group was chosen due a better fit with additional site characteristics.
3.4.10.1 Yukon River South Test Site Discussion
A description of the site assessment results, placer mining activity, as well as the priority for re-sampling the site is provided below. At this time the intensity and proximity of all historic and active placer mining cannot be provided for each sample site and each sample year. Information related to natural disturbances that have the potential to influence aquatic conditions at a site is provided when applicable. All information provided is based on observations made during field sampling as well as through conversation with knowledgeable personnel and should therefore not be considered exhaustive. YPS-124 This moderate-high suitability site is located in the lower third of the drainage and has 2 years of sample data. In 2016, benthic invertebrate abundance was below the normal range and family richness was higher than expected. Given the variable site assessment results at this location the site is considered a moderate priority for re-sampling.
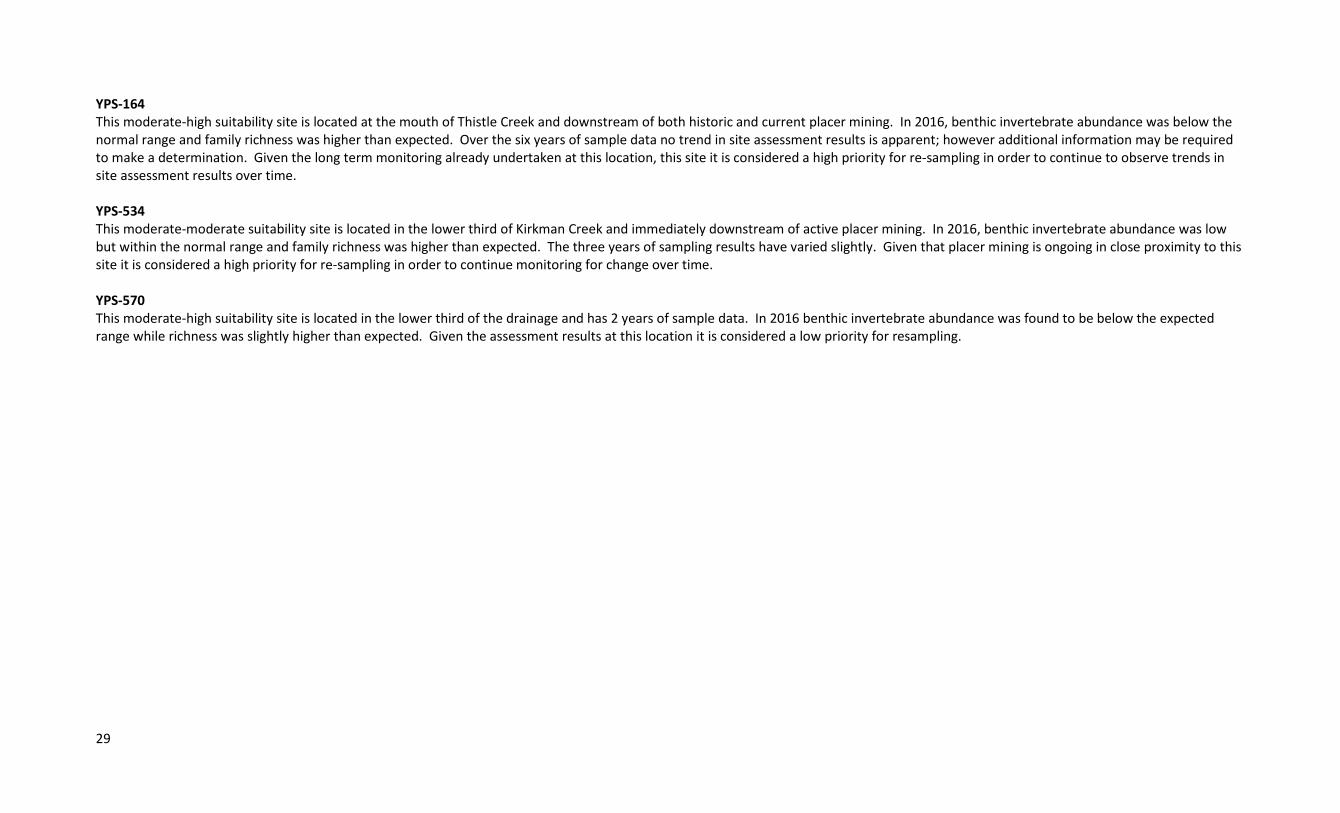
29
YPS-164 This moderate-high suitability site is located at the mouth of Thistle Creek and downstream of both historic and current placer mining. In 2016, benthic invertebrate abundance was below the normal range and family richness was higher than expected. Over the six years of sample data no trend in site assessment results is apparent; however additional information may be required to make a determination. Given the long term monitoring already undertaken at this location, this site it is considered a high priority for re-sampling in order to continue to observe trends in site assessment results over time. YPS-534 This moderate-moderate suitability site is located in the lower third of Kirkman Creek and immediately downstream of active placer mining. In 2016, benthic invertebrate abundance was low but within the normal range and family richness was higher than expected. The three years of sampling results have varied slightly. Given that placer mining is ongoing in close proximity to this site it is considered a high priority for re-sampling in order to continue monitoring for change over time. YPS-570 This moderate-high suitability site is located in the lower third of the drainage and has 2 years of sample data. In 2016 benthic invertebrate abundance was found to be below the expected range while richness was slightly higher than expected. Given the assessment results at this location it is considered a low priority for resampling.
30
4 Next Steps
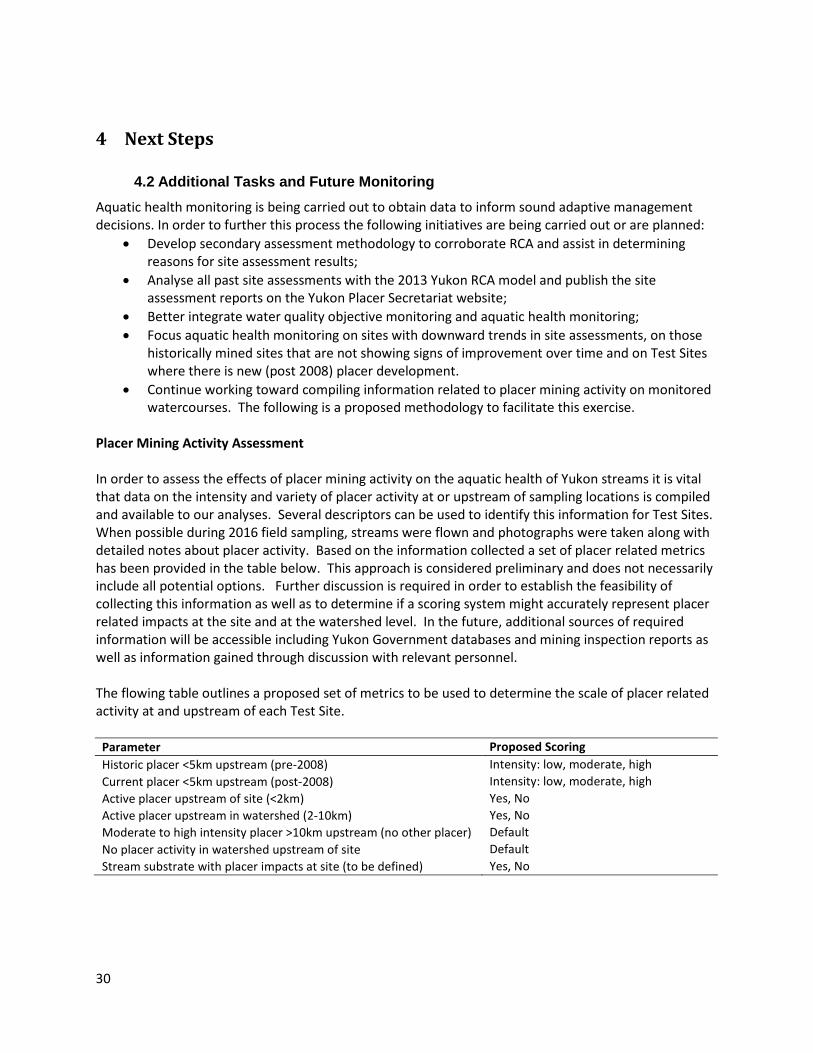
4.2 Additional Tasks and Future Monitoring Aquatic health monitoring is being carried out to obtain data to inform sound adaptive management decisions. In order to further this process the following initiatives are being carried out or are planned:
• Develop secondary assessment methodology to corroborate RCA and assist in determining reasons for site assessment results;
• Analyse all past site assessments with the 2013 Yukon RCA model and publish the site assessment reports on the Yukon Placer Secretariat website;
• Better integrate water quality objective monitoring and aquatic health monitoring; • Focus aquatic health monitoring on sites with downward trends in site assessments, on those
historically mined sites that are not showing signs of improvement over time and on Test Sites where there is new (post 2008) placer development.
• Continue working toward compiling information related to placer mining activity on monitored watercourses. The following is a proposed methodology to facilitate this exercise.
Placer Mining Activity Assessment In order to assess the effects of placer mining activity on the aquatic health of Yukon streams it is vital that data on the intensity and variety of placer activity at or upstream of sampling locations is compiled and available to our analyses. Several descriptors can be used to identify this information for Test Sites. When possible during 2016 field sampling, streams were flown and photographs were taken along with detailed notes about placer activity. Based on the information collected a set of placer related metrics has been provided in the table below. This approach is considered preliminary and does not necessarily include all potential options. Further discussion is required in order to establish the feasibility of collecting this information as well as to determine if a scoring system might accurately represent placer related impacts at the site and at the watershed level. In the future, additional sources of required information will be accessible including Yukon Government databases and mining inspection reports as well as information gained through discussion with relevant personnel. The flowing table outlines a proposed set of metrics to be used to determine the scale of placer related activity at and upstream of each Test Site.
Parameter Proposed Scoring Historic placer <5km upstream (pre-2008) Intensity: low, moderate, high Current placer <5km upstream (post-2008) Intensity: low, moderate, high Active placer upstream of site (<2km) Yes, No Active placer upstream in watershed (2-10km) Yes, No Moderate to high intensity placer >10km upstream (no other placer) Default No placer activity in watershed upstream of site Default Stream substrate with placer impacts at site (to be defined) Yes, No

31
Appendix 1 - CABIN Summary Reports for 2016 Test Site Assessments (Sites listed in numerical order)

32
Appendix 2 - 75% Ellipse Plots for 2016 Test Sites Assessed in Band One in CABIN Online Assessment
(Sites listed in numerical order)

33
Appendix 3 - CABIN Raw Site Data Outputs, 2016 Sample Sites (All measurements reflect conditions at the site on the sample date)