Embed Size (px)
Citation preview

June 26, 2018
© Yokogawa Electric Corporation
0
Financial Fact Book
Fiscal Year Ended March 31, 2018
2018年6月26日
June 26, 2018

June 26, 2018
© Yokogawa Electric Corporation
1
目次
ページNo Title タイトル
2 1.Sales and Operating Income 売上高、営業利益
3,4 2.Sales According to Business Segmentation 部門別売上
5 3.Operating Income According to Business Segmentation 部門別営業利益
6 4.Sales by Geographical Location 地域別売上高
7 5.Cost Composition and Operating Income / Sales 費用構成、売上高営業利益率
8 6.Selling, General and Administrative Expenses 販売費及び一般管理費
9 7.Gross Profit Margin 売上総利益率
10 8.Profit Attributable to Owners of Parent / Sales 売上高当期純利益率
11 9.Interest Coverage Ratio インタレスト カバレッジ レシオ
12 10.Earnings per Share and Price Earnings Ratio 1株当たり利益、株価収益率
13 11.Working Capital and Current Ratio 運転資本、流動比率
14 12.Total Assets Turnover 総資産回転率
15 13.Inventory Turnover 棚卸資産回転率
16 14.Return on Equity and Return on Assets 自己資本利益率、総資産利益率
17 15.Shareholders’ Equity / Total Assets 自己資本比率
18 16.Debt Equity Ratio デット エクイティ レシオ
19 17.Aggregate Market Value and Price Book-value Ratio 時価総額、株価純資産倍率
20 18.Shareholders' Equity per Share 1株当たり純資産
21 19. Dividend per Share/Payout Ratio 1株当たり配当金、配当性向
22 20. Average Exchange Rate During the Period 期中平均為替レート
23 21.Cash flow キャッシュ・フロー
24 22.People According to Business Segmentation 部門別人員

June 26, 2018
© Yokogawa Electric Corporation
2
Sales (Million Yen)
0
10,000
20,000
30,000
40,000
50,000
0
100,000
200,000
300,000
400,000
500,000
FY08 FY09 FY10 FY11 FY12 FY13 FY14 FY15 FY16 FY17
Sales 売上高 Operating Income 営業利益
Operating Income (Million Yen)
FY08 FY09 FY10 FY11 FY12 FY13 FY14 FY15 FY16 FY17
Sales
売上高(Million Yen) 376,534 316,606 325,620 334,668 347,899 388,463 405,792 413,732 391,433 406,590
Annual Change
前年比(%) -13.9% -15.9% 2.8% 2.8% 4.0% 11.7% 4.5% 2.0% -5.4% 3.9%
Operating Income
営業利益(Million Yen) 4,707 2,619 11,079 16,601 18,409 25,893 29,818 39,642 31,608 32,696
Operating Income on Sales
売上高営業利益率(%) 1.3% 0.8% 3.4% 5.0% 5.3% 6.7% 7.3% 9.6% 8.1% 8.0%
1. Sales and Operating Income 売上高、営業利益

June 26, 2018
© Yokogawa Electric Corporation
3
0
100
200
300
400
500
FY06 FY07 FY08 FY09
(Billion Yen)
New & Others 新事業その他 Measurement 計測 Control 制御
FY06 FY07 FY08 FY09
Control (Billion Yen) 309.2 322.2 301.2 256.8
制御 (Annual Change) 22.3% 4.2% -6.5% -14.7%
Measurement (Billion Yen) 78.6 68.8 34.1 26.4
計測 (Annual Change) -4.1% -12.5% -50.4% -22.6%
New & Others (Billion Yen) 45.6 46.4 41.2 33.4
新事業その他 (Annual Change) -15.6% 1.8% -11.2% -18.9%
Total (Billion Yen) 433.4 437.4 376.5 316.6
2. Sales According to FY06-09 Business Segmentation
部門別売上(旧セグメント)FY06-09

June 26, 2018
© Yokogawa Electric Corporation
4
0
100
200
300
400
500
FY08 FY09 FY10 FY11 FY12 FY13 FY14 FY15 FY16 FY17
(Billion Yen)
Aviation and Other 航機その他 Measurement 計測 Control 制御
FY08 FY09 FY10 FY11 FY12 FY13 FY14 FY15 FY16 FY17
Control (Billion Yen) 301.2 256.8 260.7 277.2 295.7 336.3 358.0 366.7 348.1 363.3
制御 (Annual Change) - -14.7% 1.5% 6.3% 6.7% 13.7% 6.5% 2.4% -5.1% 4.4%
Measurement (Billion Yen) 41.8 31.5 37.1 34.6 29.0 27.8 23.8 23.4 22.2 22.3
計測 (Annual Change) - -24.6% 17.6% -6.6% -16.3% -4.1% -14.4% -1.7% -5.1% 0.5%
Aviation and Other (Billion Yen) 33.5 28.3 27.9 22.9 23.2 24.3 24.0 23.6 21.1 21.0
航機その他 (Annual Change) - -15.5% -1.5% -17.9% 1.4% 4.6% -1.2% -1.7% -10.6% -0.5%
Total (Billion Yen) 376.5 316.6 325.6 334.7 347.9 388.4 405.8 413.7 391.4 406.6
2. Sales According to FY08-16 Business Segmentation
部門別売上(新セグメント)FY08-17

June 26, 2018
© Yokogawa Electric Corporation
5
-30,000
-20,000
-10,000
0
10,000
20,000
30,000
40,000
50,000
FY08 FY09 FY10 FY11 FY12 FY13 FY14 FY15 FY16 FY17
(Million Yen)
Aviation and Other 航機その他 Measurement 計測 Control 制御
FY08 FY09 FY10 FY11 FY12 FY13 FY14 FY15 FY16 FY17
Control (Million Yen) 29,097 19,942 16,464 19,896 18,011 24,224 27,089 36,689 30,636 30,389
制御 (Annual Change) - -31.5% -17.4% 20.8% -9.5% 34.5% 11.8% 35.4% -16.5% -0.8%
Measurement (Million Yen) -25,099 -18,955 -6,391 -3,572 -225 1,018 1,625 2,389 898 2,533
計測 (Annual Change) - - - - - - 59.6% 47.0% -62.4% 182.1%
Aviation and Other (Million Yen) 708 1,632 1,006 277 624 650 1,104 564 73 -225
航機その他 (Annual Change) - 130.5% -38.4% -72.5% 125.3% 4.2% 69.8% -48.9% -87.1% -
Total (Million Yen) 4,707 2,619 11,079 16,601 18,409 25,893 29,818 39,642 31,608 32,696
3. Operating Income According to FY08-17 Business Segmentation
部門別営業利益(新セグメント)FY08-17

June 26, 2018
© Yokogawa Electric Corporation
6
0
100,000
200,000
300,000
400,000
500,000
FY08 FY09 FY10 FY11 FY12 FY13 FY14 FY15 FY16 FY17
Japan 日本 Asia アジア Europe 欧州 North America 北米 Middle East 中東 Other その他
(Million Yen)
FY08 FY09 FY10 FY11 FY12 FY13 FY14 FY15 FY16 FY17
Japan (Million Yen) 170,155 139,308 140,920 135,785 133,997 129,079 124,733 127,111 127,943 130,466
日本 (%) 45.2 44.0 43.2 40.6 38.5 33.2 30.7 30.7 32.7 32.1Asia (Million Yen) 79,372 72,872 77,037 87,287 87,991 98,612 103,756 100,477 98,120 111,990
アジア (%) 21.1 23.0 23.7 26.1 25.3 25.4 25.6 24.3 25.1 27.6
Europe (Million Yen) 36,004 32,007 26,843 26,366 27,521 37,743 36,704 34,821 31,184 32,677
欧州 (%) 9.6 10.1 8.2 7.9 7.9 9.7 9.0 8.4 8.0 8.0
North America (Million Yen) 29,087 20,931 20,997 21,276 21,500 25,856 34,540 40,435 32,906 30,935
北米 (%) 7.7 6.6 6.5 6.3 6.2 6.7 8.5 9.8 8.4 7.6
Middle East (Million Yen) 32,096 25,199 22,952 27,815 32,141 37,315 41,142 46,761 45,555 43,926
中東 (%) 8.5 8.0 7.0 8.3 9.2 9.6 10.2 11.3 11.6 10.8
Other (Million Yen) 29,820 26,289 36,868 36,137 44,747 59,856 64,915 64,124 55,722 56,593
その他 (%) 7.9 8.3 11.3 10.8 12.9 15.4 16.0 15.5 14.2 13.9
Total (Million Yen) 376,534 316,606 325,620 334,668 347,899 388,463 405,792 413,732 391,433 406,590
合計 (%) 100.0 100.0 100.0 100.0 100.0 100.0 100.0 100.0 100.0 100.0
Notes: We have had a separate category for the Middle East figures since FY08, as this region has accounted for a significant portion of consolidated sales.
Until the end of FY07, these figures were included in the "Other" category.
4. Sales by Geographical Location
地域別売上高

June 26, 2018
© Yokogawa Electric Corporation
7
(Million Yen)(%)
0
5
10
15
0
10,000
20,000
30,000
40,000
50,000
FY08 FY09 FY10 FY11 FY12 FY13 FY14 FY15 FY16 FY17
Research & Development 研究開発費 Depreciation 減価償却費 CAPEX 設備投資 Operating Income/Net Sales 売上高営業利益率
FY08 FY09 FY10 FY11 FY12 FY13 FY14 FY15 FY16 FY17
(Million Yen) 37,229 28,786 29,179 27,472 25,477 25,824 25,787 25,286 27,126 26,575
R&D/Sales売上高比(%) 9.9 9.1 9.0 8.2 7.3 6.6 6.4 6.3 6.9 6.5
(Million Yen) 21,615 16,033 13,836 12,756 13,496 13,551 14,485 15,121 18,009 18,319
Depreciation/Sales 売上高比(%) 5.7 5.1 4.2 3.8 3.9 3.5 3.6 3.7 4.6 4.5
(Million Yen) 26,813 11,125 11,337 11,143 13,468 14,006 14,129 15,377 14,168 13,230
CAPEX/Sales 売上高比(%) 7.1 3.5 3.5 3.3 3.9 3.6 3.5 3.7 3.6 3.3
Operating Income/Sales 売上高営業利益率(%) 1.3 0.8 3.4 5.0 5.3 6.7 7.3 9.6 8.1 8.0
Research and Development
研究開発費
Depreciation
減価償却費
CAPEX
設備投資
5. Cost Composition and Operating Income/Sales
費用構成、売上高営業利益率

June 26, 2018
© Yokogawa Electric Corporation
8
(Million Yen)
(%)
20
25
30
35
40
0
50,000
100,000
150,000
FY08 FY09 FY10 FY11* FY12 FY13 FY14 FY15 FY16 FY17
Selling,General and Administrative Expenses 販売管理費
SG&A Expenses/Sales 売上高販売管理費率
FY08 FY09 FY10 FY11* FY12 FY13 FY14 FY15 FY16 FY17
(Million Yen) 118,821 99,512 99,410 122,636 122,845 133,313 139,395 137,146 137,502 142,631
(%) 31.6 31.4 30.5 36.6 35.3 34.3 34.4 33.1 35.1 35.1
Selling,General and Administrative
Expenses 販売管理費
SG&A Expenses/Sales
売上高販売管理費率
*Note;Changes in the treatment of R&D expenditureThe start of FY11, part of the R&D expenditures that had been considered manufacturing costs are now recognized as selling, general and administrative expenses.
*注)研究開発費の取り扱いの変更FY11から製造費用として計上していた研究開発費の一部を一般管理費として計上しています
6. Selling, General and Administrative Expenses
販売費及び一般管理費

June 26, 2018
© Yokogawa Electric Corporation
9
(Million Yen) (%)
30
35
40
45
0
50,000
100,000
150,000
200,000
FY08 FY09 FY10 FY11* FY12 FY13 FY14 FY15 FY16 FY17
Gross Profit 売上総利益 Gross Profit Margin 売上総利益率
FY08 FY09 FY10 FY11* FY12 FY13 FY14 FY15 FY16 FY17
Sales
売上高(Million Yen) 376,534 316,606 325,620 334,668 347,899 388,463 405,792 413,732 391,433 406,590
Cost of Sales
売上原価(Million Yen) 253,005 214,474 215,130 195,430 206,644 229,256 236,578 236,943 222,322 231,262
Gross Profit
売上総利益(Million Yen) 123,528 102,132 110,490 139,238 141,255 159,206 169,214 176,789 169,111 175,328
Gross Profit Margin
売上総利益率(%) 32.8 32.3 33.9 41.6 40.6 41.0 41.7 42.7 43.2 43.1
*Note;Changes in the treatment of R&D expenditureThe start of FY11, part of the R&D expenditures that had been considered manufacturing costs are now recognized as selling, general and administrative expenses.
*注)研究開発費の取り扱いの変更FY11から製造費用として計上していた研究開発費の一部を一般管理費として計上しています
7. Gross Profit Margin
売上総利益率

June 26, 2018
© Yokogawa Electric Corporation
10
(Million Yen)
(%)
-12
-8
-4
0
4
8
12
-50,000
-30,000
-10,000
10,000
30,000
50,000
FY08 FY09 FY10 FY11 FY12 FY13 FY14 FY15 FY16 FY17
Profit Attributable to Owners of Parent 親会社株主に帰属する当期純利益Net Income/Net Sales 売上高当期純利益率
FY08 FY09 FY10 FY11 FY12 FY13 FY14 FY15 FY16 FY17Sales
売上高(Million Yen) 376,534 316,606 325,620 334,671 347,899 388,463 405,792 413,732 391,433 406,590
Income before Tax
税引前当期利益(Million Yen) -9,400 -10,693 -1,025 11,672 20,496 21,750 27,426 41,936 35,523 29,381
Profit Attributable to Owners of Parent
親会社株主に帰属する当期純利益(Million Yen) -38,446 -14,799 -6,692 5,952 14,688 12,341 17,223 30,161 25,759 21,449
Profit Attributable to Owners of Parent/Sales
売上高親会社株主に帰属する当期純利益率 (%)-10.2 -4.7 -2.1 1.8 4.2 3.2 4.2 7.3 6.6 5.3
8. Profit Attributable to Owners of Parent / Sales
売上高当期純利益率

June 26, 2018
© Yokogawa Electric Corporation
11
0
20
40
60
80
100
120
FY08 FY09 FY10 FY11 FY12 FY13 FY14 FY15 FY16 FY17
(Times)
Interest Coverage Ratio インタレスト カバレッジ レシオ
FY08 FY09 FY10 FY11 FY12 FY13 FY14 FY15 FY16 FY17
Operating Income
営業利益(Million Yen) 4,707 2,619 11,079 16,601 18,409 25,893 29,818 39,642 31,608 32,696
Interest Income
受取利息(Million Yen) 209 272 305 392 466 443 534 616 557 575
Interest Expense
支払利息(Million Yen) 1,595 2,117 2,815 2,652 2,209 2,101 1,833 927 522 312
Dividends Received
受取配当金(Million Yen) 1,745 1,591 1,553 1,561 1,524 1,631 1,685 1,729 1,693 1,757
Interest Coverage Ratio
インタレスト カバレッシ ゙レシオ(Times) 4.2 2.1 4.6 7.0 9.2 13.3 17.5 45.3 64.9 112.3
Notes:Interest Coverage Ratio=(Operating Income+Interest Income and Dividends Received)/(Interest Expense)
注:インタレスト カバレッジ レシオ=(営業利益+受取利息及び受取配当金)/(支払利息)
9. Interest Coverage Ratio
インタレスト カバレッジ レシオ

June 26, 2018
© Yokogawa Electric Corporation
12
EPS (Yen) PER(Times)
-50
0
50
-150
-100
-50
0
50
100
150
FY08 FY09 FY10 FY11 FY12 FY13 FY14 FY15 FY16 FY17
Earnings per Share 1株当たり利益 Price Earnings Ratio 株価収益率
FY08 FY09 FY10 FY11 FY12 FY13 FY14 FY15 FY16 FY17
Earnings per Share
1株当たり利益(Yen) -149.3 -57.5 -26.0 23.1 57.0 47.9 66.9 114.0 96.4 80.3
Price Earnings Ratio
株価収益率(Times) - - - 36.2 16.6 34.8 19.4 10.2 18.2 27.4
Stock Price at the End of the Term
期末株価(Yen) 394 814 634 837 946 1,667 1,295 1,163 1,752 2,198
10. Earnings per Share and Price Earnings Ratio
1株当たり利益、株価収益率

June 26, 2018
© Yokogawa Electric Corporation
13
(%)
0
100
200
300
400
0
50,000
100,000
150,000
FY08 FY09 FY10 FY11 FY12 FY13 FY14 FY15 FY16 FY17
Working Capital 運転資本 Current Ratio 流動比率
(Million Yen)
FY08 FY09 FY10 FY11 FY12 FY13 FY14 FY15 FY16 FY17
Current Assets 流動資産 (Million Yen) 224,431 234,350 207,136 211,302 226,689 239,983 270,495 253,014 263,807 283,917
Current Liabilities 流動負債 (Million Yen) 113,126 124,426 152,093 114,616 134,970 135,833 164,573 133,599 136,909 129,411
Current Ratio 流動比率 (%) 198 188 136 184 168 177 164 189 193 219
Working Capital 運転資本 (Million Yen) 111,305 109,924 55,043 96,686 91,719 104,150 105,922 119,415 126,898 154,506
Notes:Current Ratio=Current Assets/Current Liabilities Working Capital=Current Assets-Current Liabilities
(注)流動比率=流動資産/流動負債 運転資本=流動資産-流動負債
11. Working Capital and Current Ratio
運転資本、流動比率

June 26, 2018
© Yokogawa Electric Corporation
14
(Million Yen) (Times)
0.0
0.2
0.4
0.6
0.8
1.0
1.2
0
100,000
200,000
300,000
400,000
500,000
FY08 FY09 FY10 FY11 FY12 FY13 FY14 FY15 FY16 FY17
Total Assets 総資産 Total Assets Turnover 総資産回転率
FY08 FY09 FY10 FY11 FY12 FY13 FY14 FY15 FY16 FY17
Sales
売上高(Million Yen) 376,534 316,606 325,620 334,668 347,899 388,463 405,792 413,732 391,433 406,590
Total Assets
総資産(Million Yen) 400,959 398,792 361,233 359,500 379,931 398,920 439,957 412,772 440,498 448,809
Total Assets Turnover
総資産回転率(Times) 0.89 0.79 0.86 0.93 0.94 1.00 0.97 0.97 0.92 0.91
Note:Total Assets Turnover=Sales/Total Assets
注)総資産回転率=売上高/総資産 (平均法)
12. Total Assets Turnover
総資産回転率

June 26, 2018
© Yokogawa Electric Corporation
15
(Times)(Million Yen)
0
1
2
3
4
5
6
7
8
0
10,000
20,000
30,000
40,000
50,000
60,000
70,000
FY08 FY09 FY10 FY11 FY12 FY13 FY14 FY15 FY16 FY17
Inventory 棚卸資産 Inventory Turnover 棚卸資産回転率
FY08 FY09 FY10 FY11 FY12 FY13 FY14 FY15 FY16 FY17
Cost of Sales
売上原価(Million Yen) 253,005 214,474 215,130 195,430 206,644 229,256 236,578 236,943 222,322 231,262
Inventory
棚卸資産(Million Yen) 44,706 34,683 35,472 35,357 34,796 34,443 33,258 33,718 30,729 32,254
Inventory Turnover
棚卸資産回転率 (Times)5.66 6.18 6.06 5.53 5.94 6.66 7.11 7.03 7.23 7.17
Note:Inventory Turnover=Cost of Sales/Inventory '注:棚卸資産回転率=売上原価/棚卸資産
*Note;Changes in the treatment of R&D expenditureThe start of FY11, part of the R&D expenditures that had been considered manufacturing costs are now recognized as selling, general and administrative expenses. *注)研究開発費の取り扱いの変更FY11から製造費用として計上していた研究開発費の一部を一般管理費として計上しています
13. Inventory Turnover
棚卸資産回転率

June 26, 2018
© Yokogawa Electric Corporation
16
(%)(Million Yen)
-20
-10
0
10
20
-40,000
-20,000
0
20,000
40,000
FY08 FY09 FY10 FY11 FY12 FY13 FY14 FY15 FY16 FY17
Profit Attributable to Owners of Parent 親会社株主に帰属する当期純利益
Return on Shareholders' Equity 自己資本利益率
Return on Assets 総資産利益率
FY08 FY09 FY10 FY11 FY12 FY13 FY14 FY15 FY16 FY17
Profit Attributable to Owners of
Parent
親会社株主に帰属する当期純利益
(Million Yen) -38,446 -14,799 -6,692 5,952 14,688 12,341 17,223 30,161 25,759 21,449
Shareholders' Equity
自己資本(Million Yen) 167,224 153,362 141,702 145,691 168,389 187,255 215,543 240,444 256,407 271,876
Return on Equity
自己資本利益率(%) -19.8 -9.2 -4.5 4.1 9.4 6.9 8.6 13.2 10.4 8.1
Total Assets
総資産(Million Yen) 400,959 398,792 361,233 359,500 379,931 398,920 439,957 412,772 440,498 448,809
Return on Assets
総資産利益率(%) -9.1 -3.7 -1.8 1.7 4.0 3.1 4.1 7.1 6.0 4.8
14. Return on Equity and Return on Assets
自己資本利益率、総資産利益率
June 26, 2018
© Yokogawa Electric Corporation
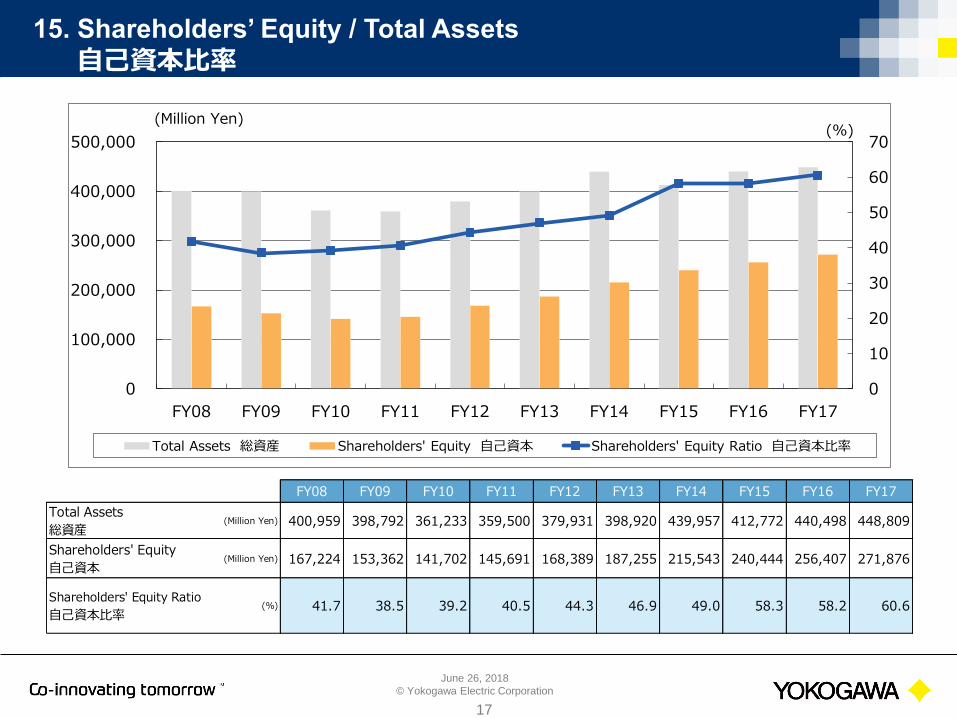
17
(Million Yen)(%)
0
10
20
30
40
50
60
70
0
100,000
200,000
300,000
400,000
500,000
FY08 FY09 FY10 FY11 FY12 FY13 FY14 FY15 FY16 FY17
Total Assets 総資産 Shareholders' Equity 自己資本 Shareholders' Equity Ratio 自己資本比率
FY08 FY09 FY10 FY11 FY12 FY13 FY14 FY15 FY16 FY17
Total Assets
総資産(Million Yen) 400,959 398,792 361,233 359,500 379,931 398,920 439,957 412,772 440,498 448,809
Shareholders' Equity
自己資本(Million Yen) 167,224 153,362 141,702 145,691 168,389 187,255 215,543 240,444 256,407 271,876
Shareholders' Equity Ratio
自己資本比率(%) 41.7 38.5 39.2 40.5 44.3 46.9 49.0 58.3 58.2 60.6
15. Shareholders’ Equity / Total Assets
自己資本比率
June 26, 2018
© Yokogawa Electric Corporation
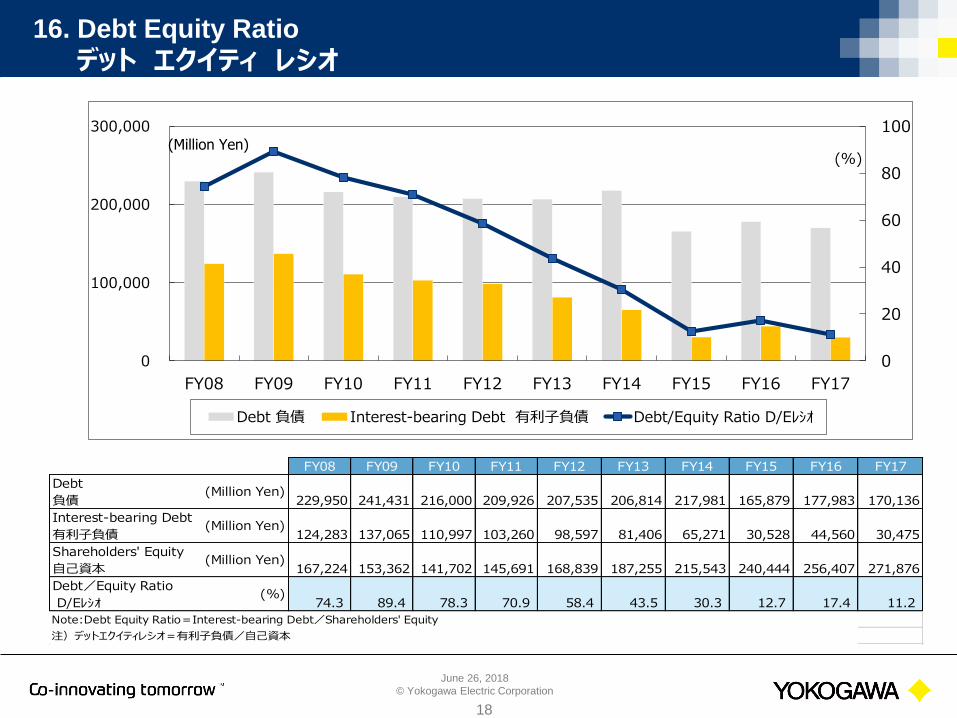
18
(Million Yen)(%)
0
20
40
60
80
100
0
100,000
200,000
300,000
FY08 FY09 FY10 FY11 FY12 FY13 FY14 FY15 FY16 FY17
Debt 負債 Interest-bearing Debt 有利子負債 Debt/Equity Ratio D/Eレシオ
FY08 FY09 FY10 FY11 FY12 FY13 FY14 FY15 FY16 FY17
Debt
負債(Million Yen)
229,950 241,431 216,000 209,926 207,535 206,814 217,981 165,879 177,983 170,136
Interest-bearing Debt
有利子負債(Million Yen)
124,283 137,065 110,997 103,260 98,597 81,406 65,271 30,528 44,560 30,475
Shareholders' Equity
自己資本(Million Yen)
167,224 153,362 141,702 145,691 168,839 187,255 215,543 240,444 256,407 271,876
Debt/Equity Ratio
D/Eレシオ(%)
74.3 89.4 78.3 70.9 58.4 43.5 30.3 12.7 17.4 11.2
Note:Debt Equity Ratio=Interest-bearing Debt/Shareholders' Equity
注)デットエクイティレシオ=有利子負債/自己資本
16. Debt Equity Ratio
デット エクイティ レシオ

June 26, 2018
© Yokogawa Electric Corporation
19
17. Aggregate Market Value and Price Book-value Ratio時価総額、株価純資産倍率
(Million Yen) (Times)
0.0
0.5
1.0
1.5
2.0
2.5
3.0
0
100,000
200,000
300,000
400,000
500,000
600,000
FY08 FY09 FY10 FY11 FY12 FY13 FY14 FY15 FY16 FY17
Aggregate Market Value 時価総額 Price Book-value Ratio 株価純資産倍率
FY08 FY09 FY10 FY11 FY12 FY13 FY14 FY15 FY16 FY17
Aggregate Market Value
時価総額(Million Yen) 105,838 218,660 170,308 224,839 254,119 447,797 347,869 312,410 470,630 590,437
Numbers of Shares
発行済み株数(Shares) 268,624,510 268,624,510 268,624,510 268,624,510 268,624,510 268,624,510 268,624,510 268,624,510 268,624,510 268,624,510
Stock Price at the End of the Term
期末株価(Yen) 394 814 634 837 946 1,667 1,295 1,163 1,752 2,198
Shareholders' Equity
自己資本(Million Yen) 167,224 153,362 141,703 145,691 168,389 187,255 215,543 240,444 256,407 271,876
Shareholders' Equity per Share
1株当たり純資産(Yen) 649 595 550 566 654 727 837 901 960 1,017
Price Book-value Ratio
株価純資産倍率(Times) 0.61 1.37 1.15 1.48 1.45 2.29 1.55 1.29 1.83 2.16

June 26, 2018
© Yokogawa Electric Corporation
20
18. Shareholders’ Equity per Share1株あたり純資産
(Yen)
400
600
800
1,000
1,200
FY08 FY09 FY10 FY11 FY12 FY13 FY14 FY15 FY16 FY17
Shareholders' Equity per share 一株当たり純資産
FY08 FY09 FY10 FY11 FY12 FY13 FY14 FY15 FY16 FY17
Shareholders' Equity per Share
1株当たり純資産(Yen) 649 595 550 566 654 727 837 901 960 1,017
Annual Change
前年比 (%) -24.3% -8.3% -7.5% 2.8% 15.6% 11.2% 15.1% 7.6% 6.5% 5.9%

June 26, 2018
© Yokogawa Electric Corporation
21
(Yen)
0
5
10
15
20
25
30
35
40
0
5
10
15
20
25
30
35
FY08 FY09 FY10 FY11 FY12 FY13 FY14 FY15 FY16 FY17
Dividend Per Share 一株当たり配当金 (Yen) Payout Ratio 配当性向(連結) (%)
(%)
FY02 FY08 FY09 FY10 FY11 FY12 FY13 FY14 FY15 FY16 FY17Dividend Per Share
一株当たり配当金(Yen) 16.0 2.0 0.0 5.0 10.0 12.0 12.0 25.0 25.0 30.0
Payout Ratio
配当性向(連結)(%) ー 0.3 ー 21.6 17.5 25.0 17.9 21.9 25.9 37.4
19. Dividend Per Share/Payout Ratio
1株当たり配当金、配当性向

June 26, 2018
© Yokogawa Electric Corporation
22
60
80
100
120
140
FY08 FY09 FY10 FY11 FY12 FY13 FY14 FY15 FY16 FY17
US dollar USドル
(Yen)
FY08 FY09 FY10 FY11 FY12 FY13 FY14 FY15 FY16 FY17
US dollar
US ドル(Yen) 100.66 92.61 85.13 78.82 83.33 100.67 110.58 119.99 108.95 110.70
Annual Change
前年比 (%) -11.5% -8.0% -8.1% -7.4% 5.7% 20.8% 9.8% 8.5% -9.2% 1.6%
20. Average Exchange Rate During the Period
期中平均為替レート

June 26, 2018
© Yokogawa Electric Corporation
23
(Million Yen)
-60,000
-40,000
-20,000
0
20,000
40,000
60,000
OperatingCF 営業活動によるキャッシュ・フロー InvestmentCF 投資活動によるキャッシュ・フロー FreeCF フリー・キャッシュ・フロー
FY17FY08 FY09 FY10 FY11 FY12 FY13 FY14 FY15
FY08 FY09 FY10 FY11 FY12 FY13 FY14 FY15 FY16 FY17
(Million Yen) 24,461 21,371 16,168 12,897 17,433 30,107 38,293 31,931 39,245 31,980
(Million Yen) -24,099 -13,178 -7,993 -7,841 -7,502 -13,884 -1,844 -10,894 -36,498 -6,648
(Million Yen) 362 8,193 8,175 5,056 9,931 16,223 36,449 21,037 2,747 25,332
Operating CF
営業活動によるキャッシュ・フロー
Investment CF
投資活動によるキャッシュ・フロー
Free CF
フリー・キャッシュ・フロー
FY16
21. Cash flow
キャッシュ・フロー

June 26, 2018
© Yokogawa Electric Corporation
24
0
5000
10000
15000
20000
25000
FY08 FY09 FY10 FY11 FY12 FY13 FY14 FY15 FY16 FY17
(People)
Aviation & Others 航機その他 Measurement 計測 Control 制御
FY08 FY09 FY10 FY11 FY12 FY13 FY14 FY15 FY16 FY17
Control (people) 15,960 15,995 16,159 16,672 17,188 17,669 17,593 16,724 16,751 16,771
制御 (%) 78.8% 81.7% 83.6% 85.8% 87.3% 89.1% 89.8% 89.7% 91.4% 91.7%
Measurement (people) 2,350 2,469 2,288 1,968 1,667 1,328 1,171 1,122 802 770
計測 (%) 11.6% 12.6% 11.8% 10.1% 8.5% 6.7% 6.0% 6.0% 4.4% 4.2%
Aviation & Others (people) 1,937 1,110 887 797 830 840 837 800 776 749
航機その他 (%) 9.6% 5.7% 4.6% 4.1% 4.2% 4.2% 4.3% 4.3% 4.2% 4.1%
Total (people) 20,247 19,574 19,334 19,437 19,685 19,837 19,601 18,646 18,329 18,290
22. People According Business Segmentation
部門別人員

June 26, 2018
© Yokogawa Electric Corporation
25
横河電機株式会社
財務・IR部 IR課Email : [email protected]
TEL : 0422-52-6845
URL : http://www.yokogawa.co.jp/cp/ir/index.htm
本資料には企業連結に係る暫定的な会計処理の確定に伴う過年度訴求修正を反映しておりません。(決算短信とは軽微な相違があります)


![Consolidated Financial Results for the Fiscal Year Ended ...Note: Comprehensive income Fiscal year ended March 31, 2019: ¥1,761 million [24.3%] Fiscal year ended March 31, 2018: ¥1,417](https://img.dokumen.tips/doc/110x75/5fe4d06806b4775830253106/consolidated-financial-results-for-the-fiscal-year-ended-note-comprehensive.jpg)